13 Model Serving
Purpose
Architecture stack focus for this chapter.
Why does serving change the optimization priorities that made training successful?
Training and serving pursue opposing operating objectives. Training maximizes aggregate throughput across large, scheduled batches and long runs, whereas serving must answer individual, heterogeneous requests under strict latency deadlines. Training amortizes hardware initialization and weight streaming across millions of examples; serving pays its full fixed cost on every query, and small inefficiencies accumulate into machine time that must be provisioned. A system handling one billion requests a day recovers more than eleven days of machine time every day from a single millisecond saved per request. Each request also runs inside a fixed end-to-end latency budget, in which network ingress, serialization, preprocessing, queueing, and postprocessing all spend time the model cannot use. When those stages consume most of the budget, kernel optimizations barely reach the user, and a prediction that arrives after the client has timed out has no value however accurate it is. Serving is therefore a capacity problem under uncontrolled traffic as much as a latency problem. Arrival rates swing between daily peaks and troughs, so capacity provisioned for the average collapses at the peak, while capacity provisioned for the peak sits idle and costly the rest of the day. The question a serving system answers is not whether the model computes correct outputs in isolation but whether it sustains reliable, low-latency execution under production variability. In D·A·M terms, serving is where the trained algorithm meets unpredictable live data inside the machine’s latency budget, and all three constraints bind on every request.
Learning Objectives
- Explain serving inversion from training throughput to per-request latency, headroom, and tail behavior
- Decompose request latency across serialization, preprocessing, inference, queuing, postprocessing, and network overhead
- Apply queueing laws and simple queue models to plan capacity and admission control against percentile latency targets
- Select batching windows and inference runtimes that trade formation delay and precision for throughput within a latency budget
- Diagnose cold-start delays from weight transfer, runtime initialization, graph compilation, and warmup during model loading
- Evaluate LLM serving bottlenecks using token latency, KV-cache memory, and continuous batching constraints
- Calculate cost per inference from precision, hardware utilization, replica count, and runtime throughput
13.1 The Serving Inversion
When a user uploads a photograph and waits for its label, or a chat interface sends a prompt and waits for the first word of the reply, each request carries a strict deadline of tens to hundreds of milliseconds. Every stage between the network socket and the response draws on that single allowance: decoding the payload, waiting in a queue, moving tensors to the accelerator, running the model, and formatting the answer. Moving from offline training to live traffic triggers the serving inversion, a reversal of engineering priorities: training is judged by how much work the machine completes per hour, whereas serving is judged by whether each individual request returns before its deadline.
The benchmarks of Benchmarking measured models under a load generator that decided when each request arrived. Production traffic has no such scheduler. Model serving must sustain the operating targets that benchmarking evaluated under specified conditions while live traffic tests that operating envelope continuously, so measurement remains part of the service’s lifecycle. In offline training, systems maximize aggregate throughput by packing large batches to amortize weight transfers from high-bandwidth memory (HBM) and saturate matrix arithmetic units. In online serving, requests arrive stochastically from independent clients and must return within strict service-level objectives (SLOs). The primary engineering priority therefore inverts from long-run throughput to per-request latency. The inversion restructures the balance of terms across both levels of the iron law of ML systems: shrinking a task from a large training batch to small batches or individual inputs (\(\BatchSize=1\)) slashes the Data factor (\(\text{Samples/Task}\) in equation 1.2) and inflates the Machine factor (\(\text{Seconds/FLOP}\)) across the unpacked terms of equation 1.3 (\(\Time = \frac{\DataVolume}{\Bandwidth} + \frac{\Operations}{\PeakRate \cdot \EfficiencyHw} + \Latency\)). For weight-dominated operations, small batches reduce arithmetic intensity and can shift execution from compute-bound matrix multiplications toward memory-bandwidth-bound transfers (\(\DataVolume/\Bandwidth\)). Simultaneously, the latency term \(\Latency\) expands beyond microsecond accelerator kernel launches to include network transit, request serialization, and host orchestration, often becoming the binding constraint on end-to-end response time.
↩︎ The multiplicative, additive, and pipelined formulations of the iron law of ML systems are established in Iron Law of ML Systems.
The inversion reshapes each D·A·M layer at once. In the data layer, the constraint shifts from total dataset volume to the arrival rate, payload freshness, and variable sequence dimensions of live queries, while in the algorithm layer execution becomes strictly forward-only: backpropagation state and optimizer memory vanish from the accelerator, even as dynamic input shapes introduce runtime execution variability into previously static operator graphs. In the machine layer, the operating target shifts from maximum hardware utilization to headroom. Whereas offline training treats an idle accelerator as wasted capital, online serving treats near-saturation as an operational hazard, because stochastic request arrivals make queue lengths and waiting times diverge nonlinearly as utilization approaches 100 percent. Maintaining adequate headroom preserves the spare capacity needed to absorb transient traffic spikes without violating tail-latency percentiles, so serving optimizes completed requests under a strict latency deadline rather than steady-state hardware occupancy.
Meeting that latency deadline governs how engineering teams partition the end-to-end serving stack. A request’s latency budget encompasses three sequential stages: host-side ingress and preprocessing (network termination, payload deserialization, and tokenization or feature transformation), accelerator kernel execution, and downstream postprocessing. Any millisecond consumed by unoptimized feature retrieval or queueing delays directly subtracts from the execution time allocated to the neural network itself. Consequently, the central engineering task in model serving is deciding which operations must remain on the synchronous request path, which tasks can be offloaded to asynchronous background pipelines, and how much headroom the system must reserve before tail-latency guarantees collapse under load. Three conditions therefore separate serving from the forward pass that a benchmark times: a per-request deadline, arrivals that no scheduler controls, and a stack in which the model is one stage among several.
Definition 13.1: Model serving
Model serving is the operational phase that provides model predictions to end-users or downstream systems under latency, throughput, availability, and cost constraints.
- Significance: Online serving turns training’s priority on sustained hardware efficiency (\(\EfficiencyHw\)) into a request-latency constraint (\(\EndToEndRequestLatency\)), requiring a stack designed around the percentile named by its SLO.
- Distinction: Unlike model training, which commonly processes scheduled batches, serving may handle stochastic online requests, synchronized streams, or offline batches.
- Common pitfall: A frequent misconception is that serving is “just the forward pass.” In reality, it is a systems problem: model execution is only one component of a stack that may include request routing, load balancing, and data transformation.
The SLO1 defines the latency target that shapes every architectural decision in the serving stack, establishing the strict time budget within which all request handling must complete. When an inference server receives a request, model execution represents only one segment of an end-to-end pipeline: network ingress, payload deserialization, feature transformation, queue scheduling, and output serialization all consume time before and after the accelerator runs. The end-to-end request lifecycle partitions execution into three sequential stages (figure 1): input preprocessing (traditional computing), neural network evaluation (deep learning), and output postprocessing with safety validation (traditional computing). Any of these stages can become the binding latency bottleneck. Section 13.3.1 quantifies where the time goes and finds that host preprocessing can take longer than the forward pass itself.
1 SLOs in ML serving: An SLO is the internal target, as distinct from the contractual SLA. For ML serving, task quality and inference latency can both contribute to SLOs, creating multidimensional targets where improving one dimension (for example, deploying a larger model for accuracy) can violate another (latency).
↩︎ SLOs, service level agreements (SLAs), and the tail-latency percentiles they constrain are established in Latency and tail latency.

Two services carry the chapter, one per half, and each lighthouse arrives in the regime it represents. The first half follows a ResNet-50 image-classification service on one accelerator node. ResNet-50 is the book’s compute-bound lighthouse. Each forward pass performs about 8.2 GFLOP of arithmetic on 102.4 MB of FP32 weights, so a large training batch keeps the matrix units busy. A served request arrives alone, however, and at batch one the same forward pass spends most of its time on weight traffic and kernel launches rather than arithmetic. Recovering the efficiency that training enjoyed without breaking the deadline is the first half’s problem, and the reference request profile introduced with the latency budget carries the service through queuing, batching, runtime selection, and replica startup. Large language model (LLM) serving then follows a GPT-2 XL chat service, the bandwidth-bound lighthouse whose decoding step Autoregressive decoding traced. Each generated token streams all 3 GB of its FP16 weights from memory, about 0.9 ms on the book’s reference H100, so memory bandwidth sets token latency and the memory each conversation holds sets concurrency. Llama 3 8B, a larger member of the same transformer family, extends that case where the per-conversation cache grows large enough to bound how many requests share the accelerator. DLRM, the capacity-bound lighthouse, appears once as a contrast in which embedding lookups rather than arithmetic dominate a request, and MobileNetV2 appears where the target device cannot hold ResNet-50 at all.
| Section | What it decides | Running case | Iron law term or resource it targets |
|---|---|---|---|
| Serving System Architecture | How a replica turns arriving requests into accelerator work | ResNet-50 service | Fixed overhead \(\Latency\) (protocol, serialization, copies) |
| Request Lifecycle | Where one request’s latency budget goes | ResNet-50 request; DLRM contrast | Every term, stage by stage |
| Queuing Theory | How much headroom many concurrent requests need | ResNet-50 capacity plan | Queueing delay added to \(\Latency\) |
| Throughput Optimization | How many requests share each weight read | ResNet-50 batching sweep | \(\DataVolume/\Bandwidth\) and \(\Latency\) per request |
| Inference Runtime Selection | Which engine and number format execute a batch | ResNet-50 runtimes and precisions | Hardware efficiency \(\EfficiencyHw\) and bytes \(\DataVolume\) |
| Node-Level Optimization | What stalls the path between network socket and accelerator | ResNet-50 node profile | Host-side \(\Latency\) |
| Model Loading and Versioning | How fast a new replica serves, and whether it computes what training computed | ResNet-50 cold start and preprocessing skew | Startup time and prediction accuracy |
| LLM Serving | How token streams share memory bandwidth and capacity | GPT-2 XL decode; Llama 3 8B cache | \(\DataVolume/\Bandwidth\) per token; memory capacity |
| Economics and Planning | How many accelerators, at what cost per completed request | ResNet-50 fleet; Llama 3 8B tokens | Cost per request that meets the SLO |
The architecture section (table 1) examines the inference server that sits between the network and the accelerator. The request lifecycle then traces one ResNet-50 request through that server and finds that the model is one slice of its latency budget. Queuing theory lets many requests arrive at once and derives the headroom that keeps their tail latency bounded, and throughput optimization raises each replica’s service rate by batching, where the chapter’s first half ends. The second half changes what each replica runs and how it starts: runtime and precision selection decide how fast a batch executes, node-level optimization removes the stalls between host and accelerator, and model loading decides how quickly a new replica can serve and whether it computes what training computed. LLM serving then replaces fixed outputs with token streams, and economics and planning converts the whole stack into accelerator count and cost per request. Two placement decisions precede all of these: the first is temporal, whether predictions are computed ahead of time or on demand, and the second is spatial, where the model physically runs.
13.1.1 Static vs. dynamic inference
A nightly job that precomputes product recommendations for existing users can pack thousands of items into each accelerator batch, whereas a live content-moderation API must score an uploaded image within milliseconds of arrival. Deciding whether to generate predictions before or during a user request sets the trade-off between offline hardware efficiency and online responsiveness (Google 2024): it determines whether an accelerator runs in an unconstrained throughput regime or under the strict tail-latency deadlines of an interactive serving loop.
Google. 2024. Static Vs. Dynamic Inference. Google Machine Learning Crash Course.
Static inference
Static inference (also called offline or batch inference) precomputes predictions for anticipated inputs and stores them in a retrieval store. Moving model execution entirely out of the user request path alters the underlying hardware constraints. Because batch jobs have no millisecond-level deadlines, accelerators can use large batches (\(\BatchSize\gg 1\)) selected for throughput within memory limits. Reusing weights across samples raises arithmetic intensity for weight-dominated operations; a batch-size sweep identifies where throughput stops improving. When a client issues a request (for example, a user opening nightly generated recommendation rankings), the serving system performs a low-latency key-value lookup rather than executing a forward pass on an accelerator. The primary operational constraint shifts from accelerator latency to storage capacity and data freshness. Precomputing predictions across an entire input domain scales combinatorially (\(\mathcal{O}(\RecommenderUserCount\times \RecommenderItemCount)\) for \(\RecommenderUserCount\) users and \(\RecommenderItemCount\) items in recommendation systems), and stale predictions persist until the next batch refresh.
Dynamic inference
Dynamic inference (also called online or real-time inference) evaluates inputs on demand as requests arrive. On-demand execution accommodates arbitrary, previously unseen inputs within the model schema and immediately reflects newly deployed model weights without requiring precomputation. However, executing the model directly within the user request path subjects inference to the strict end-to-end latency budget set by its SLO. Because user requests arrive stochastically, the serving runtime cannot delay execution indefinitely to accumulate large batches. Serving requests individually or in small batches (\(\BatchSize=1\) to \(\BatchSize=4\)) can expose weight traffic or launch overhead that larger batches amortize. When these costs bind execution, the device completes fewer queries per unit time, increasing provisioned cost per query. This tension between interactive response time and hardware efficiency can make dynamic serving more expensive per query than offline batching (example 13.1).
Example 13.1: The cost of latency
Latency constraints directly dictate infrastructure costs. The figures below come from the ResNet-50 reference profile that section 13.5.1 later sweeps across batch sizes. Consider a GPU server renting for $4/hour.
Scenario A (low latency): Batch size 1.
- Latency: 3.5 ms.
- Throughput: 283 req/s.
- Cost per million queries: $3.92.
Scenario B (high throughput): Batch size 8.
- Latency: 3.8 ms, barely above batch one, because the fixed launch cost dominates both.
- Throughput: 2,129 req/s.
- Cost per million queries: $0.52.
Systems insight: Serving one image at a time saves only the difference between 3.8 ms and 3.5 ms of latency, yet multiplies the hardware cost per million queries by 8×. Engineers must quantify whether that speedup generates enough business value to justify the 8× cost increase.
Consider two contrasting deployment scenarios for a ResNet-50 image classifier. A static batch approach suits a photo management application that preclassifies every image in a user library overnight. Classifying 10,000 photos one at a time, at 3.5 ms per batch-one forward pass on the reference H100, would take 35 s; at the 89,500 images/s that MLPerf Inference (Reddi et al. 2019) measured for a compiled INT8 engine at large batch on the same accelerator, the same library takes 0.11 s, about 320× faster, and clients experience instantaneous retrieval upon browsing. Conversely, a dynamic online approach suits a content moderation service that must evaluate user-uploaded media in real time, where each image traverses the complete preprocessing, accelerator execution, and postprocessing pipeline within a 100 ms service-level objective.
These two modes optimize for fundamentally different operating regimes. Static inference maximizes accelerator utilization and amortizes memory transfers across large, offline batches, trading persistent storage capacity for zero serving latency at query time. Dynamic inference minimizes tail latency under stochastic, concurrent traffic, accepting lower compute efficiency and higher marginal cost per query to evaluate arbitrary, unpredictable inputs. Production architectures frequently synthesize both paradigms into a tiered design, in which static precomputation populates key-value caches with predictions for high-frequency queries, such as catalog items or viral media, while dynamic serving clusters evaluate the long tail of novel or personalized requests. Deciding when predictions are computed resolves only the temporal dimension of serving, however; equally binding is the spatial dimension, where the model physically executes, because physical placement dictates memory hierarchy limits, network boundaries, and the hardware budget available to the serving stack.
13.1.2 The spectrum of serving architectures
A cloud server can pool accelerators behind an HTTP endpoint at the cost of a network round trip and multi-second cold starts, whereas a hearing aid or industrial sensor microcontroller cannot afford a network hop or an operating system at all. Although “serving” often implies a networked server processing API requests, the four deployment paradigms (Cloud, Edge, Mobile, and TinyML) and the physical constraints that give rise to them—the light barrier, the power wall, and the memory wall—shape the serving stack into very different forms. Serving spans a continuum from centralized networked microservices (which pool accelerators to optimize throughput and cost per query at the expense of network round-trip overhead and cold-start latency) to application-embedded edge serving (which run models inside client processes via direct function calls, eliminating network latency and preserving privacy at the expense of strict device memory and power limits) and out to bare-metal firmware execution on microcontrollers. Those hardware limits do not disappear at serving time; serving adds latency SLOs and cost pressure on top of limits that training could absorb through patience. The same model may therefore require different serving strategies depending on where it runs.
↩︎ The light barrier, power wall, and memory wall that give rise to the four deployment paradigms are established in Physical Constraints on Deployment.
The three architectures differ in what binds. Networked serving runs the model as a standalone service behind HTTP or gRPC, so network transfer and serialization join model execution as candidate bottlenecks; data-center accelerators support batching and concurrency, but a new replica’s cold start can stretch from seconds to minutes because container startup, model loading, and warmup sit outside the steady-state request path. Application-embedded serving runs the model inside the user’s application process on a phone or embedded board, behind a function call rather than a network interface. With no shared server to batch for, optimization targets energy and responsiveness (the shape that benchmarking calls SingleStream), and a passively cooled envelope of a few watts throttles sustained inference once the chassis heats. Bare-metal serving compiles the model into microcontroller firmware, often without an operating system or a dynamic allocator, so weights execute in place from flash memory, activations fit a preallocated tensor arena of a few hundred kilobytes of SRAM, and batching is impossible on a single sensor stream.
↩︎ The MLPerf SingleStream, MultiStream, Server, and Offline scenarios are established in MLPerf execution scenarios.
Embedded execution enables zero-copy inference. When data moves through a system, each copy consumes CPU cycles and memory bandwidth. In cloud serving, separate physical memory spaces force repeated transfers. A camera frame passes from a network socket buffer to user space, through a preprocessing buffer into page-locked host DRAM, and across PCIe into accelerator memory. A mobile pipeline can eliminate these intermediate copies when its camera, image signal processor (ISP), CPU, and NPU exchange shared buffer descriptors in unified system memory. In unified-memory system-on-chip (SoC) architectures, such as Apple A- and M-series processors or Qualcomm Snapdragon, all compute engines share a single physical DRAM pool. When software passes buffer handles rather than duplicating bytes, inference latency drops and memory bus power decreases, although format conversions may still require CPU or ISP intervention.
The deployment tiers differ first in their operating envelopes (latency targets, memory, and power), which Physical Constraints on Deployment derived and tabulated for each paradigm; what serving adds is the model each tier can actually run. Applying those envelopes to one image-classification workload, table 2 shows why cloud and mobile can adapt ResNet-50 while TinyML must substitute MobileNetV2. The cloud column runs the model through TensorRT, NVIDIA’s ahead-of-time inference compiler,2 and the mobile column through the TensorFlow Lite runtime; the chapter uses these engines as given until section 13.6 examines what such runtimes do to a model.
2 TensorRT: TensorRT builds its engine ahead of time for one microarchitecture (such as Hopper or Blackwell) (NVIDIA 2024a). That target-specific build phase allows the compiler to generate fused kernels, select microarchitecture-specific Tensor Core execution paths, and optimize memory layouts (such as NC/32HW32). The resulting nonportable engine reduces per-request execution latency and minimizes the accelerator count needed to satisfy a target throughput.
NVIDIA. 2024a. NVIDIA TensorRT: Programmable Inference Accelerator.
| Dimension | Cloud | Mobile | TinyML |
|---|---|---|---|
| Model format | TensorRT FP16 engine (51.2 MB) | TensorFlow Lite INT8 (25.6 MB) | Not feasible (25.6 MB); alternative: MobileNetV2 INT8 (3.5 MB) |
| Inference (batch-1) | 0.33 ms (batch-16: 0.83 ms) | 12 ms (NPU), 45 ms (CPU) | 120 ms |
| Throughput | 30,400 img/s (batched) | ~80 img/s (single-stream) | ~8 img/s |
| Memory | 2 GB VRAM (batch-32) | 150 MB peak (shared with app) | 320 KB arena (fits in 512 KB SRAM) |
| Energy/inference | — | 0.8 mJ (NPU), 4.2 mJ (CPU) | 12 mJ |
Systems Perspective 13.1: ResNet-50 across the serving spectrum
Systems insight: It is tempting to read table 2 as one model deployed three ways. That reading is misleading: the cloud and mobile tiers share the ResNet-50 graph but use different precision and runtimes, while the TinyML tier cannot run ResNet-50 at all and substitutes an architecture designed for its constraints. Treating these as one model hides the work that makes each deployment possible.
Whichever tier hosts it, a networked deployment runs the model inside a server process, and each such replica must turn an irregular stream of requests into work its accelerator can execute efficiently. That conversion is the job of the inference server’s internal architecture.
Self-Check: Question
When transitioning a deep learning model from training to an online serving environment, how does the system constraint in the D·A·M (Data-Algorithm-Machine) taxonomy fundamentally shift regarding machine utilization and algorithm state?
- Machine utilization must be maximized at 100% to amortize capital costs, while the algorithm continues parameter backpropagation during request serving.
- Machine capacity must maintain operational headroom below saturation to prevent tail-latency queueing collapse, while the algorithm’s weights remain fixed for a deployed version.
- Machine allocation switches from accelerators to general-purpose CPUs exclusively, while the algorithm dynamically modifies its architecture per incoming user payload.
- Machine throughput replaces latency as the primary operational constraint, while data volume shifts from live request streams to historical offline batches.
True or False: In online model serving, the latency term (\(L_{\text{lat}}\)) in the iron law of ML systems must encompass external factors such as network round-trip time, request serialization, and system orchestration, rather than solely the accelerator kernel execution time.
Explain why achieving high average throughput during offline benchmarking does not guarantee that an online serving system will satisfy its tail-latency Service-Level Objective (SLO) during production traffic spikes.
An e-commerce platform evaluates precomputing product recommendations offline (static inference) versus computing them on demand when a user visits the homepage (dynamic inference). Which trade-off correctly characterizes static inference compared to dynamic inference?
- Static inference eliminates database storage costs but increases real-time p99 latency by executing large batched matrix multiplications during user page loads.
- Static inference guarantees real-time contextual adaptation to intra-session user clicks but requires dedicated high-end GPUs on the critical request path.
- Static inference trades storage capacity and potential prediction staleness for retrieval latency that avoids per-request model execution, whereas dynamic inference provides fresh predictions from live context at the expense of computational latency and variable serving capacity.
- Static inference requires running unbatched single-sample inferences across microcontrollers, whereas dynamic inference processes large offline shards across cloud clusters.
Why does bare-metal TinyML serving on microcontrollers (e.g., ARM Cortex-M) preclude the use of standard cloud serving frameworks (like Triton or vLLM), and what architectural adaptations are required?
13.2 Serving System Architecture
Inside each replica, user requests arrive in irregular bursts—milliseconds apart one moment and silent for seconds the next—whereas accelerator compute engines demand steady streams of uniform, dense batches to saturate memory bandwidth and arithmetic units. Reconciling these two incompatible rhythms at the system boundary requires a serving architecture that decouples network ingress from execution scheduling, absorbing arrival bursts and packing irregular inputs into dense batches without violating latency SLOs.
13.2.1 Internal architecture and request flow
If a web server invoked the accelerator synchronously every time a socket read completed, slow client uploads would stall the GPU and concurrent connections would contend for device memory. An inference server3 (such as NVIDIA Triton or TensorFlow Serving) avoids this by acting as a specialized runtime scheduler that manages concurrency, device memory, and data movement between host CPUs and accelerator devices. Rather than running the model directly on the network thread, the server pipelines incoming requests through dedicated subsystems that isolate client network handling from accelerator compute. Every request traverses a six-stage runtime pipeline (figure 2) from network ingress and request-buffering queues through the dynamic batcher to the inference runner and hardware accelerator.
3 Inference server: Google’s TensorFlow Serving (Olston et al. 2017) helped establish the separation of model logic from serving infrastructure; NVIDIA’s Triton (NVIDIA 2024b) extends this pattern across multiple model frameworks and backends. The critical design insight is that a scheduler and dynamic batcher turn irregular single-request traffic into accelerator-friendly execution, improving utilization when latency budgets allow batching. Exact utilization gains depend on model, hardware, arrival rate, and the configured batching window.
Olston, Christopher, Noah Fiedel, Kiril Gorovoy, Jeremiah Harmsen, Li Lao, Fangwei Li, Vinu Rajashekhar, Sukriti Ramesh, and Jordan Soyke. 2017. “TensorFlow-Serving: Flexible, High-Performance ML Serving.” CoRR abs/1712.06139. https://doi.org/10.48550/arXiv.1712.06139.
NVIDIA. 2024b. NVIDIA Triton Inference Server.
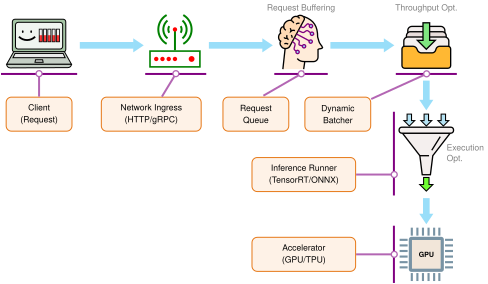
Across the stages in figure 2, the server handles concurrency management, request transformation, model lifecycle management, and execution scheduling. At network ingress, the server manages concurrency through asynchronous event loops (such as epoll or kqueue) and worker thread pools that handle thousands of concurrent client TCP connections without stalling accelerator execution pipelines. Decoupling network I/O from compute ensures that slow client transfers or network stalls do not starve the accelerator of ready work.
Once a payload arrives, the server transforms requests into tensors, decoding serialized network bytes into contiguous, aligned memory buffers that match the tensor layout required by the underlying execution engine. For example, four-dimensional vision tensors typically adopt NCHW4 or NHWC formats. On modern accelerators, matrix multiplication units (such as Tensor Cores) load 8- or 16-element channel vectors using coalesced memory transactions that favor channels-last (NHWC) layout. If the execution kernel requires a different physical layout, the server must materialize that layout. Calling torch.permute merely creates a view with reordered strides; an explicit memory copy or transpose kernel must physically reorder the data in memory. Because such materialization performs zero arithmetic (\(\ArithmeticIntensity\approx 0\) FLOP/byte), memory traffic and launch overhead dominate its cost. A device-local conversion consumes device memory bandwidth, whereas conversions across the host-device boundary consume PCIe bandwidth.
4 NCHW and NHWC (tensor memory layouts): These acronyms encode the dimension order of 4D image tensors: N (batch), C (channels), H (height), and W (width). In a contiguous NCHW tensor, each channel plane is contiguous; in NHWC, channels for one spatial position are adjacent. Optimized kernels may favor either layout, and a semantic mismatch can scramble values even when the element count is correct. Serving code should therefore make both dimension meaning and any physical-layout conversion explicit.
For those tensors to execute without startup stalls, the server also manages the model’s local lifecycle. The runtime establishes the CUDA context before allocating device memory (VRAM) and streaming weights onto the accelerator, pins host memory buffers for direct memory access (DMA) transfers, and executes representative warmup passes to trigger deferred compilation and memory allocation before admitting live client traffic. While enterprise model registries, canary rollouts, and rollback policies belong to cluster-level operations (ML Operations), the serving engine governs local state, validating that active model instances are warmed, resident in accelerator memory, and ready for dispatch.
Between request buffering and the warmed model sits the execution scheduler, which coordinates accelerator dispatch by implementing dynamic batching (section 13.5). For weight-dominated inference at batch size \(\BatchSize=1\), streaming parameters from HBM can limit execution before the arithmetic units reach peak throughput. Grouping \(\BatchSize\) requests into a concurrent batch amortizes the byte transfers of reading model weights across all \(\BatchSize\) inputs, increasing the arithmetic intensity (\(\ArithmeticIntensity= \Operations/\DataVolume\)).
To balance individual request latency against batch compute efficiency, the scheduler tunes queue residency using a batching window (or timeout threshold). Setting the batching window to zero removes deliberate batch formation delay, but requests can still wait for an available worker. An immediately dispatched small batch may also expose too little work to use the accelerator efficiently. Conversely, setting a bounded window (such as 2 to 5 ms) allows the scheduler to buffer arriving requests until either the queue reaches a target batch size or the timeout expires. The window bounds deliberate formation delay; waiting for a busy worker is a separate resource-queue delay. Batching trades that formation time for greater weight reuse and potentially higher service capacity, while total latency includes both waits and execution.
13.2.2 Interface protocols and serialization
As accelerator kernels undergo aggressive compilation (via TensorRT, TorchDynamo, or custom kernels), device execution time often drops below a single millisecond, and the host-side cost of ingesting, transporting, and deserializing payloads becomes the dominant term in end-to-end latency (the per-request overheads itemized in section 13.3.2.1). Two interface choices—the wire serialization format and the network transport protocol—determine whether that host ingress path stays in microseconds or consumes the latency budget before inference begins.
The serialization bottleneck
Machine learning payloads differ fundamentally from conventional web API payloads. They consist of multi-dimensional arrays of floating-point numbers (such as image tensors, dense embedding vectors, or token sequence logits). While text-based JSON is ubiquitous in web services, serializing dense numerical arrays into text incurs severe CPU and memory penalties. Serialization overhead manifests because JSON parsers must scan every byte sequentially, validate syntax, allocate heap nodes, and invoke string-to-float conversion routines (such as strtod). Each 32-bit float expands from 4 raw bytes into 7 to 15 ASCII characters including punctuation. Furthermore, raw binary data (such as compressed JPEG or raw image bytes) requires Base64 encoding to travel within JSON strings, imposing a 33 percent size inflation before parsing begins.
↩︎ Clipper’s decomposition of serving latency, in which serialization rivals model execution, is established in End-to-end vs. component latency.
5 Protocol Buffers (Protobuf): Protobuf uses a predefined schema (from a .proto file) to encode structured data into a compact binary format (Protocol Buffers Authors 2026). Because the schema carries field names and types, the wire payload need not repeat them as JSON does. Its wire format is still not identical to a C++ object’s in-memory layout, so it requires a parsing step and does not provide the same direct zero-copy access pattern that FlatBuffers targets.
Protocol Buffers Authors. 2026. Overview: Protocol Buffers.
6 FlatBuffers: The “flat” in the name describes the design: the binary buffer can serve as the serialized representation and the data structure being read, avoiding a separate parsing or unpacking phase for supported access patterns (FlatBuffers Authors 2026). For ML inference, this can enable zero-copy access to tensor metadata, because the serving system reads tensor shapes and offsets directly from the buffer rather than allocating a second object representation.
FlatBuffers Authors. 2026. FlatBuffers Documentation.
Binary serialization formats, such as Protocol Buffers5 and FlatBuffers,6 bypass this text conversion cost. Float arrays transmit directly as packed IEEE 754 byte streams with zero ASCII conversion and zero Base64 framing. Furthermore, FlatBuffers organizes serialized records with internal relative offsets, enabling zero-copy deserialization, in which the serving application reads tensor dimensions, data types, and byte offsets directly out of the network receive buffer without allocating an intermediate object graph on the heap.
REST vs. gRPC
Transport protocol selection governs connection life cycles and socket multiplexing. Conventional REST APIs typically deploy HTTP/1.1 with JSON payloads. HTTP/1.1 clients commonly use multiple persistent TCP connections for concurrency. Establishing each connection incurs handshake and, for HTTPS, TLS costs, but keep-alive reuse amortizes setup across requests. HTTP/1.1 also suffers from request-level head-of-line blocking, because responses on a single connection must return in request order. While REST APIs can adopt HTTP/2 or binary encodings, the combination of HTTP/1.1 and JSON creates significant socket overhead and CPU parsing contention when serving high-throughput tensor workloads.
In contrast, gRPC (gRPC Remote Procedure Call)7 pairs HTTP/2 transport with Protocol Buffers serialization. HTTP/2 establishes a single long-lived TCP connection and multiplexes hundreds of concurrent request and response streams simultaneously using binary framing. This architecture multiplexes concurrent streams over a persistent connection and removes HTTP-level response-order blocking (a lost TCP packet can still stall every stream on the connection, which HTTP/3 addresses by moving to QUIC), while Protobuf enforces strongly typed contracts and serializes binary tensor payloads efficiently. Consequently, gRPC is the standard protocol for internal microservice communication in model serving clusters, where low latency, compact wire payloads, and bidirectional token streaming are primary design criteria. Even a modest embedding payload shows the gap in wire footprint and host parsing time.
7 gRPC (gRPC remote procedure call): The gRPC framework pairs HTTP/2 transport with an interface definition language and message format, most commonly Protocol Buffers (gRPC Authors 2026). The size and latency benefit over REST/JSON depends on payload shape, client/server implementation, and whether serialization is a meaningful share of the end-to-end latency budget.
gRPC Authors. 2026. Introduction to gRPC.
Napkin Math 13.1: JSON vs. Protobuf serialization
Consider a request payload containing 1,000 floating point numbers (for example, an embedding vector).
- JSON: Uses ~9 KB on the wire. Requires ~50 μs to parse.
- Protobuf: Uses ~4 KB on the wire. Requires ~5 μs to parse.
Math: Switching one request to the binary payload saves 50 μs − 5 μs = 45 μs of parse time. For this illustrative system processing 10,000 requests per second, the savings compound to 10,000 \(\times\) 45 μs = 0.45 s of CPU time reclaimed every wall-clock second, which is 45 percent of one core freed from serialization overhead alone.
Systems insight: This 10× scenario gain makes gRPC/Protobuf, FlatBuffers, or another binary protocol a strong candidate for high-throughput internal microservices when serialization is a visible part of the latency budget.
Architectural selection is governed by system constraints. REST over HTTP/1.1 remains practical for public-facing edge gateways where broad client compatibility and human-readable debugging take precedence over raw wire efficiency. Within cluster boundaries, gRPC over HTTP/2 with binary serialization can reduce overhead when high query volume or tensor serialization consumes a significant share of the host CPU budget; its streaming support also suits incremental token responses.
13.2.3 The load balancer layer
When traffic exceeds what a single machine can handle, adding model replicas does not prevent tail-latency spikes if requests still land on a replica that is mid-batch or still loading weights into GPU memory. Cloud and data center deployments therefore place a load balancer between clients and model servers to route around busy or unready replicas. A serving load balancer protects the fleet by coupling request distribution with readiness checks and traffic shifting. It routes incoming requests across replicas using policies such as round-robin or least-connections so that traffic steers around slow or saturated workers before queues build, and it backs that routing with health monitoring that inspects both process liveness and model initialization state—confirming that weights are loaded and warmup passes are complete before a replica receives live queries. The same routing control also supports progressive rollouts, shifting traffic gradually between model versions rather than cutting over abruptly.
↪ Shadow, canary, and blue-green release strategies that build on this traffic shifting are developed in Model deployment.
On a single machine running several model instances, such as several Open Neural Network Exchange (ONNX) Runtime sessions, the serving framework and the operating system queue requests without a separate balancer; a dedicated balancer becomes necessary once replicas span machines, and its distribution algorithms belong to that distributed setting. This chapter therefore plans capacity one node at a time. The unit of capacity is the sustained model throughput of one node, and the queueing analysis in section 13.4 determines the utilization at which that node can no longer meet its latency target and a second replica must be added behind the balancer. Protocol selection, process architecture, and the balancer in front of the replicas establish the structural skeleton of a serving deployment; evaluating actual operational performance requires tracing how latency accumulates as one request traverses each stage of a replica’s runtime pipeline.
Self-Check: Question
- Order the sequential stages of a request passing through a high-performance decoupled inference serving pipeline from initial arrival to client response:
- Hardware Accelerator Execution (tensor kernel execution on GPU/NPU)
- Dynamic Batcher (aggregating incoming items up to max batch size or timeout)
- Network Ingress & Gateway (TLS termination, authentication, protocol deserialization)
- Postprocessing & Response Dispatch (logit normalization, top-\(k\) filtering, response serialization)
- Request Queue (absorbing traffic bursts and buffering pending requests)
- Inference Runner / Engine (tensor memory management, CUDA stream scheduling)
In a microservices architecture where measurements show JSON serialization and parsing are a visible bottleneck in an internal fraud detection service processing \(10^5\) queries per second under a 5 ms SLA, why is gRPC with Protocol Buffers preferred over HTTP/1.1 with JSON?
- JSON text parsing is performed directly inside GPU Tensor Cores, whereas Protocol Buffers require host CPU preprocessing.
- HTTP/1.1 provides automatic iteration-level continuous batching, whereas gRPC only supports static batching.
- Protocol Buffers eliminate the need for schema definitions, enabling zero-copy dynamic typing across heterogeneous languages.
- Protocol Buffers use compact binary encoding with pre-compiled schema parsers that can reduce CPU serialization overhead, and gRPC multiplexes requests over persistent HTTP/2 connections.
What is the ‘serialization bottleneck’ in model serving, and under what operational conditions (model size, request payload, query rate) does it become the dominant factor in the end-to-end latency budget?
True or False: Replacing HTTP/1.1 REST endpoints with gRPC automatically accelerates the GPU kernel execution time of deep learning models by \(2\times\) to \(4\times\).
In an inference server architecture, what is the primary role of decoupling the request queue from the dynamic batcher?
- It allows the server to permanently cache all intermediate GPU activations across independent client requests.
- It allows the system to buffer irregular arrivals and present the batcher with pending work so it can form batches within a timeout budget.
- It eliminates the need for GPU kernel compilation by converting dynamic input shapes into fixed static tensors in the queue.
- It bypasses host RAM by streaming network packets directly from the NIC into the accelerator’s L2 cache via PCIe peer-to-peer transfers.
A high-throughput model serving cluster sits behind a Layer 7 load balancer. Which routing approach is most appropriate for reducing p99 tail latency when inference times vary significantly across requests due to variable input sequence lengths?
- A load-aware policy such as least-connections or least-loaded routing, which steers new requests away from replicas that already appear busy or backlogged.
- Static round-robin routing, which deterministically rotates incoming connections across all healthy replicas regardless of current queue depths.
- Random routing with hash-based sticky IP assignment, which pins client IP addresses permanently to specific backends without monitoring load.
- Maximum-throughput greedy allocation, which concentrates all incoming traffic onto a single primary replica until its memory is completely saturated before spilling over.
13.3 Request Lifecycle
A single HTTP request carrying a \(224{\times}224\) JPEG image arrives at an inference server. Between the moment the first byte enters the network stack and the moment the classification payload departs, the request traverses a sequence of pipeline stages, grouped below into preprocessing, inference, and postprocessing, with data transfer between them. Each stage consumes a slice of the end-to-end latency budget, making granular phase decomposition essential for targeted performance tuning.
13.3.1 The latency budget
A serving system that completes thousands of inferences per second still fails its users if individual requests take two seconds to return and miss their interactive deadlines. For dynamic inference systems, the serving inversion established in section 13.1 therefore imposes a strict latency budget that shapes system design (Gujarati et al. 2020).
8 Tail latency: Unlike averages, percentile latencies reveal the performance impact of system outliers common in ML serving, such as model cache misses or garbage collection pauses. These rare, high-latency requests can disproportionately harm user satisfaction and business outcomes. Because the magnitude is workload-specific, services validate percentile targets (p95, p99) against their own users and SLOs.
Relevant metrics expand from aggregate throughput and mean latency to the latency distribution. Mean and p50 describe the center, while p95 and p99 expose the slow tail. If mean latency is 50 ms but p99 is two seconds, the p99 threshold is 40× the mean, so about 1 percent of requests are at or beyond two seconds. Whether that tail matters depends on the service and its users, which is why percentile targets should come from the SLO rather than convention.8 Managing these percentile constraints requires decomposing the total allowed response time into a latency budget that allocates time across each processing phase, the serial accounting that the latency budget principle (12) states formally.
Definition 13.2: Latency budget
Latency budget is the time allocated to request stages under an end-to-end deadline; the SLO also specifies the required completion quantile.
- Significance: It acts as a zero-sum constraint system where any milliseconds consumed by serialization or network overhead directly reduce the latency budget (\(\EndToEndRequestLatency\)) available for model inference.
- Distinction: The budget allocates time across stages, while the latency SLO of Latency and tail latency couples the deadline (for example, \(<50\text{ ms}\)) with a completion quantile (\(\text{p99}\) or \(\text{p99.9}\)). A service-level indicator (SLI) is the measured quantity used to evaluate that objective. Tail latency spikes can stem from queueing, batch formation, cache state, interference, or data movement.
- Common pitfall: A frequent misconception is that the “model” has the entire budget. In the illustrative breakdown in table 3, the remainder is consumed by host preprocessing and data movement (JPEG decode, resize, normalization, and PCIe transfer), while upstream network and serialization overheads (table 5) consume further margin.

Inference is one slice of the latency budget; preprocessing rivals it.
Every serving request traverses three sequential phases that share this latency budget: preprocessing converts raw input such as image bytes or text strings into model-ready tensors, inference executes the model computation over those tensors, and postprocessing turns the resulting device outputs into user-facing responses. Accelerating model execution alone yields diminishing returns when host-side preprocessing and response formatting consume the majority of the latency budget, an immediate manifestation of Amdahl’s law. As hardware compilers compress accelerator kernel runtimes into sub-millisecond durations, host-device coordination and memory transfers emerge as the primary latency bottlenecks.
13.3.2 Stage-by-stage latency breakdown
An engineer who measures only total request duration in a vision service sees a single millisecond number that lumps together CPU-bound JPEG decompression, host-to-device PCIe transfers, accelerator kernel execution, and response formatting, making it easy to spend weeks optimizing GPU kernels that account for less than half of total response time. Timing each pipeline boundary independently isolates the actual bottleneck before optimization begins.
Example 13.2: ResNet-50: Latency budget breakdown
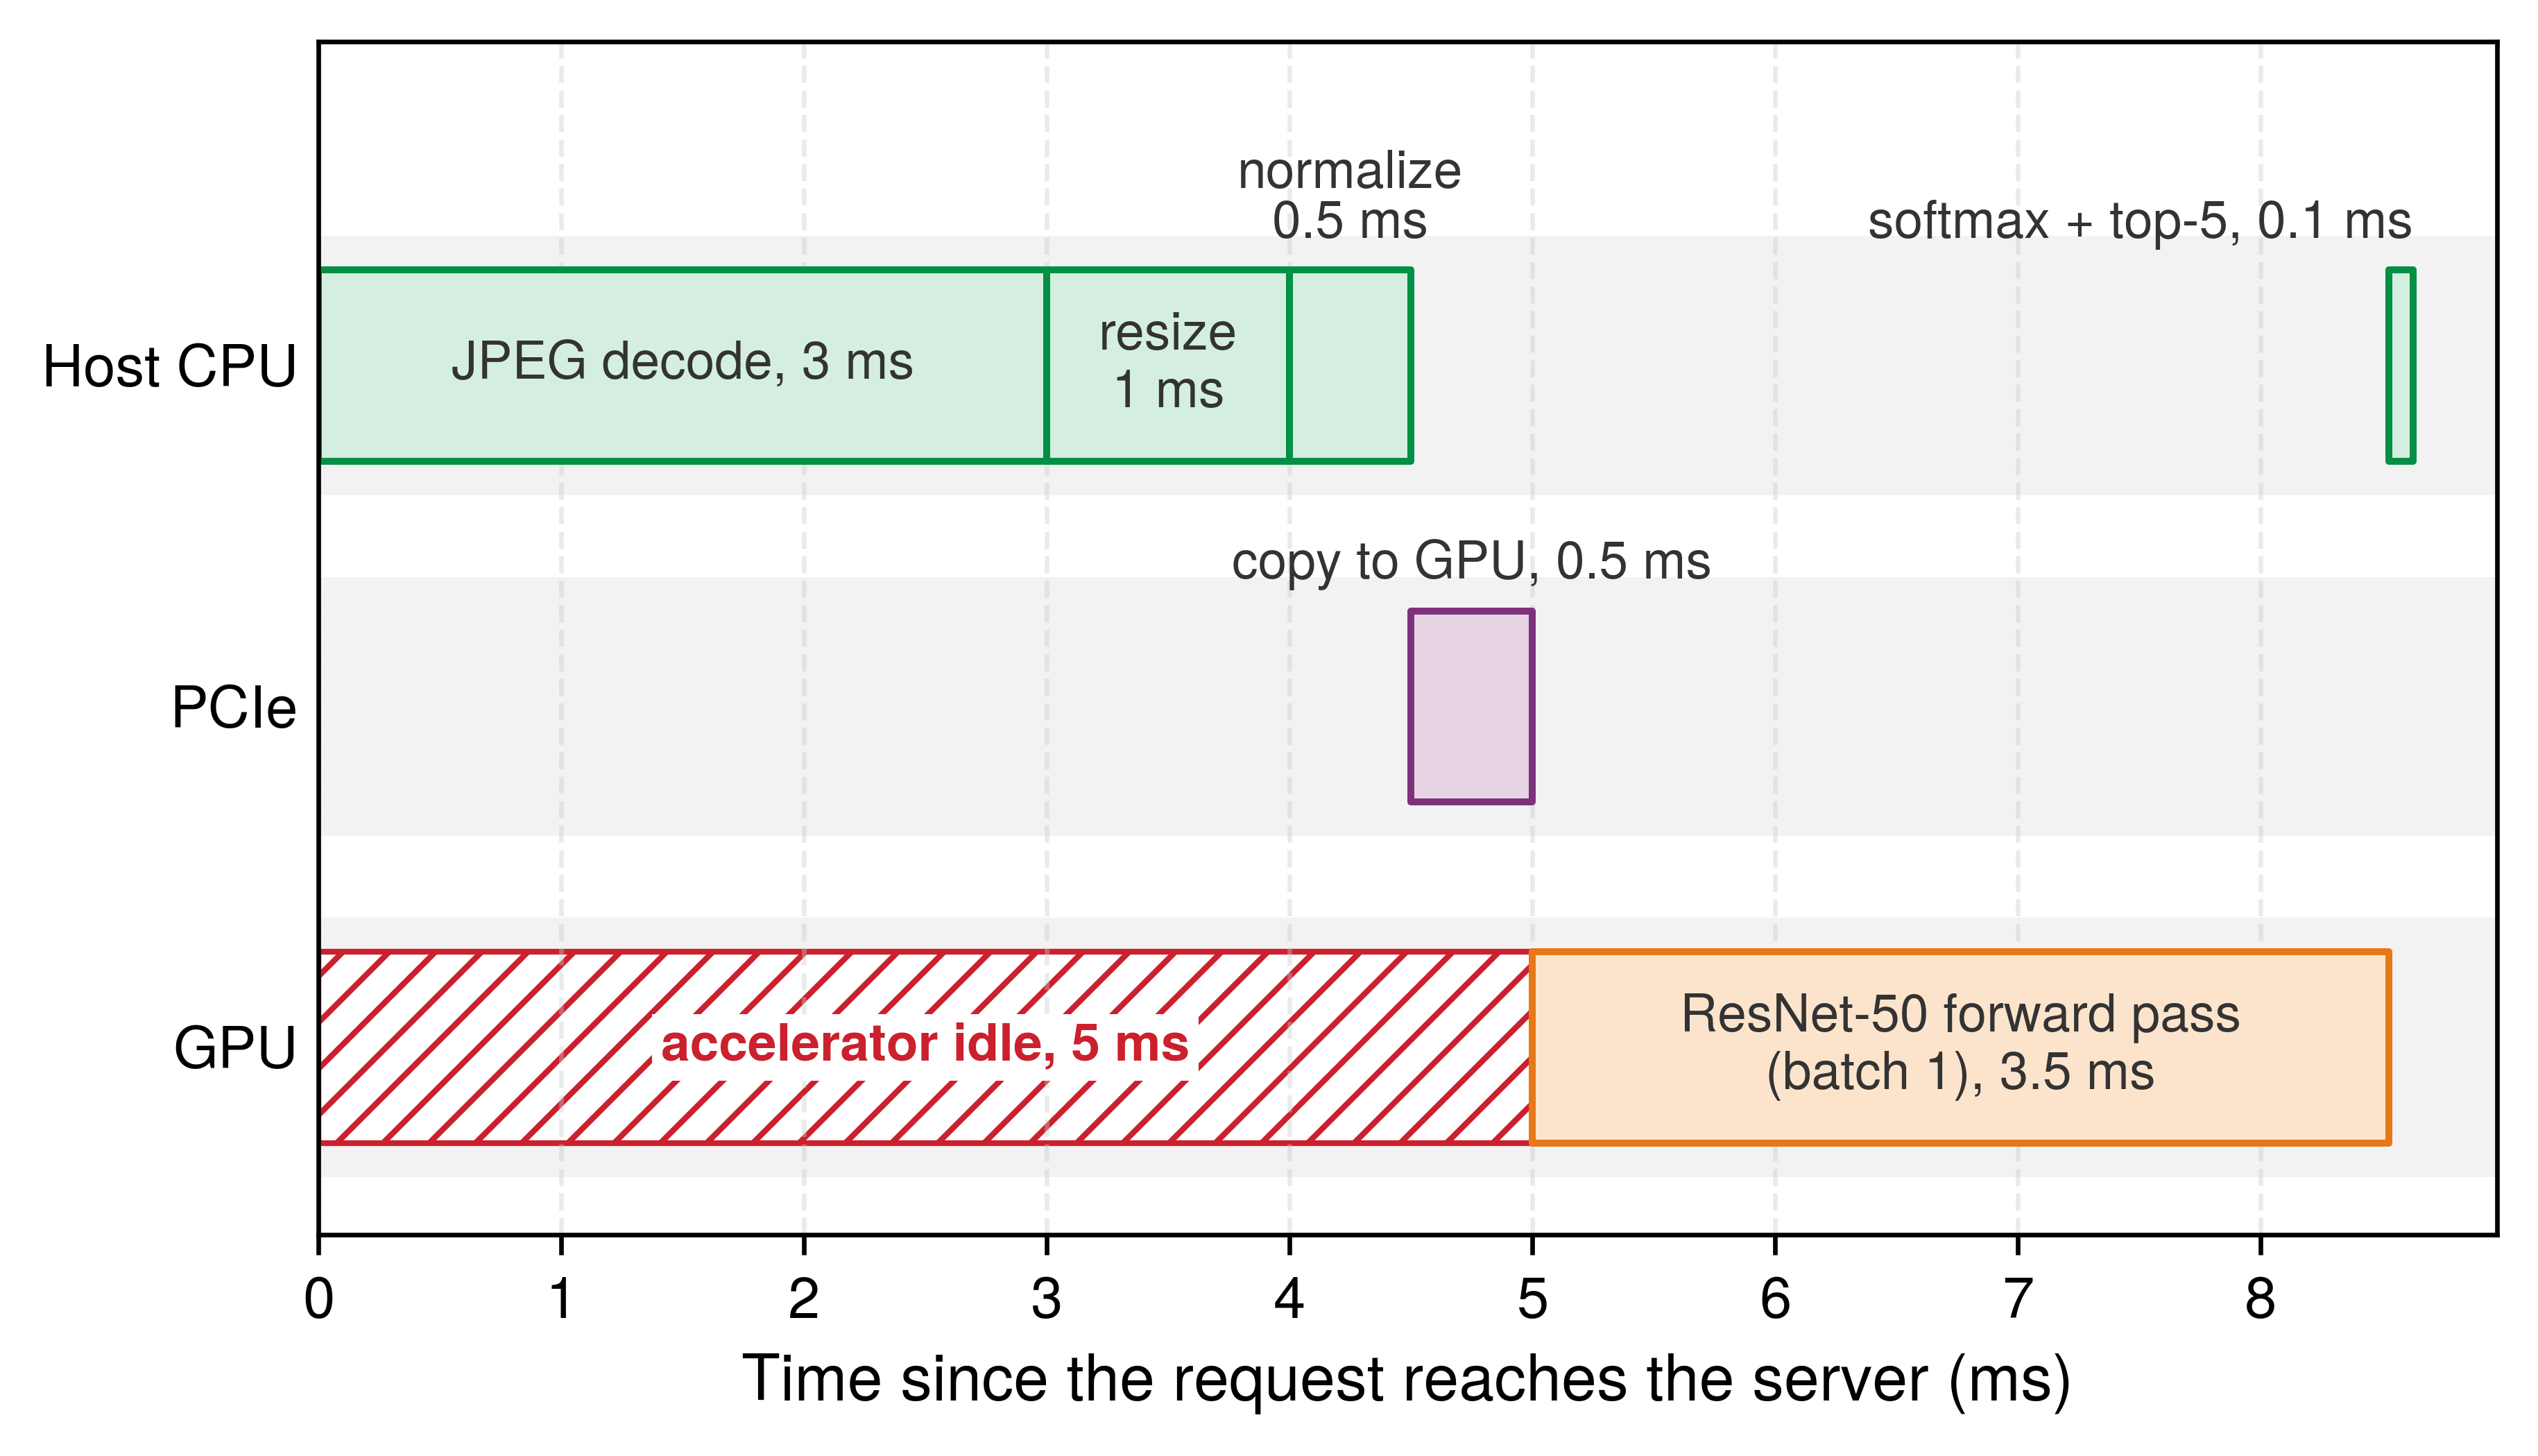
Table 3 details the per-phase latency breakdown for one ResNet-50 serving request on the reference H100, with the forward pass taken from the chapter’s modeled profile and the host phases as stated assumptions.
Table 3: ResNet-50 latency budget: Per-phase breakdown of a single serving request on the reference H100 (modeled forward pass, assumed host phases), showing that host preprocessing alone takes longer than the ResNet-50 forward pass. The percentages expose where engineering effort pays off in this scenario. Per-phase percentages are rounded to the nearest whole number and may not sum to exactly 100.
| Phase | Operation | Time | Percentage |
|---|---|---|---|
| Preprocessing | JPEG decode | 3 ms | 35% |
| Preprocessing | Resize to \(224{\times}224\) | 1 ms | 12% |
| Preprocessing | Normalize (mean/std) | 0.5 ms | 6% |
| Data Transfer | CPU→GPU copy | 0.5 ms | 6% |
| Inference | ResNet-50 forward pass | 3.5 ms | 41% |
| Postprocessing | Softmax + top-5 | 0.1 ms | ~1% |
| Total | 8.6 ms | 100% |
Systems insight: In this ResNet-50 serving budget, preprocessing consumes 52 percent of latency even though the forward pass performs nearly all of the arithmetic. If a compiled TensorRT engine reduces the forward pass to the modeled 0.33 ms, preprocessing would dominate at 83 percent.
Laid on the node’s hardware, the same budget occupies three resources in turn, and the accelerator is busy for less than half of the request (figure 3). While a host CPU core decompresses the JPEG, resizes the image, and normalizes pixel values before copying the tensor across PCIe, the GPU waits completely idle for work to arrive.
The 3.5 ms batch-one forward pass in table 3 is the chapter’s reference profile for ResNet-50: an eager framework running FP16 on the reference H100, modeled from the iron law’s terms rather than measured, and the later ResNet-50 examples derive from it. The framework issues 174 kernels, one per operation, and each pays 10 μs of Python dispatch and 5 μs of driver launch, the per-operation costs of Dispatch overhead in eager execution. Each kernel also occupies the accelerator for at least an assumed 5 μs, and the arithmetic itself, at the 25 percent of peak that ResNet-50 sustains in Data pipeline, takes about 33 μs per image. A compiled INT8 engine anchors the other end of the range: MLPerf Inference measured 89,500 images/s on one H100 at large batch (Reddi et al. 2019). The capacity plan in section 13.4.3 uses the reference profile as the service time, the batching sweep in section 13.5.1 starts from it at batch one, and the cold-start timeline in section 13.8.1 assumes its warm steady state. The runtime and precision comparisons in section 13.6 change one term of the same model at a time, so the effect of each change is visible.
In the ResNet-50 scenario, dense convolutional arithmetic dominates the model stage’s work. That does not make the stage compute bound at every batch size. At batch size one on the reference H100, issuing the kernels takes 2.6 ms, 74 percent of the forward pass, so the stage is overhead-bound and runs far below peak arithmetic throughput; batching amortizes that fixed cost and fills the machine (section 13.5.1). Changing the model architecture can move the dominant cost out of dense arithmetic entirely, and recommendation systems make this shift concrete.
Lighthouse 13.1: Lighthouse example: DLRM serving
Scenario: Serving DLRM with a 10 ms p99 latency budget.
Analysis: While ResNet-50’s model stage is dominated by convolutional neural network compute, DLRM’s dominant model-stage cost is embedding-table memory access. End-to-end serving bottlenecks still require measuring the full path: preprocessing, inference, postprocessing, and data movement. Table 4 breaks the recommendation request down by phase.
| Phase | Operation | Time | Bottleneck |
|---|---|---|---|
| Input Parsing | Request parsing | 0.5 ms | CPU |
| Embedding Lookup | Fetch 100+ dense vectors | 6 ms | memory bandwidth |
| Inference | MLP forward pass | 1.5 ms | Compute |
| Postprocessing | Ranking & Filtering | 1 ms | CPU |
| Total | 9 ms |
Systems insight: In DLRM, the “Inference” multilayer perceptron stage is only ~17 percent of the latency. The majority of time is spent in embedding lookups, retrieving 128-dimensional embedding vectors from tables that hold about 100 GB in the reference model and reach terabytes in production. This is a memory-bandwidth and capacity-bound workload where adding more compute does not help unless the embedding tables can be served faster.
Together, table 3 and table 4 expose the same general failure mode: optimization effort goes where ML expertise applies (model quantization, pruning) while the binding constraint sits elsewhere (image decoding on CPU for ResNet-50, embedding-table memory bandwidth for DLRM). For an isolated serial request with other stage times held fixed, model-only optimization is bounded by the time spent outside the model, the Amdahl ceiling that End-to-end vs. component latency derives for a request path. Serving modifies that familiar result in two ways. Accelerator progress tightens the ceiling, because each hardware generation shrinks the model term while the host stages stay where they were; the perspective below quantifies this for the reference request. Under load, a faster model also shortens the queue, an effect the fixed-fraction calculation cannot see and the first fallacy in section 13.11 develops.
Systems Perspective 13.2: The quantitative approach to serving
Analysis: Amdahl’s law (principle 8) sets this ceiling (Strong scaling (Amdahl's Law) provides the formal derivation). Preprocessing (4.5 ms) and data transfer (0.5 ms) consume 58 percent of total latency. Optimizing the model 10\(\times\) faster (3.5 ms → 0.35 ms) yields only a 1.6× end-to-end speedup (reducing latency from 8.6 ms to 5.5 ms). Focusing exclusively on model optimizations like quantization or pruning yields diminishing returns when non-model stages dominate execution time.
Mechanism: Domain-specific accelerators, such as the Tensor Processing Unit (TPU) and Tensor Cores, replace complex control logic with dense multiply-accumulate arrays, which shrinks the model term. The host-side stages stay on general-purpose CPUs and I/O buses, so the faster the accelerator, the larger their share of end-to-end latency.
Systems insight: Profile before optimizing. If preprocessing dominates, GPU-accelerated pipelines (NVIDIA DALI) that move preprocessing next to the accelerator may outperform model quantization, although the end-to-end gain is pipeline-specific.
Per-request overheads outside the model
Beyond model forward-pass execution, every request pays fixed overheads to the host system and network stack. When an inference query arrives, it traverses the network interface, moves across kernel and user space, deserializes from wire protocols into memory buffers, queues for batch assembly, and copies across the PCIe interconnect to accelerator device memory. These host-side operations run on general-purpose CPUs and I/O buses, which is why their share grows as the model term shrinks. Each overhead has a representative cost, a scaling behavior, and a design choice that reduces it (table 5).
| Overhead | Typical Cost | Scaling Behavior | Reduction Strategy |
|---|---|---|---|
| Network I/O | 1–5 ms | Linear with payload | Compression, Region Colocation |
| Serialization | 50–500 \(\MicroUnitPrefix\text{s}\) | Linear with payload | gRPC/Protobuf (vs. JSON) |
| Queuing | 0.1–10 ms | Diverges near capacity | Dynamic Batching, Autoscaling |
| Dispatch | 10–50 \(\MicroUnitPrefix\text{s}\) | Constant per batch | Kernel Fusion (reduce launches) |
| Data Copy | 100–500 \(\MicroUnitPrefix\text{s}\) | Linear with tensor | Zero-Copy/Shared Memory |
The killer microseconds problem
Barroso, Patterson, and colleagues identified a critical gap in how computer systems handle latency across time scales (Barroso et al. 2017). Nanosecond-scale stalls (such as cache misses) are hidden by hardware instruction-level parallelism, while millisecond-scale delays (such as disk I/O or network RPCs) are hidden by operating system thread context switching. Operations in the microsecond range (1–100 \(\MicroUnitPrefix\text{s}\)) fall into the gap between these two mechanisms. They are too long to spin-wait on a CPU core without wasting compute cycles and power, yet too short for the operating system to context-switch to another thread without paying scheduling overheads that exceed the wait time itself.
Barroso, Luiz, Mike Marty, David Patterson, and Parthasarathy Ranganathan. 2017. “Attack of the Killer Microseconds.” Communications of the ACM 60 (4): 48–54. https://doi.org/10.1145/3015146.
Serving infrastructure operates directly in this killer microseconds regime. Using the representative ranges in table 5, serialization at 50–500 \(\MicroUnitPrefix\text{s}\), dispatch at 10–50 \(\MicroUnitPrefix\text{s}\), and data copy at 100–500 \(\MicroUnitPrefix\text{s}\) are each individually small, but for the 3.5 ms reference forward pass, these named microsecond-scale overheads collectively add about 5 percent to 30 percent of the latency budget before network and queuing delays are counted. No single overhead justifies optimization in isolation, yet together they determine whether the system meets its SLO.
Tackling this compound overhead demands systematic architectural intervention across the software-hardware interface. When microsecond delays accumulate across serialization, kernel dispatch, and memory copies, isolated optimizations to individual functions yield negligible improvements. Instead, high-performance serving runtimes remove the boundaries themselves by employing zero-copy memory buffers between networking and execution runtimes, maintaining persistent CUDA streams to bypass driver dispatch latencies, and migrating preprocessing kernels directly onto the accelerator to avoid intermediate host-device transfers.
13.3.3 Resolution and input size trade-offs
Bigger inputs cost more to decode and more to run, so input resolution is a serving control as well as a model property. Model architectures are often evaluated at fixed resolutions, but the serving runtime must ingest variable client inputs and rescale them before kernel execution. In convolution-dominated vision networks, floating-point operations scale quadratically with spatial dimensions (\(\mathcal{O}(H \cdot W)\)), whereas static costs (such as weight streaming from accelerator memory and kernel launch overheads) remain invariant. Varying input resolution therefore shifts the operational arithmetic intensity across the roofline boundary. Compute-bound stages slow down quadratically as pixel count expands, whereas memory-bound stages scale with activation memory footprint.
↩︎ The roofline boundary and arithmetic intensity ridge points that separate compute-bound from memory-bound stages are established in Performance Bounds.
For convolution-dominated, compute-bound models, equation 1 gives a first-order approximation in which throughput scales inversely with resolution squared, comparing two input resolutions \(\InputResolution_1\) and \(\InputResolution_2\) (image side lengths in pixels): \[\frac{\text{Throughput}(\InputResolution_2)}{\text{Throughput}(\InputResolution_1)} = \left(\frac{\InputResolution_1}{\InputResolution_2}\right)^2 \tag{1}\]
Doubling resolution from 224 to 448 gives a 4× compute-scaling estimate, whereas the illustrative 3.6× scenario includes fixed overhead. Table 6 shows the mechanism behind that gap. Each step up in resolution reuses the same weights across more pixels, so the modeled arithmetic intensity rises and the fixed weight traffic becomes a smaller share of the work. That amortization is why the illustrative slowdown falls short of the pure compute estimate. The model counts only weights and one pass over a scaled activation term, so it establishes the direction of the effect; a profiler decides whether the executed kernels are compute or memory bound.
| Resolution | Assumed Activation Term | Modeled Arith. Intensity |
|---|---|---|
| \(224{\times}224\) | 12.5 MB | 64.4 FLOP/byte |
| \(384{\times}384\) | 36.7 MB | 137 FLOP/byte |
| \(512{\times}512\) | 65.3 MB | 183.9 FLOP/byte |
| \(640{\times}640\) | 102.0 MB | 218.4 FLOP/byte |
Resolution strategies in production
Different deployment contexts choose resolution according to which constraint binds first. A mobile application may accept \(224{\times}224\) inputs because latency and battery life outweigh marginal accuracy gains, whereas medical-imaging workloads often step up to \(512{\times}512\) or higher because diagnostic detail justifies the extra compute. Between those fixed choices, a perception pipeline may run a wide field at low resolution and reserve high-resolution crops for fine-grained recognition, while a public API that receives arbitrary user uploads can either normalize every image to a single input size or route each request to one of several validated resolution profiles.
Adaptive resolution
Adaptive resolution lets production systems select resolution dynamically based on content. One approach runs a lightweight classifier at \(128{\times}128\) to categorize content type, then selects task-appropriate resolution with documents at \(512{\times}512\), landscapes at \(224{\times}224\), and faces at \(384{\times}384\). In this illustrative scenario, the policy provides 1.4× throughput improvement with 99.2 percent accuracy retention vs. fixed high resolution. This pattern trades preprocessing cost from running the lightweight classifier for inference savings on the main model. While resolution sets the cost of the stages before the model, the stage after it is usually far cheaper, though it still crosses the device boundary and spends host CPU time and therefore belongs on the same budget.
13.3.4 Postprocessing
When a model finishes a forward pass, its raw output logits sit in accelerator memory that client applications cannot read directly; copying thousands of unreduced floats across the PCIe bus and formatting strings on the CPU can stall the worker thread between batches. Postprocessing turns those device tensors into structured application responses across the physical boundary between the accelerator and the host CPU, and how the serving engine splits computation across that boundary determines whether the final stage finishes in microseconds or blocks the pipeline.
From logits to predictions
Classification models emit unnormalized logits across the label space, and turning those raw scores into application-ready predictions requires a chain of reduction, filtering, and calibration steps. When only the single most likely label matters, argmax selection extracts the index of the highest logit, whereas applications that present ranked alternatives use top-\(\TopClassCount\) extraction to keep the \(\TopClassCount\) largest scores alongside their class indices. Before returning those candidates, probability calibration (such as temperature scaling) rescales raw logits so that output confidences reflect empirical accuracy, allowing thresholding to discard predictions that fall below a required certainty cutoff.
Executing reduction operations on the accelerator can reduce host-device transfer volume when the saved transfer cost outweighs the device execution and launch overhead. Performing softmax, argmax, or top-\(\TopClassCount\) selection in device memory prunes the payload before it crosses the PCIe bus. In ResNet-50 classification, for example, running top-\(\TopClassCount\) on the GPU reduces the transfer payload from 1,000 float32 logits (4,000 bytes) to five values and five integer indices. For ResNet-50 image classification, listing 1 traces this execution path from GPU tensor operations to host CPU label lookup and response formatting.
# Normalize raw logits into probabilities
# Input: logits tensor of shape (1, 1000), one score per ImageNet
# class
probs = torch.softmax(logits, dim=-1)  # Normalize to sum=1 on GPU

# Extract top-5 predictions for multi-class response
# topk returns (values, indices) sorted by probability
top5_probs, top5_indices = probs.topk(5)  # GPU operation
top5_probs = top5_probs.squeeze(0).tolist()
top5_indices = top5_indices.squeeze(0).tolist()

# Map class indices to human-readable labels
# imagenet_labels: list of 1000 class names from synset mapping
labels = [imagenet_labels[i] for i in top5_indices]  # CPU lookup

# Format response with predictions and metadata for API contract
response = {
    "predictions": [
        {"label": label, "confidence": float(prob)}
        for label, prob in zip(labels, top5_probs)
    ],
    "model_version": "resnet50-v2.1",  # Client-side version tracking
    "inference_time_ms": 5.2,  # Observability for latency monitoring
}
In listing 1, total postprocessing time is approximately 0.1 ms, negligible compared with preprocessing and inference. The GPU handles the normalization and top-5 reduction, so the subsequent .tolist() call transfers only tens of bytes across PCIe. However, .tolist() forces a synchronous device-to-host copy, blocking the host thread until the GPU stream finishes. In high-throughput pipelined servers, such synchronization barriers must be scheduled carefully to avoid stalling the CPU thread while it feeds subsequent requests. Fitting a calibration mapping is an offline task; applying a simple fitted mapping online is usually inexpensive, but it is valuable only when downstream decisions require confidence scores whose empirical meaning has been validated.
Output formatting
Production systems package predictions to satisfy application-level API contracts. These contracts govern JSON serialization schemas, floating-point formatting, error codes, and fallback defaults when thresholding rejects all candidates. In Python-based runtimes, repetitive JSON serialization and string allocation can consume unexpected host CPU cycles under heavy concurrency, turning a microsecond-scale formatting step into a CPU bottleneck. High-throughput servers address this by delegating serialization to native C++ runtimes or binary protocols like Protocol Buffers. Response metadata, including model version and inference execution time, completes the payload to enable downstream observability. Characterizing postprocessing closes the individual request’s latency budget, though analyzing these stages strictly in isolation assumes sequential evaluation, where each transaction completes its entire lifecycle before subsequent work begins.
13.3.5 Hardware utilization and request pipelining
Executing each request in lockstep isolation leaves specialized accelerators heavily underutilized. Because network termination, payload preprocessing, neural network evaluation, and response serialization bind on distinct physical subsystems (host network interfaces, CPU cores, PCIe interconnects, and accelerator matrix units), strict serial processing forces the accelerator into idle bubbles while the host prepares incoming tensors. The central systems objective is to maximize the accelerator’s duty cycle, the proportion of wall-clock time spent actively executing arithmetic kernels, without violating request tail-latency deadlines. Serving runtimes achieve this through request pipelining, overlapping asynchronous host preprocessing of forthcoming queries with concurrent accelerator execution on previously staged batches.
↩︎ Asynchronous host-accelerator transfer and double buffering mechanisms are established in Transfer optimization.
Overlapping I/O and compute
Figure 4 sequences execution across CPU preprocessing and GPU inference to demonstrate how request pipelining recovers lost compute capacity. In serial execution (A), each request must complete its entire lifecycle (Network \(\rightarrow\) CPU Preprocessing \(\rightarrow\) GPU Inference \(\rightarrow\) Postprocessing) before the next request begins, leaving the GPU idle for more than 50 percent of wall-clock time. Pipelining concurrent requests (B) overlaps CPU preprocessing of upcoming requests with active GPU inference on earlier inputs, eliminating the idle bubbles and maximizing accelerator duty cycle.
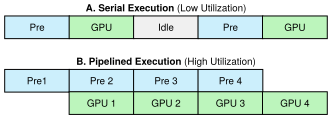
Pipelining relies on non-blocking hardware queues and asynchronous execution streams. Instead of blocking until a GPU kernel completes, the host CPU thread enqueues memory transfers and kernel launches into an accelerator stream and immediately begins preprocessing the next incoming request. The accelerator’s DMA engine and compute cores execute those queued operations independently, overlapping host preprocessing with device execution.
The systems metric: Hardware duty cycle
System efficiency here measures accelerator duty cycle rather than the fraction of peak arithmetic throughput or bandwidth achieved. In equation 2, compute time is the union of useful kernel-active intervals on each resource, summed across resources; overlapping kernels on one GPU are not counted twice. \[\text{System Efficiency} = \frac{\sum \KernelActiveTime}{\text{Wall Clock Time} \times \text{Resource Count}} \tag{2}\]
The reference ResNet-50 request spends 4.5 ms preprocessing on a host CPU core and 3.5 ms on the accelerator, so a serial system keeps the accelerator busy only 41 percent of the time. With at least two requests in flight in a sustained stream, the accelerator works on one request while the host prepares the next, and duty cycle rises to 78 percent after pipeline fill. It cannot reach 100 percent with one preprocessing worker, because the host stage is the slower of the two; a second worker removes that cap. A finite pair still pays pipeline fill and drain time, and stochastic service must retain enough capacity headroom to meet its tail-latency objective. If the CPU is too slow to feed the GPU, the system becomes CPU-bound, and further model optimization provides zero throughput gain; this is the Amdahl ceiling of section 13.3.2 seen from the throughput side. Hardware upgrades tighten it, because accelerator compute throughput has grown far faster than CPU single-thread performance across successive generations. A system that was compute-bound on an older accelerator may become CPU-bound after a hardware upgrade, not because preprocessing got slower but because the model got dramatically faster while the CPU did not.
Checkpoint 13.1: The latency budget
A request’s latency is spent across every stage of its path, not only in the model. Use this checkpoint to locate where the budget goes before choosing an optimization.
Tracing an isolated request reveals the intrinsic execution time of each pipeline phase. In production, however, multiple requests arrive concurrently and contend for shared accelerators, CPU cores, and memory buses, introducing queuing delays that dwarf raw computation time.
Self-Check: Question
An image classification service has an end-to-end SLA of 30 ms. Assume the request path is a serial pipeline with unchanged non-GPU stages, no introduced overhead from the optimization itself, and no queueing feedback effects. The request path consists of: network ingress/egress (8 ms), CPU image decoding and normalization (10 ms), GPU forward pass (8 ms), and postprocessing/top-\(k\) filtering (2 ms). If an engineer optimizes the GPU model forward pass to run in 4 ms (a \(2\times\) speedup), what is the new total latency and what architectural principle explains the resulting overall speedup?
- Total latency decreases from 28 ms to 24 ms (a 14.3% latency reduction, about a \(1.17\times\) speedup), demonstrating Amdahl’s law where unchanged serial stages bound the system gains.
- Total latency decreases from 28 ms to 14 ms (a 50% overall improvement), because GPU acceleration propagates linearly across all pipeline stages.
- Total latency remains 28 ms because dynamic batching automatically inserts artificial delay to fill GPU occupancy.
- Total latency increases to 32 ms due to host-device synchronization overhead incurred by faster kernel launches.
What is the ‘killer microseconds’ problem in low-latency ML serving systems, and why do standard operating system scheduling and hardware primitives struggle to handle it efficiently?
True or False: For computer vision models utilizing standard 2D convolutions or self-attention mechanisms, increasing the input image resolution from \(224 \times 224\) to \(448 \times 448\) quadruples the number of input pixels (\(4\times\)), which results in an approximately \(4\times\) increase in FLOPs for standard convolutional layers and up to a \(16\times\) increase for unwindowed full self-attention layers, assuming fixed channels, patch size, and architecture.
A classification serving pipeline returns only the top-5 predictions to the client. Why is it often better to run top-\(k\) selection on the GPU before copying results back to the host?
- It retrains the model online so fewer logits must be stored in GPU memory.
- It guarantees lower latency in every deployment because GPUs always execute small reductions faster than CPUs.
- It reduces the payload that crosses PCIe from the full logit vector to just a few scores and indices, though the host must still budget the synchronization and copy needed to materialize those results.
- It avoids the need for any host-side postprocessing or response formatting after inference finishes.
In a high-throughput vision serving pipeline, engineers overlap CPU image preprocessing of request \(N+1\) with GPU inference of request \(N\) using multiple CUDA streams and pinned host memory buffers, thereby increasing accelerator ____ without modifying the underlying model architecture.
13.4 Queuing Theory
An inference service that responds in a few milliseconds at moderate load can suffer sudden, tenfold latency spikes when traffic climbs toward capacity, even though no hardware has failed and the model’s execution time has not changed. Because requests arrive in irregular bursts and contend for shared accelerator queues, host-to-device PCIe links, and memory buses, queuing theory governs how waiting times grow and why latency explodes nonlinearly as utilization approaches capacity.
13.4.1 Little’s Law
Before deciding how many accelerators to provision, an engineer must know how many requests will sit inside the server at the same time; underestimating that in-flight population exhausts host request buffers, worker threads, and device activation memory under load. Given an expected arrival rate and mean response time, Little’s Law determines this average concurrency directly from throughput, while queuing models predict how response times climb as utilization nears saturation.
↪ The derivation of Little’s Law from conservation of requests is collected for reference in Little's Law.
Systems Perspective 13.3: Notation alert: L vs. latency
Classical queueing texts write Little’s law with single letters for the in-system count and the time in system; this book writes \(\RequestConcurrency\) for the count and \(\RequestTimeInSystem\) for the time, because the classical count letter would collide with the loss \(\LossFunction\) and with the iron law’s fixed-latency term \(\Latency\). In queuing theory, \(\RequestTimeInSystem\) denotes the response time or time in system per request; queue-only waiting time is \(\QueueWaitTime\). Here, \(\RequestConcurrency\) denotes the average in-system request count, \(\ArrivalRate\) the arrival rate, \(\ServiceRate\) the service rate of a server that handles one request at a time, and \(\ServingUtilization=\ArrivalRate/\ServiceRate\) the serving utilization. The subscripts distinguish queueing notation from the degradation equation’s \(\FittedSensitivity\) sensitivity parameter and keep serving utilization from occupying bare \(\Glyph{\rho}\). Section 13.5.2 adds the few symbols that batching needs.
Formulated by John D. C. Little (Little 1961), Little’s law establishes an exact relationship among three macroscopic metrics in any stable queuing system: \[\RequestConcurrency = \ArrivalRate \cdot \RequestTimeInSystem \tag{3}\] where \(\RequestConcurrency\) is the average number of requests residing in the system, \(\ArrivalRate\) is the arrival rate (requests per second), and \(\RequestTimeInSystem\) is the average time each request spends from arrival to completion.
Little, John D. C. 1961. “A Proof for the Queuing Formula: \(L = \lambda W\).” Operations Research 9 (3): 383–87. https://doi.org/10.1287/opre.9.3.383.
Little’s law holds regardless of the arrival distribution, service-time distribution, or scheduling discipline; it requires only that the system is stable and that requests are neither created nor destroyed internally. For an inference service targeting 1000 QPS with a mean response time of 50 ms, Little’s law dictates the average in-flight request population that host memory buffers and worker threads must sustain.
Napkin Math 13.2: Little's Law capacity sizing
Problem: How many requests are in the system on average at 1,000 QPS?
Math: Little’s Law gives \(\RequestConcurrency = \ArrivalRate \RequestTimeInSystem\), so average population equals throughput multiplied by mean time in system.
Given:
- Arrival rate \((\ArrivalRate)\), equal to throughput in a stable system: 1,000 QPS.
- Mean time in system \((\RequestTimeInSystem)\): 50 ms (0.05 s).
Math: \(\RequestConcurrency\) = 1,000 QPS \(\times\) 0.05 s = 50 concurrent requests on average
Systems insight: The system holds 50 requests on average across batch and queue state. That population is a memory and concurrency requirement, not a limit on the accelerator. A server whose GPU executes at most 32 requests per batch can still sustain this load, because the requests not currently executing wait in host memory; service rate, queueing behavior, and the tail distribution, not the population itself, determine whether the load is feasible.
Because equation 3 binds these three variables, constraining any two dictates the third. If an inference service averages 10 ms per request \((\RequestTimeInSystem = 0.01 \text{ s})\) and holds 50 concurrent requests on average \((\RequestConcurrency = 50)\), the sustainable arrival rate must be \(\ArrivalRate = \RequestConcurrency / \RequestTimeInSystem = 5000\) requests per second. Conversely, if host memory limits concurrency to an average of 10 requests while average time in system remains 10 ms, the system cannot exceed a throughput of 1,000 requests per second without dropping traffic.
13.4.2 The utilization-latency relationship
Little’s Law describes average system inventory under steady-state conditions, but it does not reveal how latency behaves as traffic approaches system capacity. The M/M/1 queuing model (in Kendall’s notation: Markovian, that is Poisson, arrivals; Markovian, that is exponential, service times; and one server) quantifies the headroom required to prevent latency collapse (Harchol-Balter 2013).9 For a system with Poisson arrivals10 and exponential service times, equation 4 gives the average time in system: \[\RequestTimeInSystem = \frac{1}{\ServiceRate- \ArrivalRate} = \frac{\text{service time}}{1 - \ServingUtilization} \tag{4}\] where \(\ArrivalRate\) is the arrival rate, \(\ServiceRate\) is the service rate (requests per second the server can handle), and \(\ServingUtilization = \ArrivalRate/\ServiceRate\) is the utilization (the fraction of time the server is busy).
9 M/M/1 queue: Queuing theory originated with Agner Krarup Erlang’s 1909 analysis of the Copenhagen Telephone Exchange, where call arrivals were modeled as memoryless (Poisson).
10 Poisson process: Named after French mathematician Simeon Denis Poisson (1781–1840), this stochastic model describes events occurring continuously and independently at a constant average rate, so counts in disjoint intervals are independent.
11 Kendall notation: Kendall’s A/S/c (arrival/service/servers) shorthand (Kendall 1953) is the one already used for \(\KendallMarkovianCode/\KendallMarkovianCode/1\), where “M” signifies a Markovian (memoryless) process; the “D” in M/D/1 denotes deterministic service. Neither model replaces measurement of a production workload’s arrival process, service-time variance, or tail behavior.
Kendall, David G. 1953. “Stochastic Processes Occurring in the Theory of Queues and Their Analysis by the Method of the Imbedded Markov Chain.” The Annals of Mathematical Statistics 24 (3): 338–54. https://doi.org/10.1214/aoms/1177728975.
Because the denominator contains \(1 - \ServingUtilization\), latency grows nonlinearly as utilization approaches unity, and small incremental increases in traffic near saturation trigger severe backpressure and queuing delays. The standard M/M/1 formulation assumes exponentially distributed service times. For compiled neural networks processing fixed-size batches and static tensor dimensions, execution times are nearly constant, making an M/D/1 queue a tighter model of mean queuing delay. The analysis here retains the M/M/1 model because it yields closed-form solutions and predicts greater mean queueing delay than M/D/1 under matched arrival rate and mean service time. In production environments, variable input lengths, dynamic batch formation, CPU preprocessing, and key-value cache lookups introduce runtime variance that quickly breaks deterministic assumptions.11 Under this model, average time in system multiplies rapidly as utilization approaches 100 percent (table 7).
| Utilization \((\ServingUtilization)\) | Latency Multiple | Example (3.5 ms service) |
|---|---|---|
| 50% | 2× | 7.1 ms |
| 70% | 3.3× | 11.8 ms |
| 80% | 5× | 17.6 ms |
| 90% | 10× | 35.3 ms |
| 95% | 20× | 70.6 ms |
Plotted against the serving utilization \(\ServingUtilization\), the fraction of time the server is busy, the same \(\KendallMarkovianCode/\KendallMarkovianCode/1\) model shows why the knee matters (figure 5). Latency stays nearly flat at low utilization and then climbs without bound as the server approaches 100 percent busy, because each new arrival is increasingly likely to find work already waiting. The 99th percentile curve rises even faster in absolute terms, staying a fixed multiple above the mean that section 13.4.3 derives next. The green zone below 50 percent utilization and the red zone above 70 percent illustrate a planning policy, not universal operating limits. This rapid compounding near saturation is why latency-sensitive systems reserve headroom rather than planning for permanently high accelerator occupancy.
↪ Why long-tailed latency distributions make high percentiles, rather than the mean, govern what users experience is collected for reference in Distributions and the long tail.
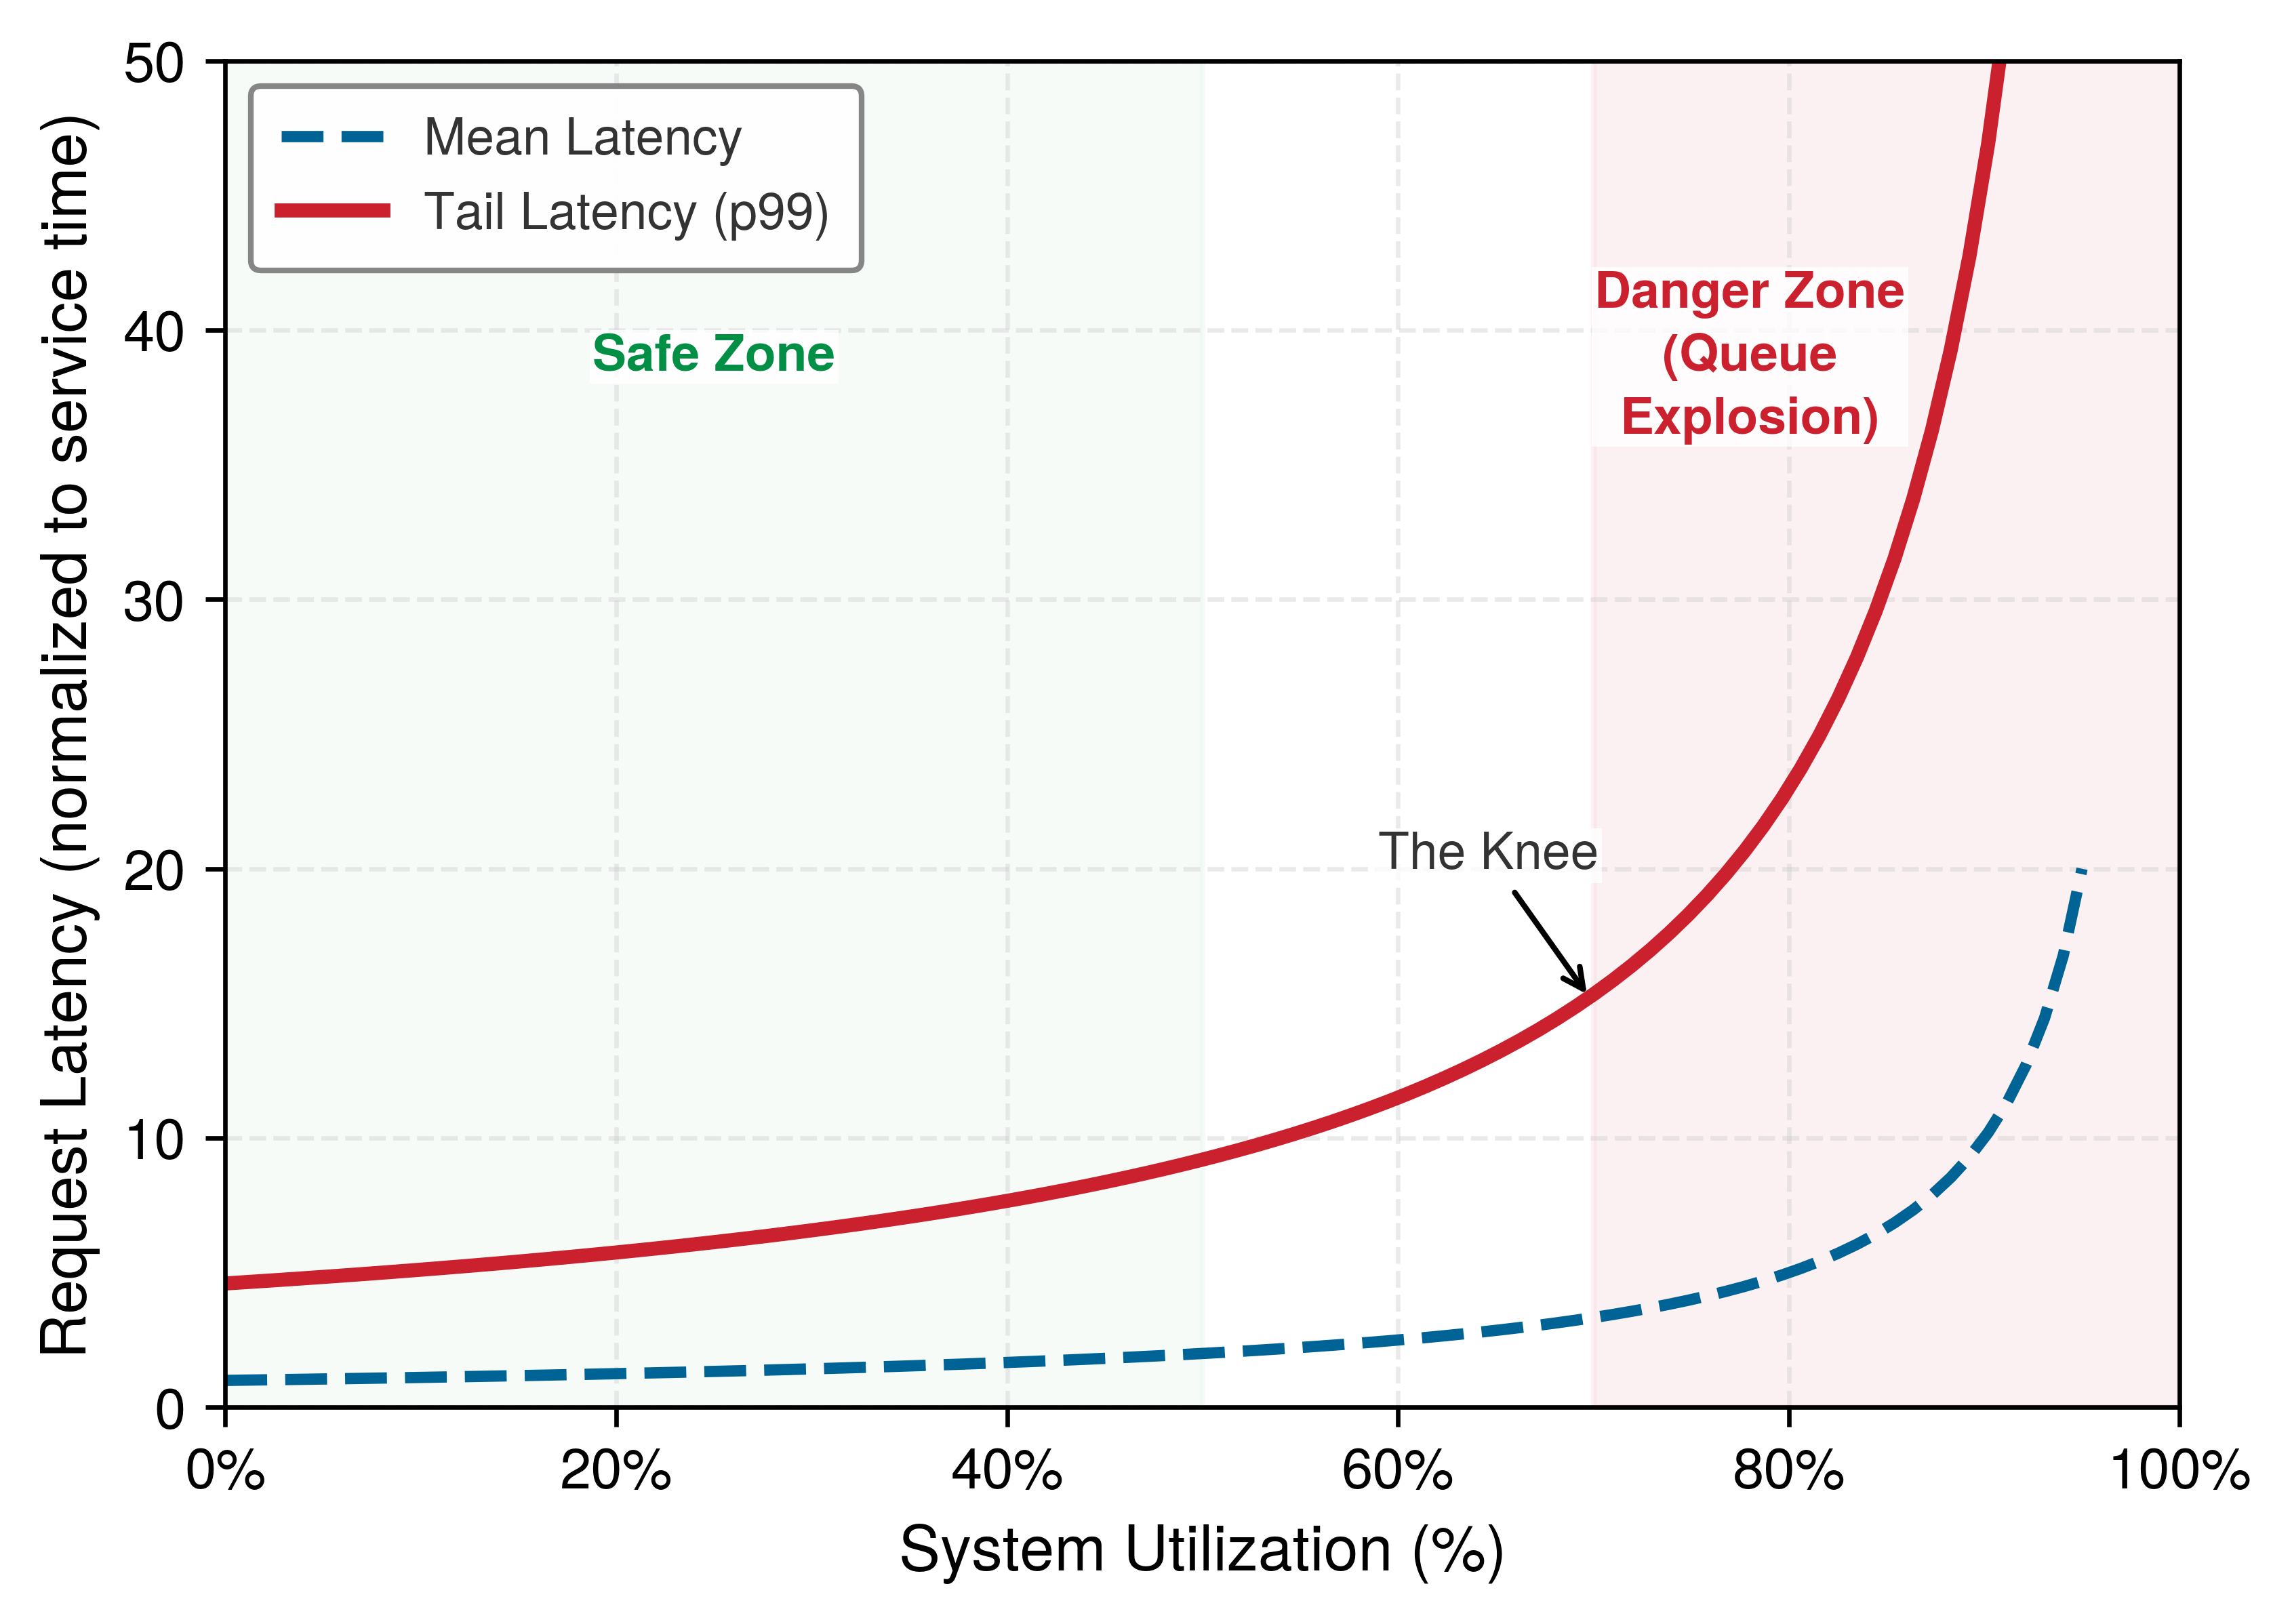
13.4.3 Tail latency
A serving cluster running at 70 percent utilization can report a comfortable mean latency while its slowest 1 percent of requests wait more than four times as long in the queue. Because averages hide this tail contention, production SLOs specify percentile targets (p95, p99) that bound experience for the slowest requests (Dean and Barroso 2013).
The M/M/1 model that produced the mean in equation 4 also yields the full latency distribution, and the tail follows from it. Total request latency (queue wait plus service) is exponentially distributed with cumulative distribution function \(\ResponseTimeDistributionFunction(\RequestResponseTime) = 1 - e^{-\RequestResponseTime/ \RequestTimeInSystem}\), where \(\RequestTimeInSystem = \frac{\text{service time}}{1 - \ServingUtilization}\) is that mean response time. To derive the 99th percentile latency (p99), we solve for the time \(\RequestResponseTime_{99}\) where 99 percent of requests have completed (\(\ResponseTimeDistributionFunction(\RequestResponseTime_{99}) = 0.99\)): \[1 - e^{-\RequestResponseTime_{99}/\RequestTimeInSystem} = 0.99 \implies e^{-\RequestResponseTime_{99}/\RequestTimeInSystem} = 0.01 \implies -\frac{\RequestResponseTime_{99}}{\RequestTimeInSystem} = \ln(0.01) = -\ln(100) \approx -4.605\] Solving for \(\RequestResponseTime_{99}\) and substituting the mean latency \(\RequestTimeInSystem\) yields the governing expression for tail latency: \[\TailRequestLatency\approx \frac{\text{service time}}{1 - \ServingUtilization} \cdot \ln\left(\frac{1}{1 - 0.99}\right) \approx \frac{4.6 \cdot \text{service time}}{1 - \ServingUtilization} \tag{5}\]
At 70 percent utilization, average latency is only 3.3 times service time, while p99 latency reaches 15.3 times service time \((4.6/0.3 \approx 15.3)\). Evaluating a serving cluster by average latency therefore conceals severe tail degradation. Before exploring software mitigations like hedging, systems engineers must first provision sufficient accelerator capacity to satisfy tail-latency SLOs under peak load. For a ResNet-50 deployment, the M/M/1 tail-response-time model turns provisioning into a short sequence of steps.
Napkin Math 13.3: ResNet-50 capacity planning
Consider designing a ResNet-50 serving system with these requirements:
- Queue-plus-GPU p99 subbudget: 50 ms
- Peak expected traffic: 5,000 QPS
- GPU service time (batch one, the chapter’s reference ResNet-50 profile): 3.5 ms
Step 0: Define the modeled request boundary. The worker model covers waiting for the GPU and the GPU forward pass only. This scenario allocates 50 ms to that portion of the request and separately assumes a combined 18 ms upper bound for network transit, serialization, preprocessing, transfer, and postprocessing. The end-to-end deadline must accommodate both allowances. A 50 ms end-to-end deadline would instead require subtracting the outside-worker allowance before applying the queue model; the arithmetic below would no longer apply. An outside-stage mean or p99 cannot substitute for the stipulated combined upper bound.
Step 1: Find safe utilization. From equation 5, \(\TailRequestLatency\approx\) 4.6 \(\times\) service time / \((1 - \ServingUtilization)\). Setting \(\TailRequestLatency\leq\) 50 ms with 3.5 ms service time gives \(\ServingUtilization \leq 1 - (4.6 \times 3.5\,\mathrm{ms})/50\,\mathrm{ms} = 0.68\) (68 percent maximum utilization). This is an M/M/1 p99 estimate under the stated arrival and service assumptions; a load test must validate the tail.
Step 2: Calculate required service rate. \(\RequiredServiceRate = 5,000\,\mathrm{QPS} / 0.68 = 7402.9\,\mathrm{req}/\mathrm{s}\)
Step 3: Determine GPU count. In this M/M/1 model, the single-GPU rate is 283 req/s.
GPUs needed = 7402.9 req/s / 283 req/s = 26.1 → 27 GPUs
This single-GPU rate is the batch-1 service rate. Each request holds the GPU for the full service time, which keeps the M/M/1 model closed-form. Dynamic batching (section 13.5) amortizes fixed overhead across requests and raises the per-GPU rate several-fold, so a batched deployment may need fewer GPUs after its own latency distribution is validated; section 13.10.2 compares the two regimes.
Step 4: Add headroom for variance. This scenario adds 30 percent headroom for traffic spikes and variance: final count = 27 \(\times\) 1.3 = 35.1, rounded up to 36.
Step 5: Verify fault tolerance. The 30 percent headroom addresses traffic variance, but production systems also need fault tolerance. With 36 GPUs, losing one leaves 35 GPUs handling 5,000 QPS. The postfailure utilization is 5,000 QPS / (283 req/s \(\times\) 35) = \(50.4\%\).
This remains well below the 68 percent safe utilization threshold, confirming N+1 redundancy is satisfied. For stricter fault tolerance requirements, N+2 redundancy (tolerating two simultaneous failures) would require 29 GPUs under the same safe-utilization threshold, or about 38 GPUs if the 30 percent headroom must remain after two simultaneous failures.
Result: Under the batch-1 M/M/1 assumptions, 36 H100 GPUs supply the modeled queue-plus-GPU capacity for 5,000 QPS within the 50 ms p99 subbudget, including one failed replica. End-to-end acceptance still requires validating the tail under load and the separately reserved outside-worker allowance.
The queuing analysis explains the capacity planning approach detailed in section 13.10.2 and connects directly to the MLPerf Server scenario. The Server scenario (Server) is defined as Poisson arrivals scored by throughput against a tail-latency target. A Server result is therefore valid only when the run satisfies its percentile-latency constraint; otherwise, the target QPS must be reduced and the run repeated.
13.4.4 Tail-tolerant techniques
A capacity plan built on stationary Poisson arrivals holds only while traffic stays near the planned rate. Production traffic instead arrives in bursty, uncoordinated surges driven by user behavior, scheduled jobs, and daily cycles; when a surge pushes arrivals past the reserved headroom, accelerator service times cannot shrink to absorb the excess, so queries pile up in host and device queues and clients begin timing out.
Example 13.3: The 'Black Friday' traffic spike
Scenario: An e-commerce recommendation serving system experiences a 10× traffic surge (10,000 QPS) during Black Friday sales events.
Diagnosis: A fleet sized for normal traffic now receives more requests per second than it can complete. Utilization pins at 100 percent, and every second of the surge adds the excess arrivals to a queue that the servers cannot drain, so waiting time grows for as long as the surge lasts. In this scenario, latency reaches 10 s and clients time out. Section 13.4.2 showed why the queue starts growing sharply well before utilization reaches 100 percent.
Systems lesson: High average throughput does not prevent queueing collapse under traffic surges. Depending on the service, preserving a tail-latency objective may require load shedding, graceful degradation, or autoscaling before utilization reaches the workload’s queueing knee.
Eliminating all sources of latency variability is often impractical. Production systems instead employ techniques that tolerate variability while still meeting SLOs (Dean and Barroso 2013; Dean 2012). For one serving node, the first distinction is between an isolated straggler and overload. Racing an isolated slow request can reduce its latency when spare capacity exists. When the node is overloaded, however, racing requests injects duplicate work and deepens the queue, so the system must instead protect the latency of admitted requests through graceful degradation or admission control. Graceful degradation returns lower-fidelity results to preserve throughput: classification pipelines fall back to cached approximations, generative models truncate decoding lengths, and model ensembles evaluate only a subset of members. Dynamically reducing active ensemble members shortens the service time \(\BatchServiceTime(\BatchSize)\) of each batch of \(\BatchSize\) requests, which increases the effective service rate \(\EffectiveServiceRate(\BatchSize) = \BatchSize/\BatchServiceTime(\BatchSize)\) and lowers utilization \(\ServingUtilization = \ArrivalRate / \EffectiveServiceRate(\BatchSize)\) toward a workload-appropriate operating point with more headroom, as illustrated by figure 5, trading a controlled accuracy reduction for SLO survival instead of an uncontrolled latency collapse. Admission control enforces an even stricter boundary. When the ingress queue exceeds a designated threshold, the server immediately rejects excess queries with HTTP 503 status codes rather than admitting work doomed to violate its latency deadline.
Dean, Jeffrey. 2012. Achieving Rapid Response Times in Large Online Services. Berkeley AMPLab Cloud Seminar.
Setting this rejection threshold requires accounting for the work ahead of the arriving request. Consider a warmed, isolated worker that serves requests sequentially in first-in-first-out (FIFO) order, without batching or preemption. Assume known upper bounds on each request’s service time and on every remaining stage outside the worker, including the response path. Subtract time already spent since the request began from its end-to-end latency allowance, then subtract the remaining outside-worker bound and the arriving request’s service bound. The result is its waiting allowance. The worker’s outstanding-work bound is the sum of the current request’s residual service bound and the service bounds of queued requests. Admission passes the deadline screen only when that sum fits within the waiting allowance; a negative allowance rules out admission even to an idle worker. A request-count limit approximates this comparison only when service costs are sufficiently uniform. When they are, a practical starting point bounds the ingress queue at two or three requests per worker, the backlog a worker clears within two or three further service times, and the deadline screen and measured tails then tighten or relax that bound.
Suppose the outstanding work exceeds the full model’s waiting allowance but fits the allowance obtained with a validated, faster model that is already resident and warmed. The server can admit the request through that fallback if its prediction quality meets the application’s minimum requirement. Shortening the new request’s service time frees waiting allowance, but does not remove work already queued ahead of it. If neither acceptable model fits, rejection avoids spending accelerator time on a result that would arrive too late. Rejection reduces availability, while fallback can reduce prediction fidelity; both outcomes must be counted alongside latency so that shedding difficult requests does not make the service appear successful merely by shrinking its measurement population.
The deadline screen is a deterministic bound only under the stated service, isolation, and scheduling assumptions. Mean service time or a per-stage p99 cannot replace those upper bounds. Variable input lengths, batch formation, and shared memory-bus contention require empirical calibration against the joint request-latency distribution. Completed-request tails must be reported together with rejection rates and fallback quality over offered traffic. Adaptive admission control can tighten the admissible backlog as measured tail latency approaches the SLO, but neither a fixed queue count nor the simplified screen certifies a production p99 target.
13.4.5 Scaling across multiple replicas
Once traffic outgrows a single node’s safe utilization knee, no single-machine tuning can prevent queue build-up; higher aggregate volume requires horizontal replication, placing identical model replicas behind a load balancer so that each holds a complete model copy and serves disjoint queries without inter-node synchronization. (Model parallelism, which shards one large model across accelerators linked by a fabric such as NVLink, solves a different problem: fitting a model that exceeds one device’s memory or latency budget.) The \(\KendallMarkovianCode/\KendallMarkovianCode/\QueueServerCount\) queuing model extends the single-server analysis to \(\QueueServerCount\) parallel workers; pooling requests in one shared queue absorbs arrival bursts better than isolated single-server queues, provided dispatch is balanced (least-loaded routing, for example) and each replica keeps its own headroom.
The tail at scale problem
Dean and Barroso’s analysis reveals why tail latency becomes critical as systems scale beyond single machines (Dean and Barroso 2013). When requests fan out to \(\FanoutBackendCount\) parallel backends (querying an ensemble of models, searching sharded embedding indices, or parallelizing pipeline stages), the overall user request completes only when the slowest sub-task finishes. If sub-task completion events are independent and each has a 99 percent probability of finishing within latency threshold \(\LatencySlo\), the probability that all \(\FanoutBackendCount\) backends finish within \(\LatencySlo\) is \((0.99)^\FanoutBackendCount\). For a fan-out of \(\FanoutBackendCount= 10\), only \(0.99^{10} \approx 90.4\%\) of requests meet the target; at \(\FanoutBackendCount= 100\), that probability drops to \(0.99^{100} \approx 36.6\%\), meaning nearly two-thirds of user requests experience a tail delay. This “tail at scale” effect makes controlling single-node tail variance essential for overall system performance.
Dean, Jeffrey, and Luiz André Barroso. 2013. “The Tail at Scale.” Communications of the ACM 56 (2): 74–80. https://doi.org/10.1145/2408776.2408794.
12 Hedging: The term is borrowed from finance, where an offsetting position reduces risk; here, the redundant request insures against a slow server. The insurance is not free. For ML systems, the losing hedged request may still occupy accelerator time if inference has already launched, because ordinary GPU kernels are not cheaply canceled mid-execution. Thus, a hedging policy must budget duplicate work as well as the latency benefit.
Hedging and tied requests limit the damage from a straggler replica. Under hedging, a request that has not completed within the expected time is duplicated to another server, and the client keeps whichever response arrives first.12 With a stable latency distribution, a threshold at the historical 95th percentile duplicates about 5 percent of requests; correlated slowdowns raise that fraction and can make hedging amplify overload instead of reducing the tail. Tied requests instead enter several server queues at once and cancel the other copies when one server begins processing, which avoids waiting to detect a slow response. Both techniques create duplicate work. Cancellation before dispatch prevents a losing copy from consuming accelerator time, whereas cancellation after dispatch only discards its result, so either needs spare capacity and an explicit duplicate-work budget. Canary requests apply the same idea to fan-out, sending the request first to one or two servers and committing to the full fan-out only if they answer within the expected time.
Replicas or streams on one machine can also race requests, but sharing an accelerator or memory bus can correlate their slowdowns and exhaust the same headroom. The local admission decision remains the foundation; fleet coordination is an extension of it. Retries across a fleet obey the same duplicate-work constraint, because load balancers that retry rejected requests at other overloaded replicas amplify the overload, so replicas should share load information and shed the same fraction of requests rather than each rejecting independently. Production frameworks may use shortest-job-first or deadline-aware scheduling rather than FIFO, changing which queued work lies ahead of an arrival and requiring a corresponding admission analysis (Harchol-Balter 2013).
Checkpoint 13.2: Queuing and SLO headroom
Latency SLOs are not enforced by fast inference alone; they are enforced by headroom.
Headroom keeps the queue stable by leaving capacity idle, and adding replicas creates headroom by adding accelerators. The other way to keep utilization below the knee is to raise each replica’s service rate, and for an accelerator that executes one request at a time the largest lever is to execute several at once.
Self-Check: Question
An online recommendation service handles an arrival rate of \(\lambda = 500\) queries per second. Instrumented telemetry reveals an average residency time (waiting time in queue + inference service time) of \(W = 40\text{ ms}\) (\(0.04\text{ s}\)). According to Little’s Law, what is the average number of concurrent requests (\(L\)) present in the serving system?
- \(L = 12.5\text{ requests}\)
- \(L = 200\text{ requests}\)
- \(L = 2\text{,}000\text{ requests}\)
- \(L = 20\text{ requests}\)
In a distributed serving architecture, an aggregate user request fans out in parallel to 50 leaf model servers and must wait for all 50 responses before completing. Assume each leaf independently has a 1% probability of exceeding the same latency threshold, other latency sources are negligible, and all 50 requests are issued simultaneously. Explain the ‘tail at scale’ phenomenon and calculate the probability that the aggregate request suffers tail latency.
True or False: Hedged requests (speculative backup requests) reduce p99 tail latency by sending identical duplicate requests to multiple servers simultaneously for every incoming query upon arrival, without incurring any additional cluster compute overhead.
Order the following overload-handling workflow for a serving system from first diagnosis to final verification: (1) choose a mitigation that fits the current bottleneck and SLO trade-off, such as admission control, graceful degradation, or a batching change, (2) measure arrival rate, service time, queue depth, and observed tail latency, (3) identify the binding constraint from those measurements, such as overload, queue growth, or service-time inflation, (4) validate the chosen policy under representative load and confirm it improves SLO compliance.
An inference node modeled as an \(M/M/1\) queue has an average execution service time of \(T_{\text{svc}} = 10\text{ ms}\). If the arrival rate increases such that system utilization \(\rho\) increases from \(50\%\) (\(\rho = 0.5\)) to \(90\%\) (\(\rho = 0.9\)), what happens to the mean total response time \(W\)?
- \(W\) increases linearly from 10 ms to 18 ms.
- \(W\) increases nonlinearly from 20 ms to 100 ms (\(5\times\) increase).
- \(W\) decreases from 20 ms to 11.1 ms due to batching efficiency.
- \(W\) remains fixed at 10 ms because service time is independent of arrival rate.
True or False: Under a simple \(M/M/1\) queueing model approximation, when server utilization (\(\rho_{\text{serv}}\)) reaches 90%, the 99th percentile (p99) tail latency is approximately equal to 1.5 times the mean latency.
13.5 Throughput Optimization
Consider the reference ResNet-50 classifier on an H100 GPU operating at batch size one. Each forward pass reads the model’s weights from high-bandwidth memory to serve a single image and issues a long sequence of small kernels whose fixed launch cost is paid once per image, leaving neither weight traffic nor launch overhead shared across inputs. Processing requests continuously at 280 images/s, each pass spends 99 percent of its time on those fixed costs. Processing 32 images at once delivers 7,000 images/s, a 25× throughput improvement on identical hardware, because one kernel sequence and one weight read now serve thirty-two inputs. The fixed-cost share must not be confused with serving utilization. A single worker processing batch 1 at 280 requests/s is 100 percent busy in queueing terms (\(\ServingUtilization = 1.0\)) with zero spare serving capacity, yet nearly all of its time goes to work that a larger batch would share. Batching13 is the primary lever for improving serving economics, but its operational constraints differ sharply between training and serving (Crankshaw et al. 2017). Training batches maximize throughput by grouping hundreds or thousands of samples together with no constraint on individual sample latency. Serving batches must balance accelerator saturation against individual request deadlines, ensuring that no early-arriving input waits excessively for a batch to form. An inference server resolves this tension through dynamic batching, adjusting batch size at runtime to match incoming request arrivals.
13 Batch: From Old French bache (a quantity baked at one time), entering computing in the 1950s for jobs processed together without human interaction. The ML serving usage preserves the original trade-off: grouping requests amortizes fixed costs (kernel launch, weight movement) across multiple inputs, but an online request may wait for a batch to form.
Crankshaw, Daniel, Xin Wang, Guilio Zhou, Michael J. Franklin, Joseph E. Gonzalez, and Ion Stoica. 2017. “Clipper: A Low-Latency Online Prediction Serving System.” 14th USENIX Symposium on Networked Systems Design and Implementation (NSDI 17), 613–27.
Definition 13.3: Dynamic batching
Dynamic batching is the ML serving optimization that trades latency for throughput under stochastic arrival patterns.
- Significance: By buffering requests into a batching window, the scheduler amortizes fixed overheads \((\Latency)\) across multiple inputs, pushing the system away from the bandwidth-bound regime \((\Bandwidth)\) toward the compute-bound regime \((\PeakRate)\).
- Distinction: Unlike fixed-size serving batches, dynamic batching adjusts the realized batch size at inference time according to arriving traffic, a timeout, and a maximum-batch limit.
- Common pitfall: A frequent misconception is that batching “always helps.” In reality, there is a latency-throughput Pareto frontier: if the batching window is too large, the increased queuing delay may violate the system’s SLO before the throughput gains are realized.
13.5.1 Why batching helps
A single request often leaves an accelerator’s compute units idle because its operations expose too little parallel work to hide kernel launch overhead or reuse weights streamed from memory (though large spatial inputs or smaller edge accelerators may already saturate at batch one). For workloads that underuse the device at small batches, increasing the batch size improves hardware efficiency (Shen et al. 2019) by amortizing fixed costs across multiple requests and running inputs in parallel across the batch dimension.
Shen, Haichen, Lequn Chen, Yuchen Jin, Liangyu Zhao, Bingyu Kong, Matthai Philipose, Arvind Krishnamurthy, and Ravi Sundaram. 2019. “Nexus: A GPU Cluster Engine for Accelerating DNN-Based Video Analysis.” Proceedings of the 27th ACM Symposium on Operating Systems Principles, 322–37. https://doi.org/10.1145/3341301.3359658.
Two fixed costs dominate at small batch sizes. Kernel launch overhead is the time for the CPU to prepare and submit work to the GPU. The number of launches depends on graph lowering and fusion rather than the layer count. For each launch, the CPU must assemble kernel parameters, copy them to GPU-accessible memory, and signal the GPU to begin execution. The cost per kernel does not depend on batch size. The reference ResNet-50 profile issues 174 kernels at 15 μs of host time each, 2.6 ms per forward pass. At batch size 1, this overhead far exceeds the actual compute time; at batch size 32, the same overhead is amortized across thirty-two images. Weight loading reads model parameters from GPU memory (VRAM) to the compute units. In a weight-streaming approximation, batch size 1 reads the weights for one image; batch size 32 reuses that weight stream across thirty-two images, increasing weight-only operational intensity by 32\(\times\). Activation traffic, caches, and workspace determine the executed operation’s full intensity.
↩︎ Per-kernel launch overhead, and why fusion and graph execution attack it, are established in The dispatch overhead law.
Larger batches improve hardware efficiency but inflate per-request latency. The engineering objective is to identify the operating point that maximizes sustainable throughput while satisfying the request deadline. For the reference ResNet-50 profile quantified in table 8 below, serving batch size 8 with a 10 ms batching window requires a mean formation-plus-inference budget of approximately 8.8 ms: an arriving request waits on average half the window (5 ms, as derived in section 13.5.4.1) and requires 3.8 ms of inference. If the service must meet a 20 ms SLO, the remaining 11.2 ms provides headroom for worker backlog and auxiliary pipeline stages, while delivering 7.5× higher service throughput than batch 1 on identical hardware. On this accelerator the batching window, not the computation, is most of the batch-8 budget. Batch size cannot grow indefinitely, and figure 6 shows why by modeling this relationship across batch sizes on a logarithmic axis. To isolate the planning knee under worst-case scheduling conditions, the figure assumes a strictly serialized single worker that waits out the full batching window before executing each batch, without pipelined overlap (\(\text{Latency} = \BatchingWindow + \BatchServiceTime(\BatchSize)\)). Under this unpipelined assumption, batch-1 throughput is 74 requests/s rather than the 280 images/s sustained when inference runs back to back. Throughput rises almost in proportion to batch size while the fixed overhead dominates each batch, because each added image costs only 33 μs of device time. The planning knee sits where the batch’s total per-image work equals the fixed part of its latency, the window plus the fixed cost, near batch 410: there latency is twice that of batch one and throughput is half its ceiling, and beyond it each doubling of the batch roughly doubles latency while throughput gains less and less. In this model throughput never declines; it saturates, so latency, not throughput, sets the largest useful batch.
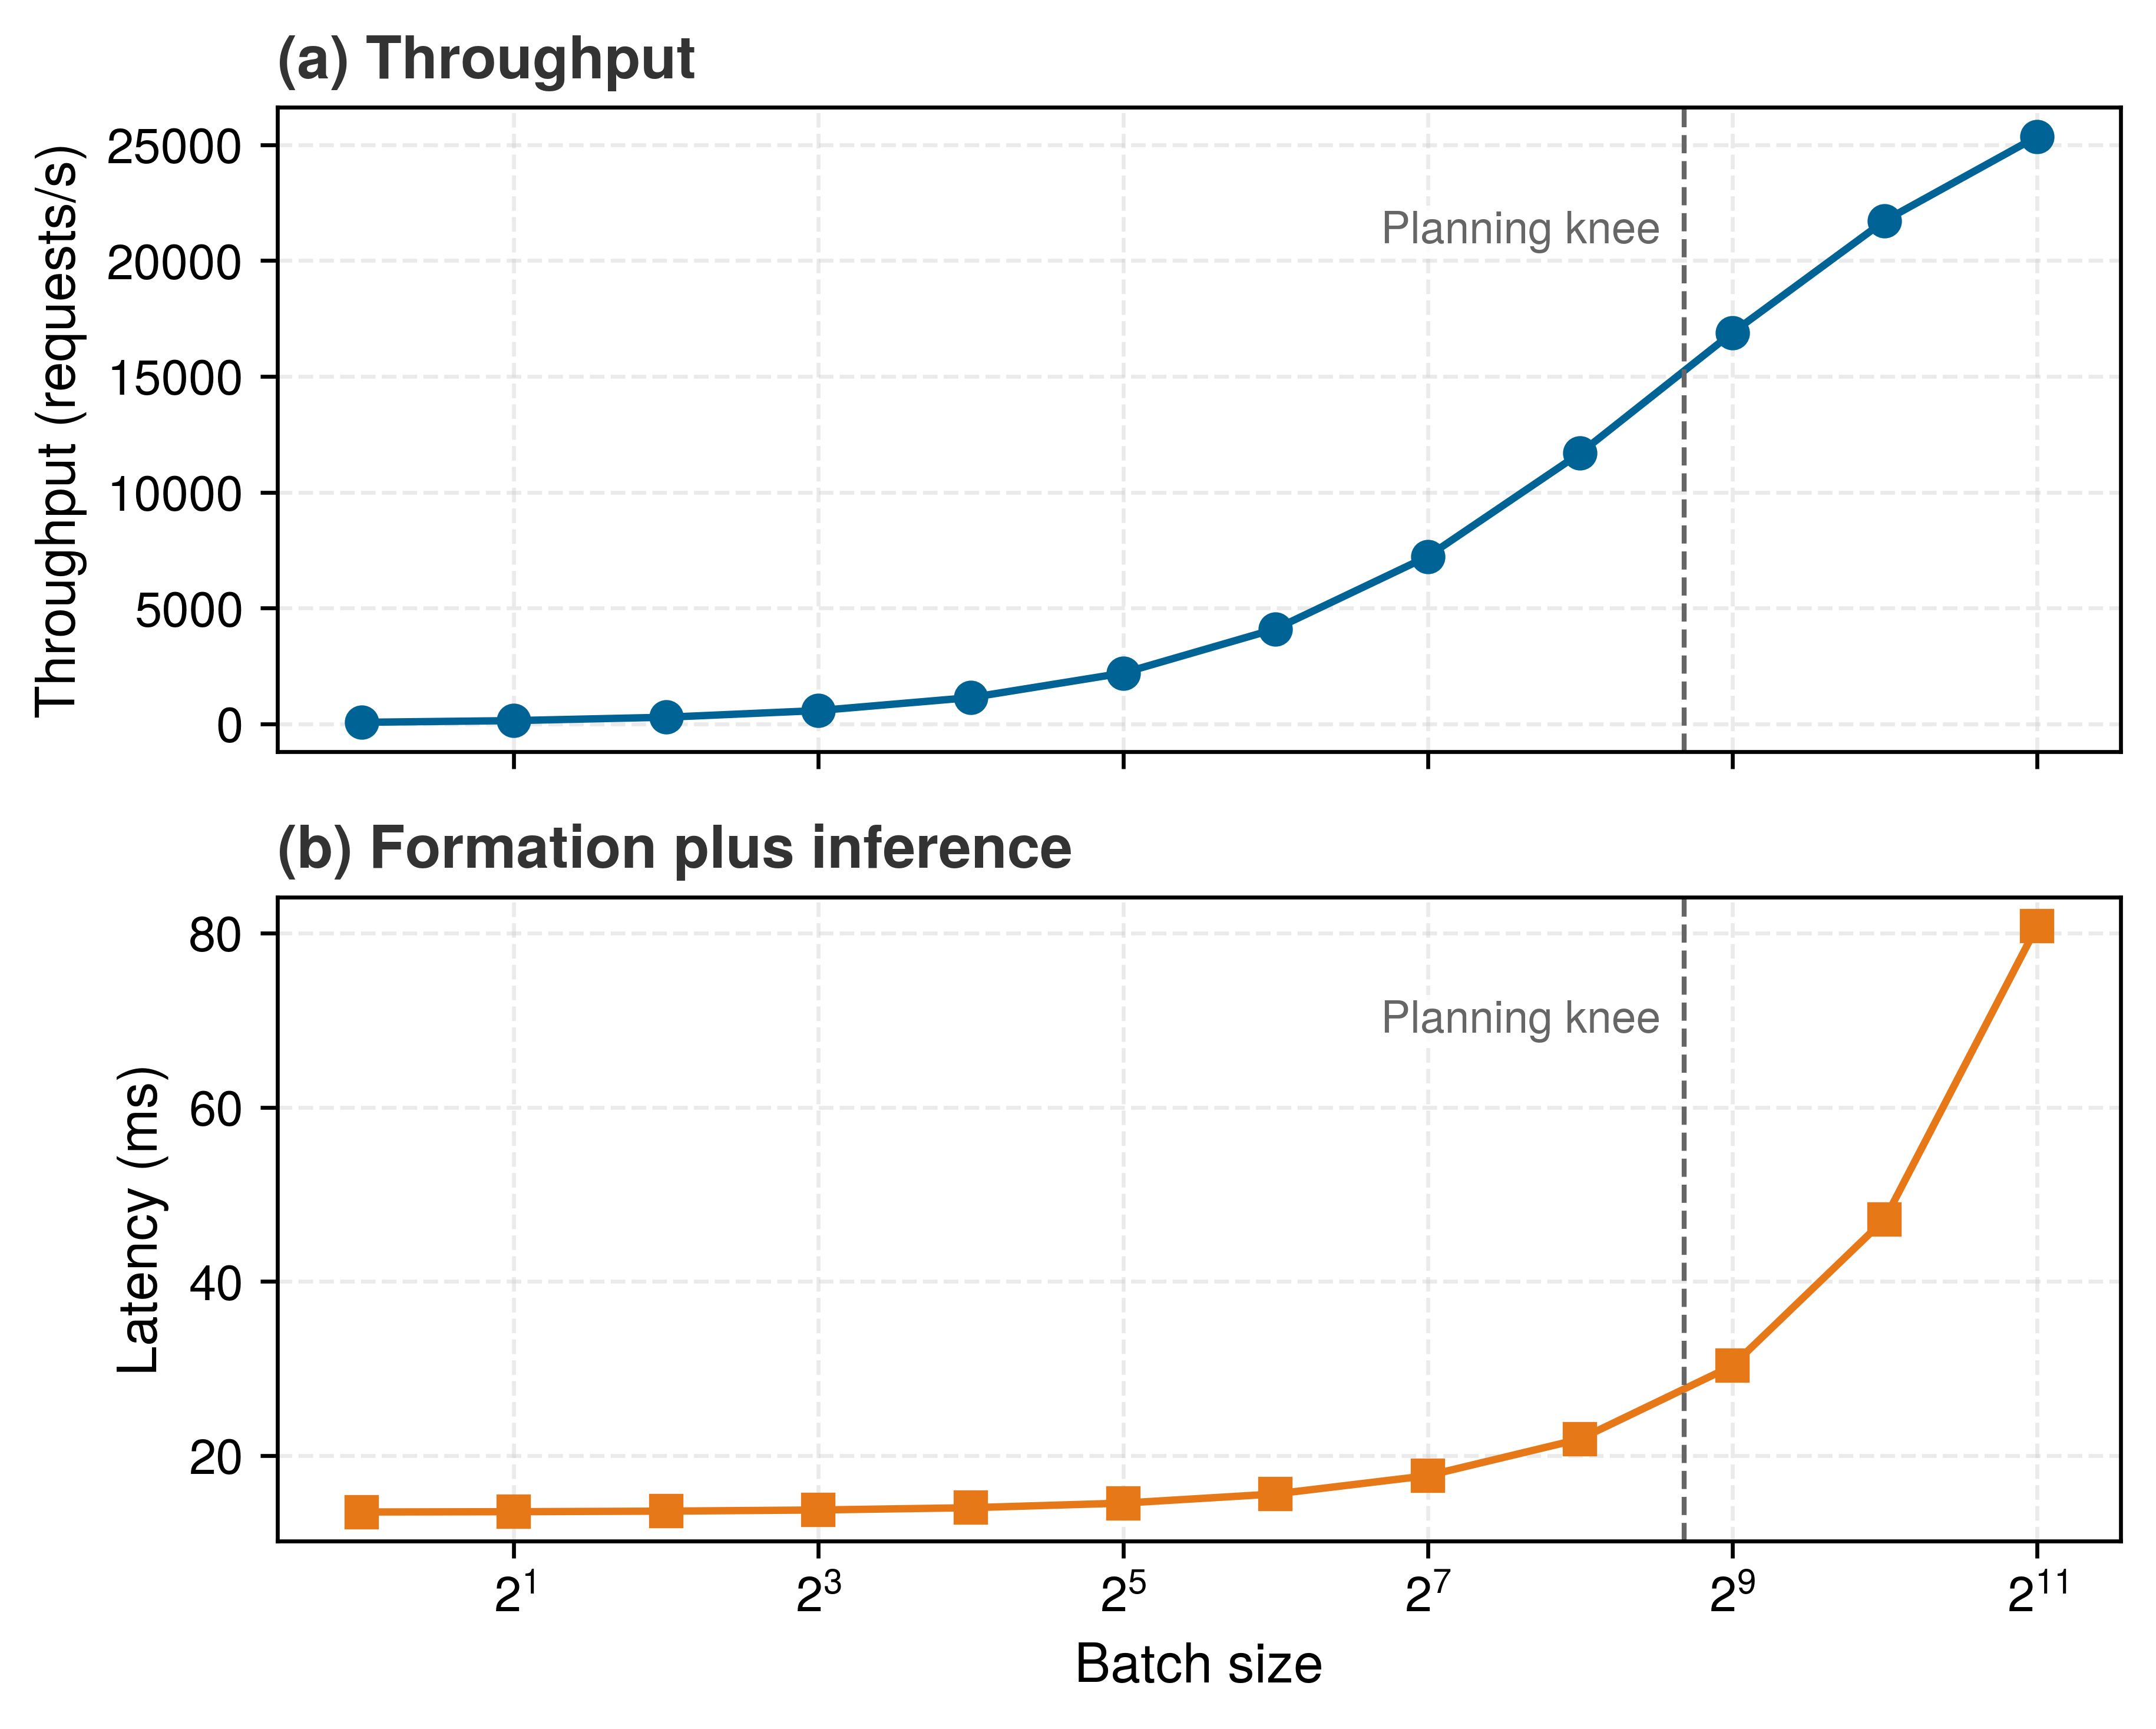
The vertical dashed marker near batch size 410 in figure 6 marks the point where per-image work equals the fixed part of a batch’s latency. The knee illustrates a general systems trade-off rather than a fixed operating setting. Under unpipelined serial dispatch, throughput is bounded by \(\BatchSize / (\BatchingWindow + \BatchServiceTime(\BatchSize))\). In contrast, when the serving runtime pipelines batch formation with accelerator execution, saturated throughput depends solely on accelerator service time (\(\EffectiveServiceRate(\BatchSize) = \BatchSize / \BatchServiceTime(\BatchSize)\)), achieving the higher capacities documented in table 8.
Napkin Math 13.4: ResNet-50 batching efficiency
Table 8 illustrates the throughput-latency trade-off for the reference ResNet-50 profile on the H100 across batch sizes one through thirty-two. The last column is the fixed-cost share, the fraction of each batch’s time spent on costs that do not grow with batch size: kernel issue, the per-kernel device floor, and the weight read. This share must be distinguished from the server’s queueing utilization (\(\ServingUtilization = \ArrivalRate/\ServiceRate\), section 13.4.2) and its wall-clock duty cycle (equation 2). For example, a dedicated worker executing batch size 1 continuously operates at 100 percent queueing utilization with zero idle time between requests, yet spends 99 percent of each forward pass on fixed costs that a larger batch would share.
Table 8: ResNet-50 batching sweep: Modeled per-image time, throughput, and fixed-cost share across batch sizes one through thirty-two for the reference profile on the H100. Throughput grows 25× from batch one to batch thirty-two as the fixed-cost share falls from 99 percent to 77 percent, while pure inference time stretches only from 3.5 ms to 4.5 ms. The window-plus-inference column adds the full 10 ms batching window and excludes worker queueing; because the window and the fixed cost dominate it, it rises only modestly across the sweep. The fixed-cost share is distinct from server queueing utilization and wall-clock duty cycle.
Math: For the batch-8 row, dividing batch latency by batch size yields per-image compute: 3.76 ms ÷ 8 images ≈ 0.47 ms per image. Dividing batch size by batch latency yields throughput: 8 images ÷ 3.76 ms ≈ 2,130 img/s. The same two relations apply to every derived row.
| Batch Size | Inference Time | Window + Inference | Per-Image Compute | Throughput | Fixed-Cost Share |
|---|---|---|---|---|---|
| 1 | 3.53 ms | 13.5 ms | 3.53 ms | 280 img/s | 99% |
| 4 | 3.63 ms | 13.6 ms | 0.91 ms | 1,100 img/s | 96% |
| 8 | 3.76 ms | 13.8 ms | 0.47 ms | 2,130 img/s | 93% |
| 16 | 4.02 ms | 14.0 ms | 0.25 ms | 3,980 img/s | 87% |
| 32 | 4.55 ms | 14.5 ms | 0.14 ms | 7,040 img/s | 77% |
The inference times exclude queue wait. The window-plus-inference column is the unpipelined worst case for a request that waits out the whole window, and section 13.5.4.1 derives the average wait a request actually sees.
Systems insight: Batch size 32 achieves 25× higher throughput than batch size 1. However, user-perceived latency includes both queue wait and inference time. With a 10 ms batching window and 4.5 ms inference, formation plus inference reaches 14.5 ms, excluding resource backlog and other request stages, vs. 3.5 ms at batch size 1.
The sweep reports seconds; the same batches look different in bytes and joules. At batch one each image carries the entire 102.4 MB FP32 weight read by itself, and at batch thirty-two it carries one thirty-second of it, while the 25 MB of activations each image writes and reads stays fixed (table 9). Arithmetic intensity rises from 64 FLOP/byte to 291 FLOP/byte. With the energy constants that accompanied the iron law in Iron Law of ML Systems, 160 pJ/byte of DRAM traffic and 2.3 pJ/FLOP of FP32 arithmetic, the energy of one classification falls from 39.2 mJ at batch one to 23.4 mJ at batch thirty-two. Data movement accounts for 52 percent of that energy at batch one and 19 percent at batch thirty-two. Past that point arithmetic dominates, and a larger batch saves almost nothing per image while still lengthening every request’s wait.
| Batch Size | Weight Bytes per Image | Activation Bytes per Image | Arithmetic Intensity | Time per Image (Sweep) | Energy per Image | Movement Share |
|---|---|---|---|---|---|---|
| 1 | 102.4 MB | 25 MB | 64 FLOP/byte | 3.53 ms | 39.2 mJ | 52% |
| 8 | 12.8 MB | 25 MB | 217 FLOP/byte | 0.47 ms | 24.9 mJ | 24% |
| 32 | 3.2 MB | 25 MB | 291 FLOP/byte | 0.14 ms | 23.4 mJ | 19% |
13.5.2 Formation delay and the latency-throughput frontier
The throughput gains demonstrated in table 8 incur a deliberate systems cost. Every request in a batch pays a latency penalty, an engineered queueing delay introduced to elevate hardware utilization. The performance gain arises from parameter reuse across inputs. Evaluating \(\BatchSize\) independent queries simultaneously converts memory-bound matrix-vector products into compute-dense general matrix multiplications (GEMM), raising arithmetic intensity toward the hardware roofline ceiling (Principle 6). Conversely, the latency penalty accumulates in the queue, because assembling \(\BatchSize\) distinct queries forces earlier arrivals to sit idle while waiting for subsequent requests to appear.
Formalizing this trade-off requires extending the single-server queuing notation. Let \(\BatchServiceTime(\BatchSize)\) denote the execution duration for a batch of size \(\BatchSize\). The unbatched service rate is \(\ServiceRate= \EffectiveServiceRate(1) = 1/\BatchServiceTime(1)\), while batching \(\BatchSize\) inputs yields an effective aggregate throughput of \(\EffectiveServiceRate(\BatchSize) = \BatchSize/\BatchServiceTime(\BatchSize)\). In a request-triggered fixed-batching system, end-to-end response time decomposes into two distinct penalties: batch formation delay \((\BatchFormationDelay)\), the time earlier requests wait while the batch accumulates to capacity, and inference inflation, the modest increase in kernel execution duration \(\BatchServiceTime(\BatchSize)\) as batch size expands from 1 to \(\BatchSize\). Under stationary Poisson arrivals at rate \(\ArrivalRate\), the first request in a batch waits an average of \((\BatchSize-1)/\ArrivalRate\) seconds while the final arrival waits zero, yielding an average formation delay of \((\BatchSize-1)/(2\ArrivalRate)\). Assuming an execution worker is immediately available upon batch assembly, equation 6 models the resulting latency-throughput Pareto frontier: \[ \BatchedRequestLatency\approx \underbrace{ \frac{\BatchSize-1}{2\ArrivalRate} }_{\text{Formation delay}} + \underbrace{ \BatchServiceTime(\BatchSize) }_{\text{Inference time}} \tag{6}\]
Equation 6 formalizes the component trade-off between accelerator throughput and individual request latency, assuming an idle worker is immediately available upon batch assembly. Increasing \(\BatchSize\) raises arithmetic intensity and amortizes memory bandwidth across inputs, but introduces formation delay for early arrivals. Evaluated as a formation-plus-service component comparison using the service times from table 8 at 500 QPS, moving from batch 1 to batch 32 increases formation wait from 0 ms to 31 ms, a 10× increase in isolated stage latency (3.5 ms to 36 ms). However, batch-one service cannot sustain 500 QPS on a single worker whose peak service rate is only 280 requests/s; without batching, worker backlog diverges toward infinity, so 3.5 ms does not represent a viable steady-state response time at this arrival rate. Batching is what makes 500 QPS feasible on that hardware in the first place, demonstrating that grouping requests can lower loaded end-to-end response time even while adding formation delay. Sizing \(\BatchSize\) is therefore an operational stability screen before it is an economic optimization: operators first enforce queue stability (\(\ArrivalRate < \EffectiveServiceRate(\BatchSize)\)) and then select the batch size that maximizes throughput within the memory ceiling and latency SLO \((\LatencySlo)\). Because equation 6 assumes the batcher waits for a full count of \(\BatchSize\) requests before launching, how serving systems relax that count-only assumption when traffic fluctuates separates the two batching policies below.
13.5.3 Static vs. dynamic batching
If an inference server holds execution until its queue accumulates a fixed batch of \(\BatchSize\) requests, a lull in traffic can leave early arrivals waiting indefinitely until enough subsequent queries arrive to fill the batch. Static batching (where static describes the batch dimension rather than the precomputed predictions of static inference) fixes the batch size at compile time so compilers can allocate static memory buffers and emit specialized compute kernels—a natural fit for offline processing and model training, where inputs are already staged, but a liability when interactive requests arrive stochastically. Conversely, setting a small fixed batch size to cap waiting time leaves accelerator compute units underutilized and fails to amortize weight transfers from high-bandwidth memory when traffic spikes.
Dynamic batching decouples batch formation from arrival determinism by buffering incoming requests behind a dual-trigger scheduler (Olston et al. 2017; NVIDIA 2024b). Rather than waiting indefinitely for a fixed tensor shape, the serving runtime makes a batch eligible for dispatch when either of two thresholds is satisfied: the queue accumulates a maximum batch size \(\MaxBatchSize\), or a timeout window \(\BatchingWindow\) expires relative to the oldest buffered request. When traffic bursts, the queue fills to \(\MaxBatchSize\) almost instantaneously, achieving high arithmetic intensity with minimal queuing delay. When arrival rates drop, the timeout window forces the dispatch of an undersized batch (\(\BatchSize< \MaxBatchSize\)), bounding formation time at the expense of per-request compute efficiency. If the accelerator is busy, the ready batch can still wait for service. The timeout window \(\BatchingWindow\) and maximum batch size \(\MaxBatchSize\) form the primary operational levers. Shorter windows limit formation delay, whereas longer windows allow larger batches when enough requests arrive. A longer window is useful only when the resulting throughput gain remains within the latency and memory constraints.
13.5.4 Dynamic batching latency-throughput trade-offs
Setting those two levers (\(\BatchingWindow\) and \(\MaxBatchSize\)) requires accounting for what happens to the latency budget while the batcher waits: a wide window can spend a large share of the SLO accumulating requests before a single kernel launches. Because latency under load grows in the queue before it grows on the accelerator (section 13.4.4), configuring a dynamic batcher starts by separating time spent waiting from time spent in service.
Equation 7 decomposes the modeled batching-and-service portion of request latency into two components. Its total excludes network transit and any host stages outside the service interval: \[\BatchedRequestLatency= \BatchingQueueWait+ \BatchServiceTime(\BatchSize) \tag{7}\] where \(\BatchingQueueWait\) is the time spent waiting in the batching queue (corresponding to \(\QueueingLatency\) in the latency budget of principle 12) and \(\BatchServiceTime(\BatchSize)\) is the service time for a batch of size \(\BatchSize\) (encompassing \(\InferenceLatency\) plus portions of \(\PreprocessingLatency\) and \(\PostprocessingLatency\)). This wait includes formation and any subsequent wait for a worker. The batching window \(\BatchingWindow\) bounds formation time alone; \(\BatchingQueueWait\leq \BatchingWindow\) holds only when no additional resource backlog delays dispatch. Batch size affects service time through weight reuse, parallel work, and execution overhead.
Quantitative analysis of batching
Configuring a dynamic batching policy requires balancing batch formation delay against accelerator execution time and pending queue backlog. In a pure count-triggered batcher (equation 6), average formation delay \((\BatchSize-1)/(2\ArrivalRate)\) contracts as arrival rate \(\ArrivalRate\) grows, but diverges under light traffic. Conversely, a pure timer-triggered batcher dispatches on a periodic schedule of length \(\BatchingWindow\), decoupling formation delay from instantaneous arrival fluctuations.
To evaluate how time-based batching impacts latency budgets, consider a baseline fixed calendar window where batches dispatch periodically every \(\BatchingWindow\) seconds and an idle execution worker is available at the boundary. Under stationary Poisson arrivals, query arrival times distribute uniformly across the interval \([0, \BatchingWindow]\). A request arriving at offset \(\WindowArrivalOffset\) within the window experiences a formation wait of \(\BatchingWindow - \WindowArrivalOffset\). Integrating across the uniform distribution yields an expected waiting time equal to exactly half the batching window (equation 8): \[\mathbb{E}[\BatchingQueueWait] = \frac{\BatchingWindow}{2} \tag{8}\]
A 20 ms batching window adds 10 ms average wait (up to 20 ms for the first arrival in a window; later arrivals wait less) regardless of batch size achieved. For a 50 ms mean latency SLO with 3.5 ms inference, the average wait consumes 20 percent of the latency budget before any computation begins, about 3× the forward pass itself; tail SLOs must budget the full window.
Batch size distribution
For fixed calendar windows, the number of requests collected during \(\BatchingWindow\) follows a Poisson distribution with mean \(\ArrivalRate \BatchingWindow\). Equation 9 formalizes this relationship: \[\Pr(\text{batch size} = \WindowArrivalCount) = \frac{(\ArrivalRate \BatchingWindow)^\WindowArrivalCount e^{-\ArrivalRate \BatchingWindow}}{\WindowArrivalCount!} \tag{9}\] where \(\WindowArrivalCount\) is a nonnegative integer count of arrivals in the window.
With a fixed 10 ms window, the count a window collects fluctuates most at low traffic. At 50 QPS the mean batch is 0.5 with a standard deviation of 0.7, and 61 percent of windows contain no request at all, so no GPU batch launches. At 200 QPS the mean is 2 and the standard deviation 1.4, so realized batches still swing widely around the mean. At 1000 QPS the mean reaches 10 and the spread narrows relative to it, so the probability that a window collects at least twice the mean falls from 39 percent at the lowest traffic level to 0.3 percent at the highest, the law of large numbers at work.
Throughput maximization strategy
Throughput optimization requires separating per-request latency from saturated service capacity. A request waits for batch formation, then pays the service time of the formed batch. Under sustained load, however, batch formation can overlap with the previous batch’s execution, so capacity is governed by the ready-batch service time: \[\EffectiveServiceRate(\BatchSize) \approx \frac{\BatchSize}{\BatchServiceTime(\BatchSize)}, \qquad \text{throughput} = \min(\ArrivalRate, \EffectiveServiceRate(\BatchSize)) \tag{10}\]
In equation 10, \(\ArrivalRate\) is the offered arrival rate and \(\EffectiveServiceRate(\BatchSize)\) is the saturated service capacity for batch size \(\BatchSize\). The numerator increases linearly with batch size while service time often increases sublinearly over a useful range because larger batches amortize fixed kernel-launch overheads and DRAM weight transfers, shifting execution from memory-bandwidth-bound matrix-vector operations toward compute-bound matrix-matrix multiplication. The batching window still appears in request latency and in low-traffic regimes, where the expected batch size is limited by arrivals during the window, roughly \(\ArrivalRate \BatchingWindow\).
To analytically evaluate batching strategies across arbitrary batch sizes without interpolating discrete benchmark tables, the reference ResNet-50 profile is affine in batch size, \(\BatchServiceTime(\BatchSize) = 3.50\text{ ms} + (0.033\text{ ms})\,\BatchSize\): 3.50 ms of fixed kernel issue, per-kernel device floor, and weight read, plus 0.033 ms of device work per image. It is the same model that produced the batching sweep (table 8), so the sweep and the model describe one service. This analytical service model unifies the queueing, window screening, and dispatch calculations throughout the remainder of this section. The sweep’s window-plus-inference column already evaluates it for a 10 ms batching window \(\BatchingWindow\), pairing formation-plus-service latency with saturated pipelined capacity. The sweep’s throughput gains trace directly back to the fixed-overhead term \(\Latency\) of the iron law (principle 3), which batching amortizes across requests.
The sweep, the formation wait, and the arrival statistics compose a calendar-window planning model. Average formation wait is half the window, Poisson arrivals make the window count fluctuate around \(\ArrivalRate \BatchingWindow\), and saturated service capacity \(\EffectiveServiceRate(\BatchSize)\) grows as batching amortizes fixed costs. An oldest-request timer, a maximum-batch trigger, or a busy worker changes the observed wait and batch distributions. Mean-latency screening can narrow candidate configurations; a percentile SLO requires their tail behavior under the intended dispatch policy and load.
Latency-constrained optimization
When latency is the binding constraint, a mean-latency approximation provides an initial screen of candidate batch sizes. For the portion of a mean latency SLO allocated to batching and service, \(\BatchingLatencyBudget\), and average wait time \(\BatchingWindow/2\), equation 11 defines the maximum allowable batch size \(\LatencyBoundedBatchSize\) using a first-order average latency approximation. Other request stages require separate budget allocations. This is a feasibility bound, not a throughput optimum, and it screens a mean budget rather than certifying a p95 or p99 target: \[\LatencyBoundedBatchSize= \max\left\{\BatchSize : \frac{\BatchingWindow}{2} + \BatchServiceTime(\BatchSize) \leq \BatchingLatencyBudget\right\} \tag{11}\]
Applying equation 11 to the affine service model for a 50 ms mean budget shows how the choice of batching window shapes the feasible configuration space. A conservative 5 ms window adds 2.5 ms of average formation wait (up to the full 5 ms for the first request in a window) and leaves 47.5 ms for inference, enough by equation 11 for a batch of about 1,340 images. The configured engine maximum batch of 128, an assumed setting, binds first, so the batch is capped at 128 images and the worker sustains about 16,600 img/s when saturated. An aggressive 25 ms window adds 12.5 ms of average wait and leaves 37.5 ms, still enough for about 1,030 images, so the same engine cap binds and saturated capacity does not change. A tail SLO, unlike this mean-latency plan, must budget the full window rather than its average.
This comparison quantifies the diminishing returns of expanding the batching window. Widening the window by 20 ms buys no saturated capacity while increasing average formation wait by 10 ms. On an accelerator this fast relative to its fixed cost, the latency budget stops being the binding constraint on batch size; the engine’s maximum batch and the arrival rate are. However, this initial screen relies on mean formation wait and deterministic batch sizing. In production, stochastic arrivals introduce batch-size variance that can breach tail deadlines even when the mean latency appears well within the budget, requiring the percentile envelope analysis developed next.
SLO violation analysis
Batch size variability can cause SLO violations even when mean latency appears safe. A request in a fixed window sees itself plus the other arrivals, so \(\RequestSeenBatchSize=1+\operatorname{Poisson}(\ArrivalRate \BatchingWindow)\). With an available worker at dispatch, combining the full window with the request-seen p99 batch size gives the conservative formation-plus-service envelope in equation 12: \[\BatchLatencyEnvelope= \BatchingWindow+ \BatchServiceTime(\TailRequestSeenBatchSize) \tag{12}\] For \(\ArrivalRate\) = 500 QPS and \(\BatchingWindow\) = 10 ms, the mean request-seen batch size is 6 and its p99 is 12. The mean latency is 8.7 ms; the conservative envelope is 13.9 ms.
The envelope is 1.6× the mean, and a configuration whose mean sits comfortably inside the SLO can still breach it when a full window coincides with an unusually large batch. Under the available-worker calendar-window assumptions, the envelope conservatively screens formation plus service because the longest window wait and largest batch need not hit the same request. A passing configuration clears only this screen; acceptance still requires evaluating worker backlog and the other request stages under the intended traffic and dispatch policy. A failing configuration can be rejected conservatively or investigated with a more faithful model and load test. Neither outcome alone establishes compliance with the end-to-end SLO.
Adaptive batching windows
Static batching windows impose a rigid trade-off that penalizes both traffic extremes. Under heavy traffic surges, a static timeout window holds early arrivals unnecessarily long after sufficient queries have already accumulated, consuming latency budget without enlarging the batch. Conversely, during off-peak periods, a fixed window frequently dispatches tiny, inefficient batches, failing to exploit accelerator arithmetic intensity. To navigate this tension, serving runtimes employ adaptive batching policies that dynamically modulate window duration based on instantaneous queue backlog, observed arrival rates, and the residual latency margin before the service-level objective expires. An adaptive window contracts during surges and expands during lulls, so it can lower average latency and raise realized batch size at the same time, within the remaining latency budget. Listing 2 implements one such heuristic.
def adaptive_batching_window(
    queue_depth, arrival_rate, slo_ms, service_ms, fixed_overhead_ms
):
    """Compute a heuristic batching window.

    Based on current system state.
    """
    target_batch_size = 16  # Deployment-tuned target batch

    # Fast path: batch ready, close immediately to minimize latency
    if queue_depth >= target_batch_size:
        return 0

    # Compute maximum allowable wait from the remaining p99 budget.
    max_wait_ms = max(0, slo_ms - service_ms - fixed_overhead_ms)

    # Estimate time to accumulate target batch at current arrival
    # rate.
    # arrival_rate is requests/second, so convert seconds to
    # milliseconds.
    if arrival_rate > 0:
        requests_needed = target_batch_size - queue_depth
        estimated_wait_ms = requests_needed / arrival_rate * 1000.0
        # Return minimum of estimated wait and SLO-constrained maximum
        return min(estimated_wait_ms, max_wait_ms)

    return max_wait_ms  # Low traffic: use remaining budget to accumulate batch
The heuristic selects a candidate formation timer. Its inputs omit time already spent by the oldest request and work queued ahead of the batch, so the returned window does not establish a remaining deadline allowance. Deadline-aware dispatch must account for both quantities and validate the service and outside-worker budgets under load.
The nondominated batching configurations form a Pareto frontier where improving throughput requires accepting higher latency. Across five window and batch-cap configurations on the reference profile, from a 2 ms window capped at batch 8 to a 50 ms window capped at batch 128, modeled throughput rises from 2,100 img/s to 16,600 img/s, a gain of 680 percent, while the modeled p99 envelope rises from 5.8 ms to 57.7 ms, 10× its initial value. Average latency over the same range grows from 4.8 ms to 32.7 ms.
Practical configuration guidelines
The frontier, like the knee of figure 6, shows why configuration must work backward from the latency budget. Past the knee, widening the window buys diminishing throughput for sharply rising tail latency. In the worked scenario, reserving 30 percent of the SLO for batching wait gives \(\BatchingWindow\leq 0.3 \times \LatencySlo\); another workload may allocate a different fraction after accounting for network, preprocessing, inference, and postprocessing. The traffic estimate should include peaks and burst duration rather than rely only on the mean. GPU memory supplies a separate ceiling on batch size through activations and runtime workspace. Finally, monitoring the realized batch-size and wait-time distributions reveals whether the assumed arrival model holds and whether a fixed or adaptive window is appropriate.
For an illustrative ResNet-50 serving system with a 50 ms SLO and 500 QPS traffic, the calculation provides starting estimates for two configuration knobs: the batching window and maximum batch size. Table 10 summarizes the resulting configuration and modeled operating point. The batch statistics and tail envelope use the calendar-window model without worker backlog; an oldest-request timer and maximum-batch trigger require a load test of their actual distributions. Its saturated-capacity row derates the ideal batch-32 rate by an assumed efficiency factor of 0.89, standing in for scheduling gaps and batches that dispatch before they fill.
| Quantity | Value | Engineering role |
|---|---|---|
| Latency budget for batching | 15 ms | Portion allocated to batch formation. |
| Maximum window | 15 ms | Upper bound implied by the latency budget. |
| Expected request-seen batch | 7 | Average batch seen by an arriving request. |
| Request-seen p99 batch | 13 | Tail batch size under Poisson arrivals. |
| Assumed memory-limited batch | 32 | Scenario cap for accelerator memory. |
| Selected configuration | \(\BatchingWindow\) = 12 ms, \(\MaxBatchSize\) = 32 | Candidate knob setting for load testing. |
| Conservative tail envelope | 15.9 ms | Full window plus request-seen p99 batch service time. |
| Illustrative saturated capacity | 6,300 img/s | Ideal batch rate derated by the efficiency factor. |
| Offered throughput | 500 img/s | Offered load; acceptance requires load validation. |
Example 13.4: From a batching window to a dispatch decision
Problem: In a hypothetical trace of the selected dual-trigger configuration, four requests arrive at 0, 2, 5, and 9 ms. No further requests arrive before dispatch. The worker becomes available at 18 ms, and the remaining response path takes 4 ms. Does the oldest request meet the 50 ms deadline under the planning service-time model?
Analysis: The batch remains below the maximum count, so the oldest-request timer makes it eligible after 12 ms. The worker is still busy, adding 6 ms of resource-queue wait. The four-request batch then takes 3.6 ms under the same linear service model used for the window analysis. Adding the remaining response path gives 25.6 ms from the oldest arrival to completion.
Result: Dispatching the four-request batch meets the oldest request’s deadline with 24.4 ms of slack; the later arrivals finish with more slack. Waiting for the maximum batch would leave these requests stalled because the trace supplies no further arrivals. The timeout therefore determines eligibility, while worker availability determines actual dispatch.
Systems insight: The selected window passes this complete trace, including backlog and the response path. Establishing a percentile SLO requires repeating the accounting over the intended traffic, service-time variation, and input mix, with rejected requests and fallback quality reported alongside completed-request latency.
Working backward from the budget can also conclude that the right window is zero, because schedulers and dynamic memory allocators add coordination and synchronization overhead that hurts latency-critical or resource-constrained deployments. Under an ultra-low p99 target, even a brief formation delay consumes an unacceptable fraction of the latency budget, while in runtimes without ragged (variable-length) tensor support, batching variable-length inputs pads every sequence to the longest item in the batch—waste that single-request execution avoids completely. Memory capacity can rule out batching as well: when model weights already occupy most of the accelerator’s physical memory, concurrent batch activations and dynamic KV-cache allocations risk out-of-memory aborts, forcing the runtime to serve one request at a time.
13.5.5 Traffic patterns and batching strategy
A timeout window tuned for independent web API calls will stall a multi-camera robotics rig whose frames arrive in synchronized bursts, and it is useless on a smartphone that processes one user photo at a time. Because the right batching policy depends on how requests arrive, the MLPerf inference benchmark supplies four standardized scenarios that approximate common production arrival patterns.
Server traffic (Poisson arrivals)
The MLPerf Server scenario models cloud/API-like inference traffic with Poisson arrivals (Reddi et al. 2019), the arrival model behind the window statistics of section 13.5.4.2. A fixed calendar window collects \(\ArrivalRate \BatchingWindow\) requests on average, and that count fluctuates most, relative to its mean, at low traffic. Higher traffic can fill a desired batch sooner, permitting a shorter formation window. An oldest-request timer also includes the request that starts the window. Increasing the arrival rate therefore allows the same expected batch count with less deliberate waiting. The scheduler may instead target a larger batch if the latency and memory budgets permit it. Neither choice creates service capacity. The formed batches must complete fast enough to keep up with sustained arrivals, or resource backlog grows despite the shorter window. Window tuning must jointly check the arrival count, the service rate at the realized batch sizes, and the full request-latency distribution.
Reddi, Vijay Janapa, Christine Cheng, David Kanter, Peter Mattson, Guenther Schmuelling, Carole-Jean Wu, Brian Anderson, et al. 2019. “MLPerf Inference Benchmark.” 2020 ACM/IEEE 47th Annual International Symposium on Computer Architecture (ISCA), 446–59. https://doi.org/10.1109/isca45697.2020.00045.
Single-user traffic (sequential arrivals)
Synchronized sensors fix batch size and deadline outside the server. At the opposite end of the spectrum, interactive mobile and edge applications process one request stream at a time, leaving no opportunity to batch independent queries. The MLPerf SingleStream scenario captures this sequential-serving shape. Here, the optimization target shifts from a synchronization budget under a frame deadline to per-request latency and energy consumption under a rigid thermal envelope. For the smartphone vision pipeline modeled below, the primary engineering objective is not batch formation, but minimizing per-phase latency and energy dissipation.
Mobile serving constraints
Cloud services often emphasize fleet cost and latency; mobile serving adds three closely coupled constraints. The first is an energy budget that throughput alone does not capture, because each inference consumes battery. In the modeled pipeline, 2.98 mJ at 22 FPS draws about 66 mW for the inference path alone, before camera, display, ISP, and OS overhead add to that total in a full photo app. Thermal throttling can compound this limit when sustained system power reaches a device-specific thermal boundary. Memory constraints close the set because the model shares RAM with the application and operating system. Reload time depends on device storage, runtime, and model state; quantization and memory-mapped loading (section 13.8.2) can reduce footprint and startup work but do not eliminate those dependencies.
Example 13.5: ResNet-50: Mobile serving
Table 11 decomposes per-phase latency and energy for a single-user mobile vision inference:
| Phase | Duration | Energy | Notes |
|---|---|---|---|
| Camera buffer read | 8 ms | 0.08 mJ | System API |
| JPEG decode (CPU) | 15 ms | 1.5 mJ | Single-threaded |
| Resize + Normalize | 5 ms | 0.4 mJ | CPU preprocessing |
| NPU inference | 12 ms | 0.8 mJ | 82% utilization |
| Postprocess + UI | 5 ms | 0.2 mJ | Result rendering |
| Total | 45 ms | 2.98 mJ | 22 FPS sustained |
The mobile serving node is governed by four metrics:
- Energy per inference: 2.98 mJ enables ~12.1M inferences per 10 Wh battery (typical smartphone)
- Modeled inference power: 2.98 mJ / 45 ms = 66 mW, excluding the rest of the device and therefore not a guarantee of indefinite operation
- NPU vs. CPU trade-off: CPU fallback replaces the 12 ms, 0.8 mJ NPU inference stage with a 45 ms, 4.2 mJ CPU stage; the full pipeline would rise from 45 ms and 2.98 mJ to about 78 ms and 6.4 mJ before additional system overhead.
- Memory footprint: 150 MB peak (model + activations), competing with app memory
Systems insight: In this illustrative pipeline, the mobile NPU reaches 82 percent utilization at batch size one while the chapter’s batch-one ResNet-50 request keeps the H100 busy only 41 percent of the time even before its tiny per-image arithmetic is counted. The contrast is workload- and hardware-specific, but it shows why a mobile accelerator designed for single-stream execution can operate efficiently without the batches used to amortize a large server GPU.
These physical constraints make edge serving optimization fundamentally different from data-center optimization. Rather than maximizing aggregate batch throughput, the objective is to sustain real-time execution within a tight thermal and battery envelope without triggering hardware throttling or starving foreground applications of system memory.
Traffic pattern summary
Traffic-adaptive batching adjusts the batching window as queue depth and request rate change. The four MLPerf inference scenarios that MLPerf execution scenarios defines map onto these traffic shapes and the batching strategy each favors (table 12). These scenarios are benchmark abstractions rather than deployment prescriptions, so the operative batching policy must still follow the service’s current concurrency, deadline, and power constraints.
| Scenario | Context | Strategy | Focus |
|---|---|---|---|
| Server | Cloud APIs, web services | Dynamic batching with timeout | Window tuning, utilization-latency curve |
| MultiStream | Grouped sensor-like inputs | Joint query processing | Group latency under benchmark rules |
| SingleStream | Mobile apps, embedded devices | No batching (\(\BatchSize= 1\)) | Preprocessing, power efficiency |
| Offline | Batch processing, data pipelines | Maximum batch size | Throughput, hardware utilization |
The examples developed here (cloud API traffic under the Server scenario, grouped sensor inputs motivated by MultiStream, and throughput-dominated pipelines under Offline inference) all decide how requests share the accelerator. Together with the latency budget and the queueing model, they complete one replica of the ResNet-50 service, which is where the chapter’s first half ends. None of them decides how efficiently the accelerator executes each batch once it forms. The same batch of the same model can run several times faster or slower depending on the engine that compiles and schedules its kernels and on the number format it computes in, and those choices are the next lever.
Checkpoint 13.3: Batching and traffic patterns
Batching is the primary lever for serving economics, but the optimal strategy depends on context.
Self-Check: Question
Why can increasing batch size during deep learning inference improve hardware throughput on modern GPUs for weight-streaming workloads, and when does that improvement stop paying off on a Roofline model?
- Batching converts all floating-point operations into integer bitshifts, bypassing GPU ALUs entirely.
- Batching reduces the total parameter count of the neural network by sharing weights across batch samples.
- Batching eliminates PCIe bus data transfer overhead by generating synthetic input tensors on the device.
- Batching increases arithmetic intensity (FLOPs per byte of memory accessed) by reusing loaded weight matrices across multiple input samples, shifting the workload toward the compute ceiling until another limit or saturation is reached.
A video-analytics node receives frames from 6 synchronized cameras that capture simultaneously at 30 Hz. Because these camera frames arrive in synchronized periodic bursts, this represents a ____ arrival process in the traffic taxonomy.
A cloud serving system with an end-to-end latency budget of 50 ms configures a dynamic batcher with
max_batch_size = 32andmax_batch_delay_ms = 20. Under low traffic, requests arrive deterministically 100 ms apart, the worker is idle when each request arrives, and no other requests arrive during any 20 ms batching window. What is the operational impact on latency and batch efficiency?- Every request waits the full 20 ms timeout in the queue and executes as a batch of size 1, incurring the maximum batch-formation delay penalty with zero throughput amortization gain.
- Requests are automatically dropped because the queue fails to reach the maximum batch size of 32 within 50 ms.
- The server achieves peak GPU utilization because small batches execute with sub-microsecond latency.
- The dynamic batcher disables timeouts and waits indefinitely until 32 requests accumulate, preserving throughput at the cost of infinite latency.
13.6 Inference Runtime Selection
Running an unchanged ResNet-50 model through a compiled C++ engine rather than an eager Python interpreter cuts batch-one latency on the reference H100 by more than fivefold, without altering a single weight. Dynamic batching and request scheduling govern how requests are grouped and queued, but an execution engine still has to map the resulting tensor operations onto physical execution units and memory hierarchies. The inference runtime, the software layer that schedules tensor operations and manages device resources, therefore changes both latency and throughput for a fixed model architecture. Runtime engineering proceeds in two steps: selection chooses the execution engine that fits the deployment target, and configuration tunes that engine for the model, hardware, input shapes, and latency budget.
13.6.1 Runtime constraint map
Attempting to deploy a Python-based server runtime onto a 256 KB microcontroller fails before the first request arrives, and exporting a model with custom operators to a mobile neural processing unit (NPU) delegate can silently push unsupported layers back onto the CPU. The deployment target narrows the viable runtime family before any speed comparison matters, and each tier in table 2 rules out entire classes of software. The keyword-spotting microcontroller in Static runtimes for microcontrollers requires a fixed memory arena and a compact C/C++ runtime, whereas a smartphone can host an application runtime that routes supported operators to accelerator delegates and falls back to another path when an operator is missing. Within each target envelope, table 13 lists the candidate runtime families and the conversion or execution condition each candidate must pass before latency or memory numbers can be compared.
| Runtime family | Where it fits | Constraint anchor | Optimization path | Constraint to test |
|---|---|---|---|---|
| PyTorch eager | Research and iteration | Baseline latency; full Python/runtime footprint | Dynamic graphs, eager debugging | Dispatch overhead and missing graph view |
| Compiled PyTorch/TensorFlow | Server training and serving | Workload-dependent gains when graph capture is clean | Graph capture, fusion, layout planning | Operator coverage and graph breaks |
| TensorFlow Lite/Core ML | Mobile and edge inference | Target-specific mobile latency and package-size budgets | Quantization, static graphs, NPU delegates | Target-specific conversion constraints |
| TF Lite Micro/microTVM | Microcontroller inference | Target-specific microcontroller RAM and flash budgets | Static allocation, INT8 kernels | Selected operators and constrained memory |
| ONNX Runtime | Cross-framework serving | Backend-dependent; can match native runtimes for supported graphs | Standard graph format, execution providers | Export gaps and custom-operator fallbacks |
| TensorRT/TVM | Hardware-specialized inference | Target-dependent gains over untuned eager baselines | Kernel fusion, precision lowering, autotuning | Narrower target and conversion assumptions |
A runtime can fit the device and still fail to execute the exported model. Specialized inference runtimes such as TensorRT and Apache TVM require compatible operators and conversion paths; a mobile delegate may support only part of a graph. Unsupported regions can introduce fallback execution and extra transfers. Portability therefore requires an agreement about the graph and operator semantics on both sides of the export boundary.
13.6.2 Runtime ecosystem and configuration
Serving a model directly from the Python interpreter used to train it is the fastest path to a working endpoint, but under production load the interpreter itself becomes the bottleneck: threads contend for the Global Interpreter Lock (GIL), operators launch one by one without whole-graph fusion, and dynamic allocations fragment memory. Engine selection therefore starts with the binding system constraint rather than the training framework. When rapid iteration and full support for dynamic Python control flow or custom operators matter most, PyTorch and TensorFlow models can serve directly through their native runtimes. When interpreter overhead limits throughput, serialized graph formats such as torch.export and TensorFlow SavedModel (with TorchScript supporting legacy deployments) capture a static operator graph for ahead-of-time optimization and multi-threaded C++ execution. Framework-native runtimes prioritize developer flexibility and broad operator coverage, whereas specialized inference engines trade that generality for whole-graph rewrites and lower launch overhead.
General-purpose optimization
The development framework and deployment runtime need not be the same system, but they must exchange a representation both can interpret. The ONNX format addresses this fragmentation by standardizing model exchange across runtimes (ONNX Contributors 2019). A pipeline can train an architecture in PyTorch, export the computation graph to an ONNX intermediate representation, and execute the serialized graph in ONNX Runtime or compile it for a target accelerator. In contrast, TensorFlow Lite relies on its own conversion path, translating TensorFlow SavedModels into FlatBuffers rather than routing through ONNX. Although standard interchange formats reduce manual model conversion between development and production environments, they do not eliminate compatibility testing, operator coverage gaps, or custom-kernel fallback overhead.
The exchange is hub-and-spoke around the common ONNX intermediate representation (figure 7). Training frameworks such as PyTorch, TensorFlow, Keras, Caffe2, MXNet, and CNTK export inward to the shared representation, and ONNX Runtime and other target frameworks load the serialized computation graph outward without reimplementing model code.
Interchange formats mitigate framework fragmentation, but an export boundary cannot salvage an architecture that violates the target’s physical limits. Converting a graph to ONNX or an embedded runtime after development completes cannot resolve an excessive memory footprint, missing hardware operators, or unsupported dynamic control flow. Treating deployment as an afterthought guarantees costly rewrites, which is why hardware and runtime trade-offs need evaluating before the first line of model code is written.
When cross-hardware portability is the binding constraint, ONNX Runtime14 provides an intermediate, hardware-agnostic execution layer (Microsoft 2024). Models export to the ONNX format, after which ONNX Runtime applies target-independent graph optimizations and delegates subgraphs to hardware-specific execution providers. This architecture enables single-format deployment across CPUs, GPUs, and custom accelerator application-specific integrated circuits (ASICs).
14 ONNX Runtime: Microsoft’s inference engine applies graph optimizations such as constant folding, redundant-node elimination, and kernel fusion before handing subgraphs to execution providers. Performance relative to a tuned target-specific engine such as TensorRT depends on the workload, execution provider, and hardware.
Microsoft. 2024. ONNX Runtime: Cross-Platform Inference and Training Machine-Learning Accelerator. GitHub.
Portability still demands profiling operator placement across execution boundaries. If an operation is unsupported by the preferred execution provider, placement depends on the configured provider order and available implementations. A CPU fallback can introduce host-accelerator transfers and synchronization that erode the expected latency advantage; if no provider supports the operation, execution may fail. Profiling must therefore verify provider assignment and operator coverage across the entire graph, not merely confirm that the exported artifact executes without errors.
Specialized inference engines
When latency budgets or serving costs bind more tightly than portability, specialized engines such as TensorRT for NVIDIA GPUs and OpenVINO15 for Intel hardware optimize graphs specifically for target microarchitectures (NVIDIA 2024a; Intel Corporation 2026; Chen et al. 2018). Rather than maintaining portable abstractions, these compilers specialize kernels directly to the hardware’s register files, cache hierarchies, and matrix execution units. A specialized engine such as TensorRT or TVM offers no advantage unless its backend supports the target and its conversion path supports the model (NVIDIA 2024a; Chen et al. 2018), and ONNX reduces the exchange burden without proving either condition (ONNX Contributors 2019).
15 OpenVINO (open visual inference and neural network optimization): An Intel-oriented inference toolkit that converts, optimizes, and runs models across Intel CPU, GPU, and NPU targets (Intel Corporation 2026). Specializing for direct hardware execution departs from the portable execution guarantees of general-purpose frameworks, enabling the compiler to emit architecture-tuned vector instructions (such as AVX-512 or AMX) and exploit low-precision integer execution units. While speedups depend on the specific operator mix and target processor, this specialization can make CPU or edge serving economically viable for latency-sensitive models.
Intel Corporation. 2026. OpenVINO Documentation.
Chen, Tianqi, Thierry Moreau, Ziheng Jiang, Lianmin Zheng, Eddie Q. Yan, Haichen Shen, Meghan Cowan, et al. 2018. “TVM: An Automated End-to-End Optimizing Compiler for Deep Learning.” Proceedings of the 13th USENIX Symposium on Operating Systems Design and Implementation (OSDI ’18), 578–94.
ONNX Contributors. 2019. ONNX: Open Neural Network Exchange.
16 Layer fusion: The term parallels loop fusion in compiler optimization, where adjacent loops over the same array are combined into one pass to reduce memory traffic.
Layer fusion16 is kernel fusion (also called operator fusion) applied when the engine is built. For the convolution \(\to\) batch normalization \(\to\) ReLU block, whose folding Compression-specific fusion derives, the serving compiler performs the fold once, at engine build time, because batch normalization is a fixed affine transform once training ends. It absorbs the normalization into the convolution weights and bias, then fuses the ReLU into the same kernel, so the input feature map is read from HBM once and only the activated result is written back.
↩︎ Kernel fusion, which merges adjacent operations so intermediates stay in registers and on-chip memory instead of round-tripping through HBM, is established in The memory wall and kernel fusion.
Kernel auto-tuning benchmarks and selects the optimal algorithm for each operation on the target microarchitecture. A single 2D convolution can be evaluated through direct convolution, GEMM transformation (im2col), Winograd minimal filtering (efficient for small \(3 \times 3\) filters), or Fast Fourier Transforms (efficient for large spatial filters), alongside dozens of tile-size variations. Because the winning strategy depends on filter dimensions, batch size, and the accelerator’s register and shared memory capacity, the compiler benchmarks candidate implementations against target hardware and caches the lowest-latency kernel, trading ahead-of-time compilation time for predictable serving latency. Together with operator fusion, these optimizations produce substantial speedups over an untuned framework-native baseline, though they require explicit graph compilation and may restrict dynamic tensor dimensions.
Example 13.6: ResNet-50: Runtime comparison
Table 14 applies the chapter’s profile to each engine at batch one on the reference H100, changing one term at a time. The eager row is the reference profile. TorchScript runs the same kernels from a graph executor, removing the per-operation Python dispatch; ONNX Runtime also fuses each convolution with its normalization, activation, and residual add, cutting 174 kernels to 56; TensorRT replays the whole fused pass as one captured graph and then varies only the number format.
Table 14: Inference runtime comparison: Modeled batch-one latency and speedup for ResNet-50 on the reference H100 across PyTorch eager, TorchScript, ONNX Runtime, and TensorRT, from the chapter’s serving profile.
| Runtime | Latency | Speedup | Notes |
|---|---|---|---|
| PyTorch (eager) | 3.53 ms | 1× | Reference profile |
| TorchScript | 1.79 ms | 2× | No per-op Python dispatch |
| ONNX Runtime | 0.61 ms | 5.8× | Fused kernels |
| TensorRT FP32 | 0.38 ms | 9.3× | One graph launch; TF32 |
| TensorRT FP16 | 0.33 ms | 10.6× | FP16 Tensor Cores |
| TensorRT INT8 | 0.30 ms | 11.6× | Requires calibration |
Systems insight: Removing per-operation overhead, not lowering precision, produces most of the batch-one speedup. TensorRT FP32 is already 9.3× faster than eager execution, and INT8 adds only 1.3× over FP32, because once host overhead is gone the per-kernel floor dominates a single image. Precision pays at large batch, where per-image work dominates; INT8 also requires calibration data and NVIDIA-specific deployment.
This optimization-compatibility trade-off governs engine selection. Higher specialization can improve hardware efficiency for supported operations and shapes but increases deployment complexity, restricts dynamic control flow, and may introduce numerical deviations from the training baseline. The engineering choice depends on latency budgets, operational constraints, and how frequently model architectures evolve.
Once an execution engine is selected, configuration tunes its resource allocation to the hardware envelope. For CPU inference, thread pool sizes must match physical core counts: too few threads leave execution units idle, while too many cause CPU cache thrashing, OS scheduling delays, and lock contention across non-uniform memory access (NUMA) domains. For accelerators, static memory preallocation reserves fixed-size activation workspaces during initialization, removing runtime memory allocations (cudaMalloc) and page-table faults from the latency-critical request path. Execution provider priority determines which hardware backend handles each operator subgraph, while graph optimization levels balance build times against constant folding and algebraic simplification. Production deployments must benchmark these configurations across full latency distributions (p50, p99) rather than relying on framework defaults.
13.6.3 Precision selection for serving
On the reference H100, Tensor Cores execute FP16, FP8, and INT8 matrix operations, and each halving of the bytes per value doubles the dense peak rate. For ResNet-50, moving from FP32 to INT8 multiplies large-batch throughput several times over while sacrificing less than 0.4 percentage points of top-1 accuracy. Numerical precision is therefore coupled directly to infrastructure economics. At the serving layer, precision engineering introduces operational constraints: calibration data fidelity, layer sensitivity under live inputs, and dynamic precision dispatch.
↩︎ The quantization techniques this selection draws on, from numerical formats through calibration and quantization-aware training, are established in Numerical Precision: Changing How Values Are Stored.
Precision-throughput relationship
For memory-bandwidth-bound operations, reducing precision raises throughput by cutting the byte volume transferred across the memory bus. Equation 13 gives the bandwidth-only upper bound from precision reduction: \[ \frac{\text{Throughput}_{\text{INT8}}}{\text{Throughput}_{\text{FP32}}} = \frac{32}{8} = 4\times \text{ (theoretical maximum)} \tag{13}\]
Actual speedup depends on the compute-to-memory ratio, operator mix, hardware instruction throughput, and matrix alignment, falling below the bandwidth-only bound whenever arithmetic throughput or memory alignment binds. Low-precision kernels achieve peak arithmetic efficiency only when matrix dimensions align with the accelerator’s warp-level execution tiles (for example, multiples of 8 or 16 elements). When dimensions do not align with hardware tiles, libraries such as cuBLAS and cuDNN pad tensors or fall back to slower execution paths.
↩︎ Tensor Core tile architectures and their matrix-dimension alignment constraints are established in Tensor Cores.
Example 13.7: ResNet-50: Precision trade-offs on the H100
Table 15 compares FP32, FP16, and two INT8 paths for ResNet-50 on the reference H100: batch-one latency for each TensorRT engine of the chapter’s profile, throughput at large batch, weight bytes, and assumed accuracy:
Table 15: Precision trade-offs on the H100: Modeled batch-one latency for each TensorRT engine of the chapter’s profile; large-batch throughput modeled at the sustained fraction for FP32 (on TF32 Tensor Cores) and FP16, and measured by MLPerf Inference for INT8; weight bytes from the registry; assumed top-1 accuracy.
| Precision | Batch-1 Latency | Large-Batch Throughput | Weights | Accuracy | Calibration |
|---|---|---|---|---|---|
| FP32 | 0.38 ms | 15,200 img/s | 102.4 MB | 76.13% | None |
| FP16 | 0.33 ms | 30,400 img/s | 51.2 MB | 76.13% | None |
| INT8 (PTQ) | 0.30 ms | 89,500 img/s | 25.6 MB | 75.80% | 1,000 samples |
| INT8 (QAT) | 0.30 ms | 89,500 img/s | 25.6 MB | 76.05% | Additional training |
Systems insight: At batch one, INT8 is only 1.3× faster than FP32, because the fixed per-kernel cost dominates a single image. At large batch it sustains about 6× FP32’s throughput and loses 0.33 percentage points of accuracy with PTQ. QAT recovers most of that loss but requires retraining.
Integer formats are not the only 8-bit option. On the reference H100, an 8-bit floating-point format (FP8, whose E4M3 layout for weights and activations Numerical Precision: Changing How Values Are Stored introduced) is the natural serving default for transformer workloads. The H100’s dense FP8 peak of 1,979 TFLOP/s is 2× its FP16 peak of 989 TFLOP/s, and each value occupies one byte instead of two. For the chapter’s GPT-2 XL service, FP8 weights shrink from 3 GB to 1.5 GB, which lowers the bandwidth floor on a batch-one decode step from 0.9 ms to 0.45 ms. Because the format keeps a floating-point exponent, it tolerates the wide activation ranges of transformers better than INT8, though it still needs per-tensor scale factors and an accuracy check before deployment.
Precision selection constraints
Quantizing every layer of a network to INT8 indiscriminately, or calibrating scale factors on daytime studio photos before serving nighttime camera feeds, can cost several percentage points of accuracy. Precision selection is constrained by layer sensitivity, calibration data, and runtime policy. Not all layers tolerate reduced precision equally. The error bound of the uniform quantizer, half a quantization step inside the calibrated clipping range plus saturation error outside it (Numerical Precision: Changing How Values Are Stored, with the step from equation 10.1), limits what each layer must absorb. Layer-level output or task error depends on activation distributions and downstream sensitivity, so it must be measured rather than inferred from a universal norm law. This mechanism explains why first convolutional and final classification layers are commonly retained at FP16, while intermediate layers tolerate INT8. Initial layers process low-dimensional raw inputs (such as 3 RGB channels) before representations expand into overcomplete feature spaces that can absorb quantization noise, whereas final classification layers produce raw logits where small numerical perturbations directly shift decision boundaries and alter top-\(1\) predictions.
Post-training quantization adds a data dependency. The calibration dataset determines the clipping thresholds \([\ClippingRangeLowerBound, \ClippingRangeUpperBound]\) and scale factors \(\QuantizationScale\) used for INT8 conversion, requiring it to match the statistical profile of live serving traffic rather than arbitrary training or validation splits. A calibration-serving distribution mismatch causes excessive clipping or underflow, degrading end-to-end task accuracy, an operational pitfall analyzed in section 13.11.
Production serving architectures can also turn precision from a static compilation setting into a dynamic runtime policy. When request queues are shallow and the system operates with ample latency headroom against its service level objective (SLO), the engine can dispatch requests at FP16 to maximize task accuracy. During traffic spikes that threaten queue saturation, the engine can dynamically switch execution to INT8 to preserve latency bounds. Similarly, requests that yield low classification confidence under INT8 can be selectively re-evaluated at FP16, trading a small accuracy margin for lower latency when traffic spikes.
Precision selection carries direct infrastructure sizing consequences. Under the large-batch throughput gain of table 15, 10 GPUs at INT8 offer the same aggregate saturated capacity as about 59 GPUs at FP32. Equal capacity does not establish equal queueing latency; service-time distributions, batching policy, and failure reserve must still satisfy the same SLO. Precision engineering is therefore an infrastructure sizing discipline, directly coupling numerical representation to cluster capital expense and energy consumption. Yet configuring the runtime and numerical bit width addresses only the model level; achieving low-latency serving in production requires optimizing the host-to-device boundaries within the physical server node itself.
Self-Check: Question
An ML systems team is deploying a transformer-based ranking model on NVIDIA data center GPUs. They consider running the raw PyTorch model in eager Python mode versus compiling the model into an optimized NVIDIA TensorRT engine. Which graph-level serving optimization is TensorRT designed to apply more aggressively than an unoptimized eager execution path?
- TensorRT automatically converts the supervised classification task into an unsupervised reinforcement learning policy.
- TensorRT trains additional adapter layers during live request serving to adapt to data drift.
- TensorRT eliminates all GPU memory usage by running inferences exclusively in the CPU instruction cache.
- TensorRT performs aggressive vertical and horizontal operator fusion (e.g., combining Conv/MatMul, BiasAdd, and Activation into a single kernel), reduces redundant memory round-trips, and selects hardware-tuned kernels.
Why can quantizing a model’s weights and activations from FP16 to INT8 for GPU serving increase throughput, what limits the gain, and what role does Post-Training Quantization (PTQ) calibration play in preserving accuracy?
True or False: In deep neural network quantization, when sensitivity evaluation identifies particular layers as unusually vulnerable to precision loss, preserving those layers in FP16/FP32 while quantizing the remaining bulk layers to INT8/INT4 can preserve model accuracy in mixed-precision serving.
When deploying models to edge devices with Apple Silicon (such as iPhones and iPads), developers export models to the ____ framework to take full advantage of the dedicated Apple Neural Engine (ANE) hardware accelerator.
When calibrating an INT8 quantized model using Post-Training Quantization (PTQ), what is the primary danger of using a synthetic or unrepresentative calibration dataset (e.g., ImageNet validation images for a medical endoscopy model)?
- The activation dynamic ranges and outlier distributions in production may be misrepresented by the calibration dataset, causing clipping of real-world features or overly coarse quantization scales that degrade serving accuracy.
- The model compiler will fail to generate valid GPU assembly code and reject the weights.
- The server’s physical power consumption will double due to misaligned integer registers.
- The dynamic batcher will permanently lock its batch size to 1.
13.7 Node-Level Optimization
The reference ResNet-50 request spends 3.5 ms in the forward pass and 8.6 ms end to end. Once a compiled engine shrinks the forward pass to the modeled 0.33 ms, preprocessing alone accounts for 83 percent of what remains. An isolated model benchmark hides exactly these costs, because they sit on the host: JPEG decoding on CPU cores, copies across the PCIe bus, and the driver work that launches each kernel.
Runtime selection and precision tuning operate at the model level, determining what computation runs and what numerical format it uses. Between the model graph and the silicon, however, lies an execution layer encompassing graph compilation, bus transfers, and CPU-accelerator coordination. Node-level optimization targets this complete end-to-end request path on concrete hardware, eliminating overhead between the network socket and accelerator execution units across four primary physical boundaries:
- Graph-to-kernel boundary: Translating computation graphs into numerous fine-grained kernel launches incurs driver serialization overhead and forces intermediate tensors through device HBM. Graph compilers fuse adjacent operations into composite kernels that preserve intermediate activations in on-chip SRAM or register files.
- Host-accelerator boundary: Accelerators sit idle when the host processor fails to enqueue work ahead of execution. Unpipelined copies across host-device interconnects (such as PCIe) and blocking synchronization calls stall accelerator compute pipelines.
- CPU execution boundary: Host preprocessing pipelines and CPU-based inference degrade when executed through interpreted scalar code rather than vectorized single instruction, multiple data (SIMD) instruction units and NUMA-local memory allocations, and when operating-system noise preempts the threads that feed the accelerator.
- Storage and deserialization boundary: Initializing serving replicas requires streaming weight tensors from persistent storage into host memory. Formats requiring recursive object deserialization bottleneck CPU execution, creating cold-start latency spikes that impede autoscaling. This boundary governs how quickly a replica starts rather than how fast it serves, so section 13.8.2 develops it with the rest of model loading.
Each boundary represents a distinct physical constraint where execution stalls on memory bandwidth, bus transit, or control overhead rather than peak arithmetic throughput. The subsections that follow cross these boundaries from the accelerator outward—from runtime graph compilation and host-to-accelerator execution pipelines to CPU locality, model loading, and multi-model memory sharing.
13.7.1 Runtime graph compilation
Crossing the first of those boundaries—the graph-to-kernel interface—without compilation leaves the host CPU submitting tiny kernels one operator at a time across a 32-layer transformer or 50-layer convnet, often spending more time in the driver than the GPU spends on the math. Specialized inference engines (section 13.6) beat eager framework baselines because serving workloads run fixed operator graphs over bounded input shapes. When the operator sequence and tensor dimensions are known before live traffic arrives, compilers move graph optimization from the per-request critical path to offline deployment preparation.
The whole-graph rewrites that make this shift pay are the ones the specialized engines apply at build time. Kernel fusion and the batch-normalization fold of section 13.6.2.2, the canonical case of compile-time constant folding, remove launches and intermediate-memory traffic from every request. Static memory planning (Memory planning) reuses one preallocated arena for tensors whose lifetimes do not overlap, which keeps allocator calls off the request path. In a serving trace, repeated launch overhead and intermediate-memory traffic point to missing fusion, and allocation stalls on the request path point to a missing memory plan.
Beyond memory planning and kernel fusion, static execution paths can use CUDA Graphs, the replay of a captured sequence of kernel launches that Graph capture and JIT compilation developed. Each eager submission pays the 5–20 \(\MicroUnitPrefix\text{s}\) of host launch work quantified in section 13.5.1, and total submission cost depends on the executed kernel count, not the number of layers. A decode step launching 8 to 10 sub-kernels across each of 32 transformer layers can accumulate several milliseconds of host submission work, longer than the accelerator needs for the tensor math at small batch sizes. Serving systems therefore capture the graph during warmup, once per supported batch size because replay requires static shapes and fixed buffer addresses, and dispatch it during live inference with a single driver invocation (illustratively \(\sim 5\,\MicroUnitPrefix\text{s}\), depending on the graph, driver, and hardware). Replay removes repeated host submission work without eliminating device execution costs.
Systems Perspective 13.4: Compilation timing trade-off
Just-in-time compilation defers graph optimization until the runtime engine observes concrete input shapes and execution paths. This runtime visibility enables aggressive kernel specialization for dynamic control flow and variable sequence lengths, but it injects compilation overhead directly into the serving path, generating multi-second latency spikes on early requests.
Ahead-of-time compilation executes graph analysis, kernel fusion, and hardware-specific auto-tuning prior to deployment. Pre-building removes the covered compilation work from the request path, but weights, device contexts, allocations, and representative execution paths still require loading and warmup. The compiled engine remains constrained to its supported shape profiles and may require padding or multi-profile compilation to accommodate dynamic input sizes.
13.7.2 Deterministic latency and resource isolation

Noisy neighbors stretch identical forward passes unevenly, widening the tail.
Compilation fixes what the accelerator executes; it does not control how steadily the host feeds it. The server shares its host with other work. On a single host, the operating system multiplexes hardware across background telemetry daemons, logging agents, and kernel worker threads. When these unisolated processes contend for execution resources, they intermittently preempt the inference pipeline. These noisy neighbors are a primary source of latency jitter, where the physical time required to execute identical forward passes fluctuates unpredictably. This contention inflates 99th percentile (p99) tail latency even when average hardware utilization remains low. Resource contention thus widens tail latency through service-time variance, a physical degradation distinct from the queuing-delay accumulation along the saturation knee plotted in figure 5.
Keeping latency predictable requires isolating the serving process from the operating system’s default time-sharing scheduler. Serving systems such as Clockwork demonstrate that deep neural network (DNN) inference execution times can be predictable down to sub-millisecond tolerances under their controlled workload and hardware conditions (Gujarati et al. 2020). CPU affinity (thread pinning) establishes the baseline compute boundary by binding inference worker threads to designated physical cores. Without pinning, the OS scheduler periodically migrates threads between cores, losing access to warm private L1 and L2 cache contents and requiring lines to be refetched from shared L3 cache or DRAM. On multi-socket architectures, thread migration across NUMA boundaries is even more penalizing. Accesses to memory left on the previous socket cross inter-socket interconnects, adding tens of nanoseconds of latency per transaction. Pinning threads to specific cores and binding their memory allocations to local NUMA nodes reduces migration-related cache misses and remote-socket memory traffic.
Gujarati, Arpan, Reza Karimi, Safya Alzayat, Wei Hao, Antoine Kaufmann, Ymir Vigfusson, and Jonathan Mace. 2020. “Clockwork: Predictable and Scalable DNN Inference in the Cloud.” USENIX Symposium on Operating Systems Design and Implementation (OSDI), 443–62.
Even with pinned CPU cores, memory access latency remains vulnerable to the virtual memory subsystem. Under host memory pressure, the kernel can page inactive address ranges out to disk. When the CPU touches a paged-out address, execution can stall for milliseconds while the page returns to DRAM. Host buffers used for PCIe DMA also need resident, registered backing pages during the transfer. Memory locking (mlock) instructs the kernel to pin specified virtual address ranges into physical host RAM, preventing page eviction for host-resident weights, input staging buffers, and offloaded key-value (KV) cache blocks. This removes eviction-related page faults at the cost of host memory flexibility; locked pages remain resident until unlocked, while cache misses and memory contention can still delay access. Because mlock operates strictly on host page tables, it does not apply to accelerator HBM, which is allocated directly by the accelerator driver.
Beyond scheduled processes, asynchronous hardware interrupts introduce another source of sub-millisecond preemption. When a network interface card (NIC) receives packet bursts, it triggers hardware interrupt requests (IRQs) that force the handling CPU core to immediately suspend user-space execution and process kernel interrupt handlers. If the OS routes these interrupts to cores running the inference engine’s submission loop, the CPU pauses command dispatch to the accelerator. Because GPUs process short inference layers in microseconds, even brief CPU submission stalls drain the accelerator’s hardware command ring buffer, causing pipeline bubbles where compute units sit idle waiting for the next kernel descriptor. Interrupt shielding restricts IRQ affinities to dedicated housekeeping cores, reducing preemption of the GPU dispatch thread by those device interrupts.
Isolating physical cores, locking host memory, and shielding interrupt lines reduce specific sources of operating system noise, though the resulting service-time distribution still needs measurement under the intended load. Thus far, isolation has treated the host as a predictable partner that feeds a discrete accelerator; when deployment constraints or workload profiles dispense with the accelerator altogether, the host CPU becomes the executor itself.
13.7.3 CPU inference optimization
For a small fraud-detection or ranking model evaluated at batch size one, copying a single request across PCIe and launching GPU kernels through the driver can take longer than running the forward pass directly on the host processor. Deploying inference on CPUs therefore remains practical for lightweight models, sparse or bursty request streams that cannot saturate an accelerator, and services where host-to-device transfer time exceeds the math time. Yet an untuned Python CPU path leaves most of the processor’s silicon idle. Modern server CPUs17 (such as Intel Xeon and AMD EPYC) include wide SIMD vector registers and matrix units (AVX-512 and AMX), which specialized runtimes such as OpenVINO target by tiling matrix operations across L1/L2 caches and emitting packed fused multiply-add (FMA) instructions (Intel Corporation 2026).
17 SIMD: From Michael Flynn’s 1966 taxonomy of computer architectures, SIMD enables one instruction to operate on multiple data elements simultaneously. Intel’s AVX-512 can process sixteen FP32 values in a 512-bit vector, while AMX adds matrix tile operations. The attainable fraction of peak depends on data type, matrix shape, memory behavior, and implementation, but optimized vector kernels provide multiple-fold speedups over scalar execution.
The NUMA boundaries that thread pinning respects matter more when the CPU itself runs the model. Memory controllers are physically distributed across CPU sockets and linked by coherent interconnects (such as Intel UPI or AMD Infinity Fabric). Accessing memory attached to a remote socket incurs substantially higher latency and lower bandwidth than local channel access. An inference server must maintain NUMA awareness. Worker threads must be pinned to dedicated physical cores, and the weight tensors and request buffers those threads touch must reside in memory nodes local to that socket. Because model weights, at hundreds of megabytes to tens of gigabytes, routinely exceed per-socket L3 cache capacities, every forward pass streams weights from main RAM. Mismatched socket allocations force continuous weight streaming across the slower inter-socket interconnect, creating severe tail-latency degradation.
For lightweight models evaluated at batch size one, a CPU frequently outperforms a discrete GPU. When an accelerator processes an isolated request, the fixed overhead of transferring inputs across the host PCIe bus (several microseconds), driver queue serialization, and kernel launch overhead (5–20 \(\MicroUnitPrefix\text{s}\) per kernel) can easily surpass the arithmetic execution time. The CPU processes the request directly in local cache without bus transfers or driver queue delays. Determining the operational crossover requires empirical measurement across model architecture, arithmetic intensity, batch size, and latency constraints.
13.7.4 Profiling the serving node
Finding that crossover—or diagnosing why an accelerator-backed node misses its p99 target while average GPU utilization sits below 30 percent—requires inspecting where each request actually waits across the host and device. The top-down profiling method of Identifying Bottlenecks applies unchanged to a serving node, where the objective is useful throughput that meets the latency SLO. The duty-cycle metric defined in equation 2 helps locate idle intervals, but active time alone does not measure arithmetic efficiency or prove adequate queueing headroom. Timeline profilers, such as PyTorch Profiler and NVIDIA Nsight Systems (nsys), record concurrent CPU threads, OS runtime calls, memory transfers, and GPU hardware queues along a synchronized timeline.
Serving traces show three recurring signatures:
- Idle compute bubbles: White space on the GPU execution track indicates hardware starvation. Compute warps idle while waiting for the host CPU to complete request preprocessing (e.g., tokenization or image decoding), page faults during on-demand weight paging, or blocking inter-thread synchronization.
- Kernel launch fragmentation: A sequence of micro-kernels, each executing in under 5–10 \(\MicroUnitPrefix\text{s}\), suggests launch overhead as a candidate. Host launch timing and gaps between device kernels reveal whether submission starves the GPU; if so, graph capture or legal fusion may help.
- Interconnect transfer stalls: Synchronous
MemcpyHtoDblocks on the primary CUDA stream indicate unpipelined host-to-device data movement. Overcoming this stall requires allocating page-locked (pinned) host memory and executing asynchronous transfers on dedicated copy streams to overlap bus transit with concurrent accelerator execution on preceding requests.
Example 13.8: The profiling loop
Scenario: An inference serving node reports high p99 tail latency despite low average GPU compute utilization.
Diagnosis: Timeline profiling (Nsight Systems/PyTorch Profiler) reveals large idle gaps between tiny GPU kernels caused by CPU host-side preprocessing bottlenecks and kernel launch overhead.
Systems lesson: Serving node optimization requires empirical timeline profiling. Iteratively identifying trace bottlenecks (kernel launch overhead, host-device copy stalls) guides targeted optimizations like kernel fusion and pinned memory.
Table 16 summarizes representative node-level optimization techniques alongside their primary target metrics and engineering costs. The table serves as a decision matrix rather than an exhaustive checklist. Engineering effort should be directed exclusively to the row that addresses the binding bottleneck identified on the measured execution trace.
| Technique | Target Metric | Illustrative Gain | Implement. Cost | Best For |
|---|---|---|---|---|
| Kernel Fusion | Latency & Throughput | 2–5\(\times\) | Medium (Compiler) | Memory-bound layers |
| INT8 Quantization | Throughput | 3–4\(\times\) | High (Calibration) | Inference-heavy nodes |
| Graph Compilation | Latency | 1.5–3\(\times\) | Low (One-line) | Static graph models |
| Zero-Copy Loading | Startup Time | 10–50\(\times\) | Low (File format) | Autoscaling/Cold Start |
| CPU Pinning | Tail Latency (p99) | 20–50% reduction | Low (Config) | Latency-critical apps |
This diagnostic hierarchy ensures engineering resources address structural bottlenecks along the entire request path rather than applying isolated micro-optimizations. A four-level audit checkpoint structures this prioritization from external service boundaries down to device kernels.
Checkpoint 13.4: The optimization hierarchy
Optimizing inference follows the request path from the outside in across four structural levels:
A node tuned this way runs each request near its physical limit, but only once it is running. The compiled engine that makes the steady state fast took tens of seconds to build, its weights must cross storage, host memory, and the PCIe bus before the first request arrives, and its preprocessing must match what training used. How a replica reaches that steady state, and whether it computes what training computed once there, decides whether the fast node is also a correct and available one.
Self-Check: Question
In a CPU-based model serving deployment, how do vector and matrix extensions such as AVX-512 vector registers and Advanced Matrix Extensions (AMX) tiles accelerate inference throughput compared to standard scalar x86 execution?
To reduce OS scheduler thread migration and cross-socket memory traffic on multi-socket CPU serving nodes, engineers pin worker threads to dedicated physical cores and place each worker’s weights in the memory attached to the same socket, making the server ____-aware.
Order the iterative steps of an end-to-end performance profiling workflow for diagnosing an inference serving bottleneck:
- Inspect timeline traces (e.g., via Nsight Systems or PyTorch Profiler) to identify gaps, CUDA stream stalls, CPU-GPU synchronization, and memory bandwidth utilization
- Implement targeted optimization (e.g., kernel fusion, precision reduction, or CPU pipelining) on the identified bottleneck stage
- Establish a reproducible baseline by driving realistic synthetic load with an open-loop load generator and measuring latency percentiles (p50, p99)
- Re-benchmark under identical load to verify latency reduction and ensure model prediction accuracy remains intact
- Identify the binding bottleneck category (Compute-bound, Memory-bandwidth-bound, or Host/Pipeline-bound)
True or False: In Ahead-of-Time (AOT) graph compilation, operator fusion is restricted to combining adjacent layers of the exact same mathematical type (e.g., fusing two consecutive Conv2D operations).
When profiling a GPU inference server under high load, an engineer sees
nvidia-smireport 95%utilization.gpu, but a detailed profile over the same period shows low achieved FLOP rate and many kernels stalled on memory or synchronization. What best explains the discrepancy?nvidia-smimeasures fan speed and ambient temperature rather than compute kernel activity.- The GPU memory clock is automatically halved during Nsight Systems tracing.
- The CPU is running at 100% duty cycle, which forces
nvidia-smito report false GPU metrics. nvidia-smireports the fraction of sampled time with one or more kernels active on the GPU, not how efficiently those kernels used the compute units.
13.8 Model Loading and Versioning
In a representative deployment, a newly provisioned replica needs 35 seconds before it can answer its first request, most of them spent compiling a TensorRT engine, while a subtle PIL-to-OpenCV preprocessing discrepancy silently costs five percentage points of classification accuracy. Every optimization so far assumed a replica that is already running and that computes the function training produced; both assumptions fail at the edges of a replica’s life. Cold start delays the moment a new replica becomes useful, so it is controlled by how weights are loaded, cached, and shared across the models and versions that occupy one machine. Skew corrupts every prediction a correctly running replica makes, so it is prevented by keeping training and serving transformations identical; serving is where its symptom appears. The path below follows a replica from storage to a warmed engine, then to the several models and versions one machine may host, and ends with that symptom.
13.8.1 Cold start and initialization dynamics
When an autoscaler spins up a new serving container during a traffic surge, that replica cannot answer a single request until its weights are loaded into memory, its execution graph is compiled, and its device buffers are initialized (Romero et al. 2021). This startup delay, known as cold start, governs how quickly a service recovers from node failures or scales out into a spike.
Romero, Francisco, Qian Li, Neeraja J. Yadwadkar, and Christos Kozyrakis. 2021. “INFaaS: Automated Model-Less Inference Serving.” 2021 USENIX Annual Technical Conference (USENIX ATC 21), 397–411.
Definition 13.4: Cold start
Cold start is the initialization latency incurred when starting a new model replica.
- Significance: It represents the fixed startup cost of loading weights, compiling graphs, and allocating buffers, which can take seconds or minutes and block elastic scaling during traffic bursts.
- Distinction: Unlike inference latency \((\InferenceLatency)\), which is a per-request cost, cold start is an initialization cost paid when a replica or model instance is created, including deployment, scale-out, recovery, and on-demand model loading.
- Common pitfall: A frequent misconception is that cold start is “just loading weights.” In reality, it includes graph compilation and memory allocation, which can often take longer than the bandwidth-limited data transfer itself \((\DataVolume/\Bandwidth)\).
Total cold-start latency compounds across four physical operations along the initialization path: weight loading streams serialized parameters from persistent storage across the network or host I/O subsystem into host memory and then across the PCIe bus into GPU HBM, after which graph compilation lowers the framework computational graph into device-specific machine code by fusing operators and auto-tuning matrix multiplication kernels for the target accelerator. Once the compiled graph is ready, memory allocation reserves device arenas for activation scratchpads and intermediate buffers, and warmup18 execution runs synthetic inferences to populate kernel caches, prime framework memory allocators, and complete any remaining lazy initialization before live traffic arrives.
18 Warmup: Borrowed from just-in-time (JIT) compilation, where initial executions compile hot paths into optimized machine code; for ML serving, warmup inferences trigger CUDA kernel compilation, cuDNN algorithm auto-tuning, and memory pool allocation that frameworks defer until first use.
NVIDIA. 2026a. Lazy Loading: CUDA Programming Guide.
Establishing a CUDA context represents the first fixed cost on the device initialization timeline. Before launching any GPU kernel or allocating device memory, the runtime must instantiate a driver-level context: an internal control structure that manages virtual address spaces, loaded kernel binaries, and hardware event queues. Creating this context requires synchronous communication with the kernel-mode driver and allocates tens to hundreds of megabytes of device memory for bookkeeping. The 0.3–0.5 s range in table 17 reflects a typical data center environment; while CUDA lazy loading defers kernel module loading to shorten this initial pause, it merely defers that latency penalty to the first executed inference (NVIDIA 2026a).
In multi-process serving deployments where multiple worker processes share a single accelerator, replicating individual CUDA contexts wastes both memory capacity and initialization time. CUDA Multi-Process Service (MPS) coordinates concurrent work from multiple client processes, reducing scheduling overhead when individual processes underuse the device (NVIDIA 2026d). Its isolation behavior depends on the architecture. Pre-Volta clients shared a GPU address space; Volta clients retain separate GPU address spaces and contexts while their kernels can execute concurrently. Separate address spaces do not provide hard fault containment. A fatal GPU fault can affect other clients sharing the affected GPU, so the serving design must budget for correlated replica failures.
NVIDIA. 2026d. NVIDIA CUDA Multi-Process Service.
Example 13.9: ResNet-50: Cold start timeline
Table 17 traces the per-phase duration of a ResNet-50 cold start:
Table 17: ResNet-50 cold start timeline: Illustrative per-phase durations for weight loading, CUDA context creation, TensorRT compilation, and warmup, with totals for the optimized local case and the first-deploy cloud case showing where the dominant cost lives.
| Phase | Duration | Notes |
|---|---|---|
| Weight loading (SSD) | 0.5 s | 98 MB FP32 weights from local storage |
| Weight loading (S3) | 3–5 s | Network latency dominates for cloud storage |
| CUDA context | 0.3–0.5 s | GPU driver initialization and memory setup |
| TensorRT compilation | 15–30 s | Converts PyTorch model to optimized engine |
| Warmup (10 inferences) | 0.2 s | Triggers remaining lazy initialization |
| Runtime overhead | 0.4 s | Process startup, framework hooks, and runtime setup |
| Total (local, optimized) | ~1.5 s | With precompiled TensorRT engine, warm container |
| Total (cloud, first deploy) | ~35 s | Including compilation from cold state |
Systems insight: Precompiling models and storing the optimized engine eliminates the 30-second compilation phase on subsequent deployments.
Without warmup, the first live request absorbs deferred JIT compilation, driver memory allocation, and kernel launch overhead. A request whose steady-state forward pass takes 3.5 ms can stall for hundreds of milliseconds during an unmitigated cold start, violating strict SLOs. Controlling this initialization overhead requires systematic selection among storage, memory, and runtime loading strategies.
13.8.2 Loading strategies and serialization formats
Once precompilation removes the 30-second compiler step from table 17, weight loading becomes the largest remaining term in the startup budget, and how the server schedules that read trades cold-start duration against first-request latency and memory footprint. The simplest approach, full loading, reads the entire model into memory before the server marks itself ready. This maximizes steady-state inference speed because all weights are resident in memory, but it stretches cold-start time and restricts model size to available memory. A second strategy, lazy initialization, defers compilation and allocation until first use. This minimizes startup time but shifts latency to the first request, so production systems often combine lazy initialization with synthetic warmup requests to trigger initialization before real traffic arrives.
Autoscaling systems operate as closed-loop controllers that provision or deprovision serving replicas in response to traffic demand. During demand surges, cold-start latency governs how rapidly new replicas become ready to serve traffic. For multi-gigabyte models, cold-start duration is heavily dominated by streaming serialized model weights from persistent storage into host memory. The architectural choice of serialization format determines whether this stage is bounded by storage read bandwidth or by CPU parsing overhead.
Legacy PyTorch checkpoints loaded via torch.load() package weights within a zip archive containing pickle-encoded object metadata. Deserializing a pickle file forces the CPU to interpret a stream of serialization opcodes sequentially, allocating individual Python objects (dictionaries, metadata wrappers, and tensor headers) and potentially copying tensor bytes into newly allocated memory. Restricted loading modes reduce arbitrary code execution risks, while memory-mapped options can avoid some eager copies. Whether parsing or storage dominates depends on the checkpoint, loading path, and hardware.
A tensor-oriented format19 bypasses interpreter-driven object construction. Safetensors organizes checkpoints with a lightweight header containing tensor metadata followed by contiguous, uncompressed tensor byte buffers aligned to memory boundaries. Because the on-disk binary layout mirrors the in-memory array layout, the runtime can use memory mapping (mmap(2)), which maps file blocks directly into the process’s virtual address space. Virtual memory pages fault into host RAM on access or are prefetched sequentially by the operating system, reducing Python object reconstruction and avoiding eager user-space tensor copies on the mapped path. Mapping shortens apparent startup, but a dense model eventually touches nearly all of its weights, so deferred page faults can move loading latency into early requests. The benefit is greater for sparsely accessed components or model repositories that load subsets on demand; latency-sensitive services still prefault or warm the pages needed on the request path. On systems with discrete accelerators, transferring these tensors across PCIe or NVLink is still required before computation begins, so memory-mapped host loading reduces CPU reconstruction costs without eliminating page faults, storage reads, or device initialization.
19 Safetensors: The name emphasizes safety: unlike unrestricted pickle deserialization, the format does not encode executable Python objects (Hugging Face 2026). It stores tensors as contiguous raw bytes with a small header and supports memory-mapped loading. In the local benchmark example, that path is 10× faster than the compared PyTorch checkpoint path; the result is workload- and storage-specific and does not include transfer to a discrete accelerator.
Hugging Face. 2026. Safetensors Documentation.
Example 13.10: Loading speed: Safetensors vs. Pickle
Scenario: A serverless inference replica loads a 5 GB model checkpoint during cold-start scaling events.
Diagnosis: PyTorch torch.load() (Pickle) requires CPU object reconstruction, taking 15 s to initialize. Safetensors memory-mapping bypasses CPU parsing, loading weights in 1.5 s (10× faster).
Systems lesson: Tensor-oriented, memory-mapped formats can reduce CPU reconstruction and eager-copy overhead during cold start. Storage throughput, page faults, runtime initialization, and accelerator transfer still remain in the scale-out budget.
13.8.3 Model caching infrastructure
Production systems also cache model weights at the infrastructure level to shorten cold start, and the right cache follows how often the model changes. Embedding the weights in the container image yields a single deployment artifact with no network fetch at startup, but images of 10–50 GB slow every container pull, so the approach suits models that rarely update. A shared filesystem of versioned weights lets many replicas read one copy without rebuilding images, at the price of network latency in every cold start and a new availability dependency; it still requires an explicit, atomic version switch so that files never change underneath a live replica. Node-local SSD caching prepopulates Non-Volatile Memory Express (NVMe) drives on inference nodes with frequently used models and loads at several GB/s without the network, but it needs its own refresh policy as models update. Which versions those caches hold, and how a new version replaces an old one in production, belongs to the release process of Model deployment.
13.8.4 Multi-model serving
Dedicating an entire GPU to each regional model, A/B candidate, or ensemble stage leaves most of the fleet idle whenever traffic to individual models is uneven, yet packing several models onto one GPU without coordination risks out-of-memory crashes and noisy-neighbor latency spikes. Production systems therefore share a single machine across multiple models, making GPU memory capacity and bandwidth isolation the primary constraints. How a server manages that shared memory depends on whether models fit in VRAM simultaneously. When the combined footprint exceeds device capacity, time-multiplexing loads one model at a time and swaps weights on demand as routing changes, keeping implementation simple at the cost of swap latency. When several models fit together, memory sharing partitions GPU memory among them so that more models remain resident without swapping, even though each model receives a smaller concurrency budget. Across both regimes, model virtualization—as implemented by frameworks like Triton—decouples model lifecycle from application code by exposing repository and control APIs that load, unload, and version models dynamically (NVIDIA 2024b, 2026c, 2026b). Which policy wins depends on the arrival mix: steady traffic across models favors keeping them concurrently resident, whereas bursty, model-specific traffic favors time-multiplexing with explicit preloading to balance average latency against GPU utilization.
NVIDIA. 2026c. Model Repository: NVIDIA Triton Inference Server.
NVIDIA. 2026b. Model Management: NVIDIA Triton Inference Server.
Partitioning one GPU across models
When multiple models or multiple instances of the same model must run concurrently on a single GPU, the hardware must partition resources between them. NVIDIA’s Multi-Instance GPU20 technology enables hardware-level isolation, dividing a data-center GPU such as the H100 into up to seven independent GPU instances, each with dedicated memory and compute resources (NVIDIA 2026e). On GPUs without MIG, CUDA stream scheduling permits overlapping or time-multiplexed work without hardware partitioning. The choice depends on whether consistent latency with MIG or maximum utilization with shared streams is the priority.
20 MIG (multi-instance GPU): Introduced with NVIDIA’s A100 (NVIDIA Corporation 2020) and documented across supported data-center GPUs (NVIDIA 2026e), MIG partitions a single physical GPU into independent instances, each with dedicated compute and memory resources; unlike software sharing (MPS or time-slicing), MIG provides hardware-level isolation between partitions. The trade-off is granularity, because partitions must follow fixed profiles, so resources cannot be divided arbitrarily. For multi-model serving, MIG reduces noisy-neighbor risk on shared hardware, while per-model SLO guarantees still depend on scheduler policy, load, and the selected partition profile.
NVIDIA Corporation. 2020. NVIDIA A100 Tensor Core GPU Architecture. NVIDIA Whitepaper, V1.0.
NVIDIA. 2026e. NVIDIA Multi-Instance GPU User Guide.
Model swapping and host memory
When the aggregate size of all models exceeds GPU memory capacity, the serving system must swap models between host dynamic random-access memory (DRAM) and device memory (VRAM) on demand. This introduces a new latency component determined by the PCIe bus bandwidth. For a 10 GB model on PCIe Gen4 x16 (32 GB/s theoretical bandwidth), loading takes at least 312.5 ms before deserialization, graph setup, or warmup. This raw transfer latency dwarfs a tight service-level objective such as a 50 ms deadline by more than \(6\times\), rendering on-demand model swapping unviable on the interactive request path.

Model loading lands far outside a tight serving SLO.
To accelerate this transfer path, systems keep the weights in pinned memory (page-locked host RAM). The GPU’s DMA copy engines require the source pages to stay at fixed physical addresses for the whole transfer, but ordinary heap memory is pageable, and the operating system may relocate or swap its pages at any time. A transfer from a pageable buffer therefore takes two stages: the CPU first copies the data into a pinned staging buffer, and the DMA engine then moves that buffer across PCIe. Allocating model weights with cudaHostAlloc removes the CPU staging copy; achieved bandwidth still depends on transfer size, memory locality, and contention. What serving adds is a capacity trade-off. Pinned memory cannot be paged out or reclaimed by the OS under memory pressure, so every pinned model holds its share of physical host RAM until it is released. High-throughput serving systems therefore pin active model weights and I/O ring buffers while leaving standby model checkpoints in pageable memory.
↩︎ Pinned memory and the DMA staging copy it avoids are established in Frameworks as the operating system interface.
13.8.5 Training-serving skew
↩︎ Training-serving skew and the consistency imperative it violates are established in Training-serving consistency.
Loading the exact checkpoint that training produced still does not guarantee that the server computes the same function if the host pipeline transforms raw inputs differently before those weights ever run. A model that performed well during validation degrades silently in production whenever training-serving skew causes the two paths to compute different features from the same raw input while every latency and error-rate dashboard stays green. The consistency requirement belongs to the data pipeline; serving is where a violation surfaces, and because the divergence is measurable on identical inputs without labels (principle 11), it is also one of the most preventable failures. Training-serving skew: Diagnosis and prevention catalogs the skew categories and the method that detects each. The serving-specific manifestation of skew is preprocessing divergence: the real-time inference pipeline processes raw data differently than the batch training pipeline, a common failure mode when training uses Python/Pandas while serving uses C++/Java or optimized inference servers.
Example 13.11: ResNet-50: Image preprocessing skew
Scenario: ResNet-50 vision serving models experience silent prediction accuracy degradation between offline training and online serving pipelines.
Diagnosis: The serving pipeline implemented C++/OpenCV preprocessing (cv2.INTER_LINEAR, BGR order) while training used Python/PIL (PIL.BILINEAR, RGB order, different normalization constants).
Systems lesson: Preprocessing divergence causes silent training-serving skew without raising runtime exceptions. Standardizing data transformation pipelines across training and serving environments prevents input distribution corruption.
A replica that loads quickly, runs predictably, and computes what training computed completes fixed-output serving. Every workload so far, however, has treated a request as one completed prediction. The fastest-growing category of serving workloads violates this assumption entirely. Large language models generate outputs token by token, with each token depending on every previous one. A single request may produce hundreds or thousands of tokens over seconds of elapsed time, yet must feel responsive from the first token onward. The shift from fixed-output to variable-length, streaming-output serving reopens each tool developed so far, from the latency budget to the runtime.
Self-Check: Question
A computer vision team trains a ResNet-50 model in PyTorch using torchvision’s PIL-based bilinear image resizing. In production, high-throughput C++ inference servers use OpenCV’s
cv::resizewith default bilinear interpolation. On matched input images, the team observes different preprocessed tensors; when they rerun evaluation with the training preprocessing path, the original accuracy returns. What phenomenon is causing this degradation, and what is the proper engineering solution?- Training-serving skew caused by subtle implementation differences in resize anti-aliasing and pixel coordinate rounding between PIL and OpenCV; the solution is using shared or parity-verified preprocessing across training and serving, such as a common library or exportable graph when supported.
- Accelerator thermal throttling caused by high frame rates; the solution is downclocking the GPU Tensor Cores.
- Floating-point precision drift between Python and C++; the solution is switching all production inference to 64-bit double precision.
- Catastrophic forgetting in the weights caused by static batching; the solution is retraining the model with dynamic dropout.
Why does simply copying model weights into GPU HBM upon container startup fail to prevent latency spikes on the very first incoming user requests, and how does executing a ‘warmup pass’ resolve this issue?
Sequence the stages of an illustrative serial cold-start initialization workflow when autoscaling an inference server pod from an idle state to serving live production traffic:
- Initialize device context or runtime state needed before host-to-device copies, then transfer model weights from host staging memory to GPU High-Bandwidth Memory (HBM) over PCIe
- Fetch model checkpoint artifacts and configuration from remote object storage (e.g., S3) to local NVMe SSD cache
- Initialize remaining execution-engine state, allocate memory pools, and run synthetic dummy warmup passes
- Container initialization, environment bootstrap, and runtime dependency loading
- Register pod as healthy with load balancer gateway to begin receiving live traffic
- Memory-map (
mmap) or deserialize model weights from local SSD into host memory, with explicit pinned staging buffers if the transfer path uses them
True or False: In multi-model serving on a shared GPU, Volta-era NVIDIA Multi-Process Service (MPS) provides hard physical hardware partitioning of high-bandwidth memory (HBM) channels and compute cores, completely preventing memory out-of-memory (OOM) faults caused by co-located tenant models.
A multi-model serving platform hosts 50 distinct fine-tuned vision models on a single GPU node with 24 GB of VRAM. Each model requires 2 GB of memory, exceeding total VRAM capacity. Traffic to individual models is sporadic. What loading and memory management architecture enables serving all 50 models while minimizing request latency?
- Redeploy the cluster on 50 dedicated GPU nodes running continuous batching 24/7.
- Quantize all models to 1-bit weights to fit all 50 models into GPU L2 cache simultaneously.
- Maintain a tiered memory cache (storing active models in GPU VRAM and inactive models in host pinned DRAM), using asynchronous PCIe DMA transfers to swap weights into VRAM on demand with an LRU eviction policy.
- Compress all models into a single shared zip archive on remote S3 and download the entire archive over HTTP on each incoming request.
Why can loading model weights from modern
safetensorsformat provide faster startup times than some legacy PyTorch checkpoint paths?safetensorsfiles compress weights using gzip, reducing disk storage by \(10\times\).safetensorsfiles store raw tensor buffers in a simple deterministic layout that supports memory mapping (mmap) without Python object deserialization or arbitrary code execution.safetensorsfiles compile PyTorch code directly into binary x86 machine instructions on disk.safetensorsfiles automatically quantize FP32 weights into 4-bit integers during read operations.
13.9 LLM Serving
An image classifier returns a single class vector in a few milliseconds and immediately frees its activation buffers, whereas a conversational LLM streams hundreds of tokens over several seconds while holding a growing key-value cache in GPU memory. LLMs make three properties far more prominent than in fixed-output serving: autoregressive generation21 (each token depends on all previous tokens, making output inherently sequential), variable-length output (response length is unknown at request time, complicating fixed-batch assumptions), and stateful memory (the key-value cache grows with each generated token, creating dynamic memory pressure). Each property strains a different tool from the preceding sections: sequential generation splits the latency budget into phases, unknown output length breaks fixed-batch scheduling, and the growing cache makes memory capacity, not arithmetic, the limit on concurrency. The p50, p95, and p99 metrics used for classification serving still matter, but they apply separately to the initial prompt processing and to the subsequent token generation. The same principles of queuing theory, batching trade-offs, and latency budgets remain applicable; LLM serving adds domain-specific techniques atop them.
21 Autoregressive: From Greek auto- (self) and Latin regressus (a going back), since the output “regresses” on itself; George Udny Yule introduced autoregressive models in 1927 for analyzing sunspot cycles. In language modeling, each output token conditions on all previously generated tokens, creating a serial dependency that prevents the parallelism exploited during training. Decode is often weight-bandwidth-bound at small batches; larger batches amortize the weight stream and can shift the bottleneck toward compute or KV-cache traffic (Pope et al. 2023).
Pope, Reiner, Sholto Douglas, Aakanksha Chowdhery, Jacob Devlin, James Bradbury, Jonathan Heek, Kefan Xiao, Shivani Agrawal, and Jeff Dean. 2023. “Efficiently Scaling Transformer Inference.” Proceedings of Machine Learning and Systems (MLSys) 5: 606–24.
↩︎ Prefill, small-batch autoregressive decode, and the KV cache that every decode step reads are established in Autoregressive decoding.
The chapter’s second service carries the section. GPT-2 XL, the bandwidth-bound lighthouse, anchors the metrics, the decode floor, speculative decoding, and the energy per generated token, because its weight stream sets each of them. Llama 3 8B, introduced with the running cases, carries the cache budget, paging, and prefix reuse, because its longer contexts make memory capacity rather than bandwidth the constraint that binds first.
13.9.1 Performance metrics: TTFT and TPOT
Prefill and low-batch decode often face different resource limits.
A single end-to-end latency number cannot distinguish a chat response that begins streaming in 100 ms and flows at reading speed from one that leaves the user staring at a blank screen for two and a half seconds before dumping the entire paragraph at once. Because generative models emit a stream of tokens rather than a single output tensor, serving systems split latency into time to first token (TTFT) and time per output token (TPOT), the average of a request’s inter-token latencies (ITL), as defined in Token latency: TTFT and TPOT. In serving, each metric belongs to one phase. Prefill (processing the prompt and populating its KV cache) sets TTFT and is often compute-bound, while decode (generating output) sets TPOT and is often bandwidth-bound at small batches. A low TTFT therefore does not mean a fast model. A model can have a fast TTFT but a sluggish TPOT (if the memory wall \((\Bandwidth)\) is the bottleneck), leading to a frustrating user experience where the answer starts quickly but “stutters” thereafter. Because these metrics capture distinct aspects of the user experience, interactive services set separate targets for TTFT, TPOT or ITL, and aggregate throughput.
Systems Perspective 13.5: LLM serving latency targets
Interactive LLM services usually need separate SLOs for responsiveness, generation fluidity, and fleet throughput. The following values are illustrative targets rather than universal requirements:
- TTFT: \(<\) 500 ms (for a 1000-token prompt)
- TPOT: \(<\) 50 ms (equivalent to ~20 tokens/s, faster than human reading speed)
- Throughput: \(>\) 1000 tokens/s aggregate across active serving replicas
A single “latency” number therefore hides the prefill/decode split. TTFT is the blank-screen budget, TPOT is the reading-flow budget, and aggregate service throughput, measured as tokens/s summed across active serving replicas, determines whether those targets hold under shared load.
13.9.2 The decode floor
The chapter’s bandwidth-bound lighthouse puts numbers on both phases. A GPT-2 XL chat request with a 512-token prompt performs about 1.5 TFLOP of prefill arithmetic, which an H100 sustaining 40 percent of its FP16 peak completes in about 3.9 ms, the model’s share of TTFT. Each decode step then reads all 3 GB of FP16 weights to produce one token per active sequence. At batch one that read takes 0.9 ms, so the model-side TPOT can be no shorter, however many arithmetic units the accelerator adds. The floor assumes the step is launched as one captured graph. Issued operation by operation from an eager framework, the same step spends about 8.6 ms on the host submitting 576 kernels, roughly 10× the weight read, which is why every decode floor in this chapter assumes the CUDA Graph capture that Graph capture and JIT compilation developed.
Batch-one decode with FP16 weights runs at the weight-only arithmetic intensity of about 1 FLOP/byte that Autoregressive decoding derived. The H100’s ridge point sits near 295 FLOP/byte, so the step is memory-bandwidth bound by more than two orders of magnitude (Pope et al. 2023), and equation 14 gives its floor per token, where \(\DataVolume\) is the bytes the step reads and \(\AcceleratorMemoryBandwidth\) is the accelerator’s memory bandwidth: \[ \DecodeTokenTimeFloor\approx \frac{\DataVolume}{\AcceleratorMemoryBandwidth} \tag{14}\] While decode remains bandwidth bound, every step pays to move every weight, in energy as well as in time, and adding compute cores yields little latency improvement; faster memory (Machine), fewer bytes per parameter or a smaller model (Algorithm), or better batching and cache management change the bound.
Batching changes which bytes dominate. Each sequence also reads its own KV cache on every step. GPT-2 XL’s attention heads each keep their own keys and values, with no grouped-query sharing, so its cache holds 307.2 KB per token of context, or 314.6 MB for a full 1,024-token context. Batching shares the weight read across sequences but not the cache reads. At batch one with a full context, a step moves 3.3 GB and takes 1.0 ms. At batch 32 it moves 13.1 GB, 77 percent of it cache, and takes 3.9 ms. Aggregate throughput rises from about 1,010 tokens/s to 8,200 tokens/s, while each sequence’s TPOT stretches by 3.9×. The same trade between per-sequence cadence and aggregate throughput governs every scheduling technique that follows.
13.9.3 Decoding strategies
Switching a chat endpoint from greedy decoding to four-way beam search quadruples both the arithmetic per step and the KV-cache memory each active user holds. The sampling algorithm executed at each step therefore shapes serving cost directly. Greedy decoding takes the highest-scoring token and needs one forward pass per token, though it can fall into repetitive output because it never revisits an early choice. Beam search keeps several candidate sequences and multiplies both computational work and KV-cache footprint by the beam width. Stochastic sampling scales the logits by a temperature and truncates the vocabulary with top-\(\TopTokenSampleCount\) or top-\(\NucleusProbabilityMass\) nucleus sampling before drawing a token (Holtzman et al. 2020). For the serving system, beam width multiplies the state each request holds, while the sampling variants add only a small per-step reduction whose cost depends on its kernel implementation and on the sequence-length distribution that continuous batching must absorb.
Holtzman, Ari, Jan Buys, Li Du, Maxwell Forbes, and Yejin Choi. 2020. “The Curious Case of Neural Text Degeneration.” Proceedings of the 8th International Conference on Learning Representations (ICLR 2020).
Interactive LLM services commonly return tokens as they are produced rather than waiting for complete generation. This streaming response transforms the user experience. A two-second total generation feels responsive when tokens stream continuously, but feels broken when users stare at a blank screen for two seconds. Streaming requires infrastructure support for incremental responses and client-side rendering. Once generation streams token by token, the serving unit changes from one fixed-output prediction to a stateful sequence whose length is unknown when it is admitted and whose memory footprint grows on every step. The unknown length breaks the fixed-batch scheduling developed for fixed-output models, and the growing state turns accelerator memory into the next constraint.
13.9.4 Continuous batching
An autoregressive request finishes only when it emits an end-of-sequence token, so its length is revealed one step at a time. Extending the request-level dynamic batching of section 13.5 to an entire generation cycle keeps batch membership fixed until every sequence finishes. When sequence lengths vary, this static commitment degrades accelerator efficiency. If one sequence in a batch of eight finishes after ten tokens while others require 100 tokens, 90 percent of the compute and memory bandwidth allocated to that sequence slot is wasted on padding tokens or masked dummy operations while awaiting the slowest sequence (Yu et al. 2022).
Yu, Gyeong-In, Joo Seong Jeong, Geon-Woo Kim, Soojeong Kim, and Byung-Gon Chun. 2022. “Orca: A Distributed Serving System for Transformer-Based Generative Models.” 16th USENIX Symposium on Operating Systems Design and Implementation (OSDI 22), 521–38.
22 Continuous batching: NVIDIA TensorRT-LLM calls the same technique “in-flight batching” (NVIDIA 2026f). Request-level batching commits to a fixed batch for an entire generation sequence (potentially hundreds of iterations), while continuous batching reschedules at every token-generation step, a contrast that parallels preemptive OS process scheduling versus run-to-completion.
NVIDIA. 2026f. NVIDIA TensorRT-LLM.
Continuous batching22 (also called iteration-level batching) eliminates this idle-slot waste by rescheduling batch composition at each decoding iteration (Yu et al. 2022; Kwon et al. 2023). Rather than committing to a static batch that persists across hundreds of forward passes, the serving engine re-evaluates batch membership at every token-generation step. When a sequence emits its end-of-sequence token, the scheduler immediately reclaims that execution slot, admitting an arriving request into the batch for the subsequent forward pass. Active sequences continue decoding without interruption, maintaining high accelerator utilization across variable-length workloads.
Serving runtimes such as vLLM23 and TensorRT-LLM improve throughput via two mechanisms: reclaiming wasted compute from completed sequences and shortening queue wait times for new arrivals (Kwon et al. 2023; NVIDIA 2026f). However, admitting new requests dynamically creates a systems collision between prompt prefill and token decoding. Long-prompt prefill often exposes high arithmetic intensity and can occupy the GPU for tens of milliseconds. Low-batch decoding often has less weight reuse and is memory-bandwidth bound, advancing one token per active sequence at a time. When an engine executes a prefill in the same iteration as active decodes, the ongoing decode streams stall, causing severe spikes in inter-token latency. Sarathi-Serve resolves this interference through chunked prefill and stall-free batching (Agrawal et al. 2024). By splitting long prompts into fixed-size chunks (e.g., 512 tokens) and co-scheduling a single chunk alongside active decode requests per step, the scheduler limits the prefill work admitted per iteration, reducing interference with active decodes; measured iteration times determine the resulting token cadence.
23 vLLM (virtual large language model (LLM)): An open-source serving system that enables continuous batching via its PagedAttention algorithm (Kwon et al. 2023). Keeping KV-cache waste low lets it serve larger effective batches on the same hardware.
Agrawal, Amey, Nitin Kedia, Ashish Panwar, Jayashree Mohan, Nipun Kwatra, Bhargav S. Gulavani, Alexey Tumanov, and Ramachandran Ramjee. 2024. “Taming Throughput-Latency Tradeoff in LLM Inference with Sarathi-Serve.” 18th USENIX Symposium on Operating Systems Design and Implementation (OSDI 24), 117–34.
Speculative decoding
Continuous batching and chunked prefill keep decode batches full and their cadence steady, but at small batch each generated token still pays for one full weight stream. Speculative decoding24 attacks that bound directly. A small draft model proposes several tokens, and the target model verifies the whole proposal in one parallel pass, so a single weight stream can yield more than one accepted token. Evaluated T5-XXL workloads achieved roughly 2–3\(\times\) speedups (Leviathan et al. 2023), though the gain depends on how often the target model accepts the draft.
24 Speculative decoding: Parallel verification is possible because the draft has already committed to all \(\DraftTokenCount\) candidate tokens, so the target can score the whole block in one causal-attention forward pass, as it scores a prompt during prefill, rather than in \(\DraftTokenCount\) sequential steps (Leviathan et al. 2023). The technique removes serial steps at the runtime layer without changing the model architecture.
Leviathan, Yaniv, Matan Kalman, and Yossi Matias. 2023. “Fast Inference from Transformers via Speculative Decoding.” International Conference on Machine Learning (ICML), 19274–86.
If the draft proposes \(\DraftTokenCount\) tokens and the target accepts each with probability \(\DraftAcceptanceRate\), independently of the others (Leviathan et al. 2023), one verification pass yields on average the number of tokens in equation 15, which counts the accepted draft tokens plus the one token the target always contributes: \[\mathbb{E}[\text{tokens per target pass}] = \frac{1-\DraftAcceptanceRate^{\DraftTokenCount+1}}{1-\DraftAcceptanceRate} \tag{15}\]
Verifying \(\DraftTokenCount+1\) positions costs the target about one weight stream, because at batch one the pass remains bandwidth bound rather than compute bound. For the GPT-2 XL service, a GPT-2 Small draft with 248 MB of FP16 weights proposes 4 tokens per round, spending 0.30 ms on draft reads against 0.90 ms for the target’s verification pass. At an assumed acceptance rate of 70 percent, a round yields 2.8 tokens on average, so the time per generated token falls from 0.90 ms to 0.43 ms, a 2.1× speedup. The gain shrinks as acceptance falls or as the batch grows. A full batch already shares each weight stream across many sequences, and verifying several positions per sequence then consumes arithmetic that a batch-one step left idle but a full batch does not.
PagedAttention
Keeping decode batches full, however, shifts the primary serving bottleneck to memory management. Because transformer generation appends attention states at every step, the KV cache for each active request grows dynamically in accelerator HBM. When sequences of varying lengths share memory, contiguous allocation produces severe external fragmentation. If a completed 100-token sequence releases its cache, an arriving 150-token request cannot occupy that freed memory because it requires a larger contiguous address range. Over time, physical memory fractures into small, noncontiguous gaps, preventing new sequences from launching even when total unallocated capacity appears sufficient. Together with the over-reservation of contiguous allocators, this memory fragmentation can waste 60 to 80 percent of KV-cache memory in naive implementations (Kwon et al. 2023), severely limiting the concurrent batch size that determines serving throughput.

PagedAttention recovers the KV-cache waste of contiguous allocation.
25 PagedAttention: The name directly references OS virtual memory paging, first implemented on the Atlas computer at Manchester (1962) to solve the same class of allocation problem, in which programs needed more memory than physically available, and contiguous allocation wasted space (Kilburn et al. 1962). Introduced at SOSP 2023, PagedAttention applies this six-decade-old abstraction to GPU KV-cache memory; in its evaluation, the recovered memory enabled 2–4\(\times\) higher throughput on the same hardware (Kwon et al. 2023).
Kilburn, Tom, David B. G. Edwards, Michael J. Lanigan, and Frank H. Sumner. 1962. “One-Level Storage System.” IRE Transactions on Electronic Computers EC-11 (2): 223–35. https://doi.org/10.1109/TEC.1962.5219356.
Kwon, Woosuk, Zhuohan Li, Siyuan Zhuang, Ying Sheng, Lianmin Zheng, Cody Hao Yu, Joseph Gonzalez, Hao Zhang, and Ion Stoica. 2023. “Efficient Memory Management for Large Language Model Serving with PagedAttention.” Proceedings of the 29th Symposium on Operating Systems Principles, 611–26. https://doi.org/10.1145/3600006.3613165.
PagedAttention,25 introduced in vLLM, resolves this fragmentation by applying operating system virtual memory paging to accelerator memory (Kwon et al. 2023). In static contiguous allocation, reserving maximum sequence length memory up front causes internal waste, while freed regions may be too small or poorly placed to satisfy a new contiguous reservation. Instead of allocating one contiguous region per sequence, PagedAttention divides the KV cache into fixed-size blocks mapped through a block table. A sequence’s cache can therefore occupy noncontiguous physical blocks. When a sequence completes, its blocks return to a free pool for reuse. Rather than copying noncontiguous blocks into a temporary contiguous buffer before computing attention, a specialized PagedAttention CUDA kernel traverses the block table directly, staging noncontiguous blocks into on-chip SRAM during query-key multiplication. By eliminating external fragmentation and bounding internal waste to each sequence’s last, partially filled block, PagedAttention reduced KV-cache waste below 4 percent in the reported evaluation and enabled substantially higher batch concurrency on the same accelerator hardware (Kwon et al. 2023). Paging decides where cache blocks live, however; it does not reduce how many blocks each sequence needs, and that number grows with every generated token.
13.9.5 Memory and KV cache
Even after PagedAttention eliminates fragmentation waste, thirty-two long-context conversations can exhaust an 80 GB GPU’s memory when the quantized model weights themselves occupy less than half the device. The KV cache, the per-sequence store of attention keys and values defined in Autoregressive decoding, grows linearly with sequence length: prefill creates cache entries for every prompt token, and each decoded token appends another entry, so a request’s footprint is set by its prompt length plus the tokens it has generated so far. Summed across concurrent variable-length sequences, this dynamic state can exceed the model weights and dominate available accelerator memory, which is why the remaining memory levers either reuse cache state across requests or move it off the accelerator.
KV budget
Once contexts grow, the cache rather than the weights sets how many conversations one accelerator can hold, and Llama 3 8B makes the budget concrete. Each token stores a key vector and a value vector in every layer for every key-value head. Storing 16-bit Key and Value tensors across \(\LayerCount=32\) layers with \(\KvHeadCount=8\) grouped-query attention heads of dimension \(\AttentionHeadDimension=128\) requires \(2 \times 32 \times 8 \times 128 \times 2\text{ bytes} = 131{,}072\text{ bytes} \approx 131\text{ KB}\) per token per sequence. Grouped-query attention (Dubey et al. 2024) lets the model’s 32 query heads share those key-value heads, which cuts the cache by 4× relative to full multi-head attention. An 8,192-token conversation therefore holds 1.07 GB. With 16.1 GB of FP16 weights resident on an H100 whose 80 GB datasheet capacity is 85.9 GB in the decimal units used for tensor footprints, about 69.8 GB remains for caches before runtime workspace, room for about 65 such conversations at once. The weights are a fixed cost; every additional conversation, and every additional thousand tokens of context, draws on the same remainder.
Larger models make the cache the binding constraint sooner. For a 70-billion-parameter-class model with grouped-query attention, 4-bit weights consume 35.3 GB of the same H100, leaving 50.6 GB for FP16 cache before runtime workspace. A batch of 32 conversations exhausts that budget at roughly 4,800 tokens of context, so serving engines trade concurrent batch size against context length to avoid out-of-memory failures (figure 8).
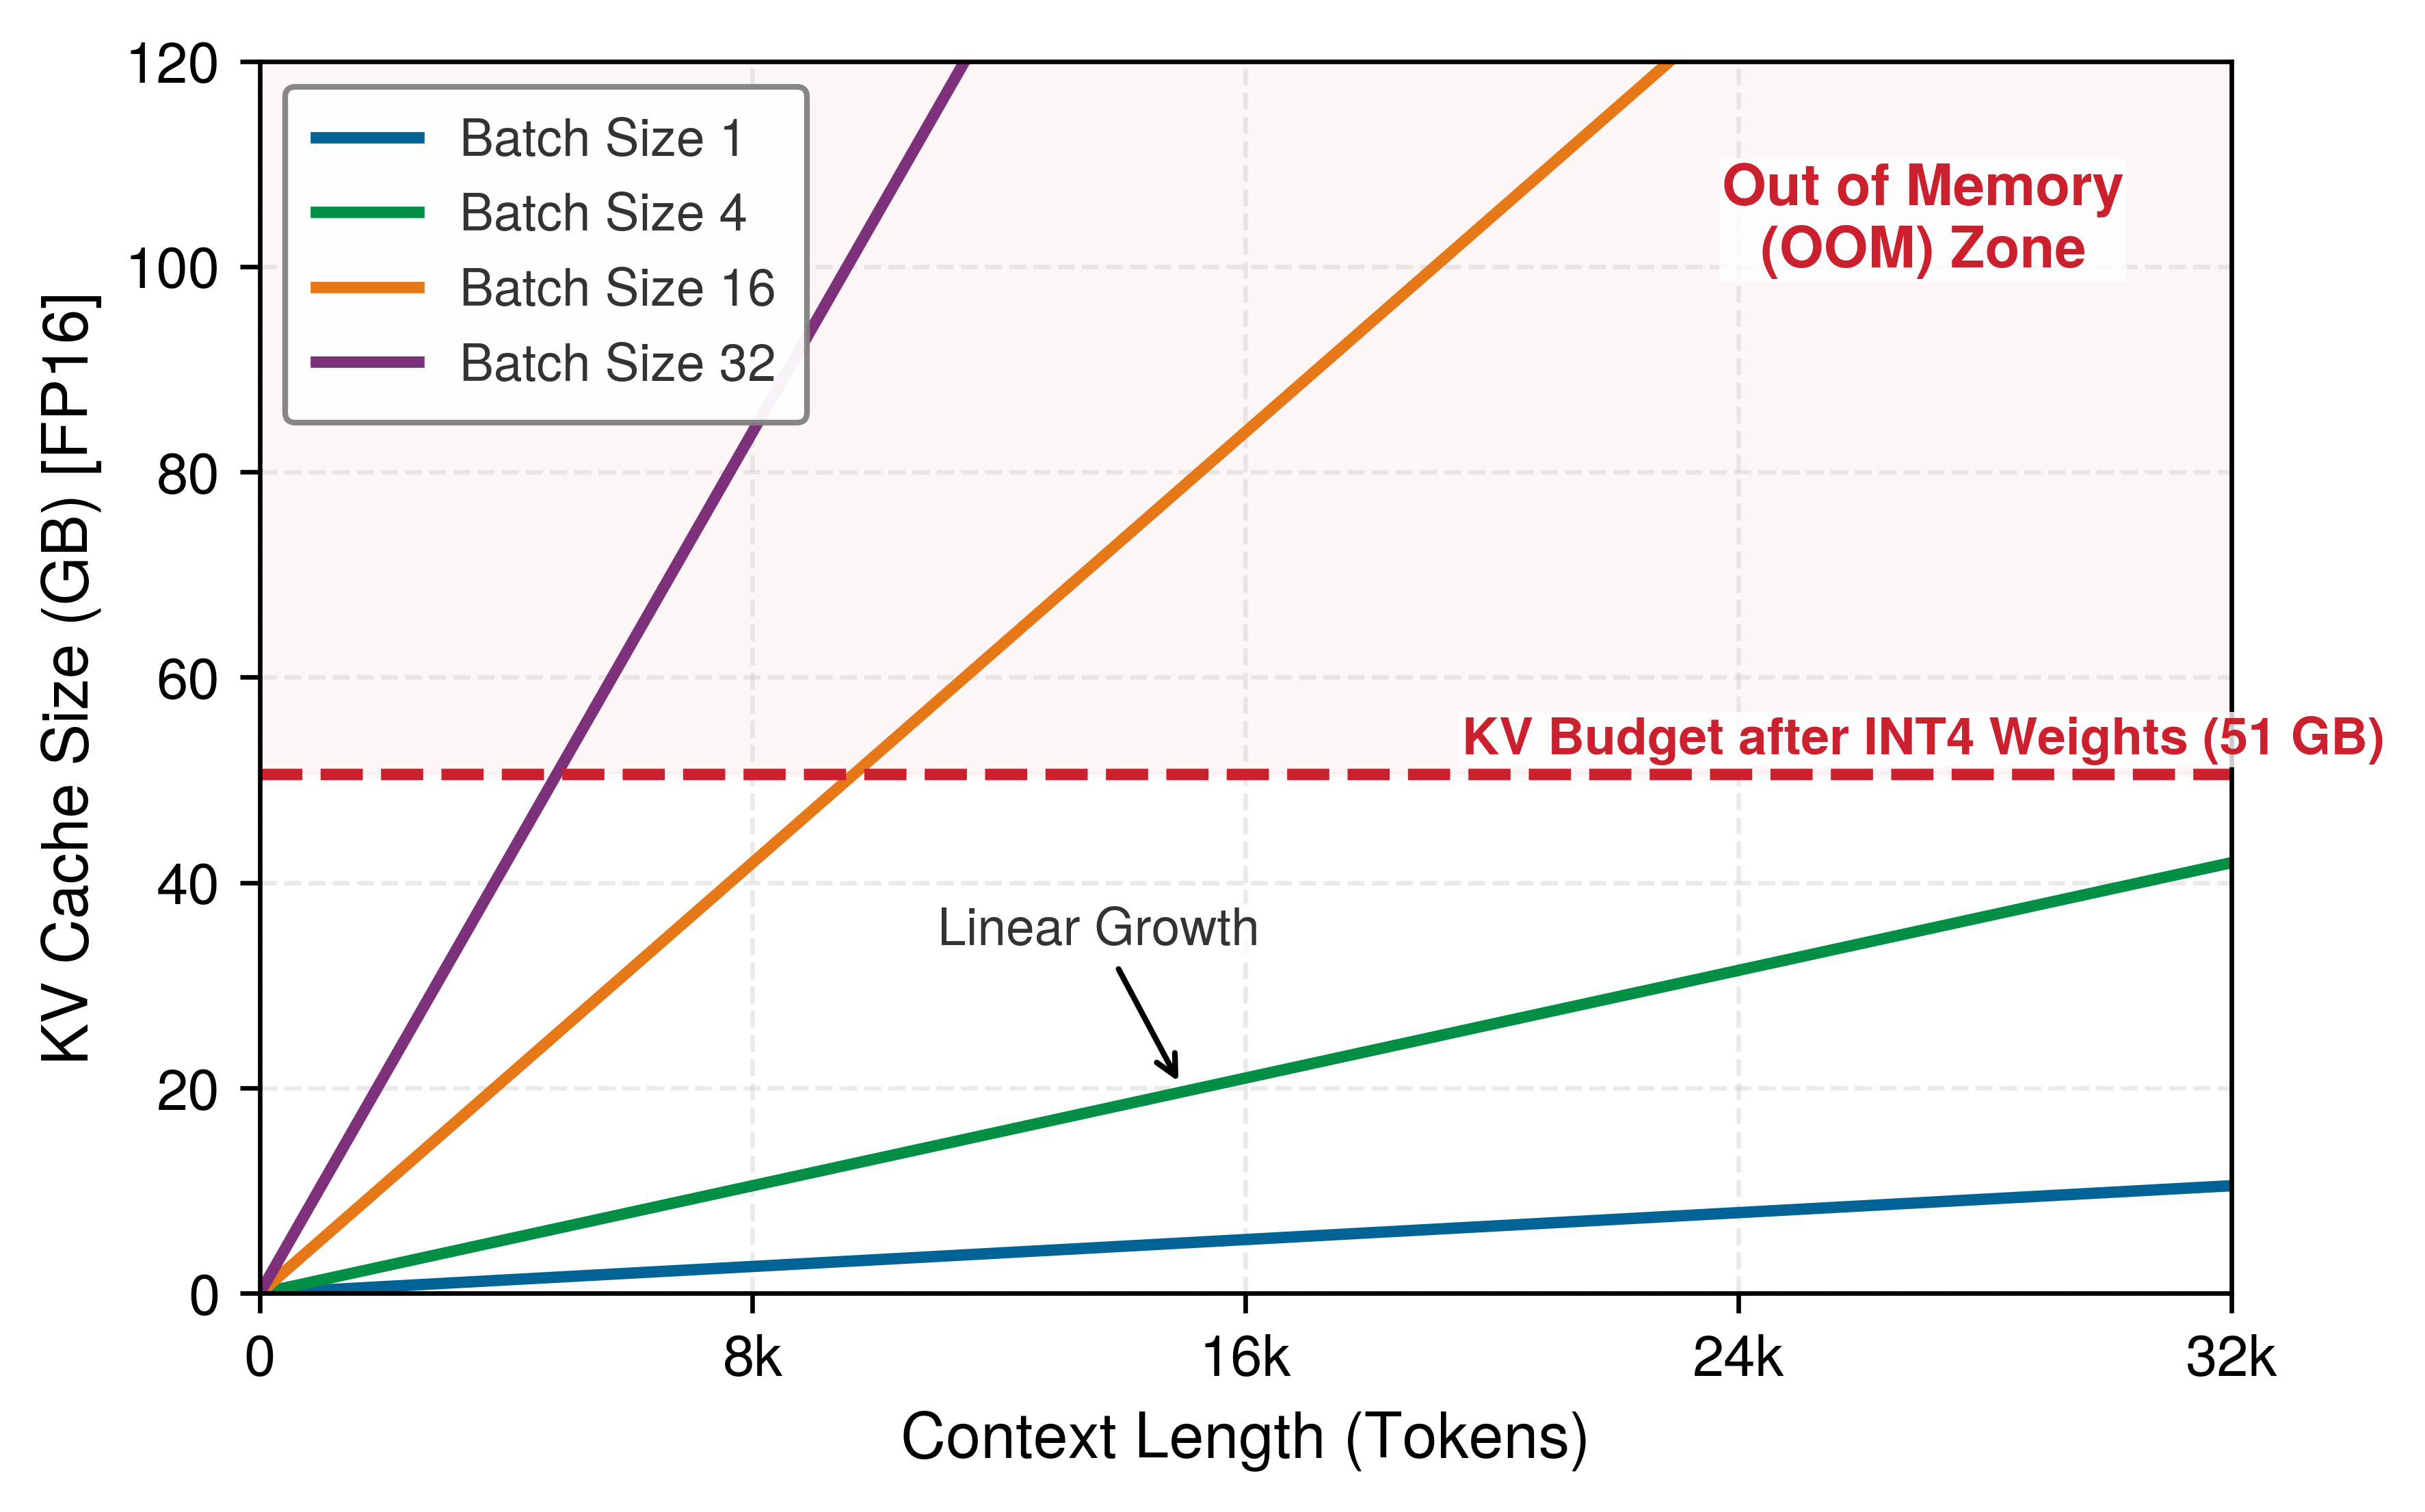
A model whose weights and cache do not fit one accelerator, even at reduced precision, can still be served from one machine by splitting it across the node’s accelerators with the model parallelism of Model parallelism. Serving usually favors tensor parallelism. Pipeline stages also fit, but every decoded token must pass through each stage in turn, which adds latency to every step. Tensor parallelism instead puts every accelerator to work on every layer, and each accelerator holds a slice of the weights and of the KV cache, so a 70-billion-parameter-class model at 16-bit precision, whose weights alone exceed one H100’s memory, fits across the accelerators of one node with room left for cache. The cost is a collective operation after each layer’s matrix multiplications. On NVLink that exchange is small next to the layer’s compute; over PCIe or a network it would dominate each decode step. A serving engine therefore keeps one model’s tensor-parallel group inside a single node and meets higher volume by replicating whole groups across machines rather than stretching one group across them.
Prefix caching and memory offloading
Many requests carry identical prefixes, and recomputing their cache entries wastes both prefill compute and memory. Prefix caching stores the KV states of common instruction prefixes (such as a 2,000-token system prompt or a shared retrieval-augmented generation (RAG) context), allowing independent requests to reuse the prefill result for an identical prefix. For \(\SharedPrefixRequestCount\) requests sharing a prefix of \(\SharedPrefixLength\) tokens, the avoided prefill work is roughly \((\SharedPrefixRequestCount-1)\SharedPrefixLength\) token steps, subject to cache hits, eviction, and implementation overhead. For multi-turn conversations, the same principle lets a subsequent turn process only the new suffix after reusing compatible prior state.
When the aggregate KV cache exceeds GPU VRAM, systems can employ KV cache offloading. This strategy spills inactive or low-priority context windows to host CPU RAM or NVMe SSD, freeing VRAM for active generation. The reload cost is bounded below by bytes moved divided by PCIe or NVMe bandwidth, before software overhead and queueing are added. Offloading therefore prevents OOM failures and enables larger context windows, but it also creates affinity, invalidation, and hot-decode latency risks that must be budgeted explicitly.
13.9.6 Session affinity constraints
Prefix reuse and offloading both assume that the next turn of a conversation reaches the replica that holds its cache. Session affinity, routing successive requests from a client to the same physical replica, arises whenever serving state resides in local accelerator memory rather than being reconstructed on every invocation. In conversational models, this resident state is dominated by the KV cache. When turn \(\ConversationTurnIndex\) executes on a replica, that replica’s HBM retains the projected keys and values across all prior prompt and generation tokens. Routing turn \(\ConversationTurnIndex+1\) to a different replica discards that local memory footprint, forcing the new node to recompute the entire prefix sequence from scratch. This redundant prefill consumes memory bandwidth and tensor-core cycles that would otherwise advance active decode iterations, directly inflating time-to-first-token.
A parallel physical constraint governs personalized serving using fine-tuned Low-Rank Adaptation (LoRA) modules: small per-user adapters, each a pair of low-rank matrices whose product is added to a frozen base weight matrix. While base-model weights remain pinned in device HBM, individual user adapters must be dynamically staged into memory. If incoming requests for a user scatter across multiple replicas, each node must repeatedly transfer adapter tensors over the host-to-device PCIe bus or fetch them across the network, displacing other active working sets in memory. Stateful preprocessing pipelines, such as tokenizer vocabularies and per-session normalization state, impose the same penalty, requiring redundant CPU-side allocations and cache rebuilds whenever execution moves across node boundaries.
↩︎ Products of two low-rank matrices, and the storage and memory traffic they save relative to a full matrix, are established in Matrix factorization.
Strict affinity creates a direct conflict with dynamic batching. Continuous batch schedulers maximize accelerator throughput by packing concurrent requests into unified matrix multiplications, raising operational arithmetic intensity in proportion to batch size (\(\ArithmeticIntensity\propto \BatchSize\)). When requests are pinned to designated replicas, the scheduler’s pool of batchable candidates fragments across the cluster. A replica assigned to an idle or low-concurrency user session must either process underfilled batches, collapsing arithmetic intensity back into the memory-bandwidth-bound regime, or stall waiting for affinity-matched tokens. To prevent this collapse in utilization, production routers use soft affinity. Under soft affinity, the ingress gateway prioritizes the cache-holding replica when capacity allows, but sheds requests to alternate nodes when local queue delays exceed the physical latency required to transfer adapter weights or recompute prefix tokens.
Systems Perspective 13.6: LLM serving: Beyond the fundamentals
Each LLM serving technique answers one of two physical limits. The first is the decode bound, in which every generated token pays for a full weight stream at small batch. Continuous batching keeps decode batches full so each stream serves many sequences, chunked prefill keeps prompt processing from stalling that stream, and speculative decoding extracts more than one accepted token per stream. The second is the KV cache, which grows with sequence length and batch size and often exceeds the weights themselves; PagedAttention, prefix caching, offloading, and session affinity decide where it lives and how much of it can be reused. Weight-only quantization (such as INT4 weights with FP16 activations), the precision lever of section 13.6.3 applied to the weight stream, addresses both at once, because it shrinks the bytes streamed per token and frees capacity for cache (Lin et al. 2024).
These LLM-specific optimizations build directly on core serving mechanics: queueing models govern scheduling timeouts, batching dynamics determine throughput-latency curves, and reduced precision bounds memory traffic. Advanced treatments extend these mechanics to multi-tenant prefix sharing across fleets and multi-node tensor-parallel execution.
Every technique above changes how many sequences share each weight stream and how long each one holds its cache. Because an accelerator draws power whether a decode pass serves one sequence or a full batch, that same sharing directly governs the energy each generated token costs. Dividing node power by aggregate token throughput converts batching and prefix-caching gains into joules per token.
Napkin Math 13.5: The energy cost of a chat
Problem: How much energy does an H100-backed chat service spend per generated token and for a response with 500 tokens?
As LLMs scale, joules per token becomes a first-class operational metric alongside latency. Assuming the H100 draws its 700 W thermal design power (TDP), this scenario estimate follows from throughput and power (Choquette 2023):
- Throughput: 114 concurrent requests \(\times\) 8 tokens/s per request ≈ 912 tokens/s.
- Power: 700 W (GPU) + 300 W (Host/Overhead) = 1000 W.
- Energy per token: 1000 W / 912 tokens/s ≈ 1.0965 J/token
Systems insight: Under these assumptions, a response of 500 tokens consumes ≈ 548.2 J. A measured production figure is of the same order. Google reports ≈ 864 J (0.24 Wh) for the median Gemini text prompt, counting host, idle-reserve, and facility energy, although the study does not state how long that prompt was (Elsworth et al. 2025).
- For comparison, charging a smartphone consumes ≈ 40000 J.
- Boiling a cup of water consumes ≈ 100000 J.
The primary way to reduce J/token is to increase hardware utilization and eliminate redundant compute. If the GPU sits at 10 percent utilization due to poor batching, it still draws ~300 W and the host adds 300 W, causing energy per token to rise to 6.6 J/token (approximately 6× the baseline). Architectural optimizations like prefix caching also skip the energy-intensive prefill phase for shared context, directly reducing the energy footprint of retrieval-augmented generation (RAG) and chat applications. The serving lesson is that efficiency is not only a latency or cost metric; it also determines how much energy each useful token consumes.
Elsworth, Cooper, Keguo Huang, David Patterson, Ian Schneider, Robert Sedivy, Savannah Goodman, Ben Townsend, et al. 2025. “Measuring the Environmental Impact of Delivering AI at Google Scale.” arXiv Preprint arXiv:2508.15734.
Systems Perspective 13.7: Looking ahead: Spending more compute per query
Every lever so far takes the number of tokens a request generates as given, and fixed-output serving minimizes latency (\(\EndToEndRequestLatency \to 0\)) for a fixed amount of work per request. Reasoning models and other inference-time-compute systems make that token count a choice: they deliberately spend more computation per query to improve answer quality, generating intermediate reasoning or search tokens before the visible answer. The optimization target then expands to include answer quality, and every extra reasoning token pays the decode costs this section derived: one more step of decode work at the batch’s cadence, one more KV-cache entry held until the response ends, and its share of the joules per token. Answer quality now trades directly against TPOT, cache capacity, and energy per query.
Checkpoint 13.5: LLM serving fundamentals
LLM serving introduces constraints absent from traditional model serving.
Every LLM serving optimization ultimately decides how many sequences share each weight stream and how much accelerator memory each sequence holds. The chat-energy calculation showed that the same sharing sets the joules spent per useful token, because each decode step streams the weights once for the whole active batch, so a well-filled batch divides that energy across sequences. Unlike fixed-output inference, LLM energy also grows with response length. Carbon accounting additionally requires an emissions factor and a defined boundary. These per-token bounds describe one accelerator. Deciding how many accelerators a service needs, and what each generated token costs, requires carrying them, together with the fixed-output results of the earlier sections, into capacity planning and unit economics.
Self-Check: Question
In Large Language Model (LLM) serving, how do the computational and hardware characteristics of the Prefill phase fundamentally differ from the Decode phase?
- Prefill processes tokens autoregressively one by one and is memory-bandwidth bound, whereas Decode processes all output tokens simultaneously and is compute-bound.
- Prefill processes all prompt tokens concurrently in parallel matrix multiplications and is often more compute-intensive, whereas Decode generates one token per step autoregressively and at low batch sizes is often memory-bandwidth bound due to repeated weight and KV-state movement.
- Prefill operates exclusively on host CPU DRAM, whereas Decode runs on GPU Tensor Cores.
- Prefill latency scales quadratically with batch size, whereas Decode latency is strictly independent of sequence length and KV-cache size.
Order the step-by-step execution cycle of Speculative Decoding for accelerating LLM inference:
- Target model runs a single parallel forward pass over the draft candidate tokens to compute verification logits
- Draft model (a lightweight autoregressive model) generates \(K\) candidate tokens sequentially
- Engine appends the accepted tokens to the KV cache and advances the generation context
- Verification logic compares the draft tokens with the target model’s verification results and accepts a prefix of them
True or False: Speculative decoding speeds up serving regardless of draft-model quality, because the target model always verifies multiple tokens in parallel.
In a multi-turn conversational AI system with extensive system prompts (e.g., 2,000 tokens of instructions and few-shot examples shared across thousands of user sessions), what serving optimization eliminates redundant prefill compute across requests?
- Linear Attention Approximation, which drops system prompt tokens entirely from the attention window.
- Static Graph Compilation, which hardcodes user inputs directly into the weight tensors.
- Prefix Caching (e.g., RadixAttention), which stores the KV-cache states of common prompt prefixes in memory and reuses them across queries matching the prefix.
- Speculative Quantization, which quantizes prompt tokens into 1-bit binary representations during the decode phase.
Contrast traditional request-level dynamic batching with iteration-level continuous batching (as introduced in Orca and vLLM) for Large Language Model (LLM) serving. Why is request-level batching severely inefficient for autoregressive generation?
True or False: PagedAttention resolves the primary memory waste in LLM KV-caching by allocating key and value states in non-contiguous, fixed-size physical memory blocks managed via a virtual page table, eliminating both internal fragmentation from over-allocation and external memory fragmentation.
13.10 Economics and Planning
A team that has raised an H100’s ResNet-50 throughput several-fold through batching still faces a fleet-level question: does serving a 5,000 QPS target within the same p99 latency SLO cost less on a few H100s or on several times as many lower-cost T4s? Batching, precision tuning, kernel fusion, graph compilation, and the LLM levers that share each weight stream across sequences all improve single-node performance, but production deployment requires choosing how many machines to rent, of what type, and at what total bill. Serving infrastructure cost grows continuously with request volume (Zhang et al. 2019), while training cost follows a one-time dataset, model, and optimization budget. The bitter lesson sharpens this asymmetry. The methods that win are the ones that scale, so successive models grow larger, and while training pays for that scale once, serving pays for it on every request.
Zhang, Chengliang, Minchen Yu, Wei Wang, and Feng Yan. 2019. “MArk: Exploiting Cloud Services for Cost-Effective, SLO-Aware Machine Learning Inference Serving.” 2019 USENIX Annual Technical Conference (USENIX ATC 19), 1049–62.
↩︎ The bitter lesson, that general methods which scale with computation keep outperforming hand-engineered ones, is established in The Bitter Lesson.
26 Jevons paradox: William Stanley Jevons observed in 1865 that efficiency improvements in coal-powered steam engines increased total coal consumption by making steam power economically viable for applications previously too costly (Jevons 1865); the same dynamic can apply to AI inference, where each 10\(\times\) cost reduction opens application classes that were economically infeasible at the previous price point, expanding aggregate demand by more than the efficiency gain.
Jevons, William Stanley. 1865. The Coal Question: An Inquiry Concerning the Progress of the Nation, and the Probable Exhaustion of Our Coal Mines. Macmillan; Co.
Tail latency dictates the technical design of a serving system, but economics dictates its operational scale. As specialized accelerators and runtime optimizations reduce the compute cycles required per forward pass, the marginal cost per inference declines.26 Counterintuitively, reduced unit cost does not shrink aggregate serving expenditures. In accordance with Jevons paradox, lower marginal costs stimulate disproportionately higher query volumes, integrating model evaluation deeper into user-facing product loops. At hyperscale, recurring operational inference costs quickly eclipse one-time offline training investments, shifting the primary systems bottleneck toward sustained per-query efficiency.
Example 13.12: Inference cost at Facebook
Scenario: Production ML serving systems at Meta execute tens of trillions of inferences daily across global user-facing services (Hazelwood et al. 2018).
Diagnosis: Recurring inference serving compute and energy costs dwarf initial offline model training expenses. Live request arrival patterns and strict latency bounds constrain GPU batching.
Systems lesson: Model architectures cheap to train can prove unviable to serve at fleet scale. Production serving infrastructure requires hardware-software co-design to balance tail latency, batch size, and recurring operational total cost of ownership.
Hazelwood, Kim, Sarah Bird, David Brooks, Soumith Chintala, Utku Diril, Dmytro Dzhulgakov, Mohamed Fawzy, et al. 2018. “Applied Machine Learning at Facebook: A Datacenter Infrastructure Perspective.” 2018 IEEE International Symposium on High Performance Computer Architecture (HPCA), 620–29. https://doi.org/10.1109/hpca.2018.00059.
OpenAI. 2023b. Introducing ChatGPT and Whisper APIs.
OpenAI. 2023a. GPT-4.
OpenAI. 2024. GPT-4o Mini: Advancing Cost-Efficient Intelligence.
OpenAI Developer Community. 2024. Announcing GPT-4o in the API.
Anthropic. 2024. Introducing the Next Generation of Claude.
Google Developers Blog. 2024. Gemini 1.5 Flash Price Drop with Tuning Rollout Complete, and More.
DeepSeek. 2024. Introducing DeepSeek-V3.
The same serving-economics pressure appears in public API prices. Figure 9 tracks this cost collapse across representative public API list-price snapshots from 2023 through 2025 on a logarithmic scale. The steep downward trend line isolates how prompt token pricing fell by multiple orders of magnitude, from thirty dollars per million tokens for original GPT-4 down to several cents for Gemini 1.5 Flash and DeepSeek-V3. Vendor prices change frequently, so these points should be read as historical provenance for the trend rather than as current purchasing guidance (OpenAI 2023b, 2023a, 2024; OpenAI Developer Community 2024; Anthropic 2024; Google Developers Blog 2024; DeepSeek 2024). Each order-of-magnitude drop changes which applications are economically viable, and a provider can sustain such prices only if its serving stack extracts more completed requests from each accelerator-hour. Converting engineering efficiency into unit cost draws on the latency, batching, and memory mechanisms of the preceding sections.
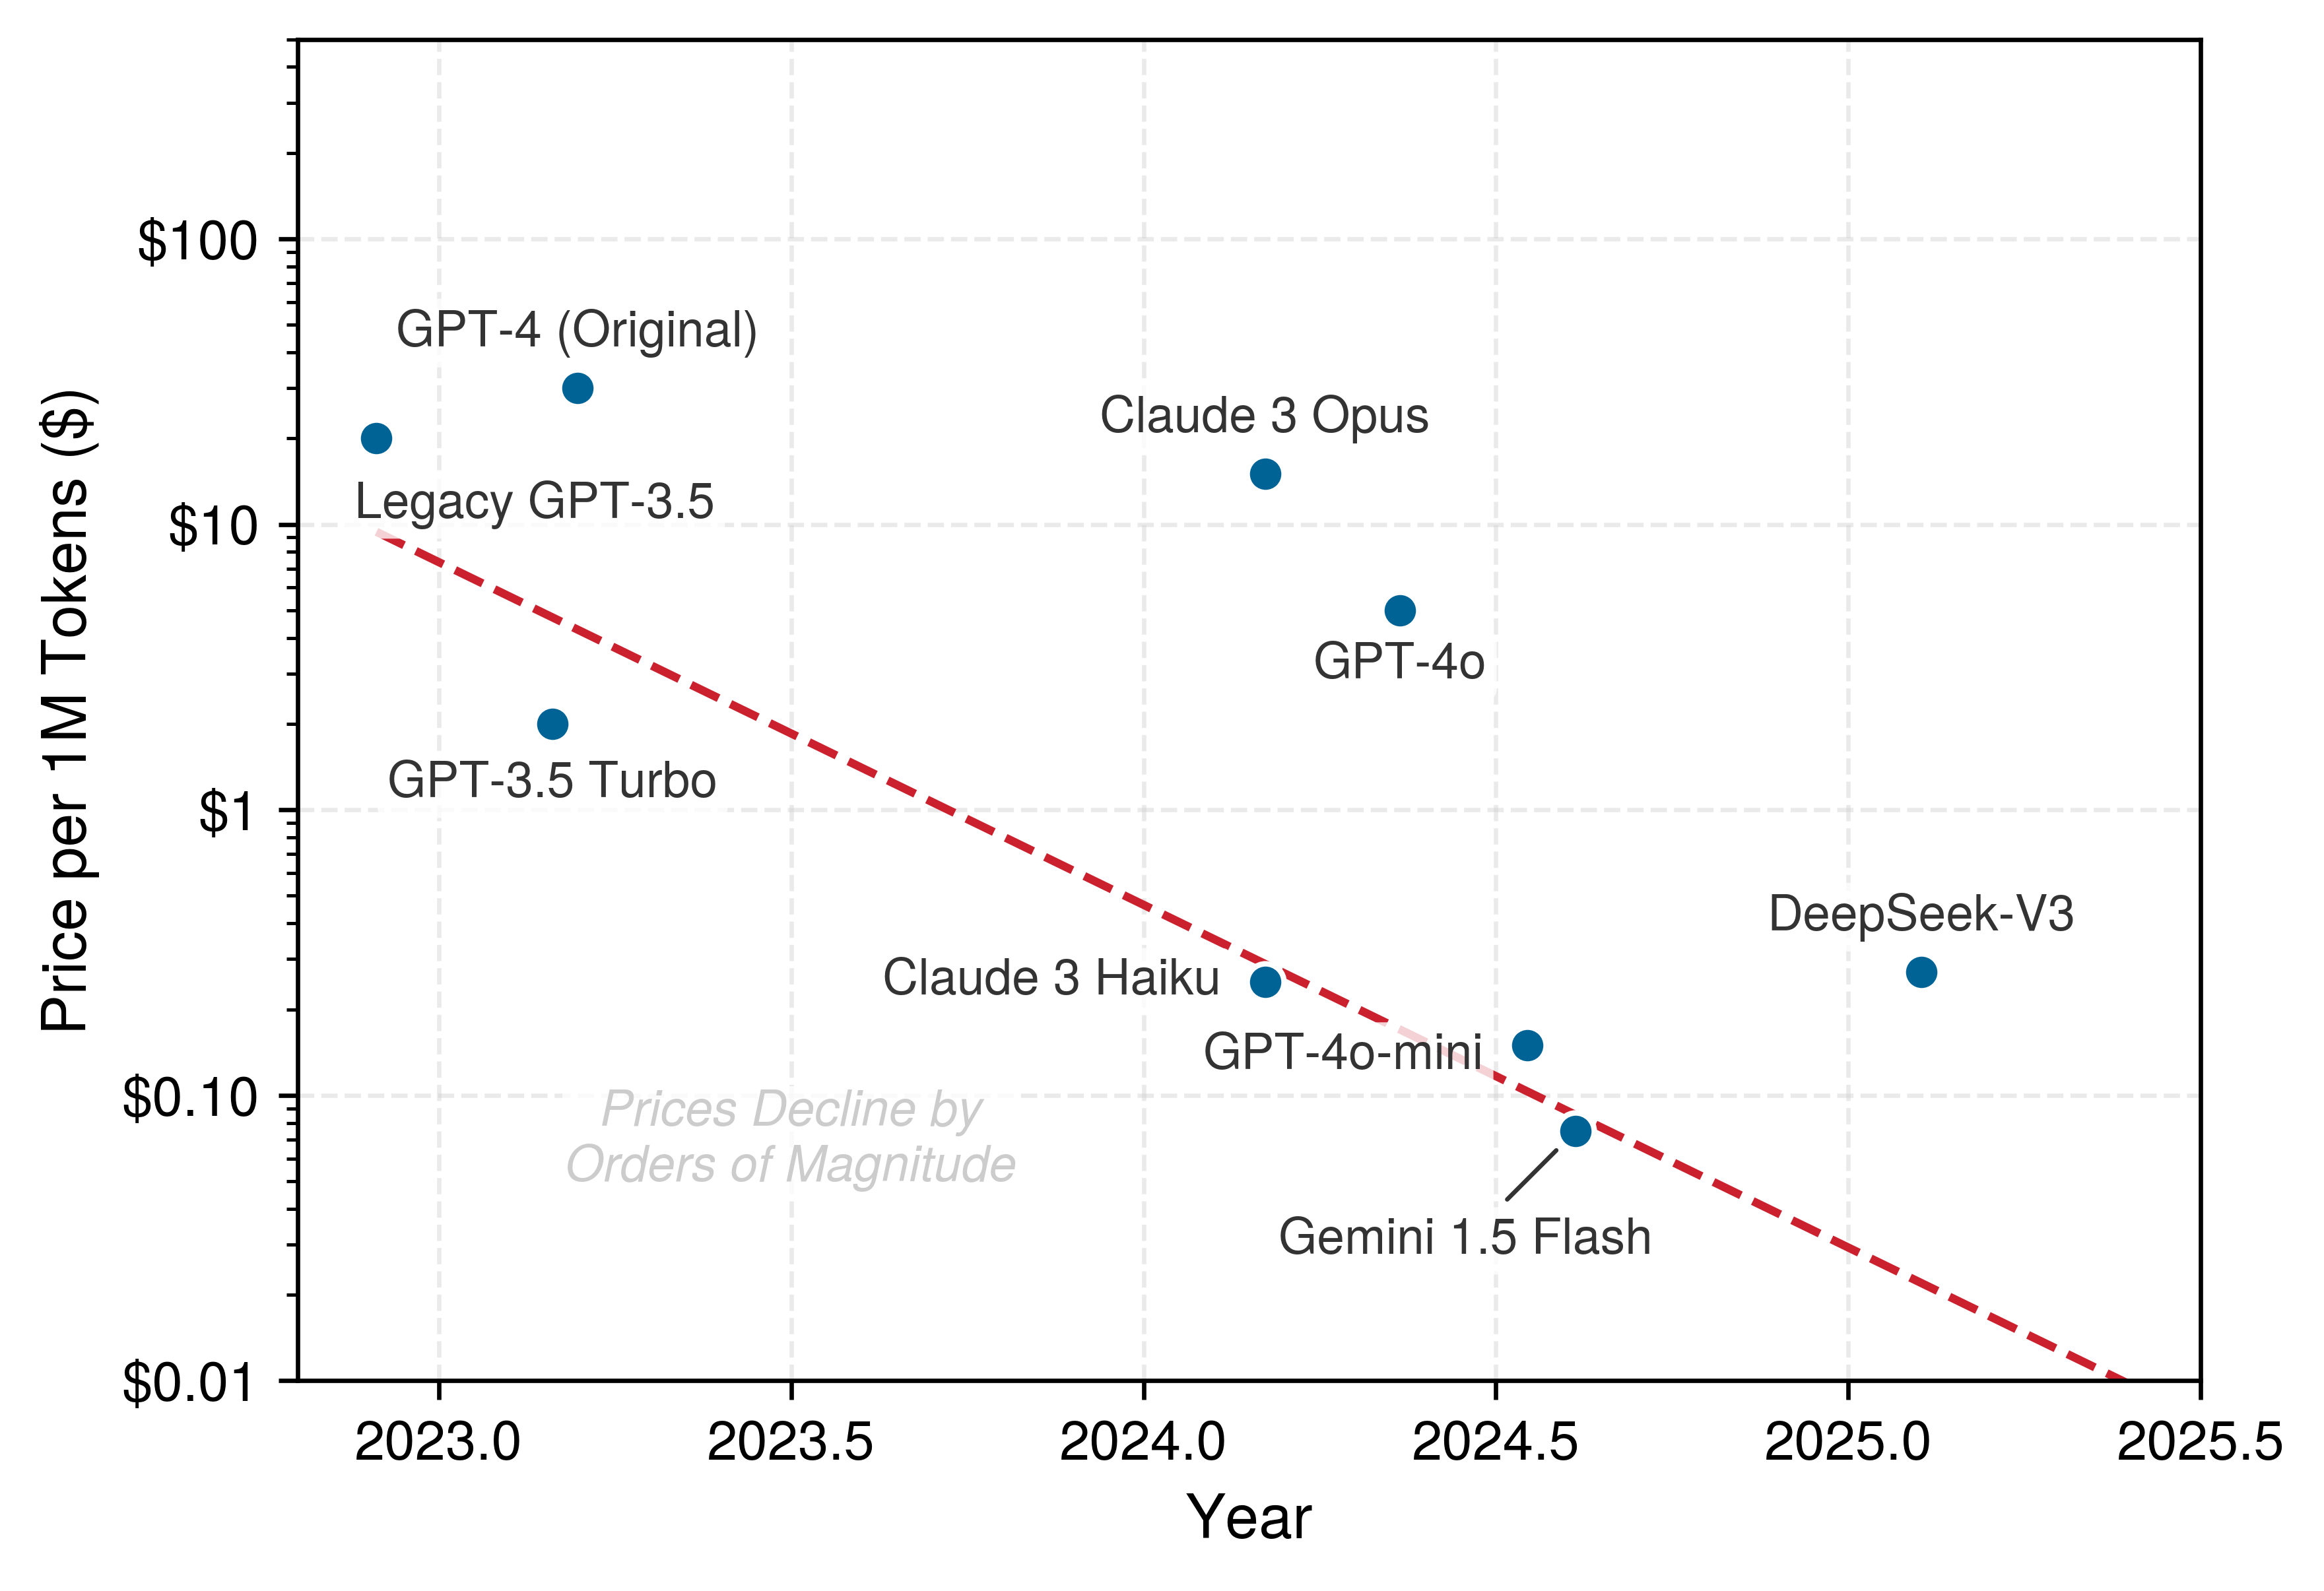
13.10.1 Cost per inference across hardware
Choosing serving instances by hourly rental price alone, or by peak throughput alone, misleads whenever traffic fluctuates: an H100 that costs several times as much per hour as a T4 delivers the lowest cost per million images when traffic keeps it full, but becomes the more expensive option when overnight traffic drops and the GPU sits mostly idle. The cost per inference divides the allocated serving cost by the number of completed inferences that satisfy the service objective. The numerator can include provisioned CPU or accelerator time, memory capacity, data transfer, storage, and orchestration. At high utilization, useful throughput spreads that provisioned cost across many requests. At low utilization, paid capacity sits idle, so the same hourly cost is divided among fewer successful inferences.
Hardware selection for model serving trades hourly rental price against parallel throughput. Although GPU instances cost several times as much per hour as commodity CPU instances, their matrix units can process enough requests per second to cut the cost per completed query by an order of magnitude. Whether CPUs or dedicated accelerators win economically depends on arithmetic intensity, batchability, and the latency deadline.
Host CPU execution is cheaper for small models, services with relaxed latency deadlines (hundreds of milliseconds), and sparse or unpredictable traffic that leaves dedicated accelerators idle. Conversely, GPU acceleration wins when models perform dense matrix operations, when service-level objectives require response times of tens of milliseconds or less, and when sustained traffic lets dynamic batching amortize kernel launch and memory transfer costs.
Beyond steady-state costs, startup time affects scaling economics. Instance launch, image pull, driver initialization, model loading, compilation, and warmup can make accelerator replicas slower to become ready than CPU replicas, although exact times depend on the platform and deployment artifact. If traffic rises faster than useful capacity can come online, latency SLOs can fail despite sufficient eventual capacity.
When accelerator replicas have a long readiness delay, predictive scaling or a warm pool may be more reliable than purely reactive scaling. For a model that runs acceptably on both device types, a hybrid design can use always-on accelerator capacity for baseline load and CPU overflow for spikes, trading a different unit cost and latency profile for faster reserve capacity. Whether this GPU+CPU hybrid works depends on model compatibility and identical output semantics across runtimes.
Example 13.13: ResNet-50: Cost analysis
Table 18 gives an illustrative scenario for hourly cost, throughput, and per-million-image cost when serving ResNet-50; the H100 row uses the batch-32 rate of the chapter’s batching sweep:
Table 18: Illustrative ResNet-50 cloud inference cost comparison: Assumed hourly cost and saturated throughput, with derived cost per one million images for CPU, T4, and H100 instances.
| Instance Type | Cost/Hour | Throughput | Cost per 1M Images |
|---|---|---|---|
| c5.xlarge (CPU) | $0.17 | 50 img/s | $0.94 |
| g4dn.xlarge (T4 GPU) | $0.53 | 400 img/s | $0.37 |
| One H100 GPU | $4 | 7,040 img/s | $0.16 |
Systems insight: At full utilization the H100 has the lowest unit cost, but its hourly rate is 7.5× the T4’s, so it wins only while traffic keeps it busy. Below about 3,000 img/s of sustained traffic, T4 capacity sized to the load costs less per image than one partly idle H100. Cloud pricing varies by region and changes over time; consult current pricing for production planning.
13.10.2 Capacity planning
The unit-cost comparison in table 18 evaluates each instance at its saturated throughput, but a live fleet cannot run at 100 percent utilization without pushing every arrival burst past the knee of the latency curve (figure 5). Determining how many replicas to provision therefore combines those per-device service rates with the queueing bounds from section 13.4. Capacity planning translates three inputs into replica counts: traffic patterns (peak request rate, daily and weekly cycles, growth projections), latency SLOs (p50, p95, p99 targets), and model service times across batch sizes (Harchol-Balter 2013).
Harchol-Balter, Mor. 2013. Performance Modeling and Design of Computer Systems: Queueing Theory in Action. Cambridge University Press. https://doi.org/10.1017/cbo9781139226424.
The ResNet-50 capacity notebook in section 13.4.3 ran this workflow for batch-one service, deriving an M/M/1 utilization threshold of 68 percent from equation 5 and arriving at 36 H100s with headroom for a 5,000 QPS target. The plan extends to batched service by the same arithmetic. Applying the same utilization factor to the saturated batched rate of 7,040 img/s in table 18 gives 2 H100 before headroom and 3 after; the batch-1 plan needed 27 and 36.
This arithmetic compares assumed capacities under different service models; it does not establish equal p99 latency. Batching changes service times, realized batch sizes, and waiting distributions, so the factor derived for unbatched M/M/1 service cannot by itself certify the batched plan. The throughput opportunity is the batching gain of section 13.5; its usable capacity requires a load test including formation delay and worker backlog. This scenario provisions peak load plus 30 percent headroom; production margins depend on the workload and policy. Autoscaling can reduce costs during low-traffic periods while meeting latency objectives during peaks; Infrastructure as code develops the operational policy layer around these serving calculations. Capacity must be sized for requests that meet the SLO, not for raw request volume.
13.10.3 Production case study: Serving 8-billion-parameter Llama 3
When a team deploys an 8-billion-parameter Llama 3 chat service on a single H100 under a 200 ms TTFT and 20 ms TPOT budget, does GPU memory capacity, prefill compute, or decode bandwidth cap the number of requests per hour, and what does each million tokens cost? The serving bounds of section 13.9 become a dollar figure only when they meet a concrete workload, an SLO, and an hourly rental rate. This case study costs out that single-H100 deployment, reusing the decode floor and the cache budget derived earlier rather than re-deriving them. Unlike the 70-billion-parameter scale-up in figure 8, the 8-billion-parameter model fits on one GPU with substantial memory headroom, so batching, prompt prefill, and autoregressive decoding can be balanced on a single device without multi-node sharding.
Workload profile
The following fixed workload assumptions define the reference case used throughout the latency, memory, and economics calculations; together, they bound the analyses that follow:
- Model: 8-billion-parameter Llama 3 (quantized to 4-bit using activation-aware weight quantization (AWQ); see Numerical Precision: Changing How Values Are Stored for quantization techniques) (Dubey et al. 2024; Lin et al. 2024).
- Hardware: 1\(\times\) NVIDIA H100 SXM5 GPU (80 GB HBM3 device capacity, equivalent to 85.9 GB on the decimal basis used for tensor footprints, 3.35 TB/s bandwidth) (Choquette 2023).
- Request characteristics: 1,000-token input prompt (Prefill), 256-token generated response (Decode).
- Target SLOs: TTFT \(<\) 200 ms, TPOT \(<\) 20 ms.
Dubey, Abhimanyu, Abhinav Jauhri, Abhinav Pandey, Abhishek Kadian, et al. 2024. The Llama 3 Herd of Models. arXiv preprint arXiv:2407.21783.
Lin, Ji, Jiaming Tang, Haotian Tang, Shang Yang, Wei-Ming Chen, Wei-Chen Wang, Guangxuan Xiao, Xingyu Dang, Chuang Gan, and Song Han. 2024. “AWQ: Activation-Aware Weight Quantization for on-Device LLM Compression and Acceleration.” Proceedings of Machine Learning and Systems 6: 87–100.
Choquette, Jack. 2023. “NVIDIA Hopper H100 GPU: Scaling Performance.” IEEE Micro 43 (3): 9–17. https://doi.org/10.1109/mm.2023.3256796.
Latency deconstruction
The end-to-end request latency is governed by the two-phase execution model of autoregressive transformers, applying the TTFT and TPOT metrics defined in section 13.9.1. Prefill determines whether the user sees a prompt response quickly; decode determines whether the generated stream keeps moving after it starts.
Prefill phase (time to first token)
The model processes the 1,000-token prompt in parallel. Assuming 40 percent of peak compute efficiency during prefill, the model-side TTFT estimate is 41.9 ms, comfortably within the 200 ms SLO and leaving the remaining budget for network ingress, tokenization, and queueing.
Decode phase (time per output token)
The model generates 256 tokens sequentially. At batch one, this phase is memory-bandwidth bound: each step streams the 4 GB weight tensor from VRAM. A batched step amortizes that stream across its active sequences.
Dividing the 4 GB weight tensor by the 3.35 TB/s bandwidth yields the theoretical floor: \(\DecodeTokenTimeFloor\approx\) 1.2 ms. Adding an assumed residual per-layer dispatch cost after graph capture gives a modeled TPOT of 1.57 ms. This dispatch overhead reflects the cumulative cost of launching 8–10 discrete GPU kernels (RMSNorm, RoPE, projections, attention, multilayer perceptron (MLP)) across each of the model’s 32 layers. At batch size one, launching $$250–300 small kernels adds several milliseconds of CPU-GPU submission and driver overhead, which serving engines mitigate by capturing the decode graph into a single CUDA Graph. Generating all 256 tokens therefore takes 256 tokens \(\times\) 1.57 ms = 0.40 s.
Memory and throughput
With 4-bit weights occupying 4 GB, the remaining ~81.9 GB is available for the KV cache and runtime workspace, and the case study sets aside the cache reserve below while leaving the rest as workspace headroom. AWQ compresses the weights to 4 bits but leaves the KV cache in 16-bit precision, so each token still costs the approximately 0.131 MB of FP16 cache derived for this model in section 13.9.5.1. Dividing the 77.3 GB reserve by that per-token cost yields capacity for ≈ 0.6 million tokens, so at 1,256 tokens the GPU can hold a concurrent batch size of ~469 requests.
Unit economics
Consider a representative H100 SXM5 rental cost of approximately $3/hour and an assumed isolated prefill rate of 10,000 prompt tokens/s, deliberately below the rate implied by the model-side TTFT estimate above to allow for scheduling and kernel inefficiency. Dividing that rate by the 1,000-token prompt gives the prefill request capacity. For this calculation, each completed request counts both prompt and generated output tokens, totaling 1,256 tokens. Multiplying the limiting request rate by this token count and the seconds in an hour gives 45.2 million tokens/hour; dividing the hourly rental cost by that throughput gives $0.066/million tokens.
The comparison also converts KV residency into a request rate by dividing the resident request count by the modeled time to complete prefill and decode. It assumes that all those resident requests can advance at the modeled per-request pace, which is an optimistic concurrency assumption rather than a measured decode capacity. Under these assumptions, isolated prefill supplies the smaller rate and sets the displayed cost floor. Shared prefill/decode contention, batched decode timing, runtime workspace, and SLO-qualified throughput determine whether the service realizes that rate; memory fit alone does not establish it. The resulting cost floor is a bound for this workload, and a load experiment must supply the missing service capacity before the same arithmetic can price an accepted deployment configuration.
Checkpoint 13.6: Complete the LLM capacity decision
For large language models, memory capacity (the size of the unallocated VRAM dedicated to the KV cache) determines maximum concurrent residency, while prefill compute and decode bandwidth determine realized token throughput and cost under a specific traffic mix. Memory bandwidth bounds low-batch decode latency; larger batches amortize parameter movement and shift the limit toward compute or KV-cache traffic. Physical constraints govern serving economics across the entire stack: latency budgets partition into prefill and decode phases, queueing theory dictates batch sizing and capacity headroom, and memory bandwidth bounds decode throughput. Misinterpreting these interactions leads directly to the operational fallacies and pitfalls that follow.
Self-Check: Question
A team evaluates deploying a small classification model with an average arrival rate of 5 QPS and a 200 ms latency SLA. Measurements at 5 QPS show that both a single CPU server instance and a single GPU server instance meet the matched quality target and the p99 latency target of 200 ms. The CPU instance costs $0.20/hour and sustains up to 20 QPS under the target latency; the GPU instance costs $2.00/hour and sustains up to 200 QPS under the target latency. Which deployment option is more cost-effective for this specific workload, and why?
- The GPU server is more cost-effective because its 10x greater SLO-qualified peak throughput more than offsets its 10x higher hourly cost, making it the lower-cost choice even at 5 QPS.
- The GPU server is more cost-effective because GPUs always have lower total cost of ownership regardless of arrival traffic.
- The CPU server is more cost-effective because at 5 QPS, it already meets the SLA with adequate headroom at $0.20/hour, whereas the GPU server would use only 2.5% of its SLO-qualified capacity and cost about \(10\times\) more per served query at that traffic level.
- Neither option is viable because 5 QPS requires at least a 10-node cluster for high availability.
In capacity planning for a mission-critical model serving cluster with a peak expected traffic of \(\lambda_{\text{peak}} = 1\text{,}000\text{ QPS}\) and an individual replica capacity of \(R = 100\text{ QPS}\) at its target latency SLO, why would a capacity engineer provision 16 to 20 replicas (\(1.6\times\text{--}2.0\times\) headroom multiplier) rather than exactly 10 replicas?
True or False: For an 8-billion-parameter LLM with 32 layers, 8 KV heads, and head dimension 128, deployed in FP16 precision with a 16 GB weight footprint on an 80 GB GPU, serving long-context requests with batch size \(B = 8\) and context length \(S = 32\text{,}768\) tokens causes the KV cache to exceed the static weight footprint of the model itself.
An engineer serves an 8-billion parameter LLM on a GPU with 2 TB/s of High-Bandwidth Memory (HBM) bandwidth. Assume the model weights are 16 GB in FP16, the decode step effectively streams those 16 GB of weights from HBM each token at batch size \(B = 1\), and ignore KV-cache traffic and compute time. What is the theoretical hardware-bandwidth lower bound on Time Per Output Token (TPOT)?
- \(8.0\text{ ms}\) (\(\text{TPOT} = 16\text{ GB} / 2\text{,}000\text{ GB/s}\))
- \(0.8\text{ ms}\) (\(\text{TPOT} = 1.6\text{ GB} / 2\text{,}000\text{ GB/s}\))
- \(80.0\text{ ms}\) (\(\text{TPOT} = 160\text{ GB} / 2\text{,}000\text{ GB/s}\))
- \(0.08\text{ ms}\) (\(\text{TPOT} = 16\text{ MB} / 2\text{,}000\text{ GB/s}\))
When LLM decode at small batch sizes is dominated by moving model weights rather than by arithmetic throughput, why can INT4 weight-only quantization (e.g., AWQ or GPTQ) reduce Time Per Output Token (TPOT), and what limits the gain even if INT4 compute kernels provide no higher FLOP/s than FP16 Tensor Cores?
Calculate the total memory footprint (in bytes) required to store the KV cache for a batch of \(B = 16\) requests, each with an active context length of \(S = 2\text{,}048\) tokens, for a model with \(L = 32\) transformer layers, \(H_{\text{kv}} = 8\) key-value attention heads (Grouped-Query Attention), head dimension \(D_{\text{head}} = 128\), stored in FP16 precision (\(P = 2\text{ bytes}\)).
13.11 Fallacies and Pitfalls
Serving inverts training priorities in ways that violate intuitions from batch processing. The nonlinear relationship between utilization and latency, the hidden costs of preprocessing, and the silent failure modes of training-serving skew cause violated SLOs, wasted optimization effort, and accuracy degradation invisible to standard monitoring.
Fallacy: Reducing model inference latency proportionally reduces user-perceived latency.
Engineers who optimize model inference expect proportional improvement in user-perceived latency, but serving systems introduce latency sources absent from offline benchmarks. Under load, queuing delay dominates: equation 4 shows that at 80 percent utilization with 3.5 ms service time, average wait time is 14.1 ms before inference even begins. Reducing inference from 3.5 ms to 1.8 ms changes service time but also shifts utilization from 80 percent to 41 percent, reducing queuing wait from 14.1 ms to 1.2 ms, a 12× queuing improvement that dwarfs the 1.7 ms inference gain.
This nonlinear interaction between inference speed and queuing behavior produces an apparent paradox: the system-level speedup (17.6 ms → 3.0 ms, or 6×) far exceeds the model-level speedup (3.5 ms → 1.8 ms, or 2×). At first glance, this superlinear improvement appears to contradict Amdahl’s law, which states that total system speedup is strictly bounded by the enhanced execution fraction. However, the fixed-fraction Amdahl calculation holds other stage costs unchanged; serving is a dynamic queueing system. Average queue waiting time scales nonlinearly with server utilization: \(\QueueWaitTime \propto \frac{\ServingUtilization}{1 - \ServingUtilization}\), where \(\ServingUtilization = \ArrivalRate \cdot \BatchServiceTime(1)\) for unbatched service. When kernel optimization cuts service time \(\BatchServiceTime(1)\), it does not merely accelerate execution; it simultaneously lowers server utilization \(\ServingUtilization\). Pulling utilization away from saturation collapses queue waiting times nonlinearly. A kernel optimization therefore shortens the request twice, once in the service time and again in the queue that the lower utilization drains. Conversely, profiling inference latency in isolation without modeling arrival load conceals the primary driver of user-perceived performance.
Pitfall: Running serving infrastructure at high utilization to maximize cost efficiency.
Teams target 90 percent utilization to minimize idle capacity. In production, latency degrades nonlinearly as utilization approaches capacity. Equation 4 shows that at 90 percent utilization, average time in system reaches 10× service time. Moving from 70 percent to 90 percent utilization cuts modeled infrastructure cost by 22.2 percent but triples average latency. For a 3.5 ms inference service, modeled p99 latency rises from ~54.1 ms to ~162 ms under the M/M/1 assumptions. In this scenario, operating at 60 to 70 percent utilization preserves substantially more latency headroom than 90 percent. A production target must instead be selected from the measured arrival process, service-time distribution, SLO, failure reserve, and cost objective.
Fallacy: Training accuracy guarantees serving accuracy.
Engineers assume identical model weights preserve validation-set performance. In production, preprocessing differences can shift inputs outside the training distribution. Section 13.8.5 explains how resize interpolation, numerical precision, and feature timing can create skew despite identical weights. Validation accuracy holds only over the population it sampled (principle 9), and a serving path that transforms inputs differently presents the model with a different population. The illustrative scenario here drops from 95 percent to 90 percent, a 5 percentage-point loss; these values are not a reported production incident. Production systems require consistent preprocessing and task-quality monitoring because latency and exception checks cannot detect this failure.
Pitfall: Using average latency to evaluate serving system performance.
Engineers monitor average latency because it trends smoothly and is simple to compute. An average, however, cannot show whether the percentile named by an SLO is failing. As section 13.4.3 demonstrates, at 70 percent utilization with 3.5 ms service time, average latency is 11.8 ms but the modeled p99 reaches 54.1 ms, a 4.6× gap invisible to mean-based monitoring. Services therefore report the relevant latency distribution and SLO percentile rather than the mean alone.
Fallacy: Larger serving batches always improve throughput without affecting latency SLOs.
Engineers maximize batch size assuming GPU saturation improves cost efficiency under production load. In serving systems, however, batching introduces a latency-throughput trade-off governed by queuing dynamics absent from offline benchmarks. Accumulating requests into larger batches increases wait time for early arrivals. An oldest-request window of 10 ms can add up to 10 ms of formation wait if the batch-size trigger does not fire first. Waiting for an available worker can add further delay; the combined distribution determines p99 latency. For the chapter’s ResNet-50 profile on the H100 (section 13.5.5), increasing batch size from 16 to 32 raises saturated throughput by 77 percent and per-batch inference time only from 4.0 ms to 4.5 ms; at 500 QPS, however, filling the larger batch raises mean formation wait from 15 ms to 31 ms, and variable input sizes within a batch can create padding overhead that wastes compute on padding tokens. Section 13.5.4 shows why, for tight p99 targets, larger batch sizes can violate SLOs when batch formation delay plus increased per-batch inference time exceeds the latency budget. Serving batch optimization requires jointly tuning batch size, batch timeout, and concurrency against latency SLOs under realistic traffic patterns, not maximizing throughput in isolation.
Pitfall: Calibrating quantization ranges with unrepresentative data.
Teams may calibrate with a convenient sample even when it does not represent the supported deployment distribution. Post-training quantization determines INT8 scale factors from activation ranges in calibration data, so representative coverage matters. The illustrative scenario here drops from 76.1 percent to 72.9 percent, a 3.2 percentage-point loss; it is not a reported production incident. Effective quantization requires calibration and validation on data representative of the inputs the service is expected to handle.
Fallacy: Cold start latency only matters for the first request.
Engineers optimize steady-state latency assuming most requests hit warm instances. Cold starts compound during traffic spikes, deployments, and recovery, which is exactly when capacity is most needed. In this illustrative scenario, 10 instances each require 30 s of compilation, totaling 300 instance-seconds; parallel warming makes capacity useful after about 30 s, and a request that reaches a replica before warmup completes waits about 500 ms instead of 5 ms. Autoscaling policies that count only steady-state replicas therefore underestimate the capacity a spike requires. The scale-out budget must include compilation, weight loading, cache initialization, and health-check time (section 13.8.1), and warm pools of pre-initialized spare replicas, precompiled engines, staged model loading, or admission control keep new replicas from becoming another source of tail latency.
Self-Check: Question
A team attempts to maximize hardware cost efficiency by targeting 95% steady-state utilization \(\rho\) across their production serving queue. Why is this strategy a dangerous engineering pitfall?
- High utilization permanently erases model weights from GPU memory registers.
- In stochastic serving systems, queue waiting times grow asymptotically toward infinity as utilization approaches 100%, causing minor traffic fluctuations to trigger massive tail-latency spikes and widespread SLO breaches.
- Running above 90% utilization forces the operating system to switch from 64-bit to 32-bit execution mode.
- Modern GPUs automatically shut down power when utilization exceeds 80% for more than 10 seconds.
True or False: Evaluating an online serving system using mean (average) latency is sufficient for capacity planning, because if the average latency is well below the SLA target, user-facing requests are guaranteed to experience good performance.
Why is the assumption that ‘cold-start latency only affects the very first request’ a critical fallacy in autoscaling serverless or Kubernetes-based serving environments with bursty traffic?
An engineering team increases the dynamic batch size on their vision model serving nodes from 8 to 64. Offline peak throughput doubles, and production traces show batch-formation wait time grew sharply after the change. User-facing p99 latency violations then increase by 40%. What fallacy explains this outcome?
- Model weights become corrupted when executed with batch sizes greater than 16.
- GPU Tensor Cores disable INT8 acceleration when batch size exceeds 32.
- High batch sizes reduce arithmetic intensity on the GPU Roofline model.
- The fallacy that larger serving batches always improve throughput without affecting latency; early-arriving requests can spend too much of the latency budget waiting in the batcher before execution.
Describe the pitfall of ‘Calibrating quantization ranges with unrepresentative data,’ and explain how it can lead to silent production failure despite passing offline validation checks.
13.12 Summary
Serving moves a validated model into an operating workload. Online requests add a latency distribution, queueing, traffic variability, and failure reserve to the throughput concerns familiar from training. Little’s Law relates stable long-run population, arrival rate, and response time; M/M/1 supplies an intentionally simple model of nonlinear latency growth near saturation. Neither replaces measurement, but together they turn headroom and capacity into explicit hypotheses that a load test can validate.
Effective serving optimization measures the complete request path rather than model inference alone. Protocol and serialization choices matter when transport is a visible fraction of the budget; preprocessing matters when it feeds an accelerator too slowly; batching matters only when arrivals and the SLO permit waiting. Training-serving skew adds a different failure mode. The service can remain fast and error-free while inconsistent transformations silently change its predictions.
The chosen deployment paradigm changes the feasible request path. A cloud API may use dynamic batching under a measured arrival process, synchronized sensors impose a frame deadline, and a single-stream mobile workload may choose batch one to protect responsiveness and energy. The MLPerf scenarios provide standardized approximations of these shapes; production design still begins with the service’s own traffic, hardware, and objective.
Node-level optimization connects the model’s operations to the machine that executes them. Profiling reveals whether compilation, kernel fusion, precision, locality, serialization, or loading actually binds the request path. Gains matter only when they survive production input shapes, accuracy checks, and latency variation. Token-streaming language models stretch the whole toolkit at once. On the chapter’s GPT-2 XL service, a batch-one decode step can be no faster than the 0.9 ms an H100 needs to read the model’s weights. Latency splits into time to first token and time per output token, batching must reschedule at every generated token, and the KV cache, not arithmetic, bounds how many requests can share an accelerator. Capacity planning converts that valid throughput into replica count and unit cost, while the Llama 3 case study in section 13.10.3 separates calculable capacity bounds from the load experiment needed to establish valid throughput. A faster kernel that neither reduces provisioned capacity nor improves the SLO has not produced an economic gain.
Every row of the chapter map (table 1) reduces to a few counting rules, collected in table 19. Each formula links an observable workload parameter—arrival rate, service time, batch window, weight volume, or hourly node rate—to the operational metric it governs. Together they let an engineer estimate a service’s latency budget, headroom, batch size, decode floor, and cache budget before a load test confirms them.
| Quantity | Formula | Where derived |
|---|---|---|
| Requests in the system | \(\RequestConcurrency = \ArrivalRate \cdot \RequestTimeInSystem\) | equation 3 |
| Mean time in system (M/M/1) | \(\RequestTimeInSystem = \frac{\text{service time}}{1 - \ServingUtilization}\) | equation 4 |
| p99 time in system (M/M/1) | \(\TailRequestLatency\approx \frac{4.6 \cdot \text{service time}}{1 - \ServingUtilization}\) | equation 5 |
| Count-triggered batch latency | \(\BatchedRequestLatency\approx \frac{\BatchSize-1}{2\ArrivalRate} + \BatchServiceTime(\BatchSize)\) | equation 6 |
| Mean wait in a fixed window | \(\mathbb{E}[\BatchingQueueWait] = \frac{\BatchingWindow}{2}\) | equation 8 |
| Saturated batched capacity | \(\EffectiveServiceRate(\BatchSize) \approx \frac{\BatchSize}{\BatchServiceTime(\BatchSize)}\) | equation 10 |
| Tail batch envelope | \(\BatchLatencyEnvelope= \BatchingWindow+ \BatchServiceTime(\TailRequestSeenBatchSize)\) | equation 12 |
| Decode floor per token | \(\DecodeTokenTimeFloor\approx \frac{\DataVolume}{\AcceleratorMemoryBandwidth}\) | equation 14 |
| Tokens per speculative round | \(\frac{1-\DraftAcceptanceRate^{\DraftTokenCount+1}}{1-\DraftAcceptanceRate}\) | equation 15 |
| KV cache per token | \(2\,\LayerCount\,\KvHeadCount\,\AttentionHeadDimension\,\ElementStorageSize\) bytes | section 13.9.5.1 |
| Cost per inference | Allocated hourly cost divided by completed inferences per hour that meet the SLO | section 13.10.1 |
Key Takeaways: Inverting every training priority
- Serving is latency economics: Training rewards throughput over long runs, but serving spends a fixed per-request budget across serialization, preprocessing, queuing, inference, postprocessing, and the network. Optimizing only model latency misses the stages users actually wait on.
- Utilization turns into waiting: In the chapter’s M/M/1 approximation, average time in system rises from 5\(\times\) service time at 80 percent utilization to 10\(\times\) at 90 percent. Headroom keeps modest traffic surges from becoming SLO failures.
- Fast models expose the rest of the pipeline: Once inference is fast, image decode, tokenization, and other preprocessing can dominate total latency. The binding optimization becomes the request path, not the neural network kernel.
- Batching follows traffic, not habit: Poisson-modeled web arrivals can use dynamic batching, synchronized sensors need aligned batches, and single-stream mobile workloads may have little batching opportunity. A useful window converts available latency slack into throughput without violating the SLO.
- Skew breaks accuracy without errors: Resize methods, color-channel order, normalization constants, or feature definitions that differ between training and serving can change the model’s effective input distribution. Shared transformations, parity tests, and production-slice monitoring reduce this risk.
- Runtime choices become infrastructure cost: Precision, graph compilation, kernel fusion, and serving runtime translate directly into replica count and cost per inference. Quantization and specialized runtimes can materially reduce required serving capacity when they preserve accuracy and fit the target hardware.
- LLM serving is memory management: Decode often reads weights from VRAM for every generated token, so token latency is bandwidth-bound unless batching changes the constraint. KV-cache layout, PagedAttention, continuous batching, precision, and runtime choice determine both concurrency and cost per token.
Training is judged by useful work completed; an online service is judged by whether requests meet their latency objective. Each stage draws on the same latency envelope: serialization, preprocessing, the queue, the model, and the response. Data determines input size and arrival shape, the algorithm determines compute and state, and the machine determines service rate and movement costs. Queueing couples all three nonlinearly, so a system within budget at moderate traffic can breach it after a small surge. Serving engineering therefore allocates the budget across the request path, preserves headroom for variability and failure, and verifies that the required fraction of requests finishes before the deadline, which is the latency budget principle (12) in operational form.
What’s Next: From fast to still correct
This chapter evaluates the request path under a specified workload: latency within budget, headroom preserved, and useful throughput converted into cost. Those performance checks do not establish whether the answers are still right. Training-serving skew showed that a service can stay fast and error-free while its predictions change, and drift produces the same silence when the world moves rather than the pipeline. ML Operations widens the unit of concern from request-path performance to the model’s operating lifetime. Monitoring tracks prediction quality alongside system health, feature stores and model registries keep serving aligned with training, and staged rollout with rollback lets a replacement model reach users without turning a bad release into an outage.
13.13 Self-Check Answers
Self-Check: Answer
When transitioning a deep learning model from training to an online serving environment, how does the system constraint in the D·A·M (Data-Algorithm-Machine) taxonomy fundamentally shift regarding machine utilization and algorithm state?
- Machine utilization must be maximized at 100% to amortize capital costs, while the algorithm continues parameter backpropagation during request serving.
- Machine capacity must maintain operational headroom below saturation to prevent tail-latency queueing collapse, while the algorithm’s weights remain fixed for a deployed version.
- Machine allocation switches from accelerators to general-purpose CPUs exclusively, while the algorithm dynamically modifies its architecture per incoming user payload.
- Machine throughput replaces latency as the primary operational constraint, while data volume shifts from live request streams to historical offline batches.
Answer: The correct answer is B. In online serving, the machine-side priority shifts from maximizing average utilization to preserving headroom, because queueing delay grows nonlinearly as utilization approaches saturation and can break tail-latency SLOs. At the same time, a deployed serving path runs forward-only inference on fixed model weights rather than updating them with backpropagation. The 100 percent utilization view fits training better than latency-sensitive serving, and serving does not imply abandoning accelerators or making throughput the primary constraint.
Learning Objective: Analyze the fundamental architectural and operational shifts in the D·A·M taxonomy when transitioning machine learning models from offline training to online serving.
True or False: In online model serving, the latency term (\(L_{\text{lat}}\)) in the iron law of ML systems must encompass external factors such as network round-trip time, request serialization, and system orchestration, rather than solely the accelerator kernel execution time.
Answer: True. In an operational online serving system, user-perceived response time includes client-server network transport, ingress routing, payload serialization/deserialization, queue waiting time, and CPU preprocessing/postprocessing in addition to accelerator forward-pass execution. Consequently, optimizing only the raw accelerator kernel latency often yields diminishing returns if orchestration and transport overheads dominate the latency envelope.
Learning Objective: Evaluate how end-to-end serving latency budgets extend beyond isolated accelerator kernel execution times.
Explain why achieving high average throughput during offline benchmarking does not guarantee that an online serving system will satisfy its tail-latency Service-Level Objective (SLO) during production traffic spikes.
Answer: A high offline throughput number shows what the model and runtime can sustain under the benchmarked conditions, but it does not by itself prove that live requests will meet a tail-latency SLO. In production, arrival timing, queueing, preprocessing, and network overhead all vary over time; a system that looks strong in a saturated or controlled benchmark can still miss p99 targets when bursts consume its headroom. The practical implication is that serving capacity must be validated under representative traffic and percentile-latency measurements, not inferred from throughput alone.
Learning Objective: Explain why steady-state throughput benchmarks fail to predict tail-latency degradation under stochastic online arrival workloads.
An e-commerce platform evaluates precomputing product recommendations offline (static inference) versus computing them on demand when a user visits the homepage (dynamic inference). Which trade-off correctly characterizes static inference compared to dynamic inference?
- Static inference eliminates database storage costs but increases real-time p99 latency by executing large batched matrix multiplications during user page loads.
- Static inference guarantees real-time contextual adaptation to intra-session user clicks but requires dedicated high-end GPUs on the critical request path.
- Static inference trades storage capacity and potential prediction staleness for retrieval latency that avoids per-request model execution, whereas dynamic inference provides fresh predictions from live context at the expense of computational latency and variable serving capacity.
- Static inference requires running unbatched single-sample inferences across microcontrollers, whereas dynamic inference processes large offline shards across cloud clusters.
Answer: The correct answer is C. Static inference precomputes predictions offline and serves the request from stored results, so it trades extra storage and possible staleness for lookup-based serving that avoids live model execution on the critical path. Dynamic inference instead uses fresh live context, but each request must pay the compute and capacity cost of on-demand serving. The claim that static inference removes storage gets the trade-off backward, and precomputed outputs cannot react immediately to intra-session changes.
Learning Objective: Compare the trade-offs between static precomputation and dynamic on-demand inference regarding latency, freshness, storage, and compute provisioning.
Why does bare-metal TinyML serving on microcontrollers (e.g., ARM Cortex-M) preclude the use of standard cloud serving frameworks (like Triton or vLLM), and what architectural adaptations are required?
Answer: Microcontrollers operate under a very different runtime envelope from cloud servers: they have tightly constrained SRAM working memory, weights often live in flash, and deployment may run bare-metal or on a small RTOS rather than a full server OS. A Cortex-M target therefore uses a compact embedded runtime with preplanned buffers and a firmware-style execution path instead of a cloud serving stack built for networked processes, dynamic scheduling, and large accelerator memory. In practice, this often pushes engineers toward ahead-of-time compilation, static allocation, and compact quantized models, even though the exact numeric format and hardware features vary by device.
Learning Objective: Analyze the hardware and runtime constraints that distinguish bare-metal TinyML deployment from networked cloud serving architectures.
Self-Check: Answer
- **Order the sequential stages of a request passing through a high-performance decoupled inference serving pipeline from initial arrival to client response:
- Hardware Accelerator Execution (tensor kernel execution on GPU/NPU)
- Dynamic Batcher (aggregating incoming items up to max batch size or timeout)
- Network Ingress & Gateway (TLS termination, authentication, protocol deserialization)
- Postprocessing & Response Dispatch (logit normalization, top-\(k\) filtering, response serialization)
- Request Queue (absorbing traffic bursts and buffering pending requests)
- Inference Runner / Engine (tensor memory management, CUDA stream scheduling)**
Answer: The correct order is: 1. (3) Network Ingress & Gateway (TLS termination, authentication, protocol deserialization) 2. (5) Request Queue (absorbing traffic bursts and buffering pending requests) 3. (2) Dynamic Batcher (aggregating incoming items up to max batch size or timeout) 4. (6) Inference Runner / Engine (tensor memory management, CUDA stream scheduling) 5. (1) Hardware Accelerator Execution (tensor kernel execution on GPU/NPU) 6. (4) Postprocessing & Response Dispatch (logit normalization, top-\(k\) filtering, response serialization)
Explanation: A request arrives at the Network Ingress for TLS termination and protocol handling, buffers in the Request Queue during bursts, gets grouped with other concurrent requests by the Dynamic Batcher, is prepared and scheduled by the Inference Runner onto GPU streams, executes on the Hardware Accelerator, and finally undergoes Postprocessing and response serialization before returning to the client.
Learning Objective: Design the end-to-end request pipeline of a modern inference server by ordering its architectural stages.
In a microservices architecture where measurements show JSON serialization and parsing are a visible bottleneck in an internal fraud detection service processing \(10^5\) queries per second under a 5 ms SLA, why is gRPC with Protocol Buffers preferred over HTTP/1.1 with JSON?
- JSON text parsing is performed directly inside GPU Tensor Cores, whereas Protocol Buffers require host CPU preprocessing.
- HTTP/1.1 provides automatic iteration-level continuous batching, whereas gRPC only supports static batching.
- Protocol Buffers eliminate the need for schema definitions, enabling zero-copy dynamic typing across heterogeneous languages.
- Protocol Buffers use compact binary encoding with pre-compiled schema parsers that can reduce CPU serialization overhead, and gRPC multiplexes requests over persistent HTTP/2 connections.
Answer: The correct answer is D. When serialization is a visible part of the latency budget, compact binary messages and generated parsers can cut host CPU overhead relative to JSON, and gRPC’s HTTP/2 transport supports multiplexing over long-lived connections. HTTP/1.1 can also use persistent connections, so the point is reduced host-side overhead and better transport behavior under this workload, not an inherent handshake on every request. JSON parsing happens on host CPUs, not Tensor Cores, and batching behavior is a serving-engine decision rather than a transport feature.
Learning Objective: Evaluate interface protocols and serialization formats (REST/JSON vs. gRPC/Protobuf) for latency-critical serving pipelines.
What is the ‘serialization bottleneck’ in model serving, and under what operational conditions (model size, request payload, query rate) does it become the dominant factor in the end-to-end latency budget?
Answer: The serialization bottleneck appears when packing or unpacking request payloads on the host CPU takes enough time that it rivals or exceeds the model’s own execution time. This is most likely with lightweight or highly optimized models, large tensor payloads or feature vectors, and high query rates where repeated parsing and allocation consume a noticeable share of CPU time. The practical implication is that teams should confirm the bottleneck with per-stage timing before changing protocols or formats, rather than assuming serialization dominates every serving path.
Learning Objective: Analyze the conditions under which serialization overheads dominate model inference execution in serving architectures.
True or False: Replacing HTTP/1.1 REST endpoints with gRPC automatically accelerates the GPU kernel execution time of deep learning models by \(2\times\) to \(4\times\).
Answer: False. Changing the transport protocol does not automatically make the model’s GPU kernels run faster; with the same tensors and backend, the underlying math kernels are unchanged. Protocol changes can still improve end-to-end behavior by reducing CPU and transport overhead or by easing contention elsewhere in the serving stack.
Learning Objective: Evaluate transport/serialization layer optimizations and distinguish them from accelerator computation in model serving pipelines.
In an inference server architecture, what is the primary role of decoupling the request queue from the dynamic batcher?
- It allows the server to permanently cache all intermediate GPU activations across independent client requests.
- It allows the system to buffer irregular arrivals and present the batcher with pending work so it can form batches within a timeout budget.
- It eliminates the need for GPU kernel compilation by converting dynamic input shapes into fixed static tensors in the queue.
- It bypasses host RAM by streaming network packets directly from the NIC into the accelerator’s L2 cache via PCIe peer-to-peer transfers.
Answer: The correct answer is B. Separating the request queue from the batcher gives the system a bounded buffer between arrival and execution, so short bursts can be absorbed and the batcher can choose when to dispatch based on queue depth and timeout. That does not guarantee no drops under overload, and it does not guarantee an optimal batch every time. Queueing also does not eliminate compilation work or imply a specific zero-copy network path to the GPU.
Learning Objective: Explain the function of queue decoupling and dynamic batching in inference server design.
A high-throughput model serving cluster sits behind a Layer 7 load balancer. Which routing approach is most appropriate for reducing p99 tail latency when inference times vary significantly across requests due to variable input sequence lengths?
- A load-aware policy such as least-connections or least-loaded routing, which steers new requests away from replicas that already appear busy or backlogged.
- Static round-robin routing, which deterministically rotates incoming connections across all healthy replicas regardless of current queue depths.
- Random routing with hash-based sticky IP assignment, which pins client IP addresses permanently to specific backends without monitoring load.
- Maximum-throughput greedy allocation, which concentrates all incoming traffic onto a single primary replica until its memory is completely saturated before spilling over.
Answer: The correct answer is A. When request service times vary, routing should account for current load or backlog so new work is less likely to land behind long-running requests. A load-aware policy can reduce tail latency if its load and health signals are accurate. Round-robin ignores current queue depth, sticky hashing can trap traffic on a slow replica, and intentionally saturating one node drives the exact queue growth that serving tries to avoid.
Learning Objective: Design load balancing and request routing strategies to mitigate tail latency under variable service-time distributions.
Self-Check: Answer
An image classification service has an end-to-end SLA of 30 ms. Assume the request path is a serial pipeline with unchanged non-GPU stages, no introduced overhead from the optimization itself, and no queueing feedback effects. The request path consists of: network ingress/egress (8 ms), CPU image decoding and normalization (10 ms), GPU forward pass (8 ms), and postprocessing/top-\(k\) filtering (2 ms). If an engineer optimizes the GPU model forward pass to run in 4 ms (a \(2\times\) speedup), what is the new total latency and what architectural principle explains the resulting overall speedup?
- Total latency decreases from 28 ms to 24 ms (a 14.3% latency reduction, about a \(1.17\times\) speedup), demonstrating Amdahl’s law where unchanged serial stages bound the system gains.
- Total latency decreases from 28 ms to 14 ms (a 50% overall improvement), because GPU acceleration propagates linearly across all pipeline stages.
- Total latency remains 28 ms because dynamic batching automatically inserts artificial delay to fill GPU occupancy.
- Total latency increases to 32 ms due to host-device synchronization overhead incurred by faster kernel launches.
Answer: The correct answer is A. The original serial path is \(8 + 10 + 8 + 2 = 28\text{ ms}\). Cutting only the GPU stage from 8 ms to 4 ms yields \(8 + 10 + 4 + 2 = 24\text{ ms}\), which is a \(14.3\%\) latency reduction and about a \(1.17\times\) end-to-end speedup. This is the serving form of Amdahl’s law: if the other stages are unchanged and no new queueing or overhead is introduced, they bound the total gain.
Learning Objective: Calculate end-to-end latency improvements using Amdahl’s Law across multi-stage serving pipelines.
What is the ‘killer microseconds’ problem in low-latency ML serving systems, and why do standard operating system scheduling and hardware primitives struggle to handle it efficiently?
Answer: The ‘killer microseconds’ problem refers to operations that take between \(1\,\mu\text{s}\) and \(100\,\mu\text{s}\) (such as fast tensor copies, micro-batch inference, or inter-process IPC). This timescale falls into an architectural gap: it is too long to waste CPU cycles in busy-wait polling/spinlocks, but too short to amortize the overhead of operating system thread context switches, interrupts, and kernel transitions (which cost several microseconds), resulting in high CPU overhead or significant latency jitter.
Learning Objective: Analyze the system trade-offs underlying the killer microseconds problem in low-latency inference runtimes.
True or False: For computer vision models utilizing standard 2D convolutions or self-attention mechanisms, increasing the input image resolution from \(224 \times 224\) to \(448 \times 448\) quadruples the number of input pixels (\(4\times\)), which results in an approximately \(4\times\) increase in FLOPs for standard convolutional layers and up to a \(16\times\) increase for unwindowed full self-attention layers, assuming fixed channels, patch size, and architecture.
Answer: True. Doubling height and width multiplies the pixel or token grid by \(4\times\). With fixed channels, kernel sizes, patching, and no architecture changes, standard convolution arithmetic scales roughly with the number of spatial positions, giving about \(4\times\) more work, while the pairwise attention term in full unwindowed self-attention scales with the square of token count, giving up to \(16\times\) more work. That statement is about arithmetic scaling, not a guarantee that total latency rises by exactly the same factor.
Learning Objective: Evaluate computational complexity and latency scaling across varying input resolutions in vision serving systems.
A classification serving pipeline returns only the top-5 predictions to the client. Why is it often better to run top-\(k\) selection on the GPU before copying results back to the host?
- It retrains the model online so fewer logits must be stored in GPU memory.
- It guarantees lower latency in every deployment because GPUs always execute small reductions faster than CPUs.
- It reduces the payload that crosses PCIe from the full logit vector to just a few scores and indices, though the host must still budget the synchronization and copy needed to materialize those results.
- It avoids the need for any host-side postprocessing or response formatting after inference finishes.
Answer: The correct answer is C. Performing top-\(k\) on the device can shrink the result that crosses PCIe from a large logit tensor to a small set of scores and class indices, which often helps when transfer size matters. The trade-off is that materializing those results on the host still requires synchronization and a device-to-host copy, so the optimization reduces one serving cost rather than removing postprocessing entirely. A claim that GPUs are always faster for every such reduction ignores workload and runtime details, and top-\(k\) does not retrain the model.
Learning Objective: Analyze how GPU-side postprocessing can reduce transfer overhead while still requiring host-side synchronization in the serving path.
In a high-throughput vision serving pipeline, engineers overlap CPU image preprocessing of request \(N+1\) with GPU inference of request \(N\) using multiple CUDA streams and pinned host memory buffers, thereby increasing accelerator ____ without modifying the underlying model architecture.
Answer: duty cycle. Overlapping host preprocessing with device execution can raise the fraction of wall-clock time during which the accelerator has active kernels running, improving throughput without changing the model itself. That is a statement about active time, not achieved FLOP/s rate, and it does not guarantee the GPU stays fully busy all the time because the benefit still depends on whether upstream stages can keep feeding it.
Learning Objective: Apply request pipelining and double-buffering techniques to maximize accelerator duty cycle.
Self-Check: Answer
An online recommendation service handles an arrival rate of \(\lambda = 500\) queries per second. Instrumented telemetry reveals an average residency time (waiting time in queue + inference service time) of \(W = 40\text{ ms}\) (\(0.04\text{ s}\)). According to Little’s Law, what is the average number of concurrent requests (\(L\)) present in the serving system?
- \(L = 12.5\text{ requests}\)
- \(L = 200\text{ requests}\)
- \(L = 2\text{,}000\text{ requests}\)
- \(L = 20\text{ requests}\)
Answer: The correct answer is D. Little’s Law gives average in-system population as \(L = \lambda W\) for a stable system under a matched measurement boundary. Substituting \(500\,\text{requests/s}\) and \(0.04\,\text{s}\) yields \(L = 500 \times 0.04 = 20\text{ requests}\). The other answers come from mismatched units or arithmetic errors, such as treating milliseconds as seconds or using the wrong operation entirely.
Learning Objective: Calculate average in-system request population using Little’s Law.
In a distributed serving architecture, an aggregate user request fans out in parallel to 50 leaf model servers and must wait for all 50 responses before completing. Assume each leaf independently has a 1% probability of exceeding the same latency threshold, other latency sources are negligible, and all 50 requests are issued simultaneously. Explain the ‘tail at scale’ phenomenon and calculate the probability that the aggregate request suffers tail latency.
Answer: Tail at scale means a fan-out request inherits the slowest participating subrequest, so a small per-node tail probability can become a much larger end-to-end tail probability when many backends must all finish. Under the independence and shared-threshold assumptions, the probability that at least one of 50 leaves misses the target is \(1 - (0.99)^{50} \approx 39.5\%\). The practical implication is that single-node p99 performance is not enough when a user request depends on many parallel backends.
Learning Objective: Calculate fan-out tail-latency amplification in distributed multi-server inference architectures.
True or False: Hedged requests (speculative backup requests) reduce p99 tail latency by sending identical duplicate requests to multiple servers simultaneously for every incoming query upon arrival, without incurring any additional cluster compute overhead.
Answer: False. Hedging trades extra work for a chance to avoid stragglers, so it can add compute and queueing load rather than being free. Practical policies usually trigger duplicates only after a request looks slow relative to a reference distribution, but the extra load is not fixed: correlated slowdowns, traffic level, and cancellation behavior determine whether hedging helps or hurts.
Learning Objective: Evaluate the trade-offs and operational mechanics of hedged requests for tail-latency mitigation.
Order the following overload-handling workflow for a serving system from first diagnosis to final verification: (1) choose a mitigation that fits the current bottleneck and SLO trade-off, such as admission control, graceful degradation, or a batching change, (2) measure arrival rate, service time, queue depth, and observed tail latency, (3) identify the binding constraint from those measurements, such as overload, queue growth, or service-time inflation, (4) validate the chosen policy under representative load and confirm it improves SLO compliance.
Answer: The correct order is: (2) measure arrival rate, service time, queue depth, and observed tail latency, (3) identify the binding constraint from those measurements, such as overload, queue growth, or service-time inflation, (1) choose a mitigation that fits the current bottleneck and SLO trade-off, such as admission control, graceful degradation, or a batching change, (4) validate the chosen policy under representative load and confirm it improves SLO compliance. This sequence is necessary because overload defenses are not universally ordered by aggressiveness: shortening a batching window, shedding load, or degrading quality can help or hurt depending on what is actually binding. Acting before measuring risks choosing a mitigation that lowers capacity or burns quality without protecting latency.
Learning Objective: Design a measurement-driven workflow for selecting and validating overload mitigations in serving systems.
An inference node modeled as an \(M/M/1\) queue has an average execution service time of \(T_{\text{svc}} = 10\text{ ms}\). If the arrival rate increases such that system utilization \(\rho\) increases from \(50\%\) (\(\rho = 0.5\)) to \(90\%\) (\(\rho = 0.9\)), what happens to the mean total response time \(W\)?
- \(W\) increases linearly from 10 ms to 18 ms.
- \(W\) increases nonlinearly from 20 ms to 100 ms (\(5\times\) increase).
- \(W\) decreases from 20 ms to 11.1 ms due to batching efficiency.
- \(W\) remains fixed at 10 ms because service time is independent of arrival rate.
Answer: The correct answer is B. In an \(M/M/1\) model, mean total response time is \(W = \frac{T_{\text{svc}}}{1 - \rho}\). At \(\rho = 0.5\), this gives \(\frac{10\text{ ms}}{0.5} = 20\text{ ms}\); at \(\rho = 0.9\), it gives \(\frac{10\text{ ms}}{0.1} = 100\text{ ms}\). So utilization rises by \(1.8\times\), while mean response time rises by \(5\times\) because the dependence is reciprocal rather than linear.
Learning Objective: Calculate mean queue residency time and analyze non-linear latency growth as utilization approaches saturation.
True or False: Under a simple \(M/M/1\) queueing model approximation, when server utilization (\(\rho_{\text{serv}}\)) reaches 90%, the 99th percentile (p99) tail latency is approximately equal to 1.5 times the mean latency.
Answer: False. In an \(M/M/1\) queueing model, mean residence time scales as \(T_{\text{svc}} / (1 - \rho_{\text{serv}})\), and the 99th percentile tail latency is approximately \(4.6 \times\) the mean latency (since \(\ln(100) \approx 4.605\)). At 90% utilization (\(\rho_{\text{serv}} = 0.9\)), mean latency is \(10 \times T_{\text{svc}}\), making p99 latency roughly \(46 \times T_{\text{svc}}\), demonstrating the severe nonlinear divergence of tail latency from mean latency near saturation.
Learning Objective: Evaluate tail-latency divergence at high server utilization using queueing theory approximations.
Self-Check: Answer
Why can increasing batch size during deep learning inference improve hardware throughput on modern GPUs for weight-streaming workloads, and when does that improvement stop paying off on a Roofline model?
- Batching converts all floating-point operations into integer bitshifts, bypassing GPU ALUs entirely.
- Batching reduces the total parameter count of the neural network by sharing weights across batch samples.
- Batching eliminates PCIe bus data transfer overhead by generating synthetic input tensors on the device.
- Batching increases arithmetic intensity (FLOPs per byte of memory accessed) by reusing loaded weight matrices across multiple input samples, shifting the workload toward the compute ceiling until another limit or saturation is reached.
Answer: The correct answer is D. For weight-streaming inference workloads, small batches often spend much of their time moving weights from HBM to on-chip memory relative to the useful arithmetic done per request. Batching reuses those loaded weights across \(B\) inputs, raising arithmetic intensity and improving throughput until the workload approaches the roofline’s compute ceiling or another bottleneck binds. Turning FLOPs into bitshifts is unrelated, sharing a batch does not change parameter count, and batching does not remove PCIe transfers.
Learning Objective: Analyze how batch size changes arithmetic intensity and throughput for weight-streaming inference workloads under the Roofline model.
A video-analytics node receives frames from 6 synchronized cameras that capture simultaneously at 30 Hz. Because these camera frames arrive in synchronized periodic bursts, this represents a ____ arrival process in the traffic taxonomy.
Answer: streaming. Streaming traffic refers to correlated, synchronized arrivals such as multi-camera sensor frames. Those bursts can make co-batching natural when frames fit together in time, but any additional waiting still depends on worker availability and scheduling rather than disappearing automatically.
Learning Objective: Classify synchronized sensor traffic using the chapter’s serving arrival-pattern categories.
A cloud serving system with an end-to-end latency budget of 50 ms configures a dynamic batcher with
max_batch_size = 32andmax_batch_delay_ms = 20. Under low traffic, requests arrive deterministically 100 ms apart, the worker is idle when each request arrives, and no other requests arrive during any 20 ms batching window. What is the operational impact on latency and batch efficiency?- Every request waits the full 20 ms timeout in the queue and executes as a batch of size 1, incurring the maximum batch-formation delay penalty with zero throughput amortization gain.
- Requests are automatically dropped because the queue fails to reach the maximum batch size of 32 within 50 ms.
- The server achieves peak GPU utilization because small batches execute with sub-microsecond latency.
- The dynamic batcher disables timeouts and waits indefinitely until 32 requests accumulate, preserving throughput at the cost of infinite latency.
Answer: The correct answer is A. With deterministic 100 ms spacing and no additional arrivals during any 20 ms batching window, each oldest request simply waits for
max_batch_delay_msto expire and then runs alone as batch size 1. That burns 20 ms of the 50 ms budget on batch formation without gaining any batching amortization benefit. Timeouts dispatch the request rather than dropping it, a batch of 1 does not imply peak utilization, and the configured timeout prevents indefinite waiting.Learning Objective: Evaluate dynamic batching timeout trade-offs under low-traffic arrival patterns by separating batch-formation delay from batching efficiency.
Self-Check: Answer
An ML systems team is deploying a transformer-based ranking model on NVIDIA data center GPUs. They consider running the raw PyTorch model in eager Python mode versus compiling the model into an optimized NVIDIA TensorRT engine. Which graph-level serving optimization is TensorRT designed to apply more aggressively than an unoptimized eager execution path?
- TensorRT automatically converts the supervised classification task into an unsupervised reinforcement learning policy.
- TensorRT trains additional adapter layers during live request serving to adapt to data drift.
- TensorRT eliminates all GPU memory usage by running inferences exclusively in the CPU instruction cache.
- TensorRT performs aggressive vertical and horizontal operator fusion (e.g., combining Conv/MatMul, BiasAdd, and Activation into a single kernel), reduces redundant memory round-trips, and selects hardware-tuned kernels.
Answer: The correct answer is D. TensorRT is built for ahead-of-time serving optimization: it can fuse compatible graph regions, reduce intermediate writes to global memory, and choose tactics tuned to the target GPU architecture. Eager mode may still invoke optimized library kernels, but it does not apply the same whole-graph serving-oriented compilation and kernel-selection pipeline. TensorRT does not change the learning task, train new adapters during inference, or remove GPU memory usage by moving execution into CPU caches.
Learning Objective: Compare unoptimized eager serving with specialized inference engines in terms of graph-level fusion and hardware-specific kernel selection.
Why can quantizing a model’s weights and activations from FP16 to INT8 for GPU serving increase throughput, what limits the gain, and what role does Post-Training Quantization (PTQ) calibration play in preserving accuracy?
Answer: INT8 often improves throughput because it reduces the raw bytes moved for converted tensors and may also enable faster low-precision kernels on supported hardware, especially when memory traffic is a major bottleneck. The exact speedup is hardware- and workload-dependent, so it must be profiled rather than assumed. PTQ calibration uses representative activation data to choose scales and clipping ranges that keep quantization error manageable; if those ranges are poorly chosen, serving accuracy can fall even when latency improves.
Learning Objective: Analyze why INT8 quantization can improve serving throughput and explain how PTQ calibration preserves usable accuracy.
True or False: In deep neural network quantization, when sensitivity evaluation identifies particular layers as unusually vulnerable to precision loss, preserving those layers in FP16/FP32 while quantizing the remaining bulk layers to INT8/INT4 can preserve model accuracy in mixed-precision serving.
Answer: True. Some layers are more sensitive to quantization error than others, so keeping selected boundary or numerically delicate layers at higher precision can preserve accuracy while still capturing much of the benefit from quantizing the larger bulk of the network. The exact layers and gains must be validated on the target model, because conversion overheads and kernel support also matter.
Learning Objective: Evaluate when mixed-precision quantization can preserve serving accuracy by leaving sensitive layers at higher precision.
When deploying models to edge devices with Apple Silicon (such as iPhones and iPads), developers export models to the ____ framework to take full advantage of the dedicated Apple Neural Engine (ANE) hardware accelerator.
Answer: CoreML. Apple’s CoreML runtime compiles neural network computational graphs into specialized binaries optimized for the Apple Neural Engine (ANE), GPU, and CPU, providing low-latency, energy-efficient on-device inference on Apple hardware.
Learning Objective: Classify platform-specific edge inference engines (CoreML, OpenVINO, TFLite) for specialized hardware accelerators.
When calibrating an INT8 quantized model using Post-Training Quantization (PTQ), what is the primary danger of using a synthetic or unrepresentative calibration dataset (e.g., ImageNet validation images for a medical endoscopy model)?
- The activation dynamic ranges and outlier distributions in production may be misrepresented by the calibration dataset, causing clipping of real-world features or overly coarse quantization scales that degrade serving accuracy.
- The model compiler will fail to generate valid GPU assembly code and reject the weights.
- The server’s physical power consumption will double due to misaligned integer registers.
- The dynamic batcher will permanently lock its batch size to 1.
Answer: The correct answer is A. PTQ calibration sets ranges or related quantization parameters from observed activations on the calibration set. If that data does not resemble real production inputs, live activations may fall outside the calibrated ranges or be represented too coarsely, causing silent accuracy loss. The risk is degraded quality, not a forced compiler failure, doubled power draw from integer registers, or any direct change to dynamic batching behavior.
Learning Objective: Evaluate how unrepresentative calibration data can harm post-training quantized serving quality.
Self-Check: Answer
In a CPU-based model serving deployment, how do vector and matrix extensions such as AVX-512 vector registers and Advanced Matrix Extensions (AMX) tiles accelerate inference throughput compared to standard scalar x86 execution?
Answer: Scalar execution handles only a small number of values per instruction, while vector and matrix extensions let the CPU apply one instruction across many elements or tiles at once. In practice, optimized runtimes combine these instructions with cache-aware tiling so matrix multiplies and convolutions move through the CPU more like dense blocks than isolated scalar operations. The practical consequence is much higher arithmetic throughput per socket for supported data types, especially when the data layout and kernel implementation are tuned to feed those units efficiently.
Learning Objective: Explain how CPU vector and matrix extensions improve neural network inference throughput relative to scalar execution.
To reduce OS scheduler thread migration and cross-socket memory traffic on multi-socket CPU serving nodes, engineers pin worker threads to dedicated physical cores and place each worker’s weights in the memory attached to the same socket, making the server ____-aware.
Answer: NUMA. Memory controllers are distributed across sockets, so a thread that reads weights attached to a remote socket pays higher latency and lower bandwidth than one reading local memory. Pinning workers to cores and allocating their weights on the same socket keeps accesses local and reduces latency jitter, although it does not by itself eliminate all variability in a serving node.
Learning Objective: Apply CPU core pinning and NUMA node affinity techniques to reduce latency jitter in high-performance serving environments.
**Order the iterative steps of an end-to-end performance profiling workflow for diagnosing an inference serving bottleneck:
- Inspect timeline traces (e.g., via Nsight Systems or PyTorch Profiler) to identify gaps, CUDA stream stalls, CPU-GPU synchronization, and memory bandwidth utilization
- Implement targeted optimization (e.g., kernel fusion, precision reduction, or CPU pipelining) on the identified bottleneck stage
- Establish a reproducible baseline by driving realistic synthetic load with an open-loop load generator and measuring latency percentiles (p50, p99)
- Re-benchmark under identical load to verify latency reduction and ensure model prediction accuracy remains intact
- Identify the binding bottleneck category (Compute-bound, Memory-bandwidth-bound, or Host/Pipeline-bound)**
Answer: The correct order is: 1. (3) Establish a reproducible baseline by driving realistic synthetic load with an open-loop load generator and measuring latency percentiles (p50, p99) 2. (1) Inspect timeline traces (e.g., via Nsight Systems or PyTorch Profiler) to identify gaps, CUDA stream stalls, CPU-GPU synchronization, and memory bandwidth utilization 3. (5) Identify the binding bottleneck category (Compute-bound, Memory-bandwidth-bound, or Host/Pipeline-bound) 4. (2) Implement targeted optimization (e.g., kernel fusion, precision reduction, or CPU pipelining) on the identified bottleneck stage 5. (4) Re-benchmark under identical load to verify latency reduction and ensure model prediction accuracy remains intact
Explanation: The profiling loop begins by measuring baseline performance under realistic load, capturing timeline traces to observe execution gaps and synchronization stalls, categorizing the binding constraint, applying the specific targeted optimization, and re-benchmarking to validate that latency improved without compromising accuracy.
Learning Objective: Apply structured profiling methodologies and tracing tools to diagnose and resolve inference bottlenecks.
True or False: In Ahead-of-Time (AOT) graph compilation, operator fusion is restricted to combining adjacent layers of the exact same mathematical type (e.g., fusing two consecutive Conv2D operations).
Answer: False. Operator fusion most commonly combines heterogeneous adjacent operations along the vertical computation graph—such as fusing a 2D Convolution, a Bias Addition, a Batch Normalization scale, and a non-linear Activation function (e.g., ReLU or GELU)—into a single unified GPU kernel. This avoids intermediate memory round-trips to global VRAM, drastically saving memory bandwidth.
Learning Objective: Evaluate operator fusion capabilities across heterogeneous computational layers in inference graph compilers.
When profiling a GPU inference server under high load, an engineer sees
nvidia-smireport 95%utilization.gpu, but a detailed profile over the same period shows low achieved FLOP rate and many kernels stalled on memory or synchronization. What best explains the discrepancy?nvidia-smimeasures fan speed and ambient temperature rather than compute kernel activity.- The GPU memory clock is automatically halved during Nsight Systems tracing.
- The CPU is running at 100% duty cycle, which forces
nvidia-smito report false GPU metrics. nvidia-smireports the fraction of sampled time with one or more kernels active on the GPU, not how efficiently those kernels used the compute units.
Answer: The correct answer is D.
nvidia-smi‘s GPU-utilization number is a coarse activity metric: it tells you the GPU was busy running kernels during most sample intervals, but not whether those kernels achieved high math throughput. A kernel can be active while stalled on memory, running at low occupancy, or waiting on synchronization. That is why detailed traces and hardware counters are needed to distinguish ’GPU active’ from ‘GPU doing useful compute efficiently.’ Fan speed, profiler-induced clock halving, and CPU duty cycle are not the explanation here.Learning Objective: Evaluate why coarse GPU activity metrics can disagree with detailed profiler evidence about real compute efficiency.
Self-Check: Answer
A computer vision team trains a ResNet-50 model in PyTorch using torchvision’s PIL-based bilinear image resizing. In production, high-throughput C++ inference servers use OpenCV’s
cv::resizewith default bilinear interpolation. On matched input images, the team observes different preprocessed tensors; when they rerun evaluation with the training preprocessing path, the original accuracy returns. What phenomenon is causing this degradation, and what is the proper engineering solution?- Training-serving skew caused by subtle implementation differences in resize anti-aliasing and pixel coordinate rounding between PIL and OpenCV; the solution is using shared or parity-verified preprocessing across training and serving, such as a common library or exportable graph when supported.
- Accelerator thermal throttling caused by high frame rates; the solution is downclocking the GPU Tensor Cores.
- Floating-point precision drift between Python and C++; the solution is switching all production inference to 64-bit double precision.
- Catastrophic forgetting in the weights caused by static batching; the solution is retraining the model with dynamic dropout.
Answer: The correct answer is A. The matched-input rerun shows the weights are not the root cause by themselves; the problem is that training and serving are producing different tensors from the same image. That is training-serving skew caused by inconsistent preprocessing. The fix is to make preprocessing shared or parity-verified across environments, whether through a common implementation or an exported graph when the required operations are supported. Numerical differences can matter in some pipelines, but the evidence here points specifically to preprocessing mismatch rather than thermal behavior or weight changes.
Learning Objective: Analyze the root causes of training-serving skew and design unified preprocessing pipelines to maintain inference accuracy.
Why does simply copying model weights into GPU HBM upon container startup fail to prevent latency spikes on the very first incoming user requests, and how does executing a ‘warmup pass’ resolve this issue?
Answer: Having weights resident in GPU memory is not enough because first requests may still trigger lazy allocator growth, kernel compilation or selection, graph capture, and other runtime setup on the execution path. A warmup pass sends representative dummy inputs through the model before the server is marked ready, so those deferred costs are paid during initialization instead of by live users. The practical effect is reduced first-request latency spikes, though only for the shapes and paths the warmup actually exercises.
Learning Objective: Explain the systems mechanisms behind cold-start latency spikes and justify the use of synthetic warmup passes.
**Sequence the stages of an illustrative serial cold-start initialization workflow when autoscaling an inference server pod from an idle state to serving live production traffic:
- Initialize device context or runtime state needed before host-to-device copies, then transfer model weights from host staging memory to GPU High-Bandwidth Memory (HBM) over PCIe
- Fetch model checkpoint artifacts and configuration from remote object storage (e.g., S3) to local NVMe SSD cache
- Initialize remaining execution-engine state, allocate memory pools, and run synthetic dummy warmup passes
- Container initialization, environment bootstrap, and runtime dependency loading
- Register pod as healthy with load balancer gateway to begin receiving live traffic
- Memory-map (
mmap) or deserialize model weights from local SSD into host memory, with explicit pinned staging buffers if the transfer path uses them**
Answer: The correct order is: (4) Container initialization, environment bootstrap, and runtime dependency loading, (2) Fetch model checkpoint artifacts and configuration from remote object storage to local NVMe SSD cache, (6) Memory-map or deserialize model weights from local SSD into host memory, with explicit pinned staging buffers if used, (1) Initialize device context or runtime state needed before host-to-device copies, then transfer model weights to GPU HBM over PCIe, (3) Initialize remaining execution-engine state, allocate memory pools, and run synthetic dummy warmup passes, (5) Register pod as healthy with the load balancer gateway. This is an illustrative serial workflow because later stages depend on earlier artifacts and memory state: the model must exist locally before it can be mapped, host-visible weights must exist before transfer, and warmup must happen before the pod is declared ready. Other implementations may overlap parts of the pipeline, but admitting traffic before warmup would push initialization cost onto live requests.
Learning Objective: Design the end-to-end cold-start and initialization lifecycle for autoscaling inference infrastructure.
True or False: In multi-model serving on a shared GPU, Volta-era NVIDIA Multi-Process Service (MPS) provides hard physical hardware partitioning of high-bandwidth memory (HBM) channels and compute cores, completely preventing memory out-of-memory (OOM) faults caused by co-located tenant models.
Answer: False. Volta-era MPS gives clients separate GPU address spaces and contexts, but they still share the same underlying compute and memory hardware. That is not MIG-style physical partitioning, and a fatal GPU fault can still affect other clients on the affected GPU even though one tenant’s OOM does not guarantee every colocated client will crash.
Learning Objective: Compare GPU multi-tenant isolation mechanisms (MPS vs. MIG) regarding memory safety and compute partitioning.
A multi-model serving platform hosts 50 distinct fine-tuned vision models on a single GPU node with 24 GB of VRAM. Each model requires 2 GB of memory, exceeding total VRAM capacity. Traffic to individual models is sporadic. What loading and memory management architecture enables serving all 50 models while minimizing request latency?
- Redeploy the cluster on 50 dedicated GPU nodes running continuous batching 24/7.
- Quantize all models to 1-bit weights to fit all 50 models into GPU L2 cache simultaneously.
- Maintain a tiered memory cache (storing active models in GPU VRAM and inactive models in host pinned DRAM), using asynchronous PCIe DMA transfers to swap weights into VRAM on demand with an LRU eviction policy.
- Compress all models into a single shared zip archive on remote S3 and download the entire archive over HTTP on each incoming request.
Answer: The correct answer is C. When model demand is sparse and total VRAM is too small, a tiered design keeps active models resident on the GPU while staging less active ones in host memory for faster reload than remote storage. On-demand swaps still pay transfer time bounded below by bytes moved over available bandwidth, plus runtime overheads, so this design reduces but does not eliminate latency. The approach also assumes host cache capacity and enough GPU workspace for the active model. Provisioning 50 dedicated GPUs wastes capacity for sporadic traffic, and re-downloading from object storage per request would be far slower.
Learning Objective: Design a tiered memory caching and dynamic model swapping architecture for multi-model serving under GPU memory constraints.
Why can loading model weights from modern
safetensorsformat provide faster startup times than some legacy PyTorch checkpoint paths?safetensorsfiles compress weights using gzip, reducing disk storage by \(10\times\).safetensorsfiles store raw tensor buffers in a simple deterministic layout that supports memory mapping (mmap) without Python object deserialization or arbitrary code execution.safetensorsfiles compile PyTorch code directly into binary x86 machine instructions on disk.safetensorsfiles automatically quantize FP32 weights into 4-bit integers during read operations.
Answer: The correct answer is B.
safetensorsstores tensor data in a simple tensor-oriented format, so loaders can avoid the heavy Python object reconstruction associated with general pickle-based checkpoints and can use memory mapping efficiently. That can reduce cold-start overhead, though the exact gain still depends on storage speed, paging behavior, and the rest of runtime initialization. Gzip compression, compiling Python into machine code, and automatic on-read quantization are not what explains the startup benefit here.Learning Objective: Compare tensor-oriented checkpoint formats with pickle-based checkpoints in terms of loading overhead, memory mapping, and security.
Self-Check: Answer
In Large Language Model (LLM) serving, how do the computational and hardware characteristics of the Prefill phase fundamentally differ from the Decode phase?
- Prefill processes tokens autoregressively one by one and is memory-bandwidth bound, whereas Decode processes all output tokens simultaneously and is compute-bound.
- Prefill processes all prompt tokens concurrently in parallel matrix multiplications and is often more compute-intensive, whereas Decode generates one token per step autoregressively and at low batch sizes is often memory-bandwidth bound due to repeated weight and KV-state movement.
- Prefill operates exclusively on host CPU DRAM, whereas Decode runs on GPU Tensor Cores.
- Prefill latency scales quadratically with batch size, whereas Decode latency is strictly independent of sequence length and KV-cache size.
Answer: The correct answer is B. Prefill handles the whole prompt together, so it uses larger parallel matrix operations and typically has higher arithmetic intensity than decode. Decode then generates output step by step, and at low batch sizes often becomes limited by repeatedly moving model weights and KV state through memory rather than by raw compute. The autoregressive behavior belongs to decode, not prefill. Both phases usually run on the accelerator, and TTFT includes more than just the prefill kernel time in a full serving path.
Learning Objective: Compare the typical computational bottlenecks and hardware behavior of LLM prefill versus decode in serving.
**Order the step-by-step execution cycle of Speculative Decoding for accelerating LLM inference:
- Target model runs a single parallel forward pass over the draft candidate tokens to compute verification logits
- Draft model (a lightweight autoregressive model) generates \(K\) candidate tokens sequentially
- Engine appends the accepted tokens to the KV cache and advances the generation context
- Verification logic compares the draft tokens with the target model’s verification results and accepts a prefix of them**
Answer: The correct order is: (2) Draft model (a lightweight autoregressive model) generates \(K\) candidate tokens sequentially, (1) Target model runs a single parallel forward pass over the draft candidate tokens to compute verification logits, (4) Verification logic compares the draft tokens with the target model’s verification results and accepts a prefix of them, (3) Engine appends the accepted tokens to the KV cache and advances the generation context. The sequence matters because the target model cannot verify tokens before the draft proposes them, and the engine should not advance the live context until verification decides which proposed tokens are accepted. Swapping verification and context advancement would commit unverified state and break correctness.
Learning Objective: Sequence the high-level workflow of speculative decoding from draft generation through verification and context update.
True or False: Speculative decoding speeds up serving regardless of draft-model quality, because the target model always verifies multiple tokens in parallel.
Answer: False. Speculative decoding helps only when the draft model is cheap enough and its proposed tokens are accepted often enough to offset the extra draft-and-verify work. If acceptance is low, the system can spend more time running two models than it saves through parallel verification.
Learning Objective: Evaluate how draft-model cost and acceptance rate determine whether speculative decoding improves LLM serving performance.
In a multi-turn conversational AI system with extensive system prompts (e.g., 2,000 tokens of instructions and few-shot examples shared across thousands of user sessions), what serving optimization eliminates redundant prefill compute across requests?
- Linear Attention Approximation, which drops system prompt tokens entirely from the attention window.
- Static Graph Compilation, which hardcodes user inputs directly into the weight tensors.
- Prefix Caching (e.g., RadixAttention), which stores the KV-cache states of common prompt prefixes in memory and reuses them across queries matching the prefix.
- Speculative Quantization, which quantizes prompt tokens into 1-bit binary representations during the decode phase.
Answer: The correct answer is C. Prefix caching stores KV states for a compatible shared prefix so later requests with that same prefix can reuse the prefill result instead of recomputing it. This can cut TTFT substantially for the cached portion, though any uncached suffix still has to be processed normally. Dropping prompt tokens changes model behavior, static graph compilation does not reuse dynamic KV state, and 1-bit prompt quantization is not the mechanism described here.
Learning Objective: Apply prefix caching to reduce repeated prefill work for shared prompt prefixes in conversational serving.
Contrast traditional request-level dynamic batching with iteration-level continuous batching (as introduced in Orca and vLLM) for Large Language Model (LLM) serving. Why is request-level batching severely inefficient for autoregressive generation?
Answer: In request-level batching, batch membership stays fixed while requests decode, so short generations that finish early cannot immediately free their slots for unrelated waiting work. In continuous batching, the scheduler can admit or remove sequences at iteration boundaries, which uses capacity more efficiently when output lengths vary. For example, if one reply ends after 20 tokens while another runs for 500, a fixed request-level batch leaves part of the batch underused until the long sequence advances far enough. The practical consequence is lower throughput and longer waits for queued requests unless the runtime can reschedule state across iterations.
Learning Objective: Compare request-level dynamic batching with iteration-level continuous batching for autoregressive LLM serving and explain why variable output lengths make fixed batch membership inefficient.
True or False: PagedAttention resolves the primary memory waste in LLM KV-caching by allocating key and value states in non-contiguous, fixed-size physical memory blocks managed via a virtual page table, eliminating both internal fragmentation from over-allocation and external memory fragmentation.
Answer: False. PagedAttention removes the need for one large contiguous KV-cache allocation and greatly reduces external fragmentation, but it does not eliminate internal waste entirely: each sequence can still leave one partially filled final block. Its benefit is reducing fragmentation enough to raise usable concurrency, not making memory waste literally zero.
Learning Objective: Explain how PagedAttention reduces KV-cache fragmentation and identify the remaining source of memory waste.
Self-Check: Answer
A team evaluates deploying a small classification model with an average arrival rate of 5 QPS and a 200 ms latency SLA. Measurements at 5 QPS show that both a single CPU server instance and a single GPU server instance meet the matched quality target and the p99 latency target of 200 ms. The CPU instance costs $0.20/hour and sustains up to 20 QPS under the target latency; the GPU instance costs $2.00/hour and sustains up to 200 QPS under the target latency. Which deployment option is more cost-effective for this specific workload, and why?
- The GPU server is more cost-effective because its 10x greater SLO-qualified peak throughput more than offsets its 10x higher hourly cost, making it the lower-cost choice even at 5 QPS.
- The GPU server is more cost-effective because GPUs always have lower total cost of ownership regardless of arrival traffic.
- The CPU server is more cost-effective because at 5 QPS, it already meets the SLA with adequate headroom at $0.20/hour, whereas the GPU server would use only 2.5% of its SLO-qualified capacity and cost about \(10\times\) more per served query at that traffic level.
- Neither option is viable because 5 QPS requires at least a 10-node cluster for high availability.
Answer: The correct answer is C. The measured requirement is simply 5 QPS at under 200 ms, and the CPU instance already satisfies that at 25% of its proven SLO-qualified capacity. At this traffic level, cost per served query is about $0.20 divided by \(5 \times 3600\), which is approximately $0.0000111 for the CPU, versus $2.00 divided by \(5 \times 3600\), which is approximately $0.000111 for the GPU, so the GPU is about \(10\times\) more expensive here. Comparing only peak throughput misses the idle-capacity waste of the GPU at such low load.
Learning Objective: Evaluate CPU-versus-GPU serving cost effectiveness using SLO-qualified capacity, utilization, and cost per served query.
In capacity planning for a mission-critical model serving cluster with a peak expected traffic of \(\lambda_{\text{peak}} = 1\text{,}000\text{ QPS}\) and an individual replica capacity of \(R = 100\text{ QPS}\) at its target latency SLO, why would a capacity engineer provision 16 to 20 replicas (\(1.6\times\text{--}2.0\times\) headroom multiplier) rather than exactly 10 replicas?
Answer: Ten replicas cover only the forecast peak under the measured per-replica SLO-qualified capacity, leaving essentially no reserve for failures, burstiness, uneven load distribution, or slow scale-out. Provisioning 16 to 20 replicas is an illustrative way to preserve headroom so the system can keep meeting its latency target when real conditions deviate from the forecast. For example, if one zone loses capacity or traffic spikes above the expected peak, the extra replicas absorb the shock instead of pushing every remaining node immediately to its limit. The practical consequence is that capacity planning is a resilience decision, not just a division problem.
Learning Objective: Justify why mission-critical serving clusters provision reserve capacity beyond forecast peak demand.
True or False: For an 8-billion-parameter LLM with 32 layers, 8 KV heads, and head dimension 128, deployed in FP16 precision with a 16 GB weight footprint on an 80 GB GPU, serving long-context requests with batch size \(B = 8\) and context length \(S = 32\text{,}768\) tokens causes the KV cache to exceed the static weight footprint of the model itself.
Answer: True. For this specific architecture, each token per sequence needs \(2 \times 32 \times 8 \times 128 \times 2 = 131{,}072\) bytes, which is \(128\ \text{KiB}\), to store both Keys and Values in FP16. At \(B = 8\) and \(S = 32{,}768\), the KV-cache payload is \(131{,}072 \times 32{,}768 \times 8 = 34{,}359{,}738{,}368\) bytes, which is \(32\ \text{GiB}\) or about \(34.36\ \text{GB}\) in decimal units. That exceeds the 16 GB weight footprint, showing how long contexts can make dynamic KV memory dominate static weights.
Learning Objective: Compare dynamic KV-cache growth against static model weights for a specified LLM architecture, batch size, and context length.
An engineer serves an 8-billion parameter LLM on a GPU with 2 TB/s of High-Bandwidth Memory (HBM) bandwidth. Assume the model weights are 16 GB in FP16, the decode step effectively streams those 16 GB of weights from HBM each token at batch size \(B = 1\), and ignore KV-cache traffic and compute time. What is the theoretical hardware-bandwidth lower bound on Time Per Output Token (TPOT)?
- \(8.0\text{ ms}\) (\(\text{TPOT} = 16\text{ GB} / 2\text{,}000\text{ GB/s}\))
- \(0.8\text{ ms}\) (\(\text{TPOT} = 1.6\text{ GB} / 2\text{,}000\text{ GB/s}\))
- \(80.0\text{ ms}\) (\(\text{TPOT} = 160\text{ GB} / 2\text{,}000\text{ GB/s}\))
- \(0.08\text{ ms}\) (\(\text{TPOT} = 16\text{ MB} / 2\text{,}000\text{ GB/s}\))
Answer: The correct answer is A. Under the stated assumption that one decode step streams 16 GB of weights from HBM and the device provides an idealized 2 TB/s = 2,000 GB/s of bandwidth, the transfer-time floor is \(16\text{ GB} / 2{,}000\text{ GB/s} = 0.008\text{ s} = 8.0\text{ ms}\). That makes 8 ms a lower bound from weight movement alone in this simplified case. The smaller and larger numbers come from unit or arithmetic mistakes, and the setup intentionally ignores KV-cache traffic, compute, and other overheads.
Learning Objective: Calculate a bandwidth-only lower bound on LLM decode TPOT from model size and HBM bandwidth.
When LLM decode at small batch sizes is dominated by moving model weights rather than by arithmetic throughput, why can INT4 weight-only quantization (e.g., AWQ or GPTQ) reduce Time Per Output Token (TPOT), and what limits the gain even if INT4 compute kernels provide no higher FLOP/s than FP16 Tensor Cores?
Answer: At small batch sizes, decode is often dominated by moving model weights rather than by raw arithmetic throughput. Weight-only INT4 quantization cuts the raw weight payload by about \(4\times\) relative to FP16, so the memory system has fewer bytes to fetch each decode step even if the math units themselves are not any faster. For an 8B model, that can mean reading something closer to 4 GB of quantized weights instead of 16 GB of FP16 weights per step, excluding metadata and dequantization overhead. The practical consequence is lower TPOT when weight traffic is the bottleneck, although the realized gain is usually less than \(4\times\) once KV traffic, dequantization, launch overhead, and kernel details are included.
Learning Objective: Explain why weight-only quantization can speed up memory-bound LLM decode even without increasing raw compute throughput.
Calculate the total memory footprint (in bytes) required to store the KV cache for a batch of \(B = 16\) requests, each with an active context length of \(S = 2\text{,}048\) tokens, for a model with \(L = 32\) transformer layers, \(H_{\text{kv}} = 8\) key-value attention heads (Grouped-Query Attention), head dimension \(D_{\text{head}} = 128\), stored in FP16 precision (\(P = 2\text{ bytes}\)).
Answer: The KV-cache payload is \(\text{Memory} = 2 \times L \times H_{\text{kv}} \times D_{\text{head}} \times P \times S \times B\) bytes, where the factor of 2 accounts for both Keys and Values. Substituting gives \(2 \times 32 \times 8 \times 128 \times 2 \times 2048 \times 16 = 4{,}294{,}967{,}296\) bytes. That is exactly \(4\ \text{GiB}\), or about \(4.295\ \text{GB}\) in decimal units. This is the KV-cache payload only; allocator overhead and runtime workspace would add more memory in a real serving system.
Learning Objective: Calculate KV-cache payload requirements for transformer serving from batch size, context length, and model architecture.
Self-Check: Answer
A team attempts to maximize hardware cost efficiency by targeting 95% steady-state utilization \(\rho\) across their production serving queue. Why is this strategy a dangerous engineering pitfall?
- High utilization permanently erases model weights from GPU memory registers.
- In stochastic serving systems, queue waiting times grow asymptotically toward infinity as utilization approaches 100%, causing minor traffic fluctuations to trigger massive tail-latency spikes and widespread SLO breaches.
- Running above 90% utilization forces the operating system to switch from 64-bit to 32-bit execution mode.
- Modern GPUs automatically shut down power when utilization exceeds 80% for more than 10 seconds.
Answer: The correct answer is B. Here \(\rho\) means arrival rate divided by service capacity in the serving queue, not a coarse GPU busy counter. In queueing models, waiting time grows sharply as \(\rho\) approaches 1, so a system run near 95% has very little headroom for burstiness or service-time variation. That makes p99 latency fragile even if average load looks efficient. The other answers invent hardware or OS behaviors unrelated to the chapter’s queueing argument.
Learning Objective: Evaluate why operating a serving queue near saturation creates tail-latency risk even when average utilization looks cost-efficient.
True or False: Evaluating an online serving system using mean (average) latency is sufficient for capacity planning, because if the average latency is well below the SLA target, user-facing requests are guaranteed to experience good performance.
Answer: False. Average latency conceals extreme tail outliers (p95, p99, p99.9) where requests experience severe queueing delays. In modern microservice architectures where a user query fans out to dozens of downstream models in parallel, the slowest component determines overall user latency, meaning a low average latency can co-exist with a large fraction of users experiencing SLA violations.
Learning Objective: Justify why tail-latency metrics (p99/p99.9) must be used over mean latency for evaluating online serving systems.
Why is the assumption that ‘cold-start latency only affects the very first request’ a critical fallacy in autoscaling serverless or Kubernetes-based serving environments with bursty traffic?
Answer: During a burst, new replicas may spend time loading weights, initializing runtimes, or warming caches before they can accept traffic, so cold start reduces usable capacity exactly when demand is rising. Requests usually are not sent to replicas that are still unready, but they still suffer indirectly by waiting longer on the already-live replicas or in upstream queues. For example, if traffic doubles before new GPU pods finish becoming ready, p99 latency can spike across many users even though no request is intentionally routed to an uninitialized instance. The practical consequence is that cold start is a fleet-level capacity problem, not just a first-request problem.
Learning Objective: Analyze how cold-start delays amplify tail latency during autoscaling events by withholding new capacity during bursts.
An engineering team increases the dynamic batch size on their vision model serving nodes from 8 to 64. Offline peak throughput doubles, and production traces show batch-formation wait time grew sharply after the change. User-facing p99 latency violations then increase by 40%. What fallacy explains this outcome?
- Model weights become corrupted when executed with batch sizes greater than 16.
- GPU Tensor Cores disable INT8 acceleration when batch size exceeds 32.
- High batch sizes reduce arithmetic intensity on the GPU Roofline model.
- The fallacy that larger serving batches always improve throughput without affecting latency; early-arriving requests can spend too much of the latency budget waiting in the batcher before execution.
Answer: The correct answer is D. The added trace detail matters: if batch-formation wait rose sharply, the doubled offline throughput did not come for free in the online path. Larger batches can improve hardware efficiency, but they also make early arrivals wait longer before execution, and that extra waiting can dominate p99 latency even when the per-batch compute is efficient. The corruption, universal Tensor Core cutoff, and reduced-arithmetic-intensity explanations do not match the serving mechanism described here.
Learning Objective: Evaluate how batch-formation delay can turn an offline throughput win into an online p99 latency regression.
Describe the pitfall of ‘Calibrating quantization ranges with unrepresentative data,’ and explain how it can lead to silent production failure despite passing offline validation checks.
Answer: PTQ calibration chooses quantization ranges from the activation statistics seen in the calibration set. If that data is cleaner or from a different domain than production traffic, the resulting scales may clip important live activations or represent them too coarsely, degrading prediction quality without causing crashes or latency alarms. The failure can stay hidden if offline validation used similarly unrepresentative data, because both calibration and evaluation would miss the same production patterns. The practical consequence is that quantized models need calibration and quality checks on data that matches the real serving distribution as closely as possible.
Learning Objective: Explain how unrepresentative calibration and evaluation data can hide quantization-induced production accuracy failures.