$$ \newcommand{\AbsoluteConicImageEntry}{B} \newcommand{\AbsoluteConicImageMatrix}{\mathbf{B}} \newcommand{\AbsoluteConicVector}{\mathbf{b}} \newcommand{\AcceleratedEpisodeTime}{T'} \newcommand{\AcceleratedFractionSpeedup}{G} \newcommand{\AccelerationNoiseDensityMatrix}{\mathbf{Q}_c} \newcommand{\AccelerationNoiseSpectralDensity}{q_c} \newcommand{\AccelerationWhiteNoise}{w} \newcommand{\AcceleratorBatchTime}{T_{\text{GPU}}} \newcommand{\AcceleratorConsumptionRate}{R_{\text{accel}}} \newcommand{\AcceleratorCount}{N_{\text{GPU}}} \newcommand{\AcceleratorDataConsumptionRate}{R_{\text{consumption}}} \newcommand{\AcceleratorGain}{G_{\text{accel}}} \newcommand{\AcceleratorHourlyPrice}{R_{\text{GPU/hr}}} \newcommand{\AcceleratorMemoryBandwidth}{\text{BW}_{\text{accelerator}}} \newcommand{\AcceleratorRailVoltage}{V_{\text{rail}}} \newcommand{\AcceleratorSecondsPerQuery}{S_{\text{GPU/query}}} \newcommand{\AcceleratorSupplyCurrent}{i} \newcommand{\AcceleratorTargetQueryRate}{R_{\text{GPU,target}}} \newcommand{\AcceleratorsPerNode}{G_{\text{node}}} \newcommand{\AccelerometerBias}{b_a} \newcommand{\AcceptanceFraction}{\alpha} \newcommand{\AcceptanceIntervalLowerLimit}{L} \newcommand{\AcceptanceIntervalUpperLimit}{U} \newcommand{\AcceptanceProbability}{p_{\text{acc}}} \newcommand{\AcceptedInfluences}{\text{Inf}} \newcommand{\AcceptedInputSet}{\mathcal{A}_{\tau}} \newcommand{\AcceptedLabelCount}{d} \newcommand{\AcceptedOutcomePayoff}{V} \newcommand{\AcceptedSampleCount}{X} \newcommand{\AcceptedTaskMeanCost}{C_{\text{succ}}} \newcommand{\AcceptedTasks}{N_{\text{acc}}} \newcommand{\AcceptingStateSet}{F} \newcommand{\AccessAttemptTime}{t} \newcommand{\AccountQueryDistribution}{p_{\text{user}}} \newcommand{\AccumulatedProcessNoiseCovariance}{\mathbf{Q}_d} \newcommand{\AccumulatedSyncTime}{T_{\text{sync}}} \newcommand{\AccumulatedUpdateTime}{T_{\text{effective}}} \newcommand{\AccumulationStepCount}{k} \newcommand{\AccuracyAfterDeployment}{\text{Accuracy}} \newcommand{\AccuracyDecayRate}{\gamma} \newcommand{\AccuracyPayoffPerQuery}{V} \newcommand{\AchievedBrakingDeceleration}{a} \newcommand{\AchievedKernelBandwidth}{\text{BW}_{\text{effective}}} \newcommand{\AcquisitionEpoch}{t_{\text{acq}}} \newcommand{\ActVariationalObjective}{\mathcal{L}_{\text{ACT}}} \newcommand{\ActionBinCount}{B} \newcommand{\ActionChunk}{\mathbf{A}} \newcommand{\ActionChunkHorizon}{H} \newcommand{\ActionChunkIndex}{k} \newcommand{\ActionDimension}{d_a} \newcommand{\ActionExecutionRate}{f_{\text{exec}}} \newcommand{\ActionFilterCutoffFrequency}{f_{\text{cutoff}}} \newcommand{\ActionLowerBound}{\mathbf{a}_{\min}} \newcommand{\ActionMagnitudeBound}{a_{\max}} \newcommand{\ActionRangeMaximum}{a_{\max}} \newcommand{\ActionRangeMinimum}{a_{\min}} \newcommand{\ActionRecoverableFraction}{\rho_{a}} \newcommand{\ActionResidualVector}{\mathbf{r}} \newcommand{\ActionSpace}{\mathcal{A}} \newcommand{\ActionTokenPrefix}{a_{<j}} \newcommand{\ActionUpperBound}{\mathbf{a}_{\max}} \newcommand{\ActivationCheckpointCount}{n_{\text{ckpt}}} \newcommand{\ActivationFunction}{f} \newcommand{\ActivationInput}{x} \newcommand{\ActivationLipschitzBound}{L_{\phi}} \newcommand{\ActivationMatrix}{\mathbf{A}} \newcommand{\ActivationMemory}{M_{\text{activations}}} \newcommand{\ActivationPayloadSize}{M_{\text{act}}} \newcommand{\ActivationStagingTime}{t_{\text{activate}}} \newcommand{\ActivationVector}{\mathbf{a}} \newcommand{\ActiveContactIndex}{k} \newcommand{\ActiveControlTorque}{\mathbf{u}_{\text{active}}} \newcommand{\ActiveInferencePower}{P_{\text{active}}} \newcommand{\ActiveLeaseCount}{N_{\text{active}}} \newcommand{\ActiveMotionDuration}{T_{\text{motion}}} \newcommand{\ActiveParameterCount}{P_{\text{model}}} \newcommand{\ActivePrefillRequestSet}{\mathcal{P}_{\text{active}}} \newcommand{\ActiveSchemaSet}{\mathcal{S}} \newcommand{\ActiveTargetTokenCount}{N_{\text{active}}} \newcommand{\ActorAccelerationBound}{a_{k,\max}} \newcommand{\ActorBodyRadius}{r} \newcommand{\ActorUpdateDelayCount}{d} \newcommand{\ActuatedJointAccelerations}{\ddot{\mathbf{q}}_j} \newcommand{\ActuatedJointBiasForces}{\mathbf{h}_j} \newcommand{\ActuatedJointCoordinates}{\mathbf{q}_j} \newcommand{\ActuationSelectionBaseBlock}{\mathbf{S}_b} \newcommand{\ActuationSelectionMatrix}{\mathbf{S}} \newcommand{\ActuatorAxisCount}{N_{\text{axes}}} \newcommand{\ActuatorBiasEffort}{u_{\text{bias}}} \newcommand{\ActuatorCyclePeriod}{t_{\text{cycle}}} \newcommand{\ActuatorDutyCycle}{D_{\text{cycle}}} \newcommand{\ActuatorEffort}{u} \newcommand{\ActuatorOffTime}{t_{\text{off}}} \newcommand{\ActuatorOnTime}{t_{\text{on}}} \newcommand{\ActuatorResponseTime}{T_{\text{act}}} \newcommand{\ActuatorTorqueLowerBound}{\mathbf{u}_{\min}} \newcommand{\ActuatorTorqueUpperBound}{\mathbf{u}_{\max}} \newcommand{\AdamFirstMoment}{m} \newcommand{\AdamMomentDecayRate}{\beta} \newcommand{\AdamSecondMoment}{v} \newcommand{\AdaptationEnergyAllowance}{E_{\text{slack}}} \newcommand{\AdaptationInvestmentCost}{C_{\text{invest}}} \newcommand{\AdaptationLatencyIncrease}{\Delta L_{\text{lat,fg}}^{\text{wc}}} \newcommand{\AdaptationModule}{g_{\psi}} \newcommand{\AdaptationPeakMemory}{M_{\text{peak}}} \newcommand{\AdaptationPowerIncrement}{P_{\text{update}}} \newcommand{\AdaptationWindowEnergy}{E_{\text{update}}} \newcommand{\AdaptedHiddenActivation}{\mathbf{h}'} \newcommand{\AdaptedTaskCost}{C_{\text{task, adapt}}} \newcommand{\AdaptedWeightMatrix}{\mathbf{W}_{\text{adapted}}} \newcommand{\AdapterActivationFunction}{\sigma} \newcommand{\AdapterAssignmentVector}{\mathbf{m}} \newcommand{\AdapterDownProjectionMatrix}{\mathbf{A}} \newcommand{\AdapterIndex}{k} \newcommand{\AdapterInitializationStandardDeviation}{\sigma} \newcommand{\AdapterRank}{r} \newcommand{\AdapterScalingFactor}{\gamma} \newcommand{\AdapterUpProjectionMatrix}{\mathbf{B}} \newcommand{\AdjacentNeighboringDataset}{X'} \newcommand{\AdjacentQueryResult}{v'} \newcommand{\AdminLeaseTime}{T_{\text{admin}}} \newcommand{\AdmissibleBacklogCount}{n} \newcommand{\AdmissibleControlSet}{\mathcal{U}_{\text{adm}}} \newcommand{\AdmissibleDisturbanceSet}{\mathcal{W}} \newcommand{\AdmissionCheckCount}{n_{\text{chk}}} \newcommand{\AdmissionCheckIndex}{i} \newcommand{\AdmissionDecisionEvent}{e_{\text{auth}}} \newcommand{\AdmissionInclusivePrebrakeDelay}{T_{\text{true}}} \newcommand{\AdmissionRouteYield}{Y} \newcommand{\AdmittedAttemptCap}{N} \newcommand{\AdmittedCommand}{u} \newcommand{\AdmittedContactForce}{F^*} \newcommand{\AdmittedControlCommand}{\mathbf{u}} \newcommand{\AdmittedSpeedCommand}{v^*} \newcommand{\AdmittedTargetPosition}{\hat{\mathbf{p}}_{\text{target}}} \newcommand{\AdmittedWorkUnitCount}{m} \newcommand{\AdvantageStabilizer}{\epsilon_{\text{stab}}} \newcommand{\AdversarialDisturbance}{\mathbf{d}} \newcommand{\AdversarialExample}{x_{\text{adv}}} \newcommand{\AdversarialInputLength}{n} \newcommand{\AdversarialPenaltyWeight}{\lambda_{\text{adv}}} \newcommand{\AdversarialPerturbation}{\boldsymbol{\delta}_{\text{adv}}} \newcommand{\AdversarialPerturbationBudget}{\epsilon_{\text{adv}}} \newcommand{\AdversaryLoss}{\mathcal{L}_{\text{adv}}} \newcommand{\AffordanceFrame}{\mathcal{F}_{\text{affordance}}} \newcommand{\AffordanceSuccessEstimate}{V_{\text{policy}}} \newcommand{\AgeBlindTravel}{\Delta x_{\text{blind}}} \newcommand{\AgeCheckInstant}{t_{\text{curr}}} \newcommand{\AggregateServerPower}{P_{\text{servers}}} \newcommand{\AggregateSlotWork}{W} \newcommand{\AggregatedRecoveryDataset}{\mathcal{D}} \newcommand{\AggregatedSurrogateLoss}{\epsilon_N} \newcommand{\AggregationLearnedPolicy}{\hat{\pi}} \newcommand{\AggregationLearnerStateDistribution}{d_{\hat{\pi}_i}} \newcommand{\AggregationRoundCount}{N} \newcommand{\AggregationRoundIndex}{i} \newcommand{\AggregationRoundTrajectorySet}{\mathcal{T}} \newcommand{\AiStandaloneSensitivity}{S_{\text{AI}}} \newcommand{\AisleTravelSpeed}{v_{\text{aisle}}} \newcommand{\AisleWidth}{w} \newcommand{\AlertCheckCount}{N_{\text{tests}}} \newcommand{\AlertFalsePositiveRate}{\alpha_{\text{fp}}} \newcommand{\AlgorithmTaxonomyAxis}{\mathsf{Algorithm}} \newcommand{\AliasedVibrationFrequency}{f_{\text{alias}}} \newcommand{\AliasingHarmonicIndex}{k} \newcommand{\AllGatherCompletionTime}{T_{\text{allgather}}} \newcommand{\AllOnesVector}{\mathbf{1}} \newcommand{\AllReduceCompletionTime}{T_{\text{allreduce}}} \newcommand{\AllReduceMinimumBandwidthTime}{T_{\text{bandwidth}}^{\text{min}}} \newcommand{\AllRunsPassEstimate}{\widehat{r}} \newcommand{\AllToAllCompletionTime}{T_{\text{alltoall}}} \newcommand{\AllToAllExchangeTime}{T} \newcommand{\AllocatedBlockCount}{N_{\text{blocks}}} \newcommand{\AllocatedHazardRate}{\lambda_{\text{alloc}}} \newcommand{\AllocatedWallTime}{T_{\text{wall}}} \newcommand{\AllowableCollisionEnergy}{E_{k, \text{allow}}} \newcommand{\AllowableRailDroop}{\Delta V_{\text{droop, max}}} \newcommand{\AllowableRailExcursion}{\Delta V_{\max}} \newcommand{\AllowableWindingTemperatureRise}{\Delta T_{\max}} \newcommand{\AllowedTokenSet}{\mathcal{V}_{\text{allow}}} \newcommand{\AllowedViolationFraction}{V^{\text{allow}}} \newcommand{\AlphabetByte}{b} \newcommand{\AlternateModelInput}{x'} \newcommand{\AmbientDimension}{D} \newcommand{\AmbientTemperature}{T_{\text{amb}}} \newcommand{\AmortizedTurnCost}{\bar{C}_{\text{turn}}} \newcommand{\AngularAcceleration}{\boldsymbol{\alpha}} \newcommand{\AngularClearance}{\theta_{\text{clear}}} \newcommand{\AngularClearanceRate}{\dot{\theta}_{\text{clear}}} \newcommand{\AngularFrequency}{\omega} \newcommand{\AngularSpeed}{\omega} \newcommand{\AngularVelocity}{\boldsymbol{\omega}} \newcommand{\AngularVelocityDerivative}{\dot{\boldsymbol{\omega}}} \newcommand{\AnnualQueryVolume}{Q_{\text{annual}}} \newcommand{\AnonymitySetSize}{k_{\text{anon}}} \newcommand{\AntiWindupTrackingTimeConstant}{T_t} \newcommand{\AntialiasingFilterVariance}{s} \newcommand{\ApiAccount}{u} \newcommand{\ApparentContrast}{C} \newcommand{\AppearanceRealityGap}{\Delta_{\text{vis}}} \newcommand{\AppliedForce}{F} \newcommand{\AppliedLoadCycleCount}{n} \newcommand{\ApproachChannelCount}{K_a} \newcommand{\ApproachDirection}{\hat{\mathbf{a}}_{\text{approach}}} \newcommand{\ApproachPosition}{x} \newcommand{\ApproachPredicate}{P_{\text{approach}}} \newcommand{\ApproachSpeed}{v_{\text{app}}} \newcommand{\ApprovalCatchFraction}{q} \newcommand{\ApprovalHeldTrajectories}{N_{\text{held}}} \newcommand{\ApproximatingDistribution}{q} \newcommand{\ArbitrationFieldBitCount}{B_{\text{arb},i}} \newcommand{\ArcObstacleDistance}{d_{\text{arc}}} \newcommand{\ArchitectureResourceCost}{C} \newcommand{\ArchitectureSearchSpace}{\mathcal{A}} \newcommand{\ArcsineEffectSize}{h} \newcommand{\ArgumentLegConfidence}{r} \newcommand{\ArgumentLegCount}{m} \newcommand{\ArithmeticIntensity}{I} \newcommand{\ArmStoppingDeceleration}{a_{\text{arm}}} \newcommand{\ArmSuccessProbability}{p} \newcommand{\ArmingSettleDuration}{t_{\text{settle}}} \newcommand{\ArrivalOffsetTravel}{\Delta x} \newcommand{\ArrivalRate}{\lambda_{\text{arr}}} \newcommand{\ArrivalStampOffset}{\Delta t_{\text{recv}}} \newcommand{\ArrivalTimestamp}{t_{\text{recv}}} \newcommand{\ArtifactVersion}{v} \newcommand{\AssessedContactForceLimit}{F_{\text{limit}}} \newcommand{\AssignedJobGpu}{g} \newcommand{\AssociationCostEntry}{c} \newcommand{\AssuranceClaim}{C} \newcommand{\AsymptoticTightBound}{\Theta} \newcommand{\AtmosphericExtinctionCoefficient}{\beta_{\text{atm}}} \newcommand{\AttackStepsPgd}{K_{\text{PGD}}} \newcommand{\AttackedTrialCount}{n} \newcommand{\AttainableComputeRate}{R_{\text{attain}}} \newcommand{\AttemptCleanupCost}{C_{\text{cleanup}}} \newcommand{\AttemptCost}{C_{\text{attempt}}} \newcommand{\AttemptCycleDuration}{t_{\text{cyc}}} \newcommand{\AttemptDuration}{t_{\text{att}}} \newcommand{\AttemptGenerationTime}{T_{\text{gen}}} \newcommand{\AttemptPassProbability}{p} \newcommand{\AttemptRuntimeOverheadCost}{C_{\text{runtime}}} \newcommand{\AttemptVerificationCost}{C_{\text{verify}}} \newcommand{\AttentionHeadCount}{N_{\text{heads}}} \newcommand{\AttentionHeadDimension}{d_{\text{head}}} \newcommand{\AttentionHeadIndex}{i} \newcommand{\AttentionHeadOutput}{\mathbf{O}} \newcommand{\AttentionKeyMatrix}{\mathbf{K}} \newcommand{\AttentionOutputMatrix}{\mathbf{O}} \newcommand{\AttentionOutputProjectionMatrix}{\mathbf{W}_{O}} \newcommand{\AttentionQueryMatrix}{\mathbf{Q}} \newcommand{\AttentionScoreEntry}{S_{ij}} \newcommand{\AttentionScoreMatrix}{\mathbf{S}} \newcommand{\AttentionScoreRow}{\mathbf{S}_{i, \cdot}} \newcommand{\AttentionScoreSummand}{S_{ik}} \newcommand{\AttentionScoreTile}{\mathbf{S}_{ij}} \newcommand{\AttentionValuesMatrix}{\mathbf{V}} \newcommand{\AttentionValuesProjectionMatrix}{\mathbf{W}_{V}} \newcommand{\AttentionValuesSourceMatrix}{\mathbf{X}_{V}} \newcommand{\AttentionValuesVector}{\mathbf{v}} \newcommand{\AttentionWeightEntry}{A_{ij}} \newcommand{\AttentionWeightMatrix}{\mathbf{A}} \newcommand{\AttentionWeightVector}{\mathbf{a}} \newcommand{\AttitudeError}{\theta_{\text{att}}} \newcommand{\AttributionFeatureCount}{n_{\text{feat}}} \newcommand{\AuditGroupRecordCount}{n_{\text{records}}} \newcommand{\AuthorityExposureLevel}{A} \newcommand{\AutocorrelationLagIndex}{k} \newcommand{\AutoencoderReconstructionError}{\mathcal{L}_{\text{rec}}} \newcommand{\AutomatedResetTime}{t_{\text{reset,auto}}} \newcommand{\AutomatonStateSet}{Q} \newcommand{\AutomatonTransitionFunction}{\delta} \newcommand{\AutonomousExecutionComputeCost}{C_{\text{compute}}} \newcommand{\AutoscalingDecisionTime}{T_{\text{decide}}} \newcommand{\AutoscalingDetectionTime}{T_{\text{detect}}} \newcommand{\AutoscalingResponseTime}{T_{\text{response}}} \newcommand{\AvailabilityObjective}{S_{\text{availability}}} \newcommand{\AvailableBrakingDistance}{D_{\text{avail}}} \newcommand{\AvailableDeceleration}{a} \newcommand{\AvailableObservations}{\mathcal{O}_{\text{avail}}} \newcommand{\AverageCopperLossPower}{\bar{P}_{\text{loss}}} \newcommand{\AverageOnlineRegret}{\gamma_N} \newcommand{\AveragePower}{P_{\text{avg}}} \newcommand{\AverageStateVisitationDistribution}{\bar{d}} \newcommand{\AxiBurstLength}{A_{\text{len}}} \newcommand{\AxisGridPointCount}{N} \newcommand{\AzimuthAngle}{\theta_{\text{az}}} \newcommand{\BackEmfVoltage}{e_{\text{bemf}}} \newcommand{\BacklashAngle}{\theta_{\text{backlash}}} \newcommand{\BackwardEulerEigenvalue}{\lambda_{\text{BE}}} \newcommand{\BackwardEulerTransitionMatrix}{\mathbf{A}_{\text{BE}}} \newcommand{\BackwardPassTime}{T_{\text{backward}}} \newcommand{\BackwardReachableTube}{\mathcal{R}} \newcommand{\BalanceDivergenceTime}{\tau_{\text{fall}}} \newcommand{\BallRadius}{r} \newcommand{\BallVolume}{V_D} \newcommand{\Bandwidth}{\text{BW}} \newcommand{\BankConflictPenalty}{\Delta t_{\text{conflict}}} \newcommand{\BarrierConstraintBound}{b_{\text{cbf}}} \newcommand{\BarrierConstraintCount}{K_b} \newcommand{\BarrierConstraintNormal}{\mathbf{a}_{\text{cbf}}} \newcommand{\BarrierFunction}{h} \newcommand{\BarrierFunctionRate}{\dot{h}} \newcommand{\BarrierHalfSpaceControlSet}{\mathcal{U}_{\text{safe}}} \newcommand{\BarrierMargin}{\delta} \newcommand{\BarrierNormalizationScale}{h_{\text{scale}}} \newcommand{\BarrierProjectionLagrangian}{L_{\text{Lag}}} \newcommand{\BarrierProjectionMultiplier}{\lambda} \newcommand{\BarrierRelativeDegree}{r} \newcommand{\BaseAbscissaVelocity}{\dot{x}} \newcommand{\BaseAccelerationCommand}{a} \newcommand{\BaseBatchSize}{B_{\text{base}}} \newcommand{\BaseCameraRotation}{\mathbf{R}_{\text{base}}^{\text{cam}}} \newcommand{\BaseCameraTransform}{\mathbf{T}_{\text{base}}^{\text{cam}}} \newcommand{\BaseCameraTranslation}{\mathbf{t}_{\text{base}}^{\text{cam}}} \newcommand{\BaseFlangeTransform}{\mathbf{T}_{\text{base}}^{\text{flange}}} \newcommand{\BaseForwardSpeed}{v} \newcommand{\BaseFramePoint}{\mathbf{p}_{\text{base}}} \newcommand{\BaseHeadingRate}{\dot{\theta}_{\text{head}}} \newcommand{\BaseJointInertiaCoupling}{\mathbf{M}_{bj}} \newcommand{\BaseLateralPosition}{y_{\text{base}}} \newcommand{\BaseLateralVelocity}{\dot{y}} \newcommand{\BaseLayerCount}{N_{L,0}} \newcommand{\BaseLearningRate}{\eta_{\text{base}}} \newcommand{\BaseLongitudinalPosition}{x_{\text{base}}} \newcommand{\BaseLongitudinalVelocity}{\dot{x}} \newcommand{\BaseOdometrySpeed}{v} \newcommand{\BaseOrdinateVelocity}{\dot{y}} \newcommand{\BasePosition}{\mathbf{p}_{\text{base}}} \newcommand{\BasePromptLength}{S_{\text{base}}} \newcommand{\BaseStoppingDistance}{d_{\text{base}}} \newcommand{\BaseToCameraTransform}{\mathbf{T}_{\text{cam} \leftarrow \text{base}}} \newcommand{\BaseTrainingComputeCost}{C_{\text{compute}}} \newcommand{\BaseTrajectoryTokenCount}{N_{\text{base}}} \newcommand{\BaseTravelDistance}{d} \newcommand{\BaseTravelSpeed}{v_{\text{base}}} \newcommand{\BaseWidthMultiplier}{w_{\text{mult},0}} \newcommand{\BaseWorkerCount}{N_{\text{base}}} \newcommand{\BaseWristTransform}{\mathbf{T}_{\text{base} \leftarrow \text{wrist}}} \newcommand{\BaseYawRateBias}{\omega_{\text{bias}}} \newcommand{\BaselineAcceptanceEstimate}{\hat{p}_{\text{base}}} \newcommand{\BaselineAnnualOperationsCost}{C_{\text{current}}} \newcommand{\BaselineControllerAction}{\mathbf{a}_t^{\text{base}}} \newcommand{\BaselineConversionRate}{p_0} \newcommand{\BaselineFeatureMean}{\mu_{\text{base}}} \newcommand{\BaselineFeatureStandardDeviation}{\sigma_{\text{base}}} \newcommand{\BaselineIntervalLowerLimit}{l_{\text{base}}} \newcommand{\BaselineIntervalUpperLimit}{u_{\text{base}}} \newcommand{\BaselineLowerLimitDistance}{\delta^-_{\text{base}}} \newcommand{\BaselineOnlyAcceptedTaskCount}{b} \newcommand{\BaselineOnlyCorrectCount}{n_{\text{base}}} \newcommand{\BaselinePolicyAcceptanceProbability}{p_{X}} \newcommand{\BaselinePolicyCost}{C_{X}} \newcommand{\BaselineStateDistribution}{d^{\pi_{\text{base}}}} \newcommand{\BaselineTaskCost}{C_{\text{task, base}}} \newcommand{\BaselineToolCallDistribution}{p_{b}} \newcommand{\BaselineTrackingError}{e_{\text{track}}} \newcommand{\BaselineTrainingDuration}{T_{\text{hours}}} \newcommand{\BaselineTrajectoryGoodput}{\mathcal{G}_{b}} \newcommand{\BaselineUpperLimitDistance}{\delta^+_{\text{base}}} \newcommand{\BatchArrivalRate}{\lambda_{\text{batch}}} \newcommand{\BatchAxisLabel}{b} \newcommand{\BatchBufferMemory}{M_{\text{batch}}} \newcommand{\BatchCostPerAcceptedTask}{C_{\text{eff,batch}}} \newcommand{\BatchDataVolume}{D_{\text{vol}}^{(\text{batch})}} \newcommand{\BatchExampleIndex}{n} \newcommand{\BatchFetchTime}{T_{\text{fetch}}} \newcommand{\BatchFillArrivalCount}{k} \newcommand{\BatchFixedOverheadTime}{T_{\text{fixed}}} \newcommand{\BatchFlushStartTime}{t_{\text{start}}} \newcommand{\BatchFormationDelay}{L_{\text{lat,form}}} \newcommand{\BatchIndex}{k} \newcommand{\BatchLabelComponent}{y_{ij}} \newcommand{\BatchLatencyEnvelope}{L_{\text{lat,envelope}}} \newcommand{\BatchLoss}{\mathcal{L}_{\text{batch}}} \newcommand{\BatchMaxOutputLength}{S_{\text{max}}} \newcommand{\BatchMaximumDeviationMultiple}{k} \newcommand{\BatchMeanOutputLength}{\bar{S}} \newcommand{\BatchNormMean}{\mu_{\mathcal{B}}} \newcommand{\BatchNormOutput}{y} \newcommand{\BatchNormRunningMean}{\boldsymbol{\mu}_{\mathcal{B}}} \newcommand{\BatchNormRunningStandardDeviation}{\boldsymbol{\sigma}_{\mathcal{B}}} \newcommand{\BatchNormStandardDeviation}{\sigma_{\mathcal{B}}} \newcommand{\BatchOperations}{O_{\text{batch}}} \newcommand{\BatchPredictedProbability}{\hat{y}_{ij}} \newcommand{\BatchProcessingTime}{T_{\text{process}}} \newcommand{\BatchRolloutCount}{N_{\text{batch}}} \newcommand{\BatchScalingFactor}{k} \newcommand{\BatchServiceTime}{T_{\text{svc}}} \newcommand{\BatchSize}{B} \newcommand{\BatchTransferTime}{T_{\text{transfer}}} \newcommand{\BatchedDecodeStepTime}{t_{\text{step}}} \newcommand{\BatchedEventIndex}{i} \newcommand{\BatchedRequestLatency}{L_{\text{lat,batch}}} \newcommand{\BatchingLatencyBudget}{L_{\text{lat,budget}}} \newcommand{\BatchingQueueWait}{L_{\text{lat,wait}}} \newcommand{\BatchingWindow}{T_{\text{window}}} \newcommand{\BatteryCellResistance}{R_{\text{cell}}} \newcommand{\BeamDivergenceAngle}{\delta\theta_{\text{div}}} \newcommand{\BeamWidth}{W} \newcommand{\BearingRay}{\mathbf{r}} \newcommand{\BeatFrequency}{f_b} \newcommand{\BehaviorCloningHorizon}{S} \newcommand{\BehaviorCloningLoss}{\mathcal{L}_{\text{BC}}} \newcommand{\BehaviorDistribution}{b} \newcommand{\BehaviorPolicyVersion}{\text{ver}_b} \newcommand{\BeliefErrorBound}{E} \newcommand{\BeliefInvalidationHorizon}{T_{\text{inv}}} \newcommand{\BeliefState}{b} \newcommand{\BellmanBackupTarget}{y} \newcommand{\BellmanErrorLoss}{\mathcal{L}_{\text{Bellman}}} \newcommand{\BelowThresholdIndicator}{\mathbf{1}_{\{|(\mathbf{W}_{\text{sparse}})_{ij}| \leq \delta_{\text{prune}}\}}} \newcommand{\BestEffortWireBitCount}{B_{\text{BE,wire}}} \newcommand{\BetterArmSuccessProbability}{p_{\text{high}}} \newcommand{\BetweenTaskStandardDeviation}{\sigma_{\text{task}}} \newcommand{\BevPillarFeature}{\mathbf{V}_{\text{BEV}}} \newcommand{\BevPillarXIndex}{X} \newcommand{\BevPillarYIndex}{Y} \newcommand{\BiasFeedbackFactor}{\alpha_{\text{fb}}} \newcommand{\BiasVector}{\mathbf{b}} \newcommand{\BilledAllocationTime}{T_{\text{total}}} \newcommand{\BinaryActivationVector}{\mathbf{a}} \newcommand{\BinaryClassifier}{h} \newcommand{\BinaryWeightVector}{\mathbf{w}} \newcommand{\BinomialSuccessCount}{X} \newcommand{\BipedTiltAcceleration}{\ddot{\theta}_{\text{tilt}}} \newcommand{\BisectionBandwidth}{\text{BW}_{\text{bisect}}} \newcommand{\BitFlippedFloatNumber}{x_{\text{corrupt}}} \newcommand{\BitTime}{T_{\text{bit}}} \newcommand{\BlackoutClockConversionError}{\Delta t_{\text{one-sigma scenario}}} \newcommand{\BlendDeadline}{t_{\text{blend}}} \newcommand{\BlendedCommandJerk}{j_{\text{cmd}}} \newcommand{\BlendedControlCommand}{\mathbf{u}_{\text{blend}}} \newcommand{\BlendedInputTokenPrice}{c_{\text{in}}} \newcommand{\BlendingTransitionWindow}{\tau_{\text{blend}}} \newcommand{\BlindTravelDistance}{d_{\text{blind}}} \newcommand{\BlockCheckTime}{T_{\text{ver}}} \newcommand{\BlockCoordinateX}{b_x} \newcommand{\BlockCoordinateY}{b_y} \newcommand{\BlockCoordinateZ}{b_z} \newcommand{\BlockEdgeVoxelCount}{n_{\text{blk}}} \newcommand{\BlockMaximum}{M} \newcommand{\BlockMaximumLevel}{z} \newcommand{\BlockMaximumLimitDistribution}{G} \newcommand{\BlockMaximumNormalizingScale}{a} \newcommand{\BlockMaximumNormalizingShift}{b} \newcommand{\BlockMetadataSize}{s_{\text{meta}}} \newcommand{\BlockQuantizationScale}{s_b} \newcommand{\BlockRangeMaximum}{x_{\max,i}} \newcommand{\BlockRangeMinimum}{x_{\min,i}} \newcommand{\BlockSampleCount}{n} \newcommand{\BlockedWorkerCount}{N_{\text{blocked}}} \newcommand{\BlockingCallTimeout}{T_{\text{out}}} \newcommand{\BlockingTaskIndex}{k} \newcommand{\BodyAcceleration}{\dot{v}} \newcommand{\BodyDisplacement}{x} \newcommand{\BodyEndEffectorTransform}{\mathbf{T}_{BE}} \newcommand{\BodyFramePoint}{\mathbf{p}_{\text{body}}} \newcommand{\BodyFramePointCovariance}{\boldsymbol{\Sigma}_{\text{body}}} \newcommand{\BodyLidarTransform}{\mathbf{T}_{bl}} \newcommand{\BodyReferenceFrame}{\mathcal{F}_B} \newcommand{\BodyRegionMass}{m_H} \newcommand{\BodySpeed}{v} \newcommand{\BoltzmannConstant}{k_B} \newcommand{\BoltzmannStateEnergy}{E} \newcommand{\BoltzmannTemperature}{T} \newcommand{\BootstrapQuantileFunction}{Q} \newcommand{\BootstrapReplicateCount}{B_{\text{boot}}} \newcommand{\BootstrapReplicateIndex}{r} \newcommand{\BottomedOutContactStiffness}{k_{\infty}} \newcommand{\BouligandContingentCone}{T_{\mathcal{C}}} \newcommand{\BoundaryConditionVector}{\mathbf{b}} \newcommand{\BoundaryLayerTime}{t_{\text{fast}}} \newcommand{\BoundedRegimeTimestamp}{t_{\text{bounded}}} \newcommand{\BoxMaximumHorizontalCoordinate}{x_{\text{max}}} \newcommand{\BoxMaximumVerticalCoordinate}{y_{\text{max}}} \newcommand{\BoxMinimumHorizontalCoordinate}{x_{\text{min}}} \newcommand{\BoxMinimumVerticalCoordinate}{y_{\text{min}}} \newcommand{\BrakeChopperResistance}{R_{\text{brake}}} \newcommand{\BrakeCommandForce}{F_{\text{cmd}}} \newcommand{\BrakeResistorPulseEnergy}{E_{\text{pulse}}} \newcommand{\BrakingDistance}{d_{\text{brake}}} \newcommand{\BrakingForce}{F_{\text{brake}}} \newcommand{\BrakingOnsetContactForce}{F_{\text{cmd}}} \newcommand{\BrakingWork}{W_{\text{brake}}} \newcommand{\BreadthCriticalPathLatency}{T^{\text{breadth}}} \newcommand{\BreadthPeakKvCacheMemory}{M_{\text{KV}}^{\text{breadth}}} \newcommand{\BreakEvenAcceptanceProbability}{p'} \newcommand{\BreakEvenBrakingDeceleration}{a} \newcommand{\BreakEvenParseFailureRate}{p_{\text{break}}} \newcommand{\BreakEvenTaskCount}{N^*} \newcommand{\BreakEvenUtilization}{u^*} \newcommand{\BreakerCooldownInterval}{T_{\text{cool}}} \newcommand{\BreakerFailureFraction}{r} \newcommand{\BreakerMinimumSampleCount}{n_{\min}} \newcommand{\BreakerOutcomeIndex}{i} \newcommand{\BreakerOutcomeWindow}{W} \newcommand{\BreakerTripThreshold}{r_{\text{trip}}} \newcommand{\BridgeTraceResistance}{R_{\text{trace}}} \newcommand{\BroadcastColumnElement}{A} \newcommand{\BroadcastColumnTensor}{\mathbf{A}} \newcommand{\BroadcastCompletionTime}{T_{\text{broadcast}}} \newcommand{\BroadcastRowElement}{b} \newcommand{\BroadcastRowTensor}{\mathbf{B}} \newcommand{\BroadcastTableSize}{s_{\text{table}}} \newcommand{\BspLearningRate}{\eta_{\text{BSP}}} \newcommand{\BsplineBasisFunction}{B} \newcommand{\BudgetEvaluationTime}{\tau} \newcommand{\BudgetFreeBalance}{F} \newcommand{\BudgetNodeIndex}{k} \newcommand{\BudgetReservedFunds}{R} \newcommand{\BudgetSettledCharges}{E} \newcommand{\BudgetedAcceptanceProbability}{q_{\pi}} \newcommand{\BufferDependencyEdgeSet}{E} \newcommand{\BufferDependencyGraph}{G} \newcommand{\BufferDependencyVertexSet}{V} \newcommand{\BufferIndex}{i} \newcommand{\BulkDecouplingCapacitance}{C_{\text{bulk}}} \newcommand{\BumplessTransferBlend}{\alpha} \newcommand{\BumplessTransferBlendAcceleration}{\ddot{\alpha}} \newcommand{\BumplessTransferBlendRate}{\dot{\alpha}} \newcommand{\BumplessTransferBlendSlope}{\alpha'} \newcommand{\BumplessTransferProgress}{\hat{t}} \newcommand{\BumplessTransferStartInstant}{t_{\text{start}}} \newcommand{\BurstArrivalCount}{N_{\text{burst}}} \newcommand{\BurstSurvivalTime}{t_{\text{limit}}} \newcommand{\BusBitRate}{R_{\text{bit}}} \newcommand{\BusCapacitorEnergy}{E_C} \newcommand{\BusCapacitorVoltage}{V_C} \newcommand{\BusSerializationTime}{t_{\text{bus}}} \newcommand{\ButterflyAllReduceTime}{T_{\text{butterfly}}} \newcommand{\ByteAlphabet}{\Sigma} \newcommand{\ByteString}{u} \newcommand{\ByzantineClientCount}{f} \newcommand{\ByzantineFaultCount}{f} \newcommand{\CableFlexCycleCount}{n_{\text{cable}}} \newcommand{\CableRatedFatigueLife}{L_{\text{cable}}} \newcommand{\CacheMissStallFraction}{f} \newcommand{\CachedInputTokenCount}{n_{\text{cache}}} \newcommand{\CachedInputTokenPrice}{c_{\text{cache}}} \newcommand{\CalibratedAcceptanceEstimate}{\hat{p}} \newcommand{\CalibrationBinCount}{N_{\text{bins}}} \newcommand{\CalibrationBinExampleSet}{B_m} \newcommand{\CalibrationBinIndex}{m} \newcommand{\CalibrationConstraintMatrix}{\mathbf{V}} \newcommand{\CalibrationDataDistribution}{p_{\text{cal}}} \newcommand{\CalibrationDataset}{\mathcal{C}_{\text{cal}}} \newcommand{\CalibrationExampleCount}{n_{\text{cal}}} \newcommand{\CalibrationModelPoint}{\mathbf{M}} \newcommand{\CalibrationPoseIndex}{k} \newcommand{\CalibrationRotationAxisCount}{N} \newcommand{\CalibrationSceneIndex}{j} \newcommand{\CalibrationTemperature}{T_{\text{cal}}} \newcommand{\CalibrationViewCount}{N} \newcommand{\CallLatency}{T_{\text{call}}} \newcommand{\CallPostprocessingTime}{T_{\text{post}}} \newcommand{\CallPreparationTime}{T_{\text{prep}}} \newcommand{\CallTailProbability}{p_{\text{tail}}} \newcommand{\CallUsefulWorkTime}{W} \newcommand{\CameraCenterArcPosition}{x_{\text{rot}}} \newcommand{\CameraExtrinsicRotation}{\mathbf{R}_{bc}} \newcommand{\CameraExtrinsicTransform}{\mathbf{T}_{bc}} \newcommand{\CameraExtrinsicTranslation}{\mathbf{p}_{bc}} \newcommand{\CameraFrameDepth}{Z_c} \newcommand{\CameraFrameHorizontalCoordinate}{X_c} \newcommand{\CameraFramePeriod}{T_{\text{sample}}} \newcommand{\CameraFramePoint}{\mathbf{p}_c} \newcommand{\CameraFramePointCovariance}{\boldsymbol{\Sigma}_c} \newcommand{\CameraFrameVerticalCoordinate}{Y_c} \newcommand{\CameraIdentifierEmbedding}{\mathbf{e}_{\text{cam}}} \newcommand{\CameraImage}{\mathbf{I}} \newcommand{\CameraImuTimeOffset}{\Delta t_{\text{imu}}} \newcommand{\CameraIntrinsicCalibrationMatrix}{\mathbf{K}} \newcommand{\CameraIntrinsicInverseTranspose}{\mathbf{K}^{-\top}} \newcommand{\CameraLateralStandardDeviation}{\sigma_{x_c}} \newcommand{\CameraMountTiltAngle}{\theta_{\text{ext}}} \newcommand{\CameraObjectTransform}{\mathbf{T}_{\text{camera}}^{\text{object}}} \newcommand{\CameraOpticalCenter}{\mathbf{o}} \newcommand{\CameraReferenceFrame}{\mathcal{F}_{\text{cam}}} \newcommand{\CameraRotationColumn}{\mathbf{r}} \newcommand{\CameraSampleTimestamp}{t_{\text{cam}}} \newcommand{\CameraSkewCoefficient}{\gamma} \newcommand{\CameraTargetTransform}{\mathbf{T}_{\text{cam}}^{\text{target}}} \newcommand{\CameraToWorldRotation}{\mathbf{R}_{WC}} \newcommand{\CameraToWorldTransform}{\mathbf{T}_{WC}} \newcommand{\CameraToWorldTranslation}{\mathbf{t}_{WC}} \newcommand{\CampaignActiveTime}{T_{\text{active}}} \newcommand{\CanHighLineVoltage}{V_{\text{CANH}}} \newcommand{\CanLowLineVoltage}{V_{\text{CANL}}} \newcommand{\CanaryAllocationFraction}{\rho} \newcommand{\CanaryInterventionRate}{\lambda_{\text{canary}}} \newcommand{\CanaryLabelDelay}{t_{\text{label}}} \newcommand{\CanarySpeedBound}{v_{\text{canary}}} \newcommand{\CanaryStageDuration}{T_{\text{stage}}} \newcommand{\CanaryTrafficFraction}{p_{\text{stage}}} \newcommand{\CandidateAcceptanceEstimate}{\hat{p}_{\text{cand}}} \newcommand{\CandidateActionVector}{\hat{\mathbf{a}}} \newcommand{\CandidateArchitecture}{a} \newcommand{\CandidateAvailabilityEstimate}{\widehat{q}} \newcommand{\CandidateAvailabilityProbability}{q} \newcommand{\CandidateCheckingCost}{v} \newcommand{\CandidateClientCount}{K_{\text{candidates}}} \newcommand{\CandidateControlCommand}{\mathbf{u}^{\text{cand}}} \newcommand{\CandidateControlCommandDerivative}{\dot{\mathbf{u}}^{\text{cand}}} \newcommand{\CandidateDefectRate}{\epsilon} \newcommand{\CandidateGenerationCost}{g} \newcommand{\CandidateIndex}{i} \newcommand{\CandidateIntervalLowerLimit}{l_{\text{cand}}} \newcommand{\CandidateIntervalUpperLimit}{u_{\text{cand}}} \newcommand{\CandidateLowerLimitDistance}{\delta^-_{\text{cand}}} \newcommand{\CandidateOnlyAcceptedTaskCount}{c} \newcommand{\CandidatePolicyAcceptanceProbability}{p_{Y}} \newcommand{\CandidatePolicyAction}{\mathbf{a}_t^{\text{cand}}} \newcommand{\CandidatePolicyCost}{C_{Y}} \newcommand{\CandidatePoolSize}{N} \newcommand{\CandidateProposal}{p} \newcommand{\CandidateRoutingPolicy}{Y} \newcommand{\CandidateScoreVector}{\mathbf{c}} \newcommand{\CandidateScoringCost}{c_{\text{infer}}} \newcommand{\CandidateScoringError}{\epsilon} \newcommand{\CandidateSkill}{a} \newcommand{\CandidateSpeedCommand}{v_{\text{cand}}} \newcommand{\CandidateTailCompletionTime}{\widehat{T}_{c,0.99}} \newcommand{\CandidateToolCallDistribution}{p_{c}} \newcommand{\CandidateTrackingErrorStandardDeviation}{\sigma_{\text{track}}} \newcommand{\CandidateTrajectoryGoodput}{\mathcal{G}_{c}} \newcommand{\CandidateUpperLimitDistance}{\delta^+_{\text{cand}}} \newcommand{\CandidateUtility}{U} \newcommand{\CandidateUtilityMean}{\mu} \newcommand{\CandidateUtilityStandardDeviation}{\sigma_{U}} \newcommand{\CandidateViolationCount}{V_{c}} \newcommand{\CandidateWinCount}{j} \newcommand{\CapabilityGrant}{\Gamma} \newcommand{\CaptureAgeEmbedding}{\mathbf{e}_{\Delta t}} \newcommand{\CaptureSampleIndex}{t_0} \newcommand{\CaptureSampleKalmanGain}{\mathbf{G}_{t_0}} \newcommand{\CaptureSampleMeasurementMatrix}{\mathbf{H}_{t_0}} \newcommand{\CaptureSamplePredictedCovariance}{\mathbf{P}_{t_0|t_0-1}} \newcommand{\CaptureSamplePredictedEstimate}{\hat{\mathbf{x}}_{t_0|t_0-1}} \newcommand{\CaptureSampleUpdatedCovariance}{\mathbf{P}_{t_0|t_0}} \newcommand{\CaptureSampleUpdatedEstimate}{\hat{\mathbf{x}}_{t_0|t_0}} \newcommand{\CaptureTimestamp}{t_{\text{capture}}} \newcommand{\CapturedSensorObservation}{\mathbf{z}_{t_0}} \newcommand{\CartesianAcceleration}{\ddot{\mathbf{p}}} \newcommand{\CartesianPosition}{\mathbf{p}} \newcommand{\CartesianXCoordinate}{x} \newcommand{\CartesianYCoordinate}{y} \newcommand{\CartesianZCoordinate}{z} \newcommand{\CascadeEscalationProbability}{p_{\text{escalate}}} \newcommand{\CascadeGateCost}{g} \newcommand{\CascadeGateDuration}{v} \newcommand{\CascadeInferenceEnergy}{E_{\text{cascade}}} \newcommand{\CascadeTaskCost}{C_{\text{cascade}}} \newcommand{\CascadeTaskDuration}{T_{\text{cascade}}} \newcommand{\CascadeTierCost}{c^{\text{tier}}} \newcommand{\CascadeTierDuration}{t} \newcommand{\CascadeTierIndex}{j} \newcommand{\CascadedBarrierCertificate}{\psi} \newcommand{\CascadedBarrierClassKFunction}{\alpha} \newcommand{\CascadedBarrierDerivative}{\dot{\psi}} \newcommand{\CaseAmbientThermalResistance}{R_{\text{th,case-amb}}} \newcommand{\CaseTemperature}{T_{\text{case}}} \newcommand{\CaseThermalCapacitance}{C_{\text{case}}} \newcommand{\CaseThermalTimeConstant}{\tau_{\text{th,case}}} \newcommand{\CatalogDefinitionTokens}{S_{\text{catalog}}} \newcommand{\CatalogStagingCallCount}{N} \newcommand{\CategoryRecordCount}{n} \newcommand{\CausalInterventionMask}{\mathcal{M}} \newcommand{\CausalMediator}{M} \newcommand{\CausalTokenPosition}{s} \newcommand{\CbsRuntimeBudget}{Q} \newcommand{\CellOccupancyProbability}{p} \newcommand{\CenterCount}{k} \newcommand{\CentralizedTrainingEnergy}{E_{\text{centralized}}} \newcommand{\CentroidalAngularMomentum}{\mathbf{h}_{\text{ang}}} \newcommand{\CentroidalAngularMomentumDerivative}{\dot{\mathbf{h}}_{\text{ang}}} \newcommand{\CentroidalLinearMomentum}{\mathbf{h}_{\text{lin}}} \newcommand{\CentroidalLinearMomentumDerivative}{\dot{\mathbf{h}}_{\text{lin}}} \newcommand{\CentroidalMomentum}{\mathbf{h}_G} \newcommand{\CentroidalMomentumMatrix}{\mathbf{A}_G} \newcommand{\CentroidalMomentumMatrixDerivative}{\dot{\mathbf{A}}_G} \newcommand{\CentroidalMomentumRate}{\dot{\mathbf{h}}_G} \newcommand{\CertifiedCommandWindow}{\mathbf{u}^*_{t:t+H-1}} \newcommand{\CertifiedControlAction}{\mathbf{u}^*} \newcommand{\CertifiedJointTorque}{u^*} \newcommand{\CertifiedRadius}{R} \newcommand{\ChainRuleInput}{x} \newcommand{\ChainRuleIntermediate}{u} \newcommand{\ChainRuleOutput}{v} \newcommand{\ChainedOperationCount}{n_{\text{ops}}} \newcommand{\ChanceAnnotatorAgreement}{p_e} \newcommand{\ChannelAuthorityState}{S} \newcommand{\ChannelCommand}{u} \newcommand{\ChannelStoredEnergy}{E_{\text{channel}}} \newcommand{\CharacteristicPolynomial}{p} \newcommand{\CharacteristicPolynomialCoefficient}{c} \newcommand{\ChassisThermalResistance}{R_{\text{th,chassis}}} \newcommand{\CheapConfigurationAttemptCost}{c_{\text{small}}} \newcommand{\CheapConfigurationPassProbability}{p_{\text{small}}} \newcommand{\CheckIntervalStepCount}{m} \newcommand{\CheckPassProbability}{p^{\text{chk}}} \newcommand{\CheckSlotTime}{T} \newcommand{\CheckWindowTurnCount}{w} \newcommand{\CheckedSignal}{x} \newcommand{\CheckedSignalLimit}{L_{\text{limit}}} \newcommand{\CheckpointAttemptDuration}{T_{\text{att}}} \newcommand{\CheckpointExtraPauseTime}{T_{\text{pause}}} \newcommand{\CheckpointInterval}{T_{\text{ckpt}}} \newcommand{\CheckpointLoadTime}{T_{\text{load}}} \newcommand{\CheckpointLogPosition}{j_{\text{ckpt}}} \newcommand{\CheckpointOrdinalIndex}{m} \newcommand{\CheckpointOverheadFraction}{f_{\text{ckpt}}} \newcommand{\CheckpointOverheadRatio}{w} \newcommand{\CheckpointRecoveryOverheadTime}{T_{\text{overhead}}} \newcommand{\CheckpointRestoreTime}{T_{\text{restore}}} \newcommand{\CheckpointStride}{k} \newcommand{\CheckpointSuffixReadTime}{T_{\text{read}}} \newcommand{\CheckpointWasteFraction}{W} \newcommand{\CheckpointWriteTime}{T_{\text{write}}} \newcommand{\ChildBatchSize}{n_{\text{batch}}} \newcommand{\ChildBudgetAllocation}{C_{\max,C}} \newcommand{\ChildCapabilityGrant}{\Gamma_{\text{child}}} \newcommand{\ChildFreeBalance}{F_{C}} \newcommand{\ChildPruningProbability}{p_{\text{prune}}} \newcommand{\ChildReservedFunds}{R_{C}} \newcommand{\ChildSettledCharges}{E_{C}} \newcommand{\ChinchillaIrreducibleLoss}{E} \newcommand{\ChirpDuration}{T_c} \newcommand{\ChirpSlope}{S} \newcommand{\ChopperClampVoltage}{V_{\text{clamp}}} \newcommand{\ChopperTurnOffVoltage}{V_{\text{clamp,off}}} \newcommand{\ChopperTurnOnVoltage}{V_{\text{clamp,on}}} \newcommand{\ChunkActionDimension}{d_{\text{chunk}}} \newcommand{\ChunkEnsemblingWeight}{w} \newcommand{\ChunkExecutionHorizon}{H_{\text{exec}}} \newcommand{\ChunkImitationLoss}{\mathcal{L}_{\text{chunk}}} \newcommand{\ChunkLease}{T_{\text{lease}}} \newcommand{\ChunkLeaseTime}{T_{\text{lease}}} \newcommand{\ChunkReactionLatency}{T_{\text{reaction}}} \newcommand{\ChunkRenewalPeriod}{T_{\text{chunk}}} \newcommand{\ChunkRenewalRate}{f_{\text{replan}}} \newcommand{\ChunkStepIndex}{i} \newcommand{\ClampedControlCommand}{\mathbf{u}_{\text{clip}}} \newcommand{\ClassCount}{K} \newcommand{\ClassIndex}{j} \newcommand{\ClassKFunction}{\kappa} \newcommand{\ClassKFunctionSet}{\mathcal{K}} \newcommand{\ClassProbabilityVector}{\mathbf{p}} \newcommand{\ClassificationThreshold}{\gamma_{\text{cls}}} \newcommand{\CleanLabelSampleCount}{D_{\text{clean}}} \newcommand{\CleanTrainingDataset}{\mathcal{S}} \newcommand{\CleanupGraphEdgeSet}{E} \newcommand{\CleanupGraphVertexSet}{V} \newcommand{\ClearDistance}{D_{\text{clear}}} \newcommand{\ClearanceAcceleration}{\ddot{D}_{\text{clear}}} \newcommand{\ClearanceAllowance}{C} \newcommand{\ClearanceExhaustionTime}{t_{\text{impact}}} \newcommand{\ClearanceInset}{C_{\text{inset}}} \newcommand{\ClearanceQueryTime}{t_{\text{query}}} \newcommand{\ClearanceRate}{\dot{D}_{\text{clear}}} \newcommand{\ClearanceSpeedClamp}{v_{\text{clamp}}} \newcommand{\ClearanceTimeBudget}{T_{\text{total}}} \newcommand{\ClfClassKFunction}{\alpha_V} \newcommand{\ClfDescentControlSet}{\mathcal{U}_{\text{CLF}}} \newcommand{\ClientGradientVector}{\mathbf{g}} \newcommand{\ClientIndex}{k} \newcommand{\ClientLocalDataset}{\mathcal{D}} \newcommand{\ClientLocalTrainingEnergy}{E_{\text{client}}} \newcommand{\ClientMaskVector}{\mathbf{r}} \newcommand{\ClientObjectiveWeight}{w} \newcommand{\ClientSampleCount}{n} \newcommand{\ClientUpdateUploadEnergy}{E_{\text{upload}}} \newcommand{\ClippedSurrogateObjective}{\mathcal{M}} \newcommand{\ClippingRangeLowerBound}{\alpha} \newcommand{\ClippingRangeUpperBound}{\beta} \newcommand{\ClockConversionBound}{\epsilon_{\text{sync}}} \newcommand{\ClockConversionIntercept}{b_{\text{clk}}} \newcommand{\ClockConversionSlope}{a} \newcommand{\ClockFrequency}{f} \newcommand{\ClockOffset}{\theta_{\text{offset}}} \newcommand{\ClockPeriod}{T_{\text{clk}}} \newcommand{\ClockSynchronizationSkew}{\delta_{\text{skew}}} \newcommand{\ClosedLoopTrajectoryDensity}{p_{\text{cl}}} \newcommand{\ClosingSpeedBound}{v_{\text{close}}} \newcommand{\CloudInferenceEnergy}{E_{\text{cloud}}} \newcommand{\CloudOffloadEnergy}{E_{\text{transmit}}} \newcommand{\CloudTrainingRunEnergy}{E_{\text{cloud,train}}} \newcommand{\ClusterAvailability}{A_{\text{cluster}}} \newcommand{\ClusterCount}{k} \newcommand{\ClusterHeadroom}{N} \newcommand{\ClusterNodeCount}{N_{\text{nodes}}} \newcommand{\ClusterPower}{P_{\text{cluster}}} \newcommand{\CoarseCellCount}{C} \newcommand{\CodecDecodeTime}{T_{\text{decode}}} \newcommand{\CodecEncodeTime}{T_{\text{encode}}} \newcommand{\CodecOverheadTime}{T_{\text{overhead}}} \newcommand{\CognitivePolicyAction}{\mathbf{a}} \newcommand{\CoherencyCoefficient}{\kappa_{\text{coh}}} \newcommand{\ColdCopperLossPower}{P_0} \newcommand{\ColdResetCycleTime}{T_{\text{cycle,cold}}} \newcommand{\CollaborativeContactForce}{F_{\text{contact}}} \newcommand{\CollectedPhotocharge}{Q} \newcommand{\CollectionCohortCost}{C_{\text{cohort}}} \newcommand{\CollectionStateVisitationDistribution}{p^{\pi_{\text{col}}}} \newcommand{\CollectiveCallStartupLatency}{\alpha_{\text{eff}}} \newcommand{\CollectiveInputTensor}{\mathbf{X}} \newcommand{\CollectivePayloadSize}{M} \newcommand{\CollectiveTensorSize}{M_{\text{coll}}} \newcommand{\CollisionHullCount}{N_{\text{hulls}}} \newcommand{\CollocationDefect}{\Delta} \newcommand{\ColumnAccessLatency}{t_{\text{CL}}} \newcommand{\ColumnModeComponentVector}{\mathbf{b}_s} \newcommand{\ColumnModeFactorMatrix}{\mathbf{B}} \newcommand{\ColumnModeFactorSlice}{\mathbf{b}} \newcommand{\ColumnParallelWeightMatrix}{\mathbf{A}} \newcommand{\CombinedBatch}{B_{\text{total}}} \newcommand{\CombinedPlanValidationAllowance}{t_{\text{validate}}} \newcommand{\CommandComponentCount}{N_c} \newcommand{\CommandRateCeiling}{r} \newcommand{\CommandTransportTime}{T_{\text{bus}}} \newcommand{\CommandedActuatorEffort}{u_{\text{cmd}}} \newcommand{\CommandedApproachAcceleration}{a_{\text{cmd}}} \newcommand{\CommandedJointConfiguration}{\mathbf{q}_{\text{cmd}}} \newcommand{\CommandedJointCount}{N_j} \newcommand{\CommandedJointTorque}{\tau} \newcommand{\CommandedJointTorqueSlew}{\dot{\tau}} \newcommand{\CommandedTrackedPosition}{r_{\text{cmd}}} \newcommand{\CommandedTractiveForce}{F_{\text{cmd}}} \newcommand{\CommitBatchRecordCount}{N_{\text{batch}}} \newcommand{\CommitmentInstant}{t_{\text{commit}}} \newcommand{\CommitmentPathPosition}{q_{c}} \newcommand{\CommonPositionShift}{\Delta} \newcommand{\CommunicationComputeRatio}{\rho} \newcommand{\CommunicationIntensity}{\text{CI}} \newcommand{\CommunicationSlowdownFactor}{r} \newcommand{\CommunicationTime}{T_{\text{comm}}} \newcommand{\CommunicationTimeFraction}{f} \newcommand{\CompactedContextLength}{S_{\text{comp}}} \newcommand{\CompactionBoundaryCount}{k} \newcommand{\CompactionBoundaryIndex}{i} \newcommand{\CompactionCycleTurnCount}{n_{\text{cycle}}} \newcommand{\CompactionCycleTurnIndex}{i} \newcommand{\CompactionLossProbability}{\rho} \newcommand{\CompactionPassCost}{C_{\text{comp}}} \newcommand{\CompactionPathCost}{C_{\text{compact}}} \newcommand{\CompactionPaybackCallCount}{N_{\min}} \newcommand{\CompactionPerCallSaving}{s} \newcommand{\CompactionTargetLength}{S_{\text{low}}} \newcommand{\CompactionTriggerLength}{S_{\text{high}}} \newcommand{\CompactionUpfrontCost}{U} \newcommand{\ComparedPeriodAccuracy}{a} \newcommand{\ComparisonArmTrialCount}{n_{\text{arm}}} \newcommand{\ComparisonContext}{c} \newcommand{\ComparisonSampleEmpiricalCdf}{G_{m}} \newcommand{\ComparisonSampleSize}{m} \newcommand{\ComparisonTrajectory}{z} \newcommand{\ComparisonTrajectoryDerivative}{\dot{z}} \newcommand{\CompensatedEnvironmentState}{\sigma_0'} \newcommand{\CompensationPostcondition}{\phi} \newcommand{\CompensationPostconditionSet}{\Phi} \newcommand{\CompetingKeyCount}{n} \newcommand{\CompetingKeyLogit}{z} \newcommand{\CompilationBreakevenCount}{N_{\text{breakeven}}} \newcommand{\CompilationTime}{T_{\text{compile}}} \newcommand{\CompiledExecutionTime}{T_{\text{compiled}}} \newcommand{\CompilerBackendCount}{N_{\text{backend}}} \newcommand{\CompilerFrontendCount}{M} \newcommand{\ComplementarityNormalForce}{\lambda_n} \newcommand{\CompletedRequestCount}{N} \newcommand{\CompletedRoundIndex}{r} \newcommand{\CompletionCriteria}{\mathcal{K}_{\text{comp}}} \newcommand{\CompletionDeadline}{T_{\text{deadline}}} \newcommand{\CompletionOffset}{c} \newcommand{\CompliantElementPreload}{F_{\text{preload}}} \newcommand{\CompliantElementStiffness}{k_{\text{spring}}} \newcommand{\ComponentAvailability}{A_{\text{component}}} \newcommand{\ComponentFailureRate}{\lambda} \newcommand{\ComponentHazardRate}{h} \newcommand{\ComponentMttf}{\text{MTTF}_{\text{component}}} \newcommand{\ComponentReliability}{R_{\text{single}}} \newcommand{\ComposedChainTransform}{\mathbf{T}_{AC}} \newcommand{\ComposedFunctionInput}{x} \newcommand{\ComposedFunctionOutput}{y} \newcommand{\ComposedMechanismCount}{k} \newcommand{\CompoundScalingCoefficient}{\phi} \newcommand{\CompressedCommunicationTime}{T_{\text{compressed}}} \newcommand{\CompressedGradientUpdate}{\mathbf{v}} \newcommand{\CompressedGradientUpdateElement}{v} \newcommand{\CompressedOnlyCorrectCount}{n_{\text{comp}}} \newcommand{\CompressionRatio}{r_{\text{comp}}} \newcommand{\ComputationalDimensionCount}{N_{\text{comp}}} \newcommand{\ComputationalGraph}{G} \newcommand{\ComputeBudgetConstraint}{g} \newcommand{\ComputeChipPower}{P_{\text{chip}}} \newcommand{\ComputeConstrainedLagrangian}{\mathcal{L}_{\text{Lagrange}}} \newcommand{\ComputeConstraintMultiplier}{\lambda} \newcommand{\ComputeDemandVolume}{Q} \newcommand{\ComputeLimitedSampleRate}{R_{\text{compute}}} \newcommand{\ComputeOptimalTokenCount}{D_{\text{opt}}} \newcommand{\ComputeUnitCost}{P} \newcommand{\ConcordantTaskCount}{n} \newcommand{\ConcurrentTrajectories}{N_{\text{traj}}} \newcommand{\ConditionalDamageProbability}{p} \newcommand{\ConditionalDistribution}{p(y \mid x)} \newcommand{\ConditionalFlowMap}{\psi} \newcommand{\ConditionalVelocityField}{v} \newcommand{\ConditioningTokenPrefix}{x} \newcommand{\ConductorCurrent}{I} \newcommand{\ConeLimitStepSize}{\tau} \newcommand{\ConfidenceCalibrationDataset}{\mathcal{D}_{\text{cal}}} \newcommand{\ConfidenceCriticalQuantile}{z_{\alpha/2}} \newcommand{\ConfidenceLevel}{C} \newcommand{\ConfidentialityLabel}{\kappa} \newcommand{\ConfigurationSpace}{\mathcal{C}} \newcommand{\ConfirmationHitCount}{M} \newcommand{\ConfirmationWindowCount}{N_{\text{conf}}} \newcommand{\ConfluentVandermondeMatrix}{\mathbf{M}} \newcommand{\ConformalMiscoverageRate}{\epsilon} \newcommand{\ConformalPredictionSet}{\mathcal{C}} \newcommand{\ConformalQuantileRank}{k_{\epsilon}} \newcommand{\ConformalScoreQuantile}{\widehat{q}_{1-\epsilon}} \newcommand{\ConservativePenaltyWeight}{\alpha_{\text{CQL}}} \newcommand{\ConservativeSamplingDistribution}{\mu} \newcommand{\ConsoleCommunicationTime}{T_{\text{comm}}} \newcommand{\ConsolidationOverheadTime}{T_{\text{overhead}}} \newcommand{\ConsolidationStride}{c} \newcommand{\ConstantDivisorGrpoObjective}{\widehat{\mathcal{J}}_{\text{const}}} \newcommand{\ConstantHazardRate}{\lambda} \newcommand{\ConstrainedCallLatency}{T_{\text{constrained}}} \newcommand{\ConstrainedDecodingAutomaton}{\mathcal{D}} \newcommand{\ConstrainedParameterVector}{\mathbf{w}} \newcommand{\ConstrainedTestEnvelope}{\mathcal{S}} \newcommand{\ConstraintLagrangeMultiplier}{\lambda} \newcommand{\ConstraintRetentionFraction}{\eta_{\mathcal{C}}} \newcommand{\ContactApproachSpeed}{v_{\text{approach}}} \newcommand{\ContactCount}{N_c} \newcommand{\ContactDeformationDuration}{\Delta t_{\text{def}}} \newcommand{\ContactDirectionSpeed}{v_c} \newcommand{\ContactDirectionVelocity}{\dot{x}} \newcommand{\ContactDriftAcceleration}{a_{\text{drift}}} \newcommand{\ContactForce}{F_{\text{contact}}} \newcommand{\ContactForceBarrierFunction}{h_{\text{force}}} \newcommand{\ContactForceCap}{F_{\text{cap}}} \newcommand{\ContactForceCeiling}{F_{\max}} \newcommand{\ContactForceLimit}{F_{\text{limit}}} \newcommand{\ContactForceMagnitude}{F} \newcommand{\ContactForceRegularizationWeight}{w_f} \newcommand{\ContactForceRiseTime}{t_{\text{rise}}} \newcommand{\ContactGapAcceleration}{\ddot{\phi}} \newcommand{\ContactGapFunction}{\phi} \newcommand{\ContactGapVelocity}{\dot{\phi}} \newcommand{\ContactImpulse}{I} \newcommand{\ContactJacobianBaseBlock}{\mathbf{J}_{k,b}} \newcommand{\ContactJacobianJointBlock}{\mathbf{J}_{k,j}} \newcommand{\ContactLoopResponseTime}{T_c} \newcommand{\ContactNaturalTimescale}{T_{\text{contact}}} \newcommand{\ContactNormal}{\hat{\mathbf{n}}} \newcommand{\ContactNormalDeflection}{x} \newcommand{\ContactNormalJacobian}{\mathbf{J}_n} \newcommand{\ContactNormalJacobianDerivative}{\dot{\mathbf{J}}_n} \newcommand{\ContactNormalPosition}{x} \newcommand{\ContactNormalVelocity}{v_n} \newcommand{\ContactPatchRegion}{\mathcal{A}} \newcommand{\ContactPointForce}{\mathbf{f}} \newcommand{\ContactPointIndex}{i} \newcommand{\ContactPointJacobian}{\mathbf{J}_{\text{c}}} \newcommand{\ContactPointJacobianDerivative}{\dot{\mathbf{J}}_{\text{c}}} \newcommand{\ContactPointOffset}{\mathbf{r}} \newcommand{\ContactPointPosition}{x} \newcommand{\ContactPointTorque}{\boldsymbol{\tau}} \newcommand{\ContactReactionForce}{F} \newcommand{\ContactResponseLatency}{t_{\text{resp}}} \newcommand{\ContactStiffness}{k_{\text{contact}}} \newcommand{\ContactTorqueCeiling}{\tau_{\max}} \newcommand{\ContactTripwireForce}{F_{\text{trip}}} \newcommand{\ContactWrench}{\mathbf{w}} \newcommand{\ContactWrenchCeiling}{\mathbf{w}_{\max}} \newcommand{\ContactWrenchEnvelope}{\mathbf{w}_{\text{contact}}} \newcommand{\ContactWrenchTransform}{\mathbf{X}_k^*} \newcommand{\ContactYieldDeadline}{t_{\text{yield}}} \newcommand{\ContainerInnerRadius}{R} \newcommand{\ContainmentForceCeiling}{F_{\max}} \newcommand{\ContendingApplicationCount}{N} \newcommand{\ContentionCoefficient}{\sigma_{\text{cont}}} \newcommand{\ContextChunkTokenCount}{n} \newcommand{\ContextHiddenRepresentation}{\mathbf{h}_{\text{context}}} \newcommand{\ContextParallelDegree}{c} \newcommand{\ContextParallelRankIndex}{i} \newcommand{\ContextSaveTime}{t_{\text{context\_save}}} \newcommand{\ContextWindow}{S_{\max}} \newcommand{\ContinuationCount}{K} \newcommand{\ContinuationIndex}{i} \newcommand{\ContinuationReturnStandardDeviation}{\sigma} \newcommand{\ContinuityCorrectedCrossProduct}{A} \newcommand{\ContinuousActionComponent}{a} \newcommand{\ContinuousActionSpace}{\mathcal{A}} \newcommand{\ContinuousActionVector}{\mathbf{a}} \newcommand{\ContinuousCurrent}{I_{\text{cont}}} \newcommand{\ContinuousFactorialFunction}{\Gamma} \newcommand{\ContinuousMeasurementNoiseIntensity}{\mathbf{R}_{\text{cont}}} \newcommand{\ContinuousMotionModel}{\mathbf{f}} \newcommand{\ContinuousOutcome}{\mathbf{x}} \newcommand{\ContinuousRandomVariable}{\mathbf{X}} \newcommand{\ContinuousStateTransitionMatrix}{\boldsymbol{\Phi}} \newcommand{\ContinuousTorque}{\tau_{\text{cont}}} \newcommand{\ContractedBarrierFunction}{h_{\text{contracted}}} \newcommand{\ControlAffineDriftField}{\mathbf{f}} \newcommand{\ControlAffineInputField}{\mathbf{g}} \newcommand{\ControlCommand}{\mathbf{u}} \newcommand{\ControlCommandDerivative}{\dot{\mathbf{u}}} \newcommand{\ControlCommandSpace}{\mathcal{U}} \newcommand{\ControlConversionRate}{\hat{p}_A} \newcommand{\ControlCycleIndex}{i} \newcommand{\ControlInput}{\mathbf{u}} \newcommand{\ControlInputDimension}{m} \newcommand{\ControlInputLowerLimit}{\mathbf{u}_{\min}} \newcommand{\ControlInputSet}{\mathcal{U}} \newcommand{\ControlInputUpperLimit}{\mathbf{u}_{\max}} \newcommand{\ControlInputWindow}{\mathbf{u}_{[t, t+\Delta t]}} \newcommand{\ControlSampleIndex}{k} \newcommand{\ControlSampleSize}{m_A} \newcommand{\ControlSetpointJerk}{\mathbf{j}} \newcommand{\ControlSetpointPeriod}{\Delta t_{\text{ctrl}}} \newcommand{\ControlStepIndex}{t} \newcommand{\ControlTaskIndex}{i} \newcommand{\ControllabilityMatrix}{\mathbf{C}_{\text{ctrb}}} \newcommand{\ControlledStopCommand}{\mathbf{u}_{\text{stop}}} \newcommand{\ControllerReactionDelay}{T_{\text{react}}} \newcommand{\ConversationTurnIndex}{i} \newcommand{\ConverterLockoutVoltage}{V_{\text{uvlo}}} \newcommand{\ConveyorSpeed}{v_{\text{conv}}} \newcommand{\ConveyorSpeedBound}{v_{\text{conv}}} \newcommand{\ConvolutionActivation}{H} \newcommand{\ConvolutionTimeInstant}{t'} \newcommand{\CookedTokenKeyVector}{\mathbf{k}_{\text{cooked}}} \newcommand{\CookedTokenQueryVector}{\mathbf{q}_{\text{cooked}}} \newcommand{\CoolantHeatLoad}{P_{\text{thermal}}} \newcommand{\CoolantMassFlowRate}{\dot{m}} \newcommand{\CoolantTemperature}{T} \newcommand{\CoolingEnergy}{E_{\text{cooling}}} \newcommand{\CoordinateFrameEmbedding}{\mathbf{e}_{\text{frame}}} \newcommand{\CoordinationLatency}{L_{\text{lat,coordination}}} \newcommand{\CoordinationOverhead}{h} \newcommand{\CopperIronThermalResistance}{R_{\text{th,cu-iron}}} \newcommand{\CopperReferenceTemperature}{T_0} \newcommand{\CopperTemperatureCoefficient}{\alpha_{\text{Cu}}} \newcommand{\CopperThermalCapacitance}{C_{\text{cu}}} \newcommand{\CopperThermalTimeConstant}{\tau_{\text{th,cu}}} \newcommand{\CoreAmbientThermalResistance}{R_{\text{th,ca}}} \newcommand{\CoreRailVoltageDroop}{\Delta V_{\text{droop}}} \newcommand{\CoreThermalCapacitance}{C_{\text{core}}} \newcommand{\CoresetBudget}{K} \newcommand{\CoriolisCentrifugalMatrix}{\mathbf{C}} \newcommand{\CorrectCandidateTrialPassProbability}{p_{g}} \newcommand{\CorrectClassIndex}{c} \newcommand{\CorrectClassLogit}{z_{c}} \newcommand{\CorrectClassProbability}{\hat{y}_{c}} \newcommand{\CorrectnessReward}{R_{\text{corr}}} \newcommand{\CorrelationCoefficient}{\rho} \newcommand{\CorruptedAttentionScoreMatrix}{\mathbf{S}_{\text{corrupt}}} \newcommand{\CorruptedModelWeight}{w'} \newcommand{\CostAnomalyScore}{Z} \newcommand{\CostBudgetUsedFraction}{\rho_C} \newcommand{\CostCeiling}{C_{\max}} \newcommand{\CostPerAcceptedTask}{C_{\text{eff}}} \newcommand{\CostPerEmittedArtifact}{C_{\text{emit}}} \newcommand{\CostToGo}{C} \newcommand{\CoulombFrictionCoefficient}{\mu} \newcommand{\CoulombFrictionForce}{F_{\text{friction}}} \newcommand{\CountedFailureIndicator}{e} \newcommand{\CovariateDriftBound}{\mathcal{O}(S^2 \epsilon)} \newcommand{\CoverageFactor}{k} \newcommand{\CpuEnergy}{E_{\text{CPU}}} \newcommand{\CredibleBrakingDeceleration}{a_{\text{brake}}} \newcommand{\CreditWindowCapacity}{N_{\text{win}}} \newcommand{\CriticActionReturnEstimate}{Q_{\phi}} \newcommand{\CriticApproximationError}{\epsilon} \newcommand{\CriticModel}{M_{\text{value}}} \newcommand{\CriticParameters}{\phi} \newcommand{\CriticReturnEstimate}{V_{\phi}} \newcommand{\CriticalBatchSize}{B^{*}} \newcommand{\CriticalConstraint}{c} \newcommand{\CriticalPathDuration}{T_{\text{crit}}} \newcommand{\CriticalSectionIndex}{s} \newcommand{\CriticalSectionWcet}{C^{\text{cs}}} \newcommand{\CriticalTrackingErrorBound}{\epsilon_{\text{crit}}} \newcommand{\CriticalTransitDistance}{d_{\text{crit}}} \newcommand{\CrossEntropyLevelThreshold}{\gamma} \newcommand{\CrossEntropyLoss}{\mathcal{L}_{\text{CE}}} \newcommand{\CrossoverFrequency}{\omega_c} \newcommand{\CruiseSpeed}{v_{c}} \newcommand{\CumulativeArrivals}{A} \newcommand{\CumulativeCompletions}{C} \newcommand{\CumulativeIncidentCount}{N} \newcommand{\CumulativeLogLikelihoodRatio}{\Lambda} \newcommand{\CumulativeScheduleStepIndex}{s} \newcommand{\CumulativeTransmittance}{T} \newcommand{\CumulativeWorkCost}{C} \newcommand{\CurrentBinProportion}{A} \newcommand{\CurrentDistribution}{P_t} \newcommand{\CurrentFeatureMean}{\mu_{\text{curr}}} \newcommand{\CurrentFeatureStandardDeviation}{\sigma_{\text{curr}}} \newcommand{\CurrentLayerWidth}{n_{\ell}} \newcommand{\CurrentModelParameters}{\theta_{\text{old}}} \newcommand{\CurrentMonotonicTime}{t_{\text{now,mono}}} \newcommand{\CurrentNodeIndex}{j} \newcommand{\CurrentPeriodCost}{C_{\text{current}}} \newcommand{\CurrentStateDigest}{h_{\text{state},t}} \newcommand{\CurrentStateEstimate}{\hat{\mathbf{x}}_{t_{\text{current}}}} \newcommand{\CurrentTime}{t_{\text{now}}} \newcommand{\CurrentWallClockTime}{t_{\text{current}}} \newcommand{\CutCrossingDataVolume}{V_{\text{cut}}} \newcommand{\CvaeEncoderParameters}{\phi} \newcommand{\CvaeRecognitionEncoder}{q_\phi} \newcommand{\CycleAveragePowerCeiling}{\bar{P}_{\max}} \newcommand{\CycleGuardTime}{t_{\text{guard}}} \newcommand{\CylinderForce}{F_{\text{cyl}}} \newcommand{\DailyAccountQueryCount}{q_{\text{daily}}} \newcommand{\DailyQueryVolume}{Q_{\text{day}}} \newcommand{\DamageEventCount}{N_{\text{damage}}} \newcommand{\DamageProbabilityTolerance}{\epsilon} \newcommand{\DamageProbabilityUpperBound}{p_U} \newcommand{\DamagingOutcomeIndicator}{Y} \newcommand{\DampedLeastSquaresPseudoinverse}{\mathbf{J}_{\lambda}^\dagger} \newcommand{\DampedStepConfiguration}{\mathbf{q}_\lambda} \newcommand{\DampingRatio}{\zeta} \newcommand{\DataAcquisitionCost}{C_{\text{acquire}}} \newcommand{\DataDebtGrowthRate}{r} \newcommand{\DataEgressCost}{C_{\text{egress}}} \newcommand{\DataFieldBitCount}{B_{\text{data},i}} \newcommand{\DataInformationContent}{\mathcal{I}} \newcommand{\DataLabelingCost}{C_{\text{label}}} \newcommand{\DataLoaderWorkerCount}{W} \newcommand{\DataMovementEnergyFraction}{q} \newcommand{\DataParallelDegree}{N_{\text{DP}}} \newcommand{\DataPhaseBitRate}{R_{\text{data}}} \newcommand{\DataPipelineProcessingCost}{C_{\text{process}}} \newcommand{\DataProcessingCost}{C_{\text{process}}} \newcommand{\DataScaleCoefficient}{B} \newcommand{\DataScalingExponent}{\beta} \newcommand{\DataScalingLossFactor}{D^{-\beta}} \newcommand{\DataStallFraction}{f_{\text{stall}}} \newcommand{\DataStorageCost}{C_{\text{store}}} \newcommand{\DataSupplyRate}{R_{\text{data}}} \newcommand{\DataTaxonomyAxis}{\mathsf{Data}} \newcommand{\DataVolume}{D_{\text{vol}}} \newcommand{\DatasetQuery}{f} \newcommand{\DatasetQueryResult}{v} \newcommand{\DatasetShardCount}{K_{\text{shards}}} \newcommand{\DatasetSize}{D} \newcommand{\DatasetTransferTime}{T} \newcommand{\DcBusBulkCapacitance}{C_{\text{bus}}} \newcommand{\DcBusOvervoltageThreshold}{V_{\text{max\_safe}}} \newcommand{\DcBusVoltage}{V_{\text{bus}}} \newcommand{\DcRailVoltage}{V_{\text{rail}}} \newcommand{\DeadTimeCycleCount}{N_{\text{dtg}}} \newcommand{\DeadTimeDqVoltageError}{\Delta V_{d,q}} \newcommand{\DeadTimeSafetyMargin}{t_{\text{margin}}} \newcommand{\DeadTimeTickPeriod}{T_{\text{dtg}}} \newcommand{\DeadTimeVoltageError}{\Delta V_{\text{phase}}} \newcommand{\DeadlineInstant}{t_{\text{deadline}}} \newcommand{\DebiasingTotalLoss}{\mathcal{L}_{\text{total}}} \newcommand{\DebounceFrameCount}{N} \newcommand{\DecisionProcessState}{s} \newcommand{\DecisionScore}{s_{\text{dec}}} \newcommand{\DecisionStepIndex}{k} \newcommand{\DecodeArithmeticIntensity}{I_{\text{decode}}} \newcommand{\DecodeBatchSize}{B_{\text{dec}}} \newcommand{\DecodeInterval}{T_{\text{decode}}} \newcommand{\DecodeRequestSet}{\mathcal{D}} \newcommand{\DecodeTokenTimeFloor}{T_{\text{token}}} \newcommand{\DecoderEvaluationCount}{N_{\text{eval}}} \newcommand{\DecoderPassTime}{t_{\text{pass}}} \newcommand{\DecodingConstraintState}{q} \newcommand{\DecomposedTensor}{\mathcal{Y}} \newcommand{\DecomposedTensorEntry}{y_{ijt}} \newcommand{\DecouplingCapacitance}{C} \newcommand{\DecouplingDriftVector}{\mathbf{b}} \newcommand{\DecouplingMatrix}{\mathbf{E}} \newcommand{\DecouplingMatrixElement}{E} \newcommand{\DedicatedHourlyFixedCost}{C_{\text{fixed}}} \newcommand{\DedicatedVariableTokenCost}{c_{\text{ded}}} \newcommand{\DefectiveActionProbability}{p_{\text{bad}}} \newcommand{\DefinitionSerializedSize}{S} \newcommand{\DeflectionComplianceAllowance}{\delta_{\text{deflect}}} \newcommand{\DegradedFrictionCoefficient}{\mu_{\text{fault}}} \newcommand{\DegradedStepTime}{T_{\text{slow}}} \newcommand{\DelassusOperator}{\mathbf{A}_{\text{Delassus}}} \newcommand{\DelayPhaseLag}{\Delta \phi} \newcommand{\DelayTravelDistance}{d_{\text{delay}}} \newcommand{\DelayWindowIntegrationTime}{\sigma} \newcommand{\DelayedObservation}{\mathbf{y}_{t_0}} \newcommand{\DelegatedAllocationAmount}{b} \newcommand{\DelegationTokenMultiple}{r} \newcommand{\DeliveredActuatorTorque}{\tau_{\text{act}}} \newcommand{\DeliveredCapacityFraction}{u} \newcommand{\DemandCap}{x_{\max}} \newcommand{\DemandPriceElasticity}{\epsilon_{\text{elast}}} \newcommand{\DemandThreshold}{x} \newcommand{\DemonstratedTargetA}{\mathbf{y}_A} \newcommand{\DemonstratedTargetB}{\mathbf{y}_B} \newcommand{\DemonstrationActionDistribution}{p} \newcommand{\DemonstrationActionLabel}{\mathbf{a}} \newcommand{\DemonstrationArchiveActionDistribution}{p_{\text{demo}}} \newcommand{\DemonstrationChunkDistribution}{p_{\text{data}}} \newcommand{\DemonstrationDataset}{\mathcal{D}_{\text{demo}}} \newcommand{\DemonstrationRetentionRate}{R} \newcommand{\DemonstratorAction}{\mathbf{a}^{*}} \newcommand{\DemonstratorActionComponent}{a} \newcommand{\DenseEvaluationEnergy}{E_{\text{eval}}} \newcommand{\DenseEvaluationRate}{f_{\text{eval}}} \newcommand{\DenseVoxelGridMemory}{M_{\text{dense}}} \newcommand{\DepartmentQuotaLimit}{Q_{\text{department}}} \newcommand{\DependencyGraphEdgeSet}{E} \newcommand{\DependencyGraphVertex}{v} \newcommand{\DependencyGraphVertexSet}{V} \newcommand{\DepletedBusVoltage}{V_{\text{low}}} \newcommand{\DeploymentAge}{t} \newcommand{\DeploymentDistribution}{p_{\text{deploy}}} \newcommand{\DeploymentDuration}{T_{\text{deployment}}} \newcommand{\DepthBinCount}{D} \newcommand{\DepthBinDistribution}{\boldsymbol{\alpha}_{u, v}} \newcommand{\DepthBinIndex}{k} \newcommand{\DepthBinLogits}{\mathbf{d}_{u, v}} \newcommand{\DepthBinProbability}{\alpha_{u, v}} \newcommand{\DepthCalibrationScale}{s} \newcommand{\DepthCalibrationShift}{t} \newcommand{\DepthCriticalPathLatency}{T^{\text{depth}}} \newcommand{\DepthFrameRate}{f_{\text{cam}}} \newcommand{\DepthHypothesis}{d} \newcommand{\DepthModeComponentVector}{\mathbf{c}_s} \newcommand{\DepthModeFactorMatrix}{\mathbf{C}} \newcommand{\DepthModeFactorSlice}{\mathbf{c}} \newcommand{\DepthRayCount}{N_{\text{rays}}} \newcommand{\DepthScalingRatio}{\alpha} \newcommand{\DepthStandardDeviation}{\sigma_z} \newcommand{\DerivativeControlEffort}{\mathbf{u}_{d}} \newcommand{\DerivativeFilterTimeConstant}{T_{f}} \newcommand{\DerivativeGainMatrix}{\mathbf{K}_{d}} \newcommand{\DerivativeOperator}{d} \newcommand{\DerivativeSplineControlPoint}{\mathbf{v}} \newcommand{\DerivedMemoryEntry}{c} \newcommand{\DerivedRecord}{y} \newcommand{\DesignLatencyQuantile}{Q_{1-\epsilon}} \newcommand{\DesiredContactPosition}{x_{\text{des}}} \newcommand{\DesiredContactVelocity}{\dot{x}_{\text{des}}} \newcommand{\DesiredTaskAcceleration}{\ddot{\mathbf{x}}_d} \newcommand{\DesiredTaskPosition}{\mathbf{x}_d} \newcommand{\DesiredTaskSpaceAcceleration}{\ddot{\mathbf{x}}^{\text{des}}} \newcommand{\DesiredTaskVelocity}{\dot{\mathbf{x}}_d} \newcommand{\DestinationRankIndex}{j} \newcommand{\DetectionCount}{n_{\text{det}}} \newcommand{\DetectionInterval}{t_{\text{detect}}} \newcommand{\DetectionMeasurementNoiseCovariance}{\boldsymbol{\Sigma}_{\text{meas},j}} \newcommand{\DetectionRangeShortfall}{\Delta d_{\text{detect}}} \newcommand{\DetectionTimestamp}{t_{\text{det}}} \newcommand{\DetectorMissProbability}{p_{\text{miss}}} \newcommand{\DeterministicPolicy}{\mu_{\theta}} \newcommand{\DevelopmentIterationCount}{N_{\text{dev}}} \newcommand{\DeviationDisadvantage}{u} \newcommand{\DeviceCount}{N} \newcommand{\DeviceEnergy}{E_{\text{device}}} \newcommand{\DeviceHardwareTime}{T_{\text{hw}}} \newcommand{\DeviceMemoryCapacity}{M_{\text{device}}} \newcommand{\DevicePower}{P_{\text{device}}} \newcommand{\DeviceRequestCapacity}{Q_{\text{req,max}}} \newcommand{\DeviceSilentCorruptionProbability}{p} \newcommand{\DiagnosticCoverage}{C_{\text{diag}}} \newcommand{\DictionaryCoefficientMatrix}{\mathbf{C}} \newcommand{\DifferentiabilityClass}{C} \newcommand{\DifferentialEntropy}{h} \newcommand{\DiffusionCumulativeSchedule}{\bar{\alpha}} \newcommand{\DiffusionGaussianNoise}{\boldsymbol{\epsilon}} \newcommand{\DiffusionMatchingLoss}{\mathcal{L}_{\text{diff}}} \newcommand{\DiffusionNoiseVariance}{\beta} \newcommand{\DiffusionStepCount}{N} \newcommand{\DiffusionStepIndex}{k} \newcommand{\DiffusionStepRetention}{\alpha} \newcommand{\DiffusionTimeCoordinate}{t_{\text{diff}}} \newcommand{\DirectAxisCurrent}{i_d} \newcommand{\DirectAxisInductance}{L_d} \newcommand{\DirectAxisVoltage}{v_d} \newcommand{\DirectionalCosineMatrix}{\mathbf{R}} \newcommand{\DirectionalDerivativeStep}{\epsilon} \newcommand{\DisadvantagedGroupClassificationThreshold}{\gamma_{\text{cls},g=\text{B}}} \newcommand{\DiscordantPairCount}{n_{\text{disc}}} \newcommand{\DiscordantPairFraction}{\psi} \newcommand{\DiscountFactor}{\gamma} \newcommand{\DiscountedReturn}{G} \newcommand{\DiscountedReturnStepOffset}{j} \newcommand{\DiscountedStateVisitationDistribution}{d} \newcommand{\DiscreteLqrFeedbackGain}{\mathbf{K}_{\text{lqr},d}} \newcommand{\DiscreteLqrQuadraticObjective}{J_d} \newcommand{\DiscreteOutcome}{x} \newcommand{\DiscretePlantDynamics}{f} \newcommand{\DiscreteRandomVariable}{X} \newcommand{\DiscreteSampleIndex}{k} \newcommand{\DiscreteStateSpaceInputMatrix}{\mathbf{B}_{d}} \newcommand{\DiscreteStateSpaceSystemMatrix}{\mathbf{A}_{d}} \newcommand{\DiscretizationBinCount}{n_{\text{bin}}} \newcommand{\DisengagedTakeoverResponseTime}{T_{\Sigma,2}} \newcommand{\DiskBandwidth}{\text{BW}_{\text{disk}}} \newcommand{\DisparityStandardDeviation}{\sigma_d} \newcommand{\DispatchAdmissionCeiling}{\Delta_{\text{da,max}}} \newcommand{\DispatchAdmissionInterval}{\Delta_{\text{da}}} \newcommand{\DispatchObservationAge}{t_{\text{age}}} \newcommand{\DispatchedOperationCount}{N_{\text{ops}}} \newcommand{\DisplayPipelineLatency}{t_{\text{disp}}} \newcommand{\DispreferredReferenceRelativeScore}{\Delta_l} \newcommand{\DispreferredTrajectory}{\tau_l} \newcommand{\DistanceEstimateStandardDeviation}{\sigma} \newcommand{\DistanceMeasurement}{z} \newcommand{\DistanceNormOrder}{p} \newcommand{\DistanceQueryPoint}{\mathbf{y}} \newcommand{\DistillationClassProbability}{p^{(T_{\text{distill}})}} \newcommand{\DistillationLoss}{\mathcal{L}_{\text{distill}}} \newcommand{\DistillationLossWeight}{\gamma_{\text{KD}}} \newcommand{\DistillationTemperature}{T_{\text{distill}}} \newcommand{\DistortedImageAbscissa}{x_d} \newcommand{\DistortedImageOrdinate}{y_d} \newcommand{\DistributedStepTime}{T_{\text{step}}} \newcommand{\DisturbanceAccelerationBound}{a_{\text{dist}}} \newcommand{\DisturbanceBasisCoefficient}{\psi} \newcommand{\DisturbanceBasisCount}{K} \newcommand{\DisturbanceBasisFunction}{B} \newcommand{\DisturbanceBudget}{\Delta_{w}} \newcommand{\DisturbanceDimension}{p} \newcommand{\DisturbanceForceBound}{d_{\max}} \newcommand{\DisturbanceParameterSet}{\Psi} \newcommand{\DisturbanceParameterVector}{\boldsymbol{\psi}} \newcommand{\DisturbanceTrajectory}{w_{\text{dist}}} \newcommand{\DivergenceInstant}{t_{\text{div}}} \newcommand{\DivergenceMeasure}{\mathcal{D}} \newcommand{\DivergenceTolerance}{\delta_{\text{tol}}} \newcommand{\DmaBurstPeriod}{T_{\text{dma}}} \newcommand{\DmaBurstStallTime}{C_{\text{dma}}} \newcommand{\DmaQueueTime}{t_{\text{DMA}}} \newcommand{\DocumentPayloadFraction}{q} \newcommand{\DomainRandomizationDistribution}{\mathcal{D}_{\text{DR}}} \newcommand{\DomainRandomizationObjective}{J_{\text{DR}}} \newcommand{\DominantComponentEnergy}{E_{\text{dominant}}} \newcommand{\DominantShare}{d} \newcommand{\DoorOpenReward}{r_{\text{open}}} \newcommand{\DoubleIntegratorPosition}{p} \newcommand{\DoubleIntegratorPositionDerivative}{\dot{p}} \newcommand{\DoubleIntegratorVelocity}{v} \newcommand{\DoubleIntegratorVelocityDerivative}{\dot{v}} \newcommand{\DoubleTreeAllReduceTime}{T_{\text{double-tree}}} \newcommand{\DownstreamStageLatency}{Y} \newcommand{\DpoLoss}{\mathcal{L}_{\text{DPO}}} \newcommand{\DraftAcceptanceRate}{\alpha} \newcommand{\DraftCandidateToken}{\tilde{x}} \newcommand{\DraftModelDistribution}{q_{\phi}} \newcommand{\DraftPositionAcceptanceProbability}{\alpha_{\text{spec}, j}} \newcommand{\DraftPositionIndex}{i} \newcommand{\DraftSamplingDistribution}{q} \newcommand{\DraftTokenAcceptanceProbability}{\alpha_{\text{acc}}} \newcommand{\DraftTokenCostRatio}{\beta} \newcommand{\DraftTokenCount}{\gamma} \newcommand{\DraftedToken}{T} \newcommand{\DragonflyGlobalChannelCount}{h} \newcommand{\DragonflyGroupRouterCount}{a} \newcommand{\DragonflyTerminalPortCount}{p} \newcommand{\DrainSourceVoltage}{V_{\text{ds}}} \newcommand{\DriftElapsedTime}{t_{\text{drift}}} \newcommand{\DriftImpactTime}{t_{\text{impact}}} \newcommand{\DriftLieDerivativeOperator}{L_{\mathbf{f}}} \newcommand{\DriftSpeedBound}{v_{\text{drift}}} \newcommand{\DriftTestSampleSize}{n} \newcommand{\DriftVelocityBound}{v_{\text{drift}}} \newcommand{\DriveBrakingForceCeiling}{F} \newcommand{\DriveBrakingTorqueCeiling}{\tau} \newcommand{\DrivenWheelLoadFraction}{\phi_{\text{drive}}} \newcommand{\DriverInterruptLatency}{t_{\text{driver\_irq}}} \newcommand{\DrivetrainAntiresonanceFrequency}{f_{\text{anti}}} \newcommand{\DrivetrainResonanceFrequency}{f_{\text{res}}} \newcommand{\DroopedSupplyVoltage}{V_{\text{droop}}} \newcommand{\DropletDiameter}{d_{\text{droplet}}} \newcommand{\DropoutProbability}{p_{\text{drop}}} \newcommand{\DualNumberInfinitesimal}{\epsilon} \newcommand{\DuplicateEffectProbability}{p_{\text{dup}}} \newcommand{\DurableAcknowledgmentTime}{t_{\text{ack}}} \newcommand{\DurableStoreWriteBandwidth}{\text{BW}_{\text{store}}} \newcommand{\DutyCyclePeriod}{T_{\text{period}}} \newcommand{\DynamicPower}{P_{\text{dynamic}}} \newcommand{\DynamicReachableSet}{\mathcal{R}} \newcommand{\DynamicsRealityGap}{\Delta_{\text{dyn}}} \newcommand{\EagerExecutionTime}{T_{\text{eager}}} \newcommand{\EarlierBaseFlangeTransform}{\mathbf{T}_{\text{base}, k}^{\text{flange}}} \newcommand{\EarlierCameraTargetTransform}{\mathbf{T}_{\text{cam}, k}^{\text{target}}} \newcommand{\EarlierControlStepIndex}{t'} \newcommand{\EarlierWorkerCount}{k} \newcommand{\EarliestConflictTime}{t_{\text{conflict}}} \newcommand{\EarthReferenceFrame}{\mathcal{F}_{\text{earth}}} \newcommand{\EchoFactor}{e} \newcommand{\EchoRoundTripTime}{t_{\text{rt}}} \newcommand{\EditGrantRights}{\mathcal{R}_{\Gamma_{\text{edit}}}} \newcommand{\EditPhaseCapabilityGrant}{\Gamma_{\text{edit}}} \newcommand{\EffectiveAdmissionCeiling}{Q_{\text{effective}}} \newcommand{\EffectiveApiOutputTokenPrice}{c_{\text{API}}} \newcommand{\EffectiveBrakingDelay}{T_{\text{eff}}} \newcommand{\EffectiveBranchingFactor}{b_{\text{eff}}} \newcommand{\EffectiveConfidentialityLabel}{\kappa_{\text{eff}}} \newcommand{\EffectiveFleetThroughput}{R_{\text{eff}}} \newcommand{\EffectiveImpactMass}{m_{\text{eff}}} \newcommand{\EffectiveIntegrityProvenance}{\iota_{\text{eff}}} \newcommand{\EffectiveJointInertia}{J_{\text{eff}}} \newcommand{\EffectiveLossResistance}{R_{\text{eff}}} \newcommand{\EffectiveSampleSize}{N_{\text{eff}}} \newcommand{\EffectiveSeriesStiffness}{k_{\text{eff}}} \newcommand{\EffectiveServiceRate}{\mu_{\text{eff}}} \newcommand{\EffectiveSpotTrainingCost}{C_{\text{effective}}} \newcommand{\EffectiveStorageThroughput}{R_{\text{storage,eff}}} \newcommand{\EffectiveWasteFraction}{W_{\text{effective}}} \newcommand{\EfficiencyHw}{\eta_{\text{hw}}} \newcommand{\EgressArrivalRate}{\lambda_{\text{arr}}} \newcommand{\EgressBufferCapacity}{Q_{\text{max}}} \newcommand{\EgressPortUtilization}{\rho_{\text{egress}}} \newcommand{\EgressPrice}{R_{\text{egress/GB}}} \newcommand{\EgressQueueOccupancy}{Q} \newcommand{\EgressServiceRate}{\mu} \newcommand{\ElapsedPlanningPeriods}{n} \newcommand{\ElasticJointTorque}{\mathbf{z}} \newcommand{\ElasticMaximumWorkerCount}{N_{\text{max}}} \newcommand{\ElasticMinimumWorkerCount}{N_{\text{min}}} \newcommand{\ElasticModalFrequencyMatrix}{\boldsymbol{\Omega}} \newcommand{\ElasticPotentialEnergy}{E} \newcommand{\ElasticStrainEnergy}{U_{\text{elastic}}} \newcommand{\ElasticTorqueSecondDerivative}{\ddot{\mathbf{z}}} \newcommand{\ElbowSwivelAngle}{\psi} \newcommand{\ElectricalAngularSpeed}{\omega_e} \newcommand{\ElectricalResistance}{R} \newcommand{\ElectricalRotorAngle}{\theta_e} \newcommand{\ElectricalTimeConstant}{\tau_e} \newcommand{\ElectricityPrice}{R_{\$/\text{kWh}}} \newcommand{\ElementStorageSize}{s_{\text{elem}}} \newcommand{\ElementaryCharge}{q} \newcommand{\ElementaryOperationCount}{W} \newcommand{\ElevationAngle}{\phi} \newcommand{\EligibleCachedPrefixLength}{S_{\text{hit}}} \newcommand{\EligibleTargetPositionSet}{\mathcal{P}_{\text{elig}}} \newcommand{\EligibleVectorCount}{N} \newcommand{\EliteSampleFraction}{\beta} \newcommand{\EmbeddingDimension}{d} \newcommand{\EmbeddingShardCount}{N_{\text{shards}}} \newcommand{\EmergencyStopContact}{S} \newcommand{\EmergencyStopCount}{n_{\text{estop}}} \newcommand{\EmittedArtifactCount}{N_{\text{emit}}} \newcommand{\EmittedTokenCount}{S_{\text{out}}} \newcommand{\EmpiricalBellmanOperator}{\mathcal{B}} \newcommand{\EmpiricalExceedanceFraction}{\hat{\zeta}_{u}} \newcommand{\EmpiricalTimestepAverage}{\hat{\mathbb{E}}} \newcommand{\EmpiricalTransferDiscrepancy}{\hat{\epsilon}_{\text{gap}}} \newcommand{\EmptyByteString}{\epsilon} \newcommand{\EncodedLatentState}{\hat{\mathbf{z}}} \newcommand{\EncoderAngle}{\theta_{\text{enc}}} \newcommand{\EncoderBitCount}{n} \newcommand{\EncoderLatentRepresentation}{\mathbf{z}} \newcommand{\EncoderVelocityEstimate}{\dot{\theta}_{\text{enc}}} \newcommand{\EncoderVelocityNoise}{\sigma_{\dot{\theta}_{\text{enc}}}} \newcommand{\EndEffectorCameraTransform}{\mathbf{T}_{EC}} \newcommand{\EndEffectorFirstAxisPosition}{x} \newcommand{\EndEffectorPitchAngle}{\phi_{\text{pitch}}} \newcommand{\EndEffectorPose}{\mathbf{T}_{WE}} \newcommand{\EndEffectorRollAngle}{\phi_{\text{roll}}} \newcommand{\EndEffectorSecondAxisPosition}{y} \newcommand{\EndEffectorTaskAcceleration}{\ddot{\mathbf{x}}} \newcommand{\EndEffectorTaskPosition}{\mathbf{x}} \newcommand{\EndEffectorTaskVelocity}{\dot{\mathbf{x}}} \newcommand{\EndEffectorThirdAxisPosition}{z} \newcommand{\EndEffectorTwist}{\mathbf{V}_E} \newcommand{\EndEffectorVelocity}{\mathbf{v}_e} \newcommand{\EndEffectorYawAngle}{\phi_{\text{yaw}}} \newcommand{\EndToEndRequestLatency}{L_{\text{lat,total}}} \newcommand{\EnergyCrossoverIntensity}{I_{\text{crossover}}} \newcommand{\EnergyLimitedContactForce}{F_E} \newcommand{\EnergyPerByteMoved}{E_{\text{move}}} \newcommand{\EnergyPerOperation}{E_{\text{compute}}} \newcommand{\EnergyTankBarrierFunction}{h_{\text{energy}}} \newcommand{\EnergyTankLevel}{E_{\text{tank}}} \newcommand{\EnergyTankPower}{\dot{E}_{\text{tank}}} \newcommand{\EnergyTankReserve}{E_{\text{min}}} \newcommand{\EnforcedCommandLabel}{\mathbf{a}_{\text{enf}, t}} \newcommand{\EnforcedCommandTap}{a_{\text{enf}}} \newcommand{\EnforcerComputeTime}{T_{\text{comp}}} \newcommand{\EnforcerDeadline}{T_{\text{deadline,enf}}} \newcommand{\EngineerHourlyCost}{C_{\text{engineer}}} \newcommand{\EngineeringTeamSize}{n} \newcommand{\EngineeringTemperatureCeiling}{T_{\text{ceil}}} \newcommand{\EnsembleSpreadThreshold}{\sigma_{\text{thresh}}} \newcommand{\EnsemblingDecayRate}{m} \newcommand{\EnsemblingWindowLength}{K} \newcommand{\EntityCount}{N_{\text{entities}}} \newcommand{\EntityEmbedding}{\mathbf{e}} \newcommand{\EntityIndex}{j} \newcommand{\EntropyTemperature}{\alpha} \newcommand{\EnvelopeCallCount}{N} \newcommand{\EnvelopeSetupTime}{T_{\text{setup}}} \newcommand{\EnvironmentCycleTime}{T_{\text{cycle}}} \newcommand{\EnvironmentFixture}{f} \newcommand{\EnvironmentLatentDimension}{d_z} \newcommand{\EnvironmentLatentVector}{\mathbf{z}} \newcommand{\EnvironmentParameters}{e} \newcommand{\EnvironmentResetTime}{T_{r}} \newcommand{\EnvironmentResponseFunction}{g} \newcommand{\EnvironmentRolloutStepCount}{h} \newcommand{\EnvironmentTransitionDistribution}{p} \newcommand{\EpipolarLine}{\mathbf{l}} \newcommand{\EpochCount}{N_{\text{epochs}}} \newcommand{\EpochIndex}{n_{\text{epoch}}} \newcommand{\EquilibriumWindingTemperature}{T_\infty} \newcommand{\EquivalentSeriesStiffness}{k_{\text{eq}}} \newcommand{\ErasureDataFragmentCount}{d} \newcommand{\ErasureParityFragmentCount}{m} \newcommand{\ErroneousPredictionCost}{C_{\text{error}}} \newcommand{\ErrorBudgetConsumption}{B} \newcommand{\ErrorCovarianceDerivative}{\dot{\mathbf{P}}} \newcommand{\ErrorFeedbackResidual}{\mathbf{e}} \newcommand{\ErrorFeedbackResidualElement}{e} \newcommand{\ErrorGrowthRate}{r} \newcommand{\ErrorRecoveryCost}{C_{\text{recovery}}} \newcommand{\EscalationDecision}{d} \newcommand{\EscalationLossMatrix}{\mathbf{L}} \newcommand{\EscalationThresholdProbability}{p_{\text{threshold}}} \newcommand{\EssentialMatrix}{\mathbf{E}} \newcommand{\EstimateEpoch}{t_{\text{est}}} \newcommand{\EstimatedAcceptanceProbability}{\hat{p}} \newcommand{\EstimatedAccuracy}{\hat{p}} \newcommand{\EstimatedCandidateUtility}{\hat{U}} \newcommand{\EstimatedCleanActionChunk}{\hat{\mathbf{A}}} \newcommand{\EstimatedCoriolisMatrix}{\hat{\mathbf{C}}} \newcommand{\EstimatedDamageProbability}{\hat{p}} \newcommand{\EstimatedDivergenceInstant}{\hat{t}_{\text{div}}} \newcommand{\EstimatedForceSensorBias}{\hat{b}} \newcommand{\EstimatedGravitationalTorque}{\hat{\mathbf{g}}} \newcommand{\EstimatedGripContactForce}{\hat{x}} \newcommand{\EstimatedHistoryAdvantage}{\hat{A}} \newcommand{\EstimatedInertiaMatrix}{\hat{\mathbf{M}}} \newcommand{\EstimatedPairedAcceptanceDifference}{\hat{\Delta}} \newcommand{\EstimatedPlantState}{\hat{\mathbf{x}}} \newcommand{\EstimatedPosition}{\hat{\mathbf{p}}} \newcommand{\EstimatedRemainingReturn}{\hat{V}} \newcommand{\EstimatedUtilityStandardDeviation}{s} \newcommand{\EstimatedVelocity}{\hat{\mathbf{v}}} \newcommand{\EstimatedWindingTemperature}{\hat{T}_{\text{wind}}} \newcommand{\EstimationErrorCovariance}{\mathbf{P}} \newcommand{\EstimatorDrawCount}{N} \newcommand{\EstimatorDrawStandardDeviation}{\sigma} \newcommand{\EstimatorState}{\mathbf{x}} \newcommand{\EstimatorStateVector}{\mathbf{x}} \newcommand{\EstimatorStepIndex}{k} \newcommand{\EulerIntegralFirstShape}{a} \newcommand{\EulerIntegralSecondShape}{b} \newcommand{\EulerIntegralVariable}{t} \newcommand{\EvaluatedExceedance}{y} \newcommand{\EvaluationPredicate}{\phi} \newcommand{\EvaluationSampleCount}{N} \newcommand{\EvaluationTrialCount}{N} \newcommand{\EvaluationTrialIndex}{i} \newcommand{\EventContrastThreshold}{C_{\text{th}}} \newcommand{\EventDetectionPower}{P_{\text{detect}}} \newcommand{\EventIndicator}{\mathbf{1}} \newcommand{\EventPacket}{e} \newcommand{\EventPolarity}{p} \newcommand{\EventProcessingEnergy}{E_{\text{event}}} \newcommand{\EvidenceCaptureInstant}{t_{\text{capture}}} \newcommand{\EvidenceEpoch}{t_0} \newcommand{\EvidenceHorizon}{\tau_{\text{ev}}} \newcommand{\EvidenceLowerBound}{\mathcal{L}_{\text{ELBO}}} \newcommand{\EvidenceRecordEvent}{e_{\text{obs}}} \newcommand{\ExactFailureLowerLimit}{p_{L}} \newcommand{\ExactFailureUpperLimit}{p_{U}} \newcommand{\ExampleAveragedBatchLoss}{\mathcal{L}_{\text{example}}} \newcommand{\ExampleIndex}{i} \newcommand{\ExampleLabel}{y} \newcommand{\ExceedanceReturnLevel}{z_\epsilon} \newcommand{\ExceedanceSampleSet}{\mathcal{Y}_u} \newcommand{\ExceedanceThreshold}{u} \newcommand{\ExcessDistributionFunction}{F_{u}} \newcommand{\ExcessForcePenaltyWeight}{\lambda_f} \newcommand{\ExcessSupportUpperEndpoint}{y_{\max}} \newcommand{\ExecutedActionStepCount}{T_a} \newcommand{\ExecutedToolCall}{a} \newcommand{\ExecutedTrialCount}{N_{\text{trial}}} \newcommand{\ExecutionHorizon}{H_{\text{exec}}} \newcommand{\ExecutionNondeterminism}{\xi} \newcommand{\ExecutionSwitchTime}{T_{\text{switch}}} \newcommand{\ExogenousDataDistribution}{\mathcal{D}} \newcommand{\ExpectedCategoryFrequency}{n_i^{\text{exp}}} \newcommand{\ExpectedCheckingTime}{T_{\text{check}}} \newcommand{\ExpectedCostLimit}{\delta} \newcommand{\ExpectedDecisionRisk}{\mathcal{R}} \newcommand{\ExpectedHistoryActionReturn}{Q} \newcommand{\ExpectedIrreversibleLoss}{L_A} \newcommand{\ExpectedNormalMaximum}{m_{N}} \newcommand{\ExpectedQueryDistribution}{p_{\text{expected}}} \newcommand{\ExpectedRemainingReturn}{V} \newcommand{\ExpectedReturnObjective}{J} \newcommand{\ExpectedRunCompletionTime}{T} \newcommand{\ExpectedTaskCostSum}{J} \newcommand{\ExperienceReplayBuffer}{\mathcal{D}} \newcommand{\ExperimentCount}{N_{\text{exp}}} \newcommand{\ExperimentUserIndex}{i} \newcommand{\ExpertCapacityFactor}{C_{\text{cap}}} \newcommand{\ExpertCount}{N_{\text{experts}}} \newcommand{\ExpertDiscountedStateVisitationDistribution}{d^{\pi^*}} \newcommand{\ExpertIndex}{e} \newcommand{\ExpertSelectionProbability}{p_e} \newcommand{\ExpertStateVisitationDistribution}{p^{\pi^*}} \newcommand{\ExpertTokenCount}{B_e} \newcommand{\ExploitCandidateFraction}{p_{\text{exp}}} \newcommand{\ExploitTrajectory}{\tau_{\text{hack}}} \newcommand{\ExploratoryStateVisitationDistribution}{p^{\pi_{\text{expl}}}} \newcommand{\ExponentBitIndex}{k} \newcommand{\ExponentialSeriesArgument}{u} \newcommand{\ExponentialStabilityConstant}{k} \newcommand{\ExposedCommunicationTime}{T_{\text{comm,exposed}}} \newcommand{\ExposedUnitCount}{E_{\text{exposure}}} \newcommand{\ExposureDuration}{t_{\text{exp}}} \newcommand{\ExposureMidpointTime}{t_{\text{mid}}} \newcommand{\ExposureMotionDisplacement}{\Delta x_{\text{motion}}} \newcommand{\ExposureStartTime}{t_{\text{start}}} \newcommand{\ExposureTravelDistance}{\Delta x} \newcommand{\ExtendedClassKInfinityFamily}{\mathcal{K}_\infty} \newcommand{\ExtendedDepthLength}{K_{\text{ext}}} \newcommand{\ExternalContactTorque}{\boldsymbol{\tau}_{\text{ext}}} \newcommand{\ExternalDispatchAction}{a_{\text{ext}}} \newcommand{\ExternalDisturbanceForce}{d} \newcommand{\ExternalDisturbanceLoad}{\mathbf{d}_{\text{ext}}} \newcommand{\ExternalJointTorque}{\tau_{\text{ext}}} \newcommand{\ExternalObjectWrench}{\mathbf{w}_{\text{ext}}} \newcommand{\ExternalWait}{T_{\text{wait}}} \newcommand{\ExternalWrench}{\mathbf{F}_{\text{ext}}} \newcommand{\ExtractionAnomalyClassifier}{f_{\theta}} \newcommand{\ExtractionQueryCount}{n_{\text{queries}}} \newcommand{\ExtrinsicCalibrationCovariance}{\boldsymbol{\Sigma}_{\text{ext}}} \newcommand{\ExtrinsicCovarianceJacobian}{\mathbf{J}_{\text{ext}}} \newcommand{\ExtrinsicLateralError}{\Delta y} \newcommand{\ExtrinsicMisalignmentAngle}{\theta_{\text{ext}}} \newcommand{\EyeInHandCameraMotion}{\mathbf{B}} \newcommand{\EyeInHandFlangeMotion}{\mathbf{A}} \newcommand{\EyeInHandUnknownTransform}{\mathbf{X}} \newcommand{\EyeToHandCameraPose}{\mathbf{B}'} \newcommand{\EyeToHandFlangePose}{\mathbf{A}'} \newcommand{\EyeToHandTargetTransform}{\mathbf{Z}} \newcommand{\EyeToHandUnknownTransform}{\mathbf{X}'} \newcommand{\FacilityEnergy}{E_{\text{facility}}} \newcommand{\FacilityHeatRemovalCapacity}{\dot{Q}_{\text{remove,max}}} \newcommand{\FacilityPower}{P_{\text{facility}}} \newcommand{\FacilityWaterConsumption}{W_{\text{water}}} \newcommand{\FactoredIntermediateActivation}{\mathbf{z}} \newcommand{\FactorizationRank}{k} \newcommand{\FailureDetectionTime}{T_{\text{detect}}} \newcommand{\FailureEventCost}{C_{\text{per-failure}}} \newcommand{\FailureFlagLatency}{\delta_{\text{flag}}} \newcommand{\FailureMarginFunction}{l} \newcommand{\FailureModeOccurrenceCount}{n_{f}} \newcommand{\FailureObservationInterval}{T} \newcommand{\FailureOverheadFraction}{F_{\text{fail}}} \newcommand{\FailureRecoveryTime}{T_{\text{recovery}}} \newcommand{\FailureRegion}{F} \newcommand{\FailureSet}{\mathcal{F}_{\text{fail}}} \newcommand{\FailureUpperConfidenceLimit}{p_{\text{fail, upper}}} \newcommand{\FairShareStabilizingConstant}{\epsilon_{\text{stab}}} \newcommand{\FairnessGapTolerance}{\epsilon_{\text{fair}}} \newcommand{\FakeQuantizedOutput}{x_{\text{fake}}} \newcommand{\FallbackCost}{C_{\text{fallback}}} \newcommand{\FallbackDeadline}{T_{\text{deadline,fallback}}} \newcommand{\FallbackHold}{T_{\text{hold}}} \newcommand{\FalseAcceptHarmCost}{C_{\text{harm}}} \newcommand{\FalseApprovalCount}{N_{\text{fa}}} \newcommand{\FalseApprovalOutcomeCount}{k} \newcommand{\FalseApprovalPropensity}{Q} \newcommand{\FalseApprovalPropensityLevel}{q} \newcommand{\FalseDiscoveryRateTarget}{q} \newcommand{\FalsificationInitialStateSet}{\mathcal{X}_0} \newcommand{\FanoutBackendCount}{m} \newcommand{\FarthestCandidateDistance}{D_{\max}} \newcommand{\FatTreeHostCount}{N_{\text{hosts}}} \newcommand{\FatigueLifeCycleCount}{N} \newcommand{\FaultContainmentLatency}{\Delta t_{\text{bounded}}} \newcommand{\FaultDetectionLatency}{\Delta t_{\text{det}}} \newcommand{\FaultDomainIsolation}{\mathcal{F}} \newcommand{\FaultInjectionDuration}{\Delta t_{\text{duration}}} \newcommand{\FaultStartTimestamp}{t_{\text{fault\_start}}} \newcommand{\FaultTakeoverLatency}{\Delta t_{\text{takeover}}} \newcommand{\FaultTakeoverTimestamp}{t_{\text{takeover}}} \newcommand{\FaultToleranceCost}{C_{\text{ft}}} \newcommand{\FaultToleranceInvestment}{x} \newcommand{\FeasibleOutputTokenRate}{\mu_{\text{out}}} \newcommand{\FeasibleTrajectoryProjection}{\Pi_{\mathcal{K}}} \newcommand{\FeasibleTrajectorySet}{\mathcal{K}} \newcommand{\FeatureCategoryCount}{k} \newcommand{\FeatureCategoryIndex}{i} \newcommand{\FeatureCellVector}{\mathbf{f}_{u, v}} \newcommand{\FeatureChannelCount}{C} \newcommand{\FeatureCount}{N_{\text{features}}} \newcommand{\FeatureFreshnessLatency}{T_{\text{freshness}}} \newcommand{\FeatureMapColumnCoordinate}{x} \newcommand{\FeatureMapGrowthRate}{g} \newcommand{\FeatureMapHeight}{H_{\text{img}}} \newcommand{\FeatureMapRowCoordinate}{y} \newcommand{\FeatureMapWidth}{W_{\text{img}}} \newcommand{\FeatureRecordTime}{t} \newcommand{\FeatureRetentionWindow}{T_{\text{retention}}} \newcommand{\FeatureUpdateInterval}{T_{\text{update}}} \newcommand{\FeatureUpdateLag}{T_{\text{staleness}}} \newcommand{\FeatureUpdateTimestamp}{t_{\text{feat}}} \newcommand{\FeatureViewingDistance}{r} \newcommand{\FederatedRoundCount}{R} \newcommand{\FederatedRoundIndex}{t} \newcommand{\FederatedTrainingEnergy}{E_{\text{federated}}} \newcommand{\FeedForwardOperations}{O_{\text{FFN}}} \newcommand{\FeedForwardWidth}{d_{\text{ff}}} \newcommand{\FeedbackCheckDuration}{t_{\text{check}}} \newcommand{\FeedbackCriticalPathLatency}{T^{\text{feedback}}} \newcommand{\FeedbackIntervalCount}{k} \newcommand{\FeedbackStepIndex}{t} \newcommand{\FeedforwardJointTorque}{\boldsymbol{\tau}_{\text{ff}}} \newcommand{\FeedthroughMatrix}{\mathbf{D}} \newcommand{\FewShotStepCount}{n_{\text{steps}}} \newcommand{\FewShotSupportSet}{\mathcal{D}_{\text{shot}}} \newcommand{\FiberPropagationSpeed}{c_{\text{fiber}}} \newcommand{\FieldbusCycleTime}{T_{\text{cycle}}} \newcommand{\FilmEncounterRate}{\lambda_{\text{film}}} \newcommand{\FilterSolveBudget}{T_{\text{budget}}} \newcommand{\FilterSolveTime}{T_{\text{solve}}} \newcommand{\FilterTapCount}{N} \newcommand{\FilterWeight}{w} \newcommand{\FilteredScreenSpaceCovariance}{\boldsymbol{\Sigma}_{2D}'} \newcommand{\FinalBusVoltage}{V_{\text{final}}} \newcommand{\FinalGeneratorLatentVector}{\mathbf{z}_{m}} \newcommand{\FinalLayerFunction}{f_{N_L}} \newcommand{\FinalLayerWidth}{n_{N_L}} \newcommand{\FinalMiniBatchActivation}{a_{B}} \newcommand{\FinalRecurrentHiddenState}{\mathbf{h}_{S}} \newcommand{\FinalWatchdogToken}{T_{\text{final}}} \newcommand{\FingerNormalForce}{f_n} \newcommand{\FingerTangentialForce}{\mathbf{f}_t} \newcommand{\FinishedWorkerCount}{j} \newcommand{\FiniteChange}{\Delta} \newcommand{\FiniteSampleGeneralizationBound}{\delta_N} \newcommand{\FiniteTimeHorizon}{T} \newcommand{\FirstAdjacentCheckIndex}{a} \newcommand{\FirstAdjacentCheckPassProbability}{p_{a}} \newcommand{\FirstAdjacentCheckSlotTime}{T_{a}} \newcommand{\FirstAtomicGradientUpdate}{A} \newcommand{\FirstCatalogDefinitionCount}{n_{\text{def},A}} \newcommand{\FirstCatalogDefinitionSize}{S_{A}} \newcommand{\FirstClassCoverageFloor}{a} \newcommand{\FirstClientMaskedUpdate}{\mathbf{y}_A} \newcommand{\FirstClientModelParameters}{\theta_A} \newcommand{\FirstComparedGroupLabel}{a} \newcommand{\FirstComparedItem}{i} \newcommand{\FirstDiscardedSingularNumber}{\sigma_{r+1}} \newcommand{\FirstErrorStepIndex}{k} \newcommand{\FirstFloatingPointAddend}{a} \newcommand{\FirstGroupClassificationThreshold}{\tau_{\text{thr},a}} \newcommand{\FirstGroupQualifiedFraction}{q_a} \newcommand{\FirstGroupSampleApprovalRate}{\hat{p}_a} \newcommand{\FirstGroupSampleSize}{n_a} \newcommand{\FirstGroupThresholdClassifier}{h_a} \newcommand{\FirstIncidentTime}{t_1} \newcommand{\FirstInputNodePrimal}{v_{1-N}} \newcommand{\FirstJaccardSet}{\mathcal{A}} \newcommand{\FirstMistakeEvent}{\mathcal{E}} \newcommand{\FirstRankComputeTime}{T_{\text{rank}_0}} \newcommand{\FirstRaterCategoryFraction}{p_{y,1}} \newcommand{\FirstRingTraceElement}{a} \newcommand{\FirstSummandStandardDeviation}{\sigma_a} \newcommand{\FirstTwinCriticReturnEstimate}{Q_{\phi_1}} \newcommand{\FittedSensitivity}{\lambda} \newcommand{\FixedClearanceAllowance}{\delta} \newcommand{\FlangeCameraTransform}{\mathbf{T}_{\text{flange}}^{\text{cam}}} \newcommand{\FlangePose}{\mathbf{T}_{\text{flange}}} \newcommand{\FlangeReferenceFrame}{\mathcal{F}_{\text{flange}}} \newcommand{\FlangeTargetTransform}{\mathbf{T}_{\text{flange}}^{\text{target}}} \newcommand{\FlattenedFilterWeights}{\mathbf{w}_{\text{col}}} \newcommand{\FleetAcceleratorCount}{N_{\text{fleet}}} \newcommand{\FleetCommunicationTaxonomyAxis}{C_2} \newcommand{\FleetComputeTaxonomyAxis}{C_1} \newcommand{\FleetCoordinationTaxonomyAxis}{C_3} \newcommand{\FleetEnergyProductivity}{\rho_{\text{energy}}} \newcommand{\FleetManufacturingDistribution}{\mathcal{M}} \newcommand{\FleetResourceCapacity}{C_{r}} \newcommand{\FleetRobotCount}{N_{\text{fleet}}} \newcommand{\FlippedFloatExponentField}{e'} \newcommand{\FloatEncodedNumber}{x} \newcommand{\FloatExponentField}{e} \newcommand{\FloatMantissaField}{m} \newcommand{\FloatSignBit}{s} \newcommand{\FloatingBaseAccelerations}{\ddot{\mathbf{q}}_b} \newcommand{\FloatingBaseBiasForces}{\mathbf{h}_b} \newcommand{\FloatingBaseInertiaBlock}{\mathbf{M}_{bb}} \newcommand{\FloatingBasePose}{\mathbf{q}_b} \newcommand{\FlopPrice}{c_{\text{FLOP}}} \newcommand{\FlowMatchingLoss}{\mathcal{L}_{\text{FM}}} \newcommand{\FlowProbabilityPath}{\rho} \newcommand{\FlowSampleVector}{\mathbf{y}} \newcommand{\FlowTimeCoordinate}{t} \newcommand{\FocalLength}{f} \newcommand{\FollowerForwardWave}{\mathbf{u}_s} \newcommand{\FollowerJointPositions}{\mathbf{q}_{\text{follower}}} \newcommand{\FollowerMechanicalLatency}{t_{\text{mech}}} \newcommand{\FollowerReturnWave}{\mathbf{w}_s} \newcommand{\ForceGuidedRelay}{K} \newcommand{\ForceReadingInnovation}{\nu} \newcommand{\ForceSensorBias}{b} \newcommand{\ForceSensorReading}{y} \newcommand{\ForegroundLatency}{L_{\text{lat,fg}}} \newcommand{\ForgetDataset}{D_{\text{forget}}} \newcommand{\ForkBoundarySet}{\mathcal{B}_{\text{fork}}} \newcommand{\ForkedTrajectoryTokenCount}{N_{\text{total}}} \newcommand{\FormatComplianceScore}{\Phi} \newcommand{\FormatEfficiency}{\eta_{\text{format}}} \newcommand{\FormatRewardWeight}{\lambda_{\text{fmt}}} \newcommand{\ForwardDiffusionDistribution}{q} \newcommand{\ForwardEulerEigenvalue}{\lambda_{\text{FE}}} \newcommand{\ForwardEulerTransitionMatrix}{\mathbf{A}_{\text{FE}}} \newcommand{\ForwardInvariantSafeSet}{\mathcal{C}} \newcommand{\ForwardKinematicsMap}{\mathbf{FK}} \newcommand{\ForwardOccupancySet}{\mathcal{R}} \newcommand{\ForwardPassTokenCount}{n} \newcommand{\ForwardPosteriorMean}{\tilde{\boldsymbol{\mu}}} \newcommand{\ForwardPosteriorVariance}{\tilde{\beta}} \newcommand{\FourthRingTraceElement}{d} \newcommand{\FrameBitCount}{B_{\text{frame}}} \newcommand{\FrameBlockingTime}{B} \newcommand{\FrameExposureStartTime}{t_{\text{start}}} \newcommand{\FrameIndex}{i} \newcommand{\FramePayloadSize}{B_{\text{payload}}} \newcommand{\FramePeriod}{T} \newcommand{\FrameReadoutTime}{t_{\text{readout}}} \newcommand{\FrameReleaseJitter}{J} \newcommand{\FrameResponseTime}{R} \newcommand{\FrameSerializationTime}{t_{\text{frame},i}} \newcommand{\FrameTransmissionTime}{C} \newcommand{\FrameWireBitCount}{B_{\text{wire},i}} \newcommand{\FreeConfigurationSpace}{\mathcal{C}_{\text{free}}} \newcommand{\FreeCreditCount}{N_{\text{free}}} \newcommand{\FreeSpaceDepth}{d_{\text{free}}} \newcommand{\FreeSpaceLogOddsIncrement}{L_{\text{free}}} \newcommand{\FreeSurfaceTiltAngle}{\theta_{\text{tilt}}} \newcommand{\FreeboardHeight}{h_{f}} \newcommand{\FreshEvidenceTime}{t_{\text{fresh}}} \newcommand{\FreshInputTokenCount}{S_{\text{fresh}}} \newcommand{\FreshnessObjective}{S_{\text{freshness}}} \newcommand{\FrictionCoefficientFloor}{\mu_{\min}} \newcommand{\FrictionPyramidMatrix}{\mathbf{F}} \newcommand{\FrobeniusNorm}{F} \newcommand{\FrozenBackboneFunction}{f} \newcommand{\FrozenFeatureEncoder}{f} \newcommand{\FrozenWeightMatrix}{\mathbf{W}_{\text{frozen}}} \newcommand{\FrustumFeature}{\mathbf{c}_{u, v, k}} \newcommand{\FullBatchLoss}{\mathcal{L}_B} \newcommand{\FullDatasetSize}{D_{\text{total}}} \newcommand{\FullPrecisionWeight}{w} \newcommand{\FullSnapshotWriteVolume}{D_{\text{vol,full}}} \newcommand{\FullSpeedTravelTime}{b} \newcommand{\FunctionInputAdjoint}{\bar{x}} \newcommand{\FunctionInputDimension}{N} \newcommand{\FunctionInputElement}{x} \newcommand{\FunctionInputTangent}{\dot{x}} \newcommand{\FunctionInputVariable}{x} \newcommand{\FunctionInputVector}{\mathbf{x}} \newcommand{\FunctionJacobian}{\mathbf{J}} \newcommand{\FunctionOutputDimension}{M} \newcommand{\FunctionOutputElement}{y} \newcommand{\FunctionOutputVariable}{z} \newcommand{\FunctionOutputVector}{\mathbf{y}} \newcommand{\FunctionSecondInputVariable}{y} \newcommand{\FundamentalMatrix}{\mathbf{F}} \newcommand{\FusedConvolutionBias}{\mathbf{b}_{\text{fused}}} \newcommand{\FusedConvolutionWeight}{\mathbf{W}_{\text{fused}}} \newcommand{\FusedTokenCount}{N_{\text{total}}} \newcommand{\FusionCandidate}{x_{\text{cand}}} \newcommand{\FusionInputList}{\mathcal{L}} \newcommand{\FusionInputRank}{r} \newcommand{\FusionInputTensor}{\mathbf{X}} \newcommand{\FusionIntermediateTensor}{\mathbf{Z}} \newcommand{\FusionOutputTensor}{\mathbf{Y}} \newcommand{\FutureControlTrajectory}{\mathbf{u}_{[t, \infty)}} \newcommand{\FutureTimeInstant}{t'} \newcommand{\GaeAdvantageEstimate}{\widehat{A}^{\text{GAE}}} \newcommand{\GateCurrent}{I_g} \newcommand{\GateDriverSkew}{t_{\text{prop, skew}}} \newcommand{\GatePropagationDelay}{t_{\text{prop}}} \newcommand{\GateSourceCapacitance}{C_{\text{gs}}} \newcommand{\GateSourceCharge}{Q_{\text{gs}}} \newcommand{\GateSourceVoltage}{V_{\text{gs}}} \newcommand{\GaussianCovarianceMatrix}{\boldsymbol{\Sigma}} \newcommand{\GaussianDistribution}{\mathcal{N}} \newcommand{\GaussianFirstAxisScale}{s_{x}} \newcommand{\GaussianMeanVector}{\boldsymbol{\mu}} \newcommand{\GaussianMechanismNoiseVector}{\mathbf{z}} \newcommand{\GaussianMechanismStandardDeviation}{\sigma_{\text{mech}}} \newcommand{\GaussianOpacityLogit}{o} \newcommand{\GaussianPrimitiveCovariance}{\boldsymbol{\Sigma}} \newcommand{\GaussianPrimitiveDensity}{G} \newcommand{\GaussianPrimitiveIndex}{i} \newcommand{\GaussianPrimitiveMean}{\boldsymbol{\mu}} \newcommand{\GaussianPrimitiveOpacity}{\alpha} \newcommand{\GaussianPrimitiveScaleMatrix}{\mathbf{S}} \newcommand{\GaussianSecondAxisScale}{s_{y}} \newcommand{\GaussianStandardDeviation}{\sigma} \newcommand{\GaussianThirdAxisScale}{s_{z}} \newcommand{\GaussianViewDependentColor}{c} \newcommand{\GearFaceWidth}{b} \newcommand{\GearModule}{m} \newcommand{\GearRatedFatigueLife}{L_{\text{gear}}} \newcommand{\GearReductionRatio}{N_{\text{gear}}} \newcommand{\GearTangentialLoad}{W_t} \newcommand{\GearToothBendingStress}{\sigma_b} \newcommand{\GearTorqueReversalCount}{n_{\text{gear}}} \newcommand{\GearboxTransmissionEfficiency}{\eta_{\text{gear}}} \newcommand{\GemmAccumulatorScale}{\beta} \newcommand{\GemmColumnDimension}{N} \newcommand{\GemmInnerDimension}{K} \newcommand{\GemmLeftOperand}{\mathbf{A}} \newcommand{\GemmLeftOperandElement}{A} \newcommand{\GemmLeftOperandEntry}{A_{ik}} \newcommand{\GemmOutputElement}{C} \newcommand{\GemmOutputEntry}{C_{ij}} \newcommand{\GemmOutputMatrix}{\mathbf{C}} \newcommand{\GemmProductScale}{\alpha} \newcommand{\GemmReductionIndex}{k} \newcommand{\GemmRightOperand}{\mathbf{B}} \newcommand{\GemmRightOperandElement}{B} \newcommand{\GemmRightOperandEntry}{B_{kj}} \newcommand{\GemmRowDimension}{M} \newcommand{\GemmTileColumnDimension}{N_{\text{tile}}} \newcommand{\GemmTileInnerDimension}{K_{\text{tile}}} \newcommand{\GemmTileRowDimension}{M_{\text{tile}}} \newcommand{\GemvArithmeticIntensity}{I_{\text{GEMV}}} \newcommand{\GeneralPurposeEnergyProductivity}{\rho_{\text{energy,general}}} \newcommand{\GeneralizedAccelerationLowerBound}{\ddot{\mathbf{q}}_{\min}} \newcommand{\GeneralizedAccelerationUpperBound}{\ddot{\mathbf{q}}_{\max}} \newcommand{\GeneralizedAccelerations}{\ddot{\mathbf{q}}} \newcommand{\GeneralizedBiasForces}{\mathbf{h}} \newcommand{\GeneralizedCoordinateCount}{n} \newcommand{\GeneralizedCoordinates}{\mathbf{q}} \newcommand{\GeneralizedInertiaMatrix}{\mathbf{M}} \newcommand{\GeneralizedParetoDistribution}{H} \newcommand{\GeneralizedParetoLikelihood}{L} \newcommand{\GeneralizedVelocities}{\dot{\mathbf{q}}} \newcommand{\GeneratedResponse}{y} \newcommand{\GeneratedSampleCount}{n} \newcommand{\GeneratedTokenCap}{N_{\text{cap}}} \newcommand{\GenerationStepErrorRate}{\lambda_{\text{error}}} \newcommand{\GenerativeActionModelDistribution}{p_\theta} \newcommand{\GeneratorLatentVector}{\mathbf{z}} \newcommand{\GenericRandomVariable}{X} \newcommand{\GeometricStateRepresentation}{\mathbf{Z}_{\text{geom}}} \newcommand{\GevLocationParameter}{\mu} \newcommand{\GevScaleParameter}{\sigma} \newcommand{\GlobalBatchGradient}{\mathbf{g}_{\text{global}}} \newcommand{\GlobalBatchSize}{B_{\text{global}}} \newcommand{\GlobalDeviationPenalty}{\mathcal{R}} \newcommand{\GlobalModelParameters}{\theta_{\text{global}}} \newcommand{\GoalConfiguration}{\mathbf{q}_{\text{goal}}} \newcommand{\GoalSet}{\mathcal{G}_{\text{goal}}} \newcommand{\GoodputRelativeTolerance}{\epsilon_{\mathcal{G}}} \newcommand{\GpdCumulativeDistribution}{F_{\text{GPD}}} \newcommand{\GpdScaleParameter}{\tilde{\sigma}} \newcommand{\GpuAvailability}{A_{\text{GPU}}} \newcommand{\GpuEnergy}{E_{\text{GPU}}} \newcommand{\GpuFailureRate}{\lambda_{\text{GPU}}} \newcommand{\GpuMttf}{\text{MTTF}_{\text{GPU}}} \newcommand{\GpuTopologicalDistance}{d} \newcommand{\GradientClippingNorm}{C} \newcommand{\GradientCovarianceMatrix}{\Sigma} \newcommand{\GradientElementCount}{d_{\text{grad}}} \newcommand{\GradientMemory}{M_{\text{gradients}}} \newcommand{\GradientPayload}{M_{\text{grad}}} \newcommand{\GradientStaleness}{\tau_{\text{stale}}} \newcommand{\GrantAllowedAccesses}{\mathcal{A}} \newcommand{\GrantCondition}{\phi_{\Gamma}} \newcommand{\GrantExpiryTime}{t_{\text{exp}}} \newcommand{\GrantIssueTime}{T} \newcommand{\GrantRights}{\mathcal{R}_{\Gamma}} \newcommand{\GraphEdgeSet}{E} \newcommand{\GraphNodeIndex}{i} \newcommand{\GraphNodeSet}{V} \newcommand{\GraspContactDisplacement}{\mathbf{d}} \newcommand{\GraspForceCeiling}{f_{\max}} \newcommand{\GraspForceFloor}{f_{\min}} \newcommand{\GraspMap}{\mathbf{G}} \newcommand{\GraspOrientation}{\mathbf{R}_{\text{grasp}}} \newcommand{\GraspPose}{\mathbf{T}_{\text{grasp}}} \newcommand{\GraspPosition}{\mathbf{p}_{\text{grasp}}} \newcommand{\GraspVerticalAcceleration}{a_z} \newcommand{\GravitationalTorqueVector}{\mathbf{g}} \newcommand{\Gravity}{g} \newcommand{\GravityCenterHeight}{h_{\text{cg}}} \newcommand{\GravityVector}{\mathbf{g}_0} \newcommand{\GridFeedCapacity}{P_{\text{grid}}} \newcommand{\GridSideCellCount}{N} \newcommand{\GripContactForce}{x} \newcommand{\GripperContactAngle}{\theta_{\text{contact}}} \newcommand{\GripperOpeningCommand}{a_{\text{gripper}}} \newcommand{\GroundPlaneAbscissa}{x} \newcommand{\GroundPlaneOrdinate}{y} \newcommand{\GroupCommitWaitTime}{L_{\text{lat}, i}} \newcommand{\GroupContrastProbability}{p_{\text{contrast}}} \newcommand{\GroupDisparity}{\Delta_g} \newcommand{\GroupMeanReward}{\mu_{R}} \newcommand{\GroupRelativeAdvantage}{\hat{A}} \newcommand{\GroupRewardStandardDeviation}{\sigma_{R}} \newcommand{\GroupRolloutIndex}{i} \newcommand{\GroupSize}{G} \newcommand{\GrpoSampledObjective}{\widehat{\mathcal{J}}_{\text{GRPO}}} \newcommand{\GuardBandDuration}{t_{\text{guard}}} \newcommand{\GuardedContactPredicate}{P_{\text{contact}}} \newcommand{\GuestImageMemory}{M_{\text{guest}}} \newcommand{\GuestKernelBootTime}{T_{\text{kernel}}} \newcommand{\HadamardRotationMatrix}{\mathbf{H}} \newcommand{\HalfPrecisionGemvIntensity}{I_{\text{GEMV, 16-bit}}} \newcommand{\HammingDataBitCount}{n} \newcommand{\HandForceCriterion}{F_h} \newcommand{\HandleAffordanceFrame}{\mathcal{F}_{\text{handle}}} \newcommand{\HandoffExceedanceProbability}{\epsilon} \newcommand{\HandoverTimeout}{T_{\text{timeout}}} \newcommand{\HandoverTimeoutCeiling}{T_{\text{config}}} \newcommand{\HandshakeProtocolLatency}{T_{\text{handshake}}} \newcommand{\HardwareCommonCauseRate}{\lambda_{\text{other}}} \newcommand{\HardwareParameterVector}{\boldsymbol{\xi}_{\text{real}}} \newcommand{\HardwareServiceLife}{T_{\text{lifetime}}} \newcommand{\HarmInclusiveTaskCost}{C_{\text{with\ harm}}} \newcommand{\HarmInstant}{t_{\text{harm}}} \newcommand{\HarmLeadTime}{t_{\text{harm}}} \newcommand{\HarmonicDriveTorsionalStiffness}{k_c} \newcommand{\HarmonicPeriodMultiple}{m} \newcommand{\HarnessConnectorResistance}{R_{\text{harness}}} \newcommand{\HashBucketCount}{N_{\text{buckets}}} \newcommand{\HashEntrySize}{s_{\text{entry}}} \newcommand{\HashRingServer}{s} \newcommand{\HashRingServerCount}{N} \newcommand{\HashRingServerSet}{\mathcal{S}_{\text{srv}}} \newcommand{\HashedGridMemory}{M_{\text{hashed}}} \newcommand{\HazardClassIndex}{h} \newcommand{\HazardOnset}{t_{\text{onset}}} \newcommand{\HazardOnsetBound}{t_{\text{bound}}} \newcommand{\HazardousProposalRate}{\lambda_{\text{proposal}, h}} \newcommand{\HazardousWorldState}{s_B} \newcommand{\HeadAxisLabel}{h} \newcommand{\HeadByteAllocation}{M_{\text{head}}} \newcommand{\HeadComponentIndex}{m} \newcommand{\HeadDimensionAxisLabel}{d} \newcommand{\HeadKeyProjectionMatrix}{\mathbf{W}_{K,i}} \newcommand{\HeadQueryProjectionMatrix}{\mathbf{W}_{Q,i}} \newcommand{\HeadSamplingProbability}{\theta} \newcommand{\HeadValuesProjectionMatrix}{\mathbf{W}_{V,i}} \newcommand{\HeadingAngle}{\theta_{\text{head}}} \newcommand{\HeadingCurvature}{\kappa} \newcommand{\HealthyStepTime}{T_{\text{healthy}}} \newcommand{\HeartbeatAge}{\Delta t_{\text{heartbeat}}} \newcommand{\HeartbeatInterval}{H} \newcommand{\HeartbeatReceiptTime}{t_{\text{local}}} \newcommand{\HeartbeatSequenceCounter}{k} \newcommand{\HeartbeatTimestamp}{t^{\text{hb}}} \newcommand{\HeatDissipationPower}{P_{\text{heat}}} \newcommand{\HermiteBasisFunction}{h} \newcommand{\HermiteInterpolationFraction}{\lambda} \newcommand{\HermiteSegmentProgress}{s} \newcommand{\HertzianContactCoefficient}{k_{c}} \newcommand{\HertzianContactStiffness}{k_H} \newcommand{\HiddenActivation}{\mathbf{h}} \newcommand{\HiddenActivationMatrix}{\mathbf{H}} \newcommand{\HiddenDimension}{d} \newcommand{\HiddenUnitOutput}{h} \newcommand{\HighOccupancyBinCount}{m} \newcommand{\HigherPriorityFrames}{hp} \newcommand{\HigherPriorityTasks}{hp} \newcommand{\HighestSignalFrequency}{f_{\max}} \newcommand{\HnswLayerIndex}{L} \newcommand{\HnswLevelDraw}{U} \newcommand{\HnswLevelNormalization}{m_\ell} \newcommand{\HnswMaximumConnectionCount}{M} \newcommand{\HnswSearchBeamWidth}{ef_{\text{search}}} \newcommand{\HoldingTorque}{\tau_{\text{hold}}} \newcommand{\HomogeneousCameraFramePoint}{\tilde{\mathbf{p}}_C} \newcommand{\HomogeneousPixelCoordinates}{\tilde{\mathbf{m}}} \newcommand{\HomogeneousPointCoordinates}{\tilde{\mathbf{p}}} \newcommand{\HomogeneousTransform}{\mathbf{T}_{AB}} \newcommand{\HomogeneousWorldFramePoint}{\tilde{\mathbf{p}}_W} \newcommand{\HomographyColumn}{\mathbf{h}} \newcommand{\HomographyColumnEntry}{h} \newcommand{\HomographyConstraintVector}{\mathbf{v}} \newcommand{\HomographyScaleFactor}{\lambda} \newcommand{\HomomorphicCiphertext}{c} \newcommand{\HomomorphicFunction}{f} \newcommand{\HomomorphicPublicKey}{pk} \newcommand{\HomomorphicSecretKey}{sk} \newcommand{\HorizonStepIndex}{k} \newcommand{\HorizontalFocalLength}{f_x} \newcommand{\HostArrivalTimestamp}{t_{\text{host}}} \newcommand{\HostHeartbeatRate}{f_{\text{heartbeat}}} \newcommand{\HostLinkBandwidth}{\text{BW}_{\text{link}}} \newcommand{\HostPower}{P_{\text{host}}} \newcommand{\HostPreparationTime}{T_{\text{prep}}} \newcommand{\HostRuntimeCount}{N_{\text{host}}} \newcommand{\HostSoftwareTime}{T_{\text{sw}}} \newcommand{\HostTransferBandwidth}{\text{BW}_{\text{host}}} \newcommand{\HotTierHitProbability}{h} \newcommand{\HotTierServiceTime}{T_{\text{hot}}} \newcommand{\HourlyAccountQueryCount}{q_{\text{hourly}}} \newcommand{\HourlyComponentFailureRate}{\lambda_{\text{hour}}} \newcommand{\HuberLossThreshold}{\delta} \newcommand{\HullQueryTime}{t_{\text{query}}} \newcommand{\HullSphereRadius}{r_{\text{hull}}} \newcommand{\HumanCommandRate}{\dot{\mathbf{u}}_{\text{human}}} \newcommand{\HumanControlCommand}{\mathbf{u}_{\text{human}}} \newcommand{\HumanFallbackCost}{C_{h}} \newcommand{\HumanReactionTime}{T_{\text{human}}} \newcommand{\HumanResolutionProbability}{h} \newcommand{\HumanReviewCost}{C_{\text{human}}} \newcommand{\HumanStandaloneSensitivity}{S_{\text{human}}} \newcommand{\HumanWalkingSpeedBound}{v_h} \newcommand{\HybridIterationTime}{T_{\text{step}}} \newcommand{\HydraulicSupplyPressure}{p} \newcommand{\HypothesisIndex}{h} \newcommand{\HypothesisTestFalseNegativeRate}{\beta_{\text{stat}}} \newcommand{\HypothesisTestSignificanceLevel}{\alpha_{\text{sig}}} \newcommand{\HypothesizedAcceptanceProbability}{p} \newcommand{\HypothesizedTrialFailureProbability}{p} \newcommand{\IdealAcceleratorTime}{T_{\text{ideal}}} \newcommand{\IdealMemoryQueueDelay}{t_{\text{queue,ideal}}} \newcommand{\IdempotentAlgebraElement}{x} \newcommand{\IdentityMatrix}{\mathbf{I}} \newcommand{\IllustrativeFunction}{f} \newcommand{\ImageChannelCount}{C} \newcommand{\ImageChannelIndex}{c} \newcommand{\ImageColumnIndex}{w} \newcommand{\ImageEpipole}{\mathbf{e}} \newcommand{\ImageHeight}{H} \newcommand{\ImagePlanePixelCoordinates}{\mathbf{u}_{\text{px}}} \newcommand{\ImageRowIndex}{h} \newcommand{\ImageTensorElement}{X} \newcommand{\ImageWidth}{W} \newcommand{\ImaginaryUnit}{j} \newcommand{\ImitationLearnedPolicy}{\hat{\pi}} \newcommand{\ImitationTargetCommand}{\mathbf{u}_{\text{target}}} \newcommand{\ImmediateTaskCostScore}{C} \newcommand{\ImpactInstant}{T} \newcommand{\ImpactRiseTime}{t_{\text{rise}}} \newcommand{\ImpactSpeed}{v_{\text{impact}}} \newcommand{\ImpedanceControlledPosition}{x} \newcommand{\ImpedanceControlledVelocity}{\dot{x}} \newcommand{\ImpedanceEquilibriumPosition}{x_{\text{des}}} \newcommand{\ImpedanceEquilibriumVelocity}{\dot{x}_{\text{des}}} \newcommand{\ImpedanceRestoringForce}{F} \newcommand{\ImplicitPolicyEnergyFunction}{E_\theta} \newcommand{\ImportanceProposalDistribution}{q} \newcommand{\ImportanceSampledFailureProbability}{\hat{p}_F} \newcommand{\ImuSampleTime}{t_{\text{IMU}}} \newcommand{\InContactViableSet}{\mathcal{C}_{\text{contact}}} \newcommand{\IncidenceAngle}{\theta_{\text{inc}}} \newcommand{\IncidentOpticalPower}{P_{\text{opt}}} \newcommand{\IncomingChannelCommand}{u_{\text{new}}} \newcommand{\IncomingCommandDerivative}{\dot{u}_{\text{new}}} \newcommand{\IncorrectCandidateTrialPassProbability}{p_{b}} \newcommand{\IncrementalSnapshotWriteVolume}{D_{\text{vol,delta}}} \newcommand{\IncumbentControlCommand}{\mathbf{u}^{\text{incumbent}}} \newcommand{\IncumbentInterventionRate}{\lambda_{\text{incumbent}}} \newcommand{\IncumbentTrackingErrorStandardDeviation}{\sigma_{\text{incumbent}}} \newcommand{\IndependentAttemptCount}{k} \newcommand{\IndependentEventProbability}{p} \newcommand{\IndependentSampleRate}{f} \newcommand{\IndexGraphNodeSet}{V} \newcommand{\IndexedDocumentCount}{N} \newcommand{\IndicatorFunction}{\mathbb{I}} \newcommand{\InducedGateVoltage}{V_{\text{gs,induced}}} \newcommand{\InductiveVoltage}{v} \newcommand{\InequalityConstraintFunction}{g} \newcommand{\InertiaMatchingRatio}{N^*} \newcommand{\InertiaMatrixDerivative}{\dot{\mathbf{M}}} \newcommand{\InertialIntegrationTime}{T} \newcommand{\InferenceActiveTime}{t_{\text{inference}}} \newcommand{\InferenceCost}{C_{\text{infer}}} \newcommand{\InferenceDutyCycle}{\alpha_{\text{duty}}} \newcommand{\InferenceEnergy}{E_{\text{inf}}} \newcommand{\InferenceLatency}{L_{\text{lat,infer}}} \newcommand{\InferenceLoadSocPower}{P_{\text{load}}} \newcommand{\InflatedHullRadius}{r_{\text{inflated}}} \newcommand{\InflightRolloutReservation}{M_{\text{inflight}}} \newcommand{\InfluenceFunction}{I} \newcommand{\InformationTechnologyEnergy}{E_{\text{IT}}} \newcommand{\InformationTechnologyHeatLoad}{\dot{Q}_{\text{IT}}} \newcommand{\InformationTechnologyPower}{P_{\text{IT}}} \newcommand{\InformativeTaskFraction}{p_{\text{inform}}} \newcommand{\IngestionPricePerSample}{C_{\text{ingest/sample}}} \newcommand{\InitialAccuracy}{\text{Accuracy}_0} \newcommand{\InitialBusVoltage}{V_{\text{initial}}} \newcommand{\InitialPositionStandardDeviation}{\sigma_{p,0}} \newcommand{\InitialPositionVelocityCovariance}{\sigma_{pv,0}} \newcommand{\InitialProposalDistribution}{q_{\boldsymbol{\psi}_0}} \newcommand{\InitialStateDistribution}{\rho_0} \newcommand{\InitialTrackingError}{e_0} \newcommand{\InitialVelocityStandardDeviation}{\sigma_{v,0}} \newcommand{\InitiatedTasks}{N} \newcommand{\InjectionBandwidth}{\text{BW}_{\text{inject}}} \newcommand{\InjectionTriggerEpoch}{t_{\text{inject}}} \newcommand{\InnerChainTransform}{\mathbf{T}_{BC}} \newcommand{\InnerLayerFunction}{g} \newcommand{\InnerProductLeftComponent}{a} \newcommand{\InnerProductLeftVector}{\mathbf{a}} \newcommand{\InnerProductRightComponent}{v} \newcommand{\InnerProductRightVector}{\mathbf{b}} \newcommand{\InnovationBias}{b} \newcommand{\InnovationCovariance}{\mathbf{S}} \newcommand{\InnovationVariance}{S} \newcommand{\InputCaptureTime}{T_{\text{capture}}} \newcommand{\InputChannelCount}{C_{\text{in}}} \newcommand{\InputChannelIndex}{c} \newcommand{\InputColumnLieDerivativeOperator}{L_{\mathbf{g}_j}} \newcommand{\InputConsumerAcceleratorCount}{N_{\text{GPU}}} \newcommand{\InputCoordinateCount}{d} \newcommand{\InputDistribution}{p(x)} \newcommand{\InputEventRate}{r_{\text{event}}} \newcommand{\InputFeatureIndex}{i} \newcommand{\InputFeatureVector}{\mathbf{x}} \newcommand{\InputLieDerivativeOperator}{L_{\mathbf{g}}} \newcommand{\InputNodePrimal}{v_{i-N}} \newcommand{\InputPipelineRate}{R_{\text{pipeline}}} \newcommand{\InputPipelineRatio}{r_{\text{pipe}}} \newcommand{\InputPipelineServiceRate}{r_{\text{pipeline}}} \newcommand{\InputPipelineStageIndex}{j} \newcommand{\InputQuantizationScale}{s_X} \newcommand{\InputResolution}{r} \newcommand{\InputStageServiceRate}{r} \newcommand{\InputTokenPrice}{c_{\text{in}}} \newcommand{\InputTokenSequence}{x_{1:S}} \newcommand{\InputVariableIndex}{m} \newcommand{\InsetAvailableBrakingDistance}{D_{\text{avail}}} \newcommand{\InstanceReplenishTime}{T_{\text{init}}} \newcommand{\InstantaneousPhaseCurrent}{i_{\text{phase}}} \newcommand{\InstantaneousRequestOccupancy}{Q} \newcommand{\IntegerWeightCode}{q} \newcommand{\IntegralControlEffort}{\mathbf{u}_{\text{int}}} \newcommand{\IntegralGainMatrix}{\mathbf{K}_{i}} \newcommand{\IntegratedPixelResponse}{I_{\text{pixel}}} \newcommand{\IntegrationCandidateCommitHash}{h_{\text{candidate}}} \newcommand{\IntegrationDummyTime}{t'} \newcommand{\IntegrationHeadCommitHash}{h_{\text{head}}} \newcommand{\IntegrationPoint}{\mathbf{y}} \newcommand{\IntegrationPointCoordinate}{y} \newcommand{\IntegrationTimeInstant}{s} \newcommand{\IntegratorState}{\mathbf{z}} \newcommand{\IntegratorStateRate}{\dot{\mathbf{z}}} \newcommand{\IntegratorUnwindDelay}{T_{\text{unwind}}} \newcommand{\IntegrityProvenance}{\iota} \newcommand{\IntegrityTrustLabel}{\iota} \newcommand{\IntentAcknowledgmentEvent}{e_{\text{flush}}} \newcommand{\IntentAdministrativeLease}{T_{\text{admin}}} \newcommand{\IntentDemonstrationDataset}{\mathcal{D}_{\text{intent}}} \newcommand{\IntentLease}{\mathcal{I}_{\text{intent}}} \newcommand{\IntentLeaseExpiry}{t_{\text{intent\_exp}}} \newcommand{\IntentProposalPeriod}{T_{\text{period}}} \newcommand{\InterAnnotatorAgreement}{\kappa} \newcommand{\InterFeedInterval}{T_{\text{feed}}} \newcommand{\InterGroupColumnDelay}{t_{\text{CCD\_S}}} \newcommand{\InterKernelGapTime}{T_{\text{gap}}} \newcommand{\InterNodeContextParallelDegree}{c_{\text{inter}}} \newcommand{\InterQueryIntervalDeviation}{\sigma_{\text{inter-query}}} \newcommand{\InterSensorClockSkew}{\Delta t_{\text{skew}}} \newcommand{\InteractionHistory}{h} \newcommand{\InteractionPortForce}{F} \newcommand{\InteractionPortVelocity}{v} \newcommand{\InterarrivalVariationCoefficient}{c_{a}} \newcommand{\InterfaceMaterialThermalResistance}{R_{\text{th,TIM}}} \newcommand{\InterferenceSlowdownFactor}{r_{\text{slow}}} \newcommand{\InterframeSpacingTime}{t_{\text{interframe},i}} \newcommand{\InterleavedPipelineBubbleFraction}{b_{\text{interleaved}}} \newcommand{\IntermediateTensorSize}{M_{\text{tensor}}} \newcommand{\InternalDissipationPower}{g} \newcommand{\IntervalCompletionTime}{T_{\text{total}}} \newcommand{\IntervalMean}{\bar{T}} \newcommand{\IntervalMeanOccupancy}{\bar{Q}} \newcommand{\IntervalNormalQuantile}{z} \newcommand{\IntervalStandardDeviation}{\sigma} \newcommand{\IntervalTransitionMatrix}{\boldsymbol{\Phi}} \newcommand{\IntervalVariationCoefficient}{c} \newcommand{\InterventionDensity}{D_{\text{int}}} \newcommand{\InterventionRate}{\lambda_{\text{int}}} \newcommand{\InterventionWindowDuration}{W} \newcommand{\IntraClusterCorrelation}{\rho_{\text{ICC}}} \newcommand{\IntraGroupColumnDelay}{t_{\text{CCD\_L}}} \newcommand{\IntraNodeContextParallelDegree}{c_{\text{intra}}} \newcommand{\IntrusionDistance}{C} \newcommand{\IntrusionDistanceAllowance}{C} \newcommand{\InvalidatedArtifactNode}{v} \newcommand{\InverseDepth}{\rho} \newcommand{\InverseDepthLandmarkParameters}{\mathbf{y}} \newcommand{\InverseKinematicsDamping}{\lambda} \newcommand{\InverseSensorLogOdds}{L_{\text{sensor}}} \newcommand{\InverterCurrentLimit}{I_{\max}} \newcommand{\InverterDeadTime}{t_{\text{dead}}} \newcommand{\IoTransferTime}{T_{\text{IO}}} \newcommand{\IronCaseThermalResistance}{R_{\text{th,iron-case}}} \newcommand{\IronLawComputeTime}{T_{\text{compute}}} \newcommand{\IronLawMemoryTime}{T_{\text{memory}}} \newcommand{\IronLossPower}{P_{\text{iron}}} \newcommand{\IronThermalCapacitance}{C_{\text{iron}}} \newcommand{\IrreducibleLoss}{C_{\mathcal{L}}} \newcommand{\IsolatedEnforcerExecutionTime}{t_{\text{iso}}} \newcommand{\IsolatedJobRunTime}{T} \newcommand{\IspProcessingTime}{t_{\text{ISP}}} \newcommand{\IsrExecutionTime}{t_{\text{ISR}}} \newcommand{\IterationCost}{C_{\text{iter}}} \newcommand{\IterationTokenBudget}{N_{\text{budget}}} \newcommand{\JaccardSimilarity}{J} \newcommand{\JacobianLeftSingularMatrix}{\mathbf{U}} \newcommand{\JacobianLeftSingularVector}{\mathbf{u}} \newcommand{\JacobianPseudoinverse}{\mathbf{J}^\dagger} \newcommand{\JacobianRightSingularMatrix}{\mathbf{V}} \newcommand{\JacobianRightSingularVector}{\mathbf{v}} \newcommand{\JacobianSingularNumber}{\sigma} \newcommand{\JacobianSingularNumberMatrix}{\boldsymbol{\Sigma}} \newcommand{\JawAperture}{w_{\text{aperture}}} \newcommand{\JensenShannonDivergence}{\mathcal{D}_{\text{JS}}} \newcommand{\JensenShannonMixtureDistribution}{\bar{P}} \newcommand{\JerkLimit}{j_{\max}} \newcommand{\JerkWeightMatrix}{\mathbf{W}_j} \newcommand{\JitterBufferPlayoutDelay}{T_{\text{buf}}} \newcommand{\JobAbsoluteDeadline}{d} \newcommand{\JobAvailability}{A_{\text{all}}} \newcommand{\JobDuration}{T_{\text{job}}} \newcommand{\JobIndex}{j} \newcommand{\JobQueueWaitTime}{W} \newcommand{\JobReleaseTime}{r} \newcommand{\JobRestartTime}{T_{\text{restart}}} \newcommand{\JobSlowdown}{S} \newcommand{\JobStartupTime}{T_{\text{startup}}} \newcommand{\JointAcceleration}{\ddot{q}} \newcommand{\JointAngle}{\theta_{\text{joint}}} \newcommand{\JointAngleLowerLimit}{q_{\min}} \newcommand{\JointAngleUpperLimit}{q_{\max}} \newcommand{\JointAngularAcceleration}{\dot{\omega}} \newcommand{\JointAngularRate}{\omega} \newcommand{\JointAngularSpeed}{\omega} \newcommand{\JointBaseInertiaCoupling}{\mathbf{M}_{jb}} \newcommand{\JointBiasTorque}{\tau_{\text{bias}}} \newcommand{\JointCoordinate}{q} \newcommand{\JointCount}{n} \newcommand{\JointFrictionTorque}{\tau_{\text{fric}}} \newcommand{\JointIndex}{i} \newcommand{\JointJerk}{j_{\text{joint}}} \newcommand{\JointLoadTorque}{\tau_{\text{load}}} \newcommand{\JointOutputImpedance}{Z_{\text{out}}} \newcommand{\JointOutputTorque}{\tau_{\text{out}}} \newcommand{\JointPathCurvature}{\mathbf{q}''} \newcommand{\JointPathTangent}{\mathbf{q}'} \newcommand{\JointPosition}{q} \newcommand{\JointPositionLowerLimit}{\mathbf{q}_{\min}} \newcommand{\JointPositionSetpoint}{\mathbf{q}^*} \newcommand{\JointPositionTarget}{q_{\text{des}}} \newcommand{\JointPositionUpperLimit}{\mathbf{q}_{\max}} \newcommand{\JointReflectedRotorInertia}{J_{m}} \newcommand{\JointSampleTimestamp}{t_{\text{joint}}} \newcommand{\JointTorque}{\boldsymbol{\tau}} \newcommand{\JointTorqueConstant}{K_t} \newcommand{\JointTorqueLimit}{\tau_{\max}} \newcommand{\JointTorqueLimits}{\boldsymbol{\tau}_{\max}} \newcommand{\JointTorqueLowerLimit}{\boldsymbol{\tau}_{\min}} \newcommand{\JointTorqueSlew}{\dot{\boldsymbol{\tau}}} \newcommand{\JointTorqueSlewLimit}{\dot{\boldsymbol{\tau}}_{\max}} \newcommand{\JointTorqueTarget}{\tau_{\text{des}}} \newcommand{\JointTorqueUpperLimit}{\boldsymbol{\tau}_{\max}} \newcommand{\JointTorsionalStiffnessMatrix}{\mathbf{K}} \newcommand{\JointTrackingError}{\mathbf{e}} \newcommand{\JointVelocity}{\dot{q}} \newcommand{\JointVelocityCeiling}{\dot{q}_{\max}} \newcommand{\JointVelocityLimit}{\dot{\mathbf{q}}_{\max}} \newcommand{\JointVelocitySetpoint}{\dot{\mathbf{q}}^*} \newcommand{\JointVelocityTarget}{\dot{q}_{\text{des}}} \newcommand{\JouleanTemperatureRise}{\Delta T} \newcommand{\JunctionAmbientThermalResistance}{R_{\text{th,JA}}} \newcommand{\JunctionCaseThermalResistance}{R_{\text{th,JC}}} \newcommand{\JunctionTemperature}{T_{\text{j}}} \newcommand{\KalmanBucyObserverGain}{\mathbf{L}} \newcommand{\KalmanGain}{\mathbf{G}} \newcommand{\KeepContextPathCost}{C_{\text{keep}}} \newcommand{\KendallMarkovianCode}{M} \newcommand{\KernelActiveTime}{T_{\text{compute}}} \newcommand{\KernelColumnOffset}{n} \newcommand{\KernelExecutionTime}{T_{\text{kernel}}} \newcommand{\KernelHeight}{K_h} \newcommand{\KernelHorizontalLoopOffset}{k_{x}} \newcommand{\KernelRowOffset}{m} \newcommand{\KernelSize}{K} \newcommand{\KernelVerticalLoopOffset}{k_{y}} \newcommand{\KernelWeight}{W} \newcommand{\KernelWidth}{K_w} \newcommand{\KeyAxisLabel}{j} \newcommand{\KeyBufferPosition}{j} \newcommand{\KeyComponent}{k_{jm}} \newcommand{\KeyLeftSingularMatrix}{\mathbf{U}} \newcommand{\KeyLeftSingularVector}{\mathbf{u}} \newcommand{\KeyProjectionMatrix}{\mathbf{W}_{K}} \newcommand{\KeyRightSingularMatrix}{\mathbf{V}} \newcommand{\KeyRightSingularVector}{\mathbf{v}} \newcommand{\KeySingularNumber}{\sigma} \newcommand{\KeySingularSpectrumMatrix}{\mathbf{\Sigma}} \newcommand{\KeySourceMatrix}{\mathbf{X}_{K}} \newcommand{\KeySpectrumLength}{q} \newcommand{\KeyVector}{\mathbf{k}} \newcommand{\KineticEnergy}{E_k} \newcommand{\KineticEnergyCeiling}{E_{\max}} \newcommand{\KineticInsetBarrierFunction}{h_{\text{kinetic}}} \newcommand{\KineticInsetBarrierRate}{\dot{h}_{\text{kinetic}}} \newcommand{\KlDivergence}{\mathcal{D}_{\text{KL}}} \newcommand{\KlPenaltyCoefficient}{\beta_{\text{KL}}} \newcommand{\KlSampleStatistic}{d} \newcommand{\KnownComponentStopDistance}{d_{\text{budget}}} \newcommand{\KolmogorovSmirnovCriticalThreshold}{c_{\text{crit}}} \newcommand{\KolmogorovSmirnovStatistic}{\mathcal{D}_{\text{KS}}} \newcommand{\KroneckerIndicator}{\delta} \newcommand{\KrumClientCount}{n} \newcommand{\KrylovSubspace}{\mathcal{K}} \newcommand{\KsCriticalCoefficient}{c} \newcommand{\KvBlockSize}{S_{\text{blk}}} \newcommand{\KvBlockTailWaste}{\Delta_{\text{tail}}} \newcommand{\KvCacheBytesPerToken}{m_{\text{token}}} \newcommand{\KvCacheHandoffTime}{T_{\text{handoff}}} \newcommand{\KvCacheMemory}{M_{\text{KV}}} \newcommand{\KvElementStorageSize}{s_{\text{elem,KV}}} \newcommand{\KvHeadCount}{H_{\text{KV}}} \newcommand{\KvPoolHeadroomFraction}{f_{\text{head}}} \newcommand{\KvPoolMemory}{M_{\text{pool}}} \newcommand{\KvRecomputeTime}{T_{\text{recompute}}} \newcommand{\KvReloadTime}{T_{\text{reload}}} \newcommand{\KvTileCount}{T_c} \newcommand{\KvTileIndex}{j} \newcommand{\KvTileSize}{B_c} \newcommand{\LaSalleInvariantSet}{\Omega} \newcommand{\LabelCategoryIndex}{i} \newcommand{\LabelVector}{\mathbf{y}} \newcommand{\LabeledRecord}{x} \newcommand{\LabeledSampleCount}{D_{\text{labeled}}} \newcommand{\LabelingRoundIndex}{k} \newcommand{\LaggedModelInput}{x_{t-\Delta}} \newcommand{\LaggedStateDigest}{h_{\text{state},t-k}} \newcommand{\LandmarkDepth}{d} \newcommand{\LanguageInstruction}{c_{\text{instr}}} \newcommand{\LanguageSkillPrior}{p_{\text{LLM}}} \newcommand{\LaplaceLikelihoodScale}{b} \newcommand{\LaplaceNoiseSample}{x} \newcommand{\LaplaceNoiseScale}{b} \newcommand{\LaplaceVariable}{s} \newcommand{\LargestDrivenWheelLoadShare}{\varphi} \newcommand{\LargestEigenvalue}{\lambda_{\max}} \newcommand{\LargestInvariantSet}{\mathcal{M}} \newcommand{\LargestSingularNumber}{\sigma_{\max}} \newcommand{\LarsGlobalLearningRate}{\eta_{\text{global}}} \newcommand{\LastCandidateEmbeddingVector}{\mathbf{x}_N} \newcommand{\LastFunctionInputComponent}{x_N} \newcommand{\LastMeasurementTime}{t_{\text{last}}} \newcommand{\LastRankComputeTime}{T_{\text{rank}_{N-1}}} \newcommand{\LatchApproachSpeed}{v_{\text{latch}}} \newcommand{\LatchClearance}{c} \newcommand{\LatchContactForce}{f} \newcommand{\LatchForceLimit}{F_{\text{lim}}} \newcommand{\LatchPlateStiffness}{k_{\text{latch}}} \newcommand{\LatchStallForce}{F} \newcommand{\LatchStrengthFloor}{F_{\text{floor}}} \newcommand{\LateHandoffProbability}{p} \newcommand{\Latency}{L_{\text{lat}}} \newcommand{\LatencyBandwidthCrossoverSize}{n^*} \newcommand{\LatencyBoundedBatchSize}{B_{\text{SLO}}} \newcommand{\LatencyObjective}{S_{\text{latency}}} \newcommand{\LatencyQuantileFunction}{Q_p} \newcommand{\LatencyRewardExponent}{\beta_{\text{lat}}} \newcommand{\LatencySlo}{L_{\text{lat,SLO}}} \newcommand{\LatentActionComponent}{u} \newcommand{\LatentComponentMean}{\mu_{\phi, j}} \newcommand{\LatentComponentStandardDeviation}{\sigma_{\phi, j}} \newcommand{\LatentDimension}{d_z} \newcommand{\LatentGaussianPolicyDensity}{\mu} \newcommand{\LatentKlWeight}{\beta} \newcommand{\LatentPosteriorDistribution}{q} \newcommand{\LatentPosteriorMean}{\boldsymbol{\mu}_\phi} \newcommand{\LatentPosteriorStandardDeviation}{\boldsymbol{\sigma}_\phi} \newcommand{\LatentStateEncoder}{q_\phi} \newcommand{\LatentStyleVariable}{\mathbf{z}} \newcommand{\LatentVariableSpace}{\mathcal{Z}} \newcommand{\LaterBaseFlangeTransform}{\mathbf{T}_{\text{base}, k+1}^{\text{flange}}} \newcommand{\LaterCameraTargetTransform}{\mathbf{T}_{\text{cam}, k+1}^{\text{target}}} \newcommand{\LaterRolloutTurnIndex}{j} \newcommand{\LaterStepIndex}{j} \newcommand{\LateralClearance}{W_{\text{clear}}} \newcommand{\LatestSequentialObservation}{X_m} \newcommand{\LayerAllReduceTime}{T_{\text{layer comm}}} \newcommand{\LayerBackwardTime}{T_{\text{layer backward}}} \newcommand{\LayerCount}{N_L} \newcommand{\LayerExposedCommunicationTime}{T_{\text{exposed}}} \newcommand{\LayerFunction}{f} \newcommand{\LayerIndex}{\ell} \newcommand{\LayerInputComponent}{x} \newcommand{\LayerInputMatrix}{\mathbf{X}} \newcommand{\LayerInputVector}{\mathbf{x}} \newcommand{\LayerInputWidth}{d_{\text{in}}} \newcommand{\LayerIntermediateStateMemory}{s_{\ell}} \newcommand{\LayerNonlinearity}{\phi} \newcommand{\LayerNormMean}{\mu_{\text{LN}}} \newcommand{\LayerNormStandardDeviation}{\sigma_{\text{LN}}} \newcommand{\LayerOutputMatrix}{\mathbf{Y}} \newcommand{\LayerOutputVector}{\mathbf{y}} \newcommand{\LayerOutputWidth}{d_{\text{out}}} \newcommand{\LayerParameterPayload}{M_{\text{layer}}} \newcommand{\LayerSavedTensorCount}{n_{\text{saved}}} \newcommand{\LayerSelectionIndex}{i} \newcommand{\LayerWeightEntry}{W} \newcommand{\LayerWeights}{\mathbf{w}} \newcommand{\LayerWidth}{n} \newcommand{\LcResonantFrequency}{f_0} \newcommand{\LeaderForwardWave}{\mathbf{u}_m} \newcommand{\LeaderJointPositions}{\mathbf{q}_{\text{leader}}} \newcommand{\LeaderPortEffort}{\mathbf{F}_m} \newcommand{\LeaderPortFlow}{\dot{\mathbf{x}}_m} \newcommand{\LeaderPortPower}{P_m} \newcommand{\LeaderReturnWave}{\mathbf{w}_m} \newcommand{\LeaderWristRollAngle}{\theta_{\text{roll}}} \newcommand{\LeadingSupportDistance}{d_{\text{lead}}} \newcommand{\LeakageCurrent}{I_{\text{leak}}} \newcommand{\LeakagePower}{P_{\text{leakage}}} \newcommand{\LearnedActionProposal}{\hat{\mathbf{a}}_{\text{learned}}} \newcommand{\LearnedNominalTrajectory}{\hat{\mathbf{q}}_{\text{learned}}} \newcommand{\LearnedRemainingReturnEstimate}{\widehat{V}} \newcommand{\LearnedVelocityField}{v_\theta} \newcommand{\LearnerStateDisagreementRate}{\epsilon_\pi} \newcommand{\LearnerStateVisitationDistribution}{p^{\pi}} \newcommand{\LearningCurveSampleCount}{n} \newcommand{\LearningRate}{\eta} \newcommand{\LeaseAdmissionInstant}{t_{\text{adm}}} \newcommand{\LeaseDirtyMemory}{M_{\text{dirty}}} \newcommand{\LeaseExpiryDelaySubtotal}{\tau_{\text{delay,sub}}} \newcommand{\LeaseHoldTime}{T_{\text{hold}}} \newcommand{\LeasePathTravel}{d_{\text{lease}}} \newcommand{\LeaseRefreshInstant}{t_{\text{refresh}}} \newcommand{\LeftEvasionAction}{\mathbf{a}_{\text{left}}} \newcommand{\LeftSingularVectorMatrix}{\mathbf{P}} \newcommand{\LengthPenaltyWeight}{\lambda_{\text{len}}} \newcommand{\LeverArmLength}{r_{\text{arm}}} \newcommand{\LeverArmSweepError}{e_{\text{rot}}} \newcommand{\LewisFormFactor}{Y} \newcommand{\LexicalDocument}{x} \newcommand{\LexicalFrequencySaturation}{k_1} \newcommand{\LexicalLengthNormalization}{b} \newcommand{\LexicalQuery}{Q} \newcommand{\LidarAzimuthAngle}{\theta_{\text{az}}} \newcommand{\LidarBeamDirection}{\mathbf{d}} \newcommand{\LidarElevationAngle}{\phi} \newcommand{\LidarFramePoint}{\mathbf{p}_{\text{lidar}}} \newcommand{\LidarReferenceFrame}{\mathcal{F}_{\text{lidar}}} \newcommand{\LidarScanRate}{f_{\text{scan}}} \newcommand{\LidarSweepPeriod}{T_{\text{sweep}}} \newcommand{\LidarSweepStartTime}{t_{\text{sweep}}} \newcommand{\LieDerivativeAlongControl}{L_{\mathbf{g}} h} \newcommand{\LieDerivativeAlongDrift}{L_{\mathbf{f}} h} \newcommand{\LieDerivativeOrder}{k} \newcommand{\LikelihoodRatioWeight}{w} \newcommand{\LimitMarginFunction}{M} \newcommand{\LinearAcceleration}{\mathbf{a}} \newcommand{\LinearBarrierDecayRate}{\gamma_{\text{cbf}}} \newcommand{\LinearMomentum}{p} \newcommand{\LinearizedVirtualInput}{\mathbf{v}} \newcommand{\LinkAngularAcceleration}{\ddot{\theta}_{\text{link}}} \newcommand{\LinkBandwidth}{\beta} \newcommand{\LinkBitRate}{R_{\text{link}}} \newcommand{\LinkLength}{l} \newcommand{\LinkOutputPosition}{q_{\text{out}}} \newcommand{\LintFalseAcceptFraction}{\phi} \newcommand{\LipschitzConstant}{K} \newcommand{\LiveAutomatonStateSet}{Q_{\text{live}}} \newcommand{\LoadCurrent}{I_{\text{load}}} \newcommand{\LoadInertia}{J_{\text{load}}} \newcommand{\LoadStepCurrentDeficit}{\Delta I_{\text{step}}} \newcommand{\LoadStepDeficitDuration}{\Delta t_{\text{step}}} \newcommand{\LoadedEnforcerExecutionTime}{t_{\text{enf}}} \newcommand{\LoadedJunctionTemperature}{T_{\text{load}}} \newcommand{\LocalBatchSize}{B_{\text{local}}} \newcommand{\LocalEpochCount}{E} \newcommand{\LocalGradient}{\mathbf{g}} \newcommand{\LocalInferenceEnergy}{E_{\text{local}}} \newcommand{\LocalPathTime}{T_{\text{local}}} \newcommand{\LocalRankIndex}{i} \newcommand{\LocalTokenCount}{B_{\text{tok}}} \newcommand{\LocalUpdateCount}{H_{\text{local}}} \newcommand{\LocalityPenaltyFunction}{w} \newcommand{\LocalizationBound}{\delta_{\text{loc}}} \newcommand{\LogFailureRatio}{s_{\text{fail}}} \newcommand{\LogOddsLowerClamp}{L_{\min}} \newcommand{\LogOddsUpperClamp}{L_{\max}} \newcommand{\LogPositionIndex}{j} \newcommand{\LoggedEvent}{e} \newcommand{\LoggedEventPrefix}{\mathbf{e}_{1:j}} \newcommand{\LoggpLongMessageTime}{T_{\text{long}}} \newcommand{\LogisticProbability}{p_{\text{sig}}} \newcommand{\LogitMask}{\mathbf{M}} \newcommand{\LogitMaskEntry}{M} \newcommand{\LogitStorageSize}{s_{\text{logit}}} \newcommand{\LogitVector}{\mathbf{z}} \newcommand{\LogpNetworkLatency}{L_{\text{LogGP}}} \newcommand{\LonePassAdvantage}{\hat{A}_{\text{pass}}} \newcommand{\LongMessageGapPerByte}{G} \newcommand{\LongestInterruptMaskTime}{t_{\text{irq\_disabled,max}}} \newcommand{\LongitudinalFrictionCoefficient}{\mu_x} \newcommand{\LongitudinalSlipRatio}{\lambda} \newcommand{\LongitudinalTractionStiffness}{C_x} \newcommand{\LongitudinalVehicleSpeed}{v_x} \newcommand{\LookaheadStepIndex}{l} \newcommand{\LoopAcceptanceProbability}{p_{\text{loop}}} \newcommand{\LoopGainScalingFactor}{\kappa} \newcommand{\LoopNestDepth}{n_{\text{loops}}} \newcommand{\LoopOrderCount}{N_{\text{order}}} \newcommand{\LoopParallelizationChoiceCount}{\mathcal{P}_{\text{parallel}}} \newcommand{\LoopTurnCost}{C} \newcommand{\Loss}{L} \newcommand{\LossAdjointSeed}{\bar{\mathcal{L}}} \newcommand{\LossFunction}{\mathcal{L}} \newcommand{\LossGradient}{g} \newcommand{\LossGradientVector}{\mathbf{g}} \newcommand{\LossHessian}{\mathbf{H}} \newcommand{\LossLowerBound}{\mathcal{L}_{\inf}} \newcommand{\LossScaleFactor}{s_{\text{loss}}} \newcommand{\LossTimeDerivative}{\dot{\mathcal{L}}} \newcommand{\LostMotionDeflection}{\delta_{\text{lost}}} \newcommand{\LostSuffixTurnCount}{H_{\text{suffix},i}} \newcommand{\LostWorkReplayTime}{T_{\text{replay}}} \newcommand{\LotSamplingProbability}{q} \newcommand{\LowRankLeftFactor}{\mathbf{U}} \newcommand{\LowRankRightFactor}{\mathbf{V}} \newcommand{\LowerPriorityFrames}{lp} \newcommand{\LowerPriorityTasks}{lp} \newcommand{\LowerRatioClippingWidth}{\epsilon_{\text{low}}} \newcommand{\LqrControlWeightMatrix}{\mathbf{R}_u} \newcommand{\LqrCostToGoMatrix}{\mathbf{P}} \newcommand{\LqrFeedbackGain}{\mathbf{K}_{\text{lqr}}} \newcommand{\LqrQuadraticObjective}{J} \newcommand{\LqrStateWeightMatrix}{\mathbf{Q}_x} \newcommand{\LshBandCount}{L} \newcommand{\LshCandidateProbability}{p_{\text{candidate}}} \newcommand{\LshRowsPerBand}{r} \newcommand{\LyapunovAnalysisDomain}{\mathcal{D}} \newcommand{\LyapunovFunction}{V} \newcommand{\LyapunovFunctionDerivative}{\dot{V}} \newcommand{\LyapunovPositivityMargin}{\epsilon_{\text{pos}}} \newcommand{\LyapunovSublevelSet}{\Omega_c} \newcommand{\MacAccumulator}{\text{acc}} \newcommand{\MachineTaxonomyAxis}{\mathsf{Machine}} \newcommand{\MahalanobisDistance}{d_M} \newcommand{\ManifestTrackIndex}{k} \newcommand{\ManipulatorBaseFrame}{\mathcal{F}_{\text{base}}} \newcommand{\ManipulatorJacobian}{\mathbf{J}} \newcommand{\ManualLease}{T_{\text{lease,man}}} \newcommand{\ManualResetTime}{t_{\text{reset,manual}}} \newcommand{\ManualReviewCost}{C_{\text{manual}}} \newcommand{\ManualReviewFraction}{r_{\text{manual}}} \newcommand{\MapCovarianceJacobian}{\mathbf{J}_{\text{map}}} \newcommand{\MapOdometryTransform}{\mathbf{T}_{\text{map}}^{\text{odom}}} \newcommand{\MapParameterEstimate}{\theta_{\text{MAP}}} \newcommand{\MapPoseCovariance}{\boldsymbol{\Sigma}_{\text{map}}} \newcommand{\MapReferenceFrame}{\mathcal{F}_{\text{map}}} \newcommand{\MappedCommandTap}{a_{\text{cmd}}} \newcommand{\MappingSearchSpaceSize}{\mathcal{S}_{\text{mapping}}} \newcommand{\MarginalFalseApprovalProbability}{p} \newcommand{\MarginalRequestServiceTime}{t_{\text{req}}} \newcommand{\MarginalStoppingThreshold}{\epsilon_{\text{stop}}} \newcommand{\MarginalVelocityField}{u} \newcommand{\MarginalizedModelParameters}{\theta'} \newcommand{\MarkovDecisionProcess}{\mathcal{M}} \newcommand{\MaskTokenIndex}{i} \newcommand{\MaskedClientUpdate}{\mathbf{y}} \newcommand{\MaskedFinetuningLoss}{\mathcal{L}_{\text{SFT}}} \newcommand{\MaskedImitationDataset}{\mathcal{D}_{\text{train}}} \newcommand{\MaskedImitationLoss}{\mathcal{L}_{\text{imitation}}} \newcommand{\MaskedLogitVector}{\mathbf{z}'} \newcommand{\MaskedTokenLogit}{z'} \newcommand{\Mass}{m} \newcommand{\MassCenterAcceleration}{\ddot{\mathbf{c}}} \newcommand{\MassCenterHeight}{z_c} \newcommand{\MassCenterPosition}{\mathbf{c}} \newcommand{\MasterProcessingTime}{t_{\text{master}}} \newcommand{\MatchingRowCount}{K} \newcommand{\MatrixColumnIndex}{j} \newcommand{\MatrixEigenvalue}{\lambda} \newcommand{\MatrixMultiplyDestination}{\mathbf{D}} \newcommand{\MatrixRowIndex}{i} \newcommand{\MaxBatchSize}{B_{\text{max}}} \newcommand{\MaxBatchingWindow}{T_{\text{max}}} \newcommand{\MaxReceivedTokenCount}{B_{\text{max}}} \newcommand{\MaxResidentContextCount}{B_{\max}} \newcommand{\MaximumActuatorEffort}{u_{\max}} \newcommand{\MaximumBreakerCooldownInterval}{T_{\text{cool}}^{\max}} \newcommand{\MaximumCompletionOffset}{c_{\max}} \newcommand{\MaximumDepthHypothesis}{d_{\max}} \newcommand{\MaximumEntropyObjective}{J} \newcommand{\MaximumLoadCurrentStep}{\Delta I_{\max}} \newcommand{\MaximumLogit}{z_{\max}} \newcommand{\MaximumObservationAge}{t_{\text{age},\max}} \newcommand{\MaximumPlateIndentation}{x_{\max}} \newcommand{\MaximumRetryBackoffInterval}{b_{\max}} \newcommand{\MaximumTurnOffDelay}{t_{\text{off, max}}} \newcommand{\McnemarTestStatistic}{\chi^2} \newcommand{\McuCaptureTime}{t_{\text{MCU,capture}}} \newcommand{\McuDispatchTime}{t_{\text{MCU,dispatch}}} \newcommand{\MealTokenKeyVector}{\mathbf{k}_{\text{meal}}} \newcommand{\MealTokenQueryVector}{\mathbf{q}_{\text{meal}}} \newcommand{\MeanAcceptedDraftLength}{\bar{m}} \newcommand{\MeanAttemptCost}{c} \newcommand{\MeanClusterSize}{m} \newcommand{\MeanContextLength}{\bar{S}} \newcommand{\MeanDeliveryPayloadLength}{L} \newcommand{\MeanDocumentLength}{\overline{|x|}} \newcommand{\MeanHoldTime}{\bar{T}_{\text{hold}}} \newcommand{\MeanLatchContactForce}{\bar{F}} \newcommand{\MeanMessageQueueDelay}{\bar{T}_q} \newcommand{\MeanNeesStatistic}{\bar{\epsilon}} \newcommand{\MeanQueryDistance}{\mu_D} \newcommand{\MeanRolloutLength}{\bar{N}} \newcommand{\MeanSlotOccupancy}{\bar{N}_{\text{slot}}} \newcommand{\MeanSquaredErrorCloningLoss}{\mathcal{L}_{\text{MSE}}} \newcommand{\MeanStoredTokensPerRecord}{\bar{S}} \newcommand{\MeanTargetTokensPerRecord}{\bar{w}} \newcommand{\MeanTimeBetweenFailures}{\text{MTBF}} \newcommand{\MeanTimeToFailure}{\text{MTTF}} \newcommand{\MeanTimeToRepair}{\text{MTTR}} \newcommand{\MeanVerifierServiceTime}{\bar{T}_{\text{svc}}} \newcommand{\MeasuredAxisPosition}{x_{\text{meas}}} \newcommand{\MeasuredContactForce}{\mathbf{F}_{\text{contact}}} \newcommand{\MeasuredJointVelocities}{\dot{\mathbf{q}}_{\text{meas}}} \newcommand{\MeasuredPixelDepth}{Z_{\text{meas}}} \newcommand{\MeasuredResponseTap}{a_{\text{meas}}} \newcommand{\MeasuredSeamAccelerations}{\ddot{\mathbf{q}}_{\text{meas}}} \newcommand{\MeasuredSeamConfiguration}{\mathbf{q}_{\text{meas}}} \newcommand{\MeasuredSeamVelocities}{\dot{\mathbf{q}}_{\text{meas}}} \newcommand{\MeasuredTrackedPosition}{\mathbf{p}_{\text{meas}}} \newcommand{\MeasurementCovariance}{\boldsymbol{\Sigma}_z} \newcommand{\MeasurementDimension}{m} \newcommand{\MeasurementErrorStandardDeviation}{\sigma} \newcommand{\MeasurementFunction}{h} \newcommand{\MeasurementHistory}{\mathbf{y}_{1:k}} \newcommand{\MeasurementInnovation}{\boldsymbol{\nu}} \newcommand{\MeasurementMatrix}{\mathbf{H}} \newcommand{\MeasurementNoiseCovariance}{\boldsymbol{\Sigma}_{\text{meas}}} \newcommand{\MeasurementNoiseVector}{\mathbf{v}_{\text{meas}}} \newcommand{\MeasurementVector}{\mathbf{y}} \newcommand{\MeasurementVectorDerivative}{\dot{\mathbf{y}}} \newcommand{\MeasurementWindowEnd}{t_{\text{end}}} \newcommand{\MechanicalEnergy}{E} \newcommand{\MechanicalEnergyDerivative}{\dot{E}} \newcommand{\MechanicalImpedanceMap}{Z} \newcommand{\MechanicalPlantState}{\mathbf{x}} \newcommand{\MechanicalWork}{W} \newcommand{\MechanismAcceptanceProbability}{p'_{\text{acc}}} \newcommand{\MechanismAttemptCost}{C'_{\text{attempt}}} \newcommand{\MechanismLogMoment}{\alpha_{\mathcal{M}}} \newcommand{\MechanismOutcome}{o} \newcommand{\MechanismOutputSet}{\mathcal{S}} \newcommand{\MechanismOutputVector}{\mathbf{y}} \newcommand{\MechanismRenyiPrivacyBudget}{\epsilon_{\text{R},i}} \newcommand{\MemoryBusQueueDelay}{t_{\text{queue}}} \newcommand{\MemoryEntryBirthGeneration}{g_{\text{birth}}} \newcommand{\MemoryEntryDeathGeneration}{g_{\text{death}}} \newcommand{\MemoryHierarchyLevelCount}{N_{\text{mem}}} \newcommand{\MemoryHoldDuringWait}{O_{\text{mem}}} \newcommand{\MemoryPlacementCount}{\mathcal{M}_{\text{placement}}} \newcommand{\MemorySubsystemEnergy}{E_{\text{memory}}} \newcommand{\MergedAttentionOutput}{\mathbf{O}^{\text{new}}} \newcommand{\MergedSoftmaxMaximum}{m^{\text{new}}} \newcommand{\MergedSoftmaxNormalizer}{z^{\text{new}}} \newcommand{\MergedWeightMatrix}{\mathbf{W}_{\text{final}}} \newcommand{\MessageInjectionGap}{g} \newcommand{\MessageQueueDelay}{T_q} \newcommand{\MessageStartupLatency}{\alpha} \newcommand{\MessageTimestamp}{t_{\text{msg}}} \newcommand{\MetricDepth}{z_{\text{metric}}} \newcommand{\MicroUnitPrefix}{\text{µ}} \newcommand{\MicrobatchCount}{m} \newcommand{\MicrobatchGradient}{\mathbf{g}} \newcommand{\MicrobatchIndex}{j} \newcommand{\MicrobatchPassTime}{T_{\text{micro},j}} \newcommand{\MicrobatchSize}{B_{\text{micro}}} \newcommand{\MicrocontrollerClockTime}{t_{\text{MCU}}} \newcommand{\MillerCapacitance}{C_{\text{gd}}} \newcommand{\MillerCharge}{Q_{\text{gd}}} \newcommand{\MillerDisplacementCurrent}{I_{\text{miller}}} \newcommand{\MillerPlateauDuration}{t_{\text{plateau}}} \newcommand{\MillerPlateauVoltage}{V_{\text{plateau}}} \newcommand{\MinHashPermutation}{\sigma} \newcommand{\MinHashPermutationCount}{n_{\sigma}} \newcommand{\MinHashSketchSize}{s} \newcommand{\MiniBatchActivation}{a} \newcommand{\MiniBatchSet}{\mathcal{B}} \newcommand{\MinibatchGradient}{\mathbf{g}} \newcommand{\MinimumActuatorEffort}{u_{\min}} \newcommand{\MinimumCellSupportCount}{N_{\min}} \newcommand{\MinimumChunkSetpointCount}{h_{\min}} \newcommand{\MinimumCompletionOffset}{c_{\min}} \newcommand{\MinimumDepthHypothesis}{d_{\min}} \newcommand{\MinimumDetectableEffect}{\delta_{\text{MDE}}} \newcommand{\MinimumPrefetchBufferCount}{Q_{\text{prefetch,min}}} \newcommand{\MinimumRailVoltage}{V_{\text{rail,min}}} \newcommand{\MinimumRoundTripLatency}{L_{\text{lat,min}}} \newcommand{\MinimumStableBatchSize}{B_{\text{min}}} \newcommand{\MinimumTransitTime}{t_{\min}} \newcommand{\MinimumTurnOnDelay}{t_{\text{on, min}}} \newcommand{\MisclassifiedFraction}{r_{\text{error}}} \newcommand{\MisroutedQueryFraction}{m} \newcommand{\MissAcceptanceProbability}{\alpha} \newcommand{\MissPathServiceTime}{T_{\text{cold}}} \newcommand{\MissionDuration}{T_{\text{mission}}} \newcommand{\MissionEnergy}{E_{\text{mission}}} \newcommand{\MissionExceedanceBudget}{\epsilon_{\text{mission}}} \newcommand{\MissionHandoffCount}{K} \newcommand{\MixtureComponentCount}{M} \newcommand{\MixtureComponentCovariance}{\boldsymbol{\Sigma}_m} \newcommand{\MixtureComponentIndex}{m} \newcommand{\MixtureComponentMean}{\boldsymbol{\mu}_m} \newcommand{\MixtureComponentWeight}{w_m} \newcommand{\MixupSample}{\tilde{x}} \newcommand{\MixupWeight}{\lambda_{\text{mix}}} \newcommand{\MlProductivityGoodput}{\text{MPG}} \newcommand{\MlpWeightArithmeticIntensity}{I_{\text{MLP}}} \newcommand{\MobileBaseBarrierFunction}{h_{\text{base}}} \newcommand{\MobilenetWidthMultiplier}{\alpha_{\text{width}}} \newcommand{\ModelBandwidthUtilization}{\text{MBU}} \newcommand{\ModelCallIndex}{i} \newcommand{\ModelCallRequest}{\mathcal{R}} \newcommand{\ModelDownloadEnergy}{E_{\text{download}}} \newcommand{\ModelFlopsUtilization}{\text{MFU}} \newcommand{\ModelGenerationIndex}{n} \newcommand{\ModelInput}{x} \newcommand{\ModelLifetimeCost}{C_{\text{total}}} \newcommand{\ModelParameters}{\theta} \newcommand{\ModelPointAbscissa}{X} \newcommand{\ModelPointHeight}{Z} \newcommand{\ModelPointOrdinate}{Y} \newcommand{\ModelPrediction}{\hat{y}} \newcommand{\ModelPredictor}{f} \newcommand{\ModelScore}{s} \newcommand{\ModelStepOperations}{O_{\text{model}}} \newcommand{\ModelTime}{T_{\text{model}}} \newcommand{\ModelTimeFraction}{f} \newcommand{\ModelWeight}{w} \newcommand{\MomentOrder}{\lambda_{\text{mom}}} \newcommand{\MonitorStartupTime}{T_{\text{vmm}}} \newcommand{\MonitoredFairnessMetricCount}{m} \newcommand{\MonitoredFeatureLevel}{x_{\text{feat}}} \newcommand{\MonitoredGroupCount}{k} \newcommand{\MonitoredMetric}{X} \newcommand{\MonitoredMetricMean}{\mu} \newcommand{\MonitoredMetricStandardDeviation}{\sigma} \newcommand{\MonitoringAlertCost}{C_{\text{alert}}} \newcommand{\MonitoringComputeCost}{C_{\text{compute}}} \newcommand{\MonitoringCostComponent}{C_*} \newcommand{\MonitoringIngestionCost}{C_{\text{ingest}}} \newcommand{\MonitoringStorageCost}{C_{\text{storage}}} \newcommand{\MonotonicClockInstant}{t} \newcommand{\MonthlyOptimizationSavings}{C_{\text{save,monthly}}} \newcommand{\MotionBlurLength}{L} \newcommand{\MotionCyclePeriod}{T_{\text{cycle}}} \newcommand{\MotionModelInput}{\mathbf{u}} \newcommand{\MotorBackEmfConstant}{K_e} \newcommand{\MotorConstant}{K_m} \newcommand{\MotorPhaseRmsCurrent}{I_{\text{phase}}} \newcommand{\MotorRotorAccelerations}{\ddot{\boldsymbol{\theta}}_{\text{motor}}} \newcommand{\MotorRotorCoordinates}{\boldsymbol{\theta}_{\text{motor}}} \newcommand{\MotorRotorVelocities}{\dot{\boldsymbol{\theta}}_{\text{motor}}} \newcommand{\MotorShaftDamping}{D_{\text{motor}}} \newcommand{\MotorShaftPosition}{q_{\text{motor}}} \newcommand{\MotorTorque}{\tau_{\text{motor}}} \newcommand{\MotorTorqueConstant}{K_t} \newcommand{\MotorViscousDamping}{B_{m}} \newcommand{\MotorViscousDampingMatrix}{\mathbf{B}_m} \newcommand{\MpcControlSequence}{\mathbf{u}_{0:N_{\text{mpc}}-1}} \newcommand{\MpcControlSequenceTail}{\mathbf{u}_{1:N_{\text{mpc}}-1}} \newcommand{\MpcHorizonObjective}{J} \newcommand{\MpcPredictionHorizon}{N_{\text{mpc}}} \newcommand{\MpcTerminalCost}{\ell_f} \newcommand{\MpcTerminalCostMatrix}{\mathbf{P}_{N_{\text{mpc}}}} \newcommand{\MultiAgentAcceptanceProbability}{p_{\text{multi}}} \newcommand{\MultiDeviceRunTime}{T_N} \newcommand{\MultimodalFusedTokenStream}{\mathbf{Z}} \newcommand{\MultimodalObservation}{\mathbf{o}} \newcommand{\MutatingToolAction}{a} \newcommand{\MutualInformation}{I} \newcommand{\NaturalLogarithmBase}{e} \newcommand{\NearestCandidateDistance}{D_{\min}} \newcommand{\NeesStatistic}{\epsilon} \newcommand{\NegativeGateSupplyVoltage}{V_{\text{ee}}} \newcommand{\NeighborCount}{k} \newcommand{\NeighborUserIndex}{j} \newcommand{\NeighboringDataset}{X} \newcommand{\NetAngularBrakingDeceleration}{\alpha_{\text{net}}} \newcommand{\NetBrakingDeceleration}{a_{\text{net}}} \newcommand{\NetworkBandwidth}{\text{BW}_{\text{network}}} \newcommand{\NetworkDelayStandardDeviation}{\sigma_d} \newcommand{\NetworkEnergy}{E_{\text{network}}} \newcommand{\NetworkEquipmentPower}{P_{\text{network}}} \newcommand{\NetworkFunction}{f_{\text{net}}} \newcommand{\NetworkLatency}{L_{\text{lat,network}}} \newcommand{\NetworkOutput}{y} \newcommand{\NetworkTrafficVolume}{M} \newcommand{\NeuralLyapunovFactor}{\mathbf{L}_{\phi}} \newcommand{\NeuronActivation}{a} \newcommand{\NeuronBias}{b} \newcommand{\NeuronConnectionWeight}{w_{ij}} \newcommand{\NeuronIndex}{j} \newcommand{\NeuronPreactivation}{z} \newcommand{\NewSoftmaxRunningMaximum}{m_{\text{new}}} \newcommand{\NextDecisionProcessState}{s'} \newcommand{\NextFailureTime}{F} \newcommand{\NextLayerActivationMemory}{M_{\text{activations}}^{(\ell+1)}} \newcommand{\NextProprioceptiveObservation}{\mathbf{o}_{\text{proprio}, t+1}} \newcommand{\NextRobotAction}{\mathbf{a}'} \newcommand{\NextTokenDistribution}{p} \newcommand{\NextTokenEntropy}{\mathcal{H}} \newcommand{\NextTokenLogitFunction}{\mathbf{f}_\theta} \newcommand{\NgramLength}{n} \newcommand{\NicMttf}{\text{MTTF}_{\text{nic}}} \newcommand{\NicsPerNode}{n_{\text{nic}}} \newcommand{\NodeAcceleratorCount}{n_{\text{acc}}} \newcommand{\NodeHbmCapacity}{M_{\text{HBM}}} \newcommand{\NodeMtbf}{\text{MTBF}_{\text{node}}} \newcommand{\NodeStragglerProbability}{p_{\text{straggle}}} \newcommand{\NoisePredictionNetwork}{\boldsymbol{\epsilon}_\theta} \newcommand{\NoisedActionChunk}{\mathbf{A}^k} \newcommand{\NoisyClassProbability}{\tilde{p}} \newcommand{\NoisyClassProbabilityVector}{\tilde{\mathbf{p}}} \newcommand{\NoisyLabelSampleCount}{D_{\text{noisy}}} \newcommand{\NominalBitRate}{R_{\text{nom}}} \newcommand{\NominalBitTime}{T_{\text{bit,nom}}} \newcommand{\NominalBrakingDeceleration}{a_{\text{nominal}}} \newcommand{\NominalClearance}{C_{\text{nominal}}} \newcommand{\NominalClockFrequency}{f_{\text{nom}}} \newcommand{\NominalCommandWindow}{\mathbf{u}_{\text{nom}, t:t+H-1}} \newcommand{\NominalContactForces}{\mathbf{f}_{\text{nom}}} \newcommand{\NominalControlCommand}{\mathbf{u}_{\text{nom}}} \newcommand{\NominalFrameInterval}{T_{\text{nominal}}} \newcommand{\NominalFrictionCoefficient}{\mu_{\text{nom}}} \newcommand{\NominalOscillatorFrequency}{f_{\text{nom}}} \newcommand{\NominalPlanExpiry}{t_{\text{plan\_exp}}} \newcommand{\NominalRatedSpeed}{v_{\text{nominal}}} \newcommand{\NominalReferenceClearance}{c} \newcommand{\NominalSupplyVoltage}{V_{\text{nom}}} \newcommand{\NominalTickPeriod}{T_{\text{period}}} \newcommand{\NominalTrackingTolerance}{\epsilon_{\text{nom}}} \newcommand{\NonconformityScore}{s} \newcommand{\NoninferiorityRatioMargin}{\delta} \newcommand{\NoninferiorityTolerance}{\delta_{\text{tol}}} \newcommand{\NonlinearBiasTorque}{\mathbf{h}} \newcommand{\NonlinearObservationSpace}{\mathbf{O}_{\text{NL}}} \newcommand{\NonlinearOutputFunction}{\mathbf{h}} \newcommand{\NonzeroCount}{n_{\text{nz}}} \newcommand{\NonzeroParameterBudget}{k_{\text{nz}}} \newcommand{\NormWeightMatrix}{\mathbf{W}} \newcommand{\NormalContactForce}{f_{k, \perp}} \newcommand{\NormalContactImpulse}{P_n} \newcommand{\NormalizationScale}{\gamma} \newcommand{\NormalizationScaleVector}{\boldsymbol{\gamma}} \newcommand{\NormalizationShift}{\beta} \newcommand{\NormalizationShiftVector}{\boldsymbol{\beta}} \newcommand{\NormalizedActionCommand}{\tilde{a}} \newcommand{\NormalizedActionResidual}{e} \newcommand{\NormalizedActivation}{\hat{a}} \newcommand{\NormalizedCandidateScore}{c} \newcommand{\NormalizedElapsedTimeRatio}{D} \newcommand{\NormalizedGearRatio}{\tilde{N}} \newcommand{\NormalizedImageAbscissa}{x_n} \newcommand{\NormalizedImageOrdinate}{y_n} \newcommand{\NormalizedMetricBaseline}{v} \newcommand{\NormalizedPredicateMargin}{\bar{f}} \newcommand{\NormalizedRadialDistance}{r} \newcommand{\NormalizedStatusEnvelope}{\mathcal{N}} \newcommand{\NormalizerTokenIndex}{w} \newcommand{\NormalizingClassIndex}{k} \newcommand{\NormalizingKeyIndex}{m} \newcommand{\NormalizingNextState}{\tilde{s}} \newcommand{\NoticeByteAllocation}{M_{\text{notice}}} \newcommand{\NucleusProbabilityMass}{p} \newcommand{\NullSpaceProjector}{\mathbf{N}} \newcommand{\NullSpaceVelocityBias}{\dot{\mathbf{q}}_0} \newcommand{\NumericBitWidth}{b} \newcommand{\NumericalStabilityConstant}{\epsilon} \newcommand{\ObjectHandle}{h} \newcommand{\ObjectWrench}{\mathbf{w}_{\text{obj}}} \newcommand{\ObservabilityMatrix}{\mathbf{O}_{\text{obs}}} \newcommand{\ObservableModelOutput}{O} \newcommand{\ObservationAge}{t_{\text{age}}} \newcommand{\ObservationAgeBudget}{t_{\text{age},\max}} \newcommand{\ObservationAgeDisplacement}{\Delta \mathbf{p}} \newcommand{\ObservationBinding}{\lambda} \newcommand{\ObservationByteBudget}{M_{\text{obs},\max}} \newcommand{\ObservationCount}{N} \newcommand{\ObservationDataset}{\mathcal{D}} \newcommand{\ObservationEncodingTime}{t_{\text{enc}}} \newcommand{\ObservationFunction}{h} \newcommand{\ObservationHistory}{\mathbf{O}} \newcommand{\ObservationHistoryLength}{H_{\text{hist}}} \newcommand{\ObservationHistorySequence}{\mathbf{o}_{0:t}} \newcommand{\ObservationHistoryWindow}{\mathbf{o}_{t-H_{\text{hist}}:t}} \newcommand{\ObservationIntervalEnd}{t_{b}} \newcommand{\ObservationIntervalLength}{T_{\text{obs}}} \newcommand{\ObservationIntervalStart}{t_{a}} \newcommand{\ObservationPairingLag}{\Delta t_{\text{lag}}} \newcommand{\ObservationPayload}{\mathbf{T}_{\text{payload}}} \newcommand{\ObservationResponseLatency}{T_{\text{total}}} \newcommand{\ObservationTimestamp}{t_{\text{obs}}} \newcommand{\ObservationTokenCount}{S_{\text{obs}}} \newcommand{\ObservationTokenSequence}{\mathbf{z}_{\text{token}}} \newcommand{\ObservedAnnotatorAgreement}{p_o} \newcommand{\ObservedCategoryCount}{n_i^{\text{obs}}} \newcommand{\ObservedCycleCount}{N} \newcommand{\ObservedDataPoint}{\mathbf{x}} \newcommand{\ObservedFailureCount}{k} \newcommand{\ObservedFailureFraction}{\hat{p}} \newcommand{\ObservedFreeSpace}{\mathcal{M}_{\text{free}}} \newcommand{\ObservedLabelCount}{n} \newcommand{\ObservedOccupiedSpace}{\mathcal{M}_{\text{occ}}} \newcommand{\ObservedPixelCoordinates}{\tilde{\mathbf{m}}_{\text{observed}}} \newcommand{\ObservedPlantState}{\mathbf{x}_{\text{obs}}} \newcommand{\ObservedPointRange}{r} \newcommand{\ObservedRelativeSpeed}{v_{\text{rel}}} \newcommand{\ObservedSignificanceLevel}{p_{\text{val}}} \newcommand{\ObservedSuccessFraction}{\hat{p}} \newcommand{\ObservedTrialFailureCount}{k} \newcommand{\ObservedViolationFraction}{V} \newcommand{\ObservedVolume}{V_{\text{obs}}} \newcommand{\ObstacleConfigurationSet}{\mathcal{C}_{\text{obs}}} \newcommand{\ObstacleCostWeight}{\lambda_{\text{obs}}} \newcommand{\ObstaclePoint}{\mathbf{o}} \newcommand{\ObstaclePosition}{x_{\text{obstacle}}} \newcommand{\ObstacleProximityCost}{c_{\text{obs}}} \newcommand{\ObstacleRiskRadius}{r_{\text{risk}}} \newcommand{\ObstacleSeparationDistance}{d} \newcommand{\ObstacleStateSet}{\mathcal{X}_{\text{obs}}} \newcommand{\ObstacleSurfaceArea}{A_{\text{surface}}} \newcommand{\OccupancyCoverageMultiplier}{k_\sigma} \newcommand{\OccupancyLogOdds}{L} \newcommand{\OccupancyThreshold}{k} \newcommand{\OccupiedLogOddsIncrement}{L_{\text{occ}}} \newcommand{\OccupiedScenarioCellCount}{N_{\text{supported}}} \newcommand{\OdometryBaseTransform}{\mathbf{T}_{\text{odom}}^{\text{base}}} \newcommand{\OdometryCovarianceJacobian}{\mathbf{J}_{\text{odom}}} \newcommand{\OdometryNoiseStandardDeviation}{\sigma_{w}} \newcommand{\OdometryPoseCovariance}{\boldsymbol{\Sigma}_{\text{odom}}} \newcommand{\OdometryReferenceFrame}{\mathcal{F}_{\text{odom}}} \newcommand{\OfflineTransitionDataset}{\mathcal{D}_{\text{offline}}} \newcommand{\OffloadTailNetworkTime}{t_{\text{net}}^{\text{tail}}} \newcommand{\OffloadTailProcessingTime}{t_{\text{proc}}^{\text{tail}}} \newcommand{\OffloadTransactionWindow}{W} \newcommand{\OhmUnit}{\Omega} \newcommand{\OilBulkModulus}{\beta} \newcommand{\OldSoftmaxRunningMaximum}{m_{\text{old}}} \newcommand{\OnDieDecouplingCapacitance}{C_{\text{die}}} \newcommand{\OnlineSoftmaxKeyTile}{\mathbf{K}_{\text{tile}}} \newcommand{\OnlineSoftmaxQueryBlock}{\mathbf{Q}_{\text{block}}} \newcommand{\OnlineSoftmaxScoreBlock}{\mathbf{A}_{\text{block}}} \newcommand{\OpenLoopTransferFunction}{L} \newcommand{\OpenLoopTransferMatrix}{\mathbf{L}} \newcommand{\OperationChargeBound}{\bar{c}} \newcommand{\OperationDispatchOverhead}{t_{\text{dispatch}}} \newcommand{\OperationRecipient}{r} \newcommand{\OperationReconciliationTime}{T_{\text{rec}}} \newcommand{\OperationalFailureProbability}{p_F} \newcommand{\OperationalOverheadFraction}{f_{\text{overhead}}} \newcommand{\OperationalScenarioDistribution}{p} \newcommand{\OperationalTaxonomyDimension}{C} \newcommand{\OperationalTestDistribution}{\mathcal{D}} \newcommand{\Operations}{O} \newcommand{\OperationsPerSample}{O_{\text{sample}}} \newcommand{\OperatorCognitiveTime}{T_{\text{cognitive}}} \newcommand{\OperatorMotorTime}{T_{\text{motor}}} \newcommand{\OperatorResponseLatency}{t_{\text{hum}}} \newcommand{\OperatorSensoryTime}{T_{\text{sensory}}} \newcommand{\OperatorStabilizationInstant}{t_{\text{stabilize}}} \newcommand{\OperatorWindowTime}{t'} \newcommand{\OperatorWorkspaceMemory}{M_{\text{workspace}}} \newcommand{\OpticalFrequency}{\nu} \newcommand{\OpticalWavelength}{\lambda_{\text{wl}}} \newcommand{\OptimalCheckpointInterval}{T^\ast_{\text{ckpt}}} \newcommand{\OptimalCostToGoDerivative}{\dot{V}} \newcommand{\OptimalCostToGoFunction}{V} \newcommand{\OptimalModelParameters}{\theta^*} \newcommand{\OptimalStateReturn}{V_{\text{RL}}} \newcommand{\OptimizationBreakevenTime}{T_{\text{breakeven}}} \newcommand{\OptimizationImplementationCost}{C_{\text{optimization}}} \newcommand{\OptimizationIterate}{x} \newcommand{\OptimizerStateMemory}{M_{\text{optimizer}}} \newcommand{\OptimizerStepIndex}{t} \newcommand{\OptimizerStepTime}{T_{\text{update}}} \newcommand{\OptimizerUpdateCount}{T} \newcommand{\OptimumMissFactor}{x} \newcommand{\OrderedTestRank}{r} \newcommand{\OrientationTolerance}{\theta_{\text{tol}}} \newcommand{\OrphanSweepInterval}{T} \newcommand{\OscillationPriorStateDigest}{h_{\text{state},t-2}} \newcommand{\OscillatorAcceleration}{\ddot{q}} \newcommand{\OscillatorNaturalFrequency}{\omega} \newcommand{\OscillatorPosition}{q} \newcommand{\OscillatorStepVelocity}{v} \newcommand{\OscillatorVelocity}{\dot{q}} \newcommand{\OutcomeAlphabet}{\mathcal{X}} \newcommand{\OutcomeCheckPassProbability}{p_{\text{out}}} \newcommand{\OutcomeCheckSlotTime}{T_{\text{out}}} \newcommand{\OutcomePairPrivacyLoss}{\mathcal{L}_{\text{priv},(X,X')}^{(o)}} \newcommand{\OutcomeStandardDeviation}{\sigma} \newcommand{\OutgoingChannelCommand}{u_{\text{prior}}} \newcommand{\OutgoingCommandDerivative}{\dot{u}_{\text{prior}}} \newcommand{\OutputBearingDamping}{D_{\text{joint}}} \newcommand{\OutputChannel}{y} \newcommand{\OutputChannelCount}{C_{\text{out}}} \newcommand{\OutputChannelIndex}{k} \newcommand{\OutputComponentFunction}{h} \newcommand{\OutputDimension}{p} \newcommand{\OutputFeatureMapHeight}{H_{\text{out}}} \newcommand{\OutputFeatureMapWidth}{W_{\text{out}}} \newcommand{\OutputIndex}{\ell} \newcommand{\OutputLayerBiasVector}{\mathbf{b}_{\text{out}}} \newcommand{\OutputLayerWeightMatrix}{\mathbf{W}_{\text{out}}} \newcommand{\OutputLength}{K} \newcommand{\OutputLengthStandardDeviation}{\sigma} \newcommand{\OutputLimit}{K_{\max}} \newcommand{\OutputLogit}{z} \newcommand{\OutputNodeAdjoint}{\bar{v}_W} \newcommand{\OutputNodePrimal}{v_W} \newcommand{\OutputProjectionOperations}{O_{\text{out}}} \newcommand{\OutputQuantizationScale}{s_Y} \newcommand{\OutputRelativeDegree}{r} \newcommand{\OutputToken}{y} \newcommand{\OutputTokenPrefix}{y_{<t}} \newcommand{\OutputTokenPrice}{c_{\text{out}}} \newcommand{\OutputTokenSequence}{y_{1:K}} \newcommand{\OutputTorqueCeiling}{\tau_{\text{out,max}}} \newcommand{\OutstandingItemCount}{N_{\text{out}}} \newcommand{\OverheadCameraEmbedding}{\mathbf{e}_{\text{overhead}}} \newcommand{\OverlappedBackwardCommunicationTime}{T_{\text{pipelined}}} \newcommand{\OverlappedTime}{T_{\text{overlap}}} \newcommand{\OverlappingGaussianSet}{\mathcal{N}} \newcommand{\OversubscriptionRatio}{R} \newcommand{\OwnershipAcquisitionTime}{T_{\text{own}}} \newcommand{\PackageDecouplingCapacitance}{C_{\text{pkg}}} \newcommand{\PackageInductance}{L_{\text{pkg}}} \newcommand{\PackageResistance}{R_{\text{pkg}}} \newcommand{\PackageThermalCapacitance}{C_{\text{th}}} \newcommand{\PackageThermalTimeConstant}{\tau_{\text{th}}} \newcommand{\PackedExampleIndex}{k} \newcommand{\PackedExampleLength}{s} \newcommand{\PackedExampleOffset}{b} \newcommand{\PacketBuffer}{b} \newcommand{\PaddingWasteFraction}{W} \newcommand{\PageRankDampingFactor}{d} \newcommand{\PageRankScoreVector}{\mathbf{r}} \newcommand{\PairedAcceptanceDifference}{\Delta} \newcommand{\PairedDifferenceLowerLimit}{L_{\Delta}} \newcommand{\PairedDifferenceUpperLimit}{U_{\Delta}} \newcommand{\PairedOutcomeCellCount}{n} \newcommand{\PairedRandomVariable}{Y} \newcommand{\PairedTaskIndex}{j} \newcommand{\PairedTimeInstant}{s} \newcommand{\PairedVerdictCorrelation}{\hat{\phi}} \newcommand{\PairingLagCeiling}{\Delta t_{\text{lag,max}}} \newcommand{\PairwiseCoordinationCoefficient}{\beta_{\text{pair}}} \newcommand{\PairwiseMaskSecret}{\mathbf{s}} \newcommand{\ParallelEnvironmentCount}{n_{\text{env}}} \newcommand{\ParallelFraction}{f_{\text{parallel}}} \newcommand{\ParallelLoopCount}{k_{\text{parallel}}} \newcommand{\ParallelRigCount}{N_{\text{rig}}} \newcommand{\ParameterPayload}{M_{\text{param}}} \newcommand{\ParameterRandomizationRanges}{\mathcal{P}} \newcommand{\ParameterScaleCoefficient}{A} \newcommand{\ParameterScalingExponent}{\alpha} \newcommand{\ParameterServerCount}{K_{\text{srv}}} \newcommand{\ParameterSpace}{\Theta} \newcommand{\ParameterSpaceDirection}{u} \newcommand{\ParameterStreamingTime}{t_{\text{stream}}} \newcommand{\ParameterVelocity}{\dot{\theta}} \newcommand{\ParameterizedPredictor}{f_{\theta}} \newcommand{\Parameters}{P} \newcommand{\ParametricProposalDistribution}{q_{\boldsymbol{\psi}}} \newcommand{\ParasiticLoopInductance}{L_{\text{parasitic}}} \newcommand{\ParentCapabilityGrant}{\Gamma_{\text{parent}}} \newcommand{\ParentFreeBalance}{F_{P}} \newcommand{\ParentNodeIndex}{k} \newcommand{\ParentReservedFunds}{R_{P}} \newcommand{\ParentSettledCharges}{E_{P}} \newcommand{\ParetoMinimumDemand}{x_{\min}} \newcommand{\ParetoTailExponent}{\alpha_{\text{tail}}} \newcommand{\ParetoTaskDemand}{X} \newcommand{\ParticipatingClientCount}{N_{\text{clients}}} \newcommand{\PartnerBitIndex}{k} \newcommand{\PassAtKEstimate}{\widehat{\operatorname{pass@}k}} \newcommand{\PassedTrialCount}{N_{\text{pass}}} \newcommand{\PassingRunCount}{s} \newcommand{\PassingSampleCount}{c} \newcommand{\PassiveModelPrediction}{\hat{Y}} \newcommand{\PastSynchronizationStepIndex}{j} \newcommand{\PatchColumnIndex}{w} \newcommand{\PatchRowIndex}{h} \newcommand{\PatchTokenCount}{N} \newcommand{\PathAcceleration}{\ddot{s}} \newcommand{\PathAccelerationInput}{u} \newcommand{\PathAccelerationLowerBound}{\ddot{s}_{\min}} \newcommand{\PathAccelerationTorqueCoefficient}{\mathbf{a}_{\tau}} \newcommand{\PathAccelerationUpperBound}{\ddot{s}_{\max}} \newcommand{\PathCoordinate}{s} \newcommand{\PathDelayAsymmetry}{\Delta t_{\text{asym}}} \newcommand{\PathGridPointCount}{N_{\text{grid}}} \newcommand{\PathVelocity}{\dot{s}} \newcommand{\PathVelocityField}{v} \newcommand{\PathVelocitySquaredTorqueCoefficient}{\mathbf{b}_{\tau}} \newcommand{\PayloadGravityTorque}{\tau_{g}} \newcommand{\PayloadLeverArm}{r} \newcommand{\PcieLinkFailureRate}{\lambda_{\text{PCIe}}} \newcommand{\PdnBranchCurrent}{I_{\text{branch}}} \newcommand{\PdnBranchResistance}{R_{\text{PDN}}} \newcommand{\PdnTargetImpedance}{Z_{\text{target}}} \newcommand{\PeakBridgeJerk}{j_{\text{peak}}} \newcommand{\PeakContactForce}{F_{\text{peak}}} \newcommand{\PeakCopperLossPower}{P_{\text{peak}}} \newcommand{\PeakCurrent}{I_{\text{peak}}} \newcommand{\PeakMemoryBandwidth}{\text{BW}_{\text{peak}}} \newcommand{\PeakPenetrationDepth}{\delta_{\max}} \newcommand{\PeakRate}{R_{\text{peak}}} \newcommand{\PeakRegenerativePower}{P_{\text{regen, peak}}} \newcommand{\PeakRotorAngularSpeed}{\omega_{\max}} \newcommand{\PeakSlipRatio}{\lambda_{\text{peak}}} \newcommand{\PeakStopDeceleration}{a_{\text{peak}}} \newcommand{\PeakTorque}{\tau_{\text{peak}}} \newcommand{\PeakTractionCoefficient}{\mu_{\text{peak}}} \newcommand{\PearsonFitStatistic}{\chi^2} \newcommand{\PeerReviewerIndex}{i} \newcommand{\PeerToolCallIndex}{j} \newcommand{\PenaltyContactDamping}{c} \newcommand{\PenaltyContactStiffness}{k_{\text{pen}}} \newcommand{\PenaltyPenetrationDepth}{\delta_{\text{pen}}} \newcommand{\PenaltyRestitutionDuration}{\Delta t_{\text{res}}} \newcommand{\PendulumNaturalFrequency}{\omega_0} \newcommand{\PenetrationDepth}{\delta} \newcommand{\PenetrationRate}{\dot{\delta}} \newcommand{\PenultimateLayerWidth}{n_{N_L-1}} \newcommand{\PerDeviceComputeTime}{T_{\text{compute,local}}} \newcommand{\PerDeviceWeightReadTime}{T_{\text{read}}} \newcommand{\PerExperimentComputeCost}{C_{\text{compute,per-exp}}} \newcommand{\PerExperimentEngineeringCost}{C_{\text{engineer,per-exp}}} \newcommand{\PerFrameDetectionProbability}{p_{\text{frame}}} \newcommand{\PerGpuNetworkFailureRate}{\lambda_{\text{network/GPU}}} \newcommand{\PerGpuPowerFailureRate}{\lambda_{\text{power/GPU}}} \newcommand{\PerGpuTotalFailureRate}{\lambda_{\text{total/GPU}}} \newcommand{\PerStepCostBound}{C_{\max}} \newcommand{\PerStepErrorRate}{\epsilon} \newcommand{\PerStreamTokenRate}{R} \newcommand{\PerTaskRunCount}{R} \newcommand{\PerTestSignificanceLevel}{\alpha_{\text{sig}}'} \newcommand{\PerTokenDecodeTime}{t_{\text{decode}}} \newcommand{\PerTokenKlEstimate}{\hat{\mathcal{D}}} \newcommand{\PerTokenMaskingTime}{t_{\text{mask}}} \newcommand{\PerTokenPrefillTime}{t_{\text{prefill}}} \newcommand{\PerWorkerBatchSize}{B_{\text{per-worker}}} \newcommand{\PerceptionDepthCovariance}{\boldsymbol{\Sigma}_{\text{depth}}} \newcommand{\PerceptionDispatchTime}{t_{\text{IPC}}} \newcommand{\PerceptionErrorScale}{\epsilon_{\text{scale}}} \newcommand{\PeriodicPeakWindingTemperature}{T_{\text{peak}}} \newcommand{\PeriodicTaskCount}{n} \newcommand{\PermanentMagnetFluxLinkage}{\lambda_{\text{pm}}} \newcommand{\PermissionLoopPeriod}{T_{\text{tick}}} \newcommand{\PermissionPathKernel}{G_\kappa} \newcommand{\PermissionPathParameters}{\kappa} \newcommand{\PermissionTickWaitTime}{t_{\text{wait}}} \newcommand{\PermissionTickWcet}{T_{\text{wcet}}} \newcommand{\PermittedActions}{\mathcal{A}_{\text{perm}}} \newcommand{\PermittedUsePassProbability}{p_{\text{use}}} \newcommand{\PersonApproachTravel}{S_h} \newcommand{\PersonPositionUncertainty}{Z_d} \newcommand{\PersonalizationPenaltyWeight}{\lambda_{\text{reg}}} \newcommand{\PersonalizationVector}{\mathbf{p}} \newcommand{\PerturbationNoiseStandardDeviation}{\sigma} \newcommand{\PerturbationNormOrder}{p} \newcommand{\PerturbedPose}{\mathbf{T}'} \newcommand{\PerturbedSignalDimension}{D} \newcommand{\PerturbedSignalVector}{\mathbf{x}} \newcommand{\PfcWatchdogTimeout}{T_{\text{watchdog}}} \newcommand{\PhaseInductance}{L_{\text{phase}}} \newcommand{\PhaseJoulePower}{P_{\text{phase}}} \newcommand{\PhaseMargin}{\Phi_m} \newcommand{\PhaseResistance}{R_{\text{phase}}} \newcommand{\PhotodiodeQuantumEfficiency}{\eta_{\text{QE}}} \newcommand{\PhysicalPlantDynamics}{f_{\text{real}}} \newcommand{\PhysicalRestoreTime}{t_{\text{physical\_restore}}} \newcommand{\PhysicalReturnLevel}{z_{T, \text{real}}} \newcommand{\PhysicalStateTrajectory}{s_{\text{real}}} \newcommand{\PhysicalStlRobustness}{\rho_{\text{real}}} \newcommand{\PhysicalTrajectorySet}{\mathcal{S}_{\text{real}}} \newcommand{\PhysicalWorldState}{s} \newcommand{\PidDerivativeGain}{K_d} \newcommand{\PidIntegralGain}{K_i} \newcommand{\PidProportionalGain}{K_p} \newcommand{\PidProportionalGainMatrix}{\mathbf{K}_p} \newcommand{\PipelineBubbleFraction}{b_{\text{pipe}}} \newcommand{\PipelineBufferMemory}{M_{\text{required}}} \newcommand{\PipelineClockSkew}{t_{\text{skew}}} \newcommand{\PipelineFlushDelay}{t_{\text{hw\_pipe}}} \newcommand{\PipelineIterationTime}{T_{\text{iteration}}} \newcommand{\PipelineParallelDegree}{N_{\text{PP}}} \newcommand{\PipelineTimeSlot}{t} \newcommand{\PipelinedExecutionTime}{T_{\text{pipelined}}} \newcommand{\PistonArea}{A} \newcommand{\PixelColumnCoordinate}{u} \newcommand{\PixelLastEventTime}{t_{\text{last}}} \newcommand{\PixelOpacityContribution}{\alpha'} \newcommand{\PixelRowCoordinate}{v} \newcommand{\PixelRowStandardDeviation}{\sigma_v} \newcommand{\PixelStandardDeviation}{\sigma_u} \newcommand{\PlacementChoiceCount}{n} \newcommand{\PlaintextInput}{m} \newcommand{\PlanAction}{a} \newcommand{\PlanarHomographyMatrix}{\mathbf{H}} \newcommand{\PlanarPositionEmbedding}{\mathbf{E}_{\text{pos}}^{2D}} \newcommand{\PlanarSpecialEuclideanGroup}{SE(2)} \newcommand{\PlanckConstant}{h} \newcommand{\PlanningOperator}{o} \newcommand{\PlanningStageLatency}{T_{\text{plan}}} \newcommand{\PlanningStartInstant}{t_{\text{plan}}} \newcommand{\PlantDynamicsFunction}{\mathbf{f}} \newcommand{\PlantDynamicsParameters}{\theta_{\text{plant}}} \newcommand{\PlantOutcomeFunction}{g} \newcommand{\PlantParameters}{m} \newcommand{\PlantStateAcceleration}{\ddot{\mathbf{x}}} \newcommand{\PlantStateComponentCount}{N_s} \newcommand{\PlantStateDimension}{n} \newcommand{\PlantStateRate}{\dot{\mathbf{x}}} \newcommand{\PlantStateSpace}{\mathcal{X}} \newcommand{\PlantTransitionDensity}{p_m} \newcommand{\PlantTransitionKernel}{\mathcal{T}} \newcommand{\PlatformAnnualOperationsCost}{C_{\text{after}}} \newcommand{\PlatformResourceCapacity}{\text{Cap}} \newcommand{\PlatformResourceIndex}{i} \newcommand{\PlatformTotalCost}{C_{\text{platform}}} \newcommand{\PlatformUtilization}{U_{\text{platform}}} \newcommand{\PointClearanceMargin}{d_{\text{margin}}} \newcommand{\PointToPointMessageSize}{n} \newcommand{\PointToPointTransferTime}{T} \newcommand{\PoisonedModel}{f_{\mathcal{S} \cup \mathcal{S}_{\text{poison}}}} \newcommand{\PoisoningDataset}{\mathcal{S}_{\text{poison}}} \newcommand{\PoisoningTargetDataset}{\mathcal{S}_{\text{test}}} \newcommand{\PoissonSubintervalCount}{n} \newcommand{\Policy}{\pi_\theta} \newcommand{\PolicyAction}{a} \newcommand{\PolicyActionStandardDeviation}{\sigma^{\pi}} \newcommand{\PolicyActionWindow}{\mathbf{A}_{t:t+H-1}} \newcommand{\PolicyCheckpoint}{v} \newcommand{\PolicyEnsembleCovariance}{\boldsymbol{\Sigma}_{\pi}} \newcommand{\PolicyEntropy}{\mathcal{H}} \newcommand{\PolicyGaussianMean}{\boldsymbol{\mu}_{\theta}} \newcommand{\PolicyGaussianMeanComponent}{\mu^{\pi}} \newcommand{\PolicyGaussianStandardDeviation}{\boldsymbol{\sigma}_{\theta}} \newcommand{\PolicyGradientBaseline}{b} \newcommand{\PolicyGradientEstimate}{\widehat{g}} \newcommand{\PolicyHistoryActionReturn}{Q^{\pi}} \newcommand{\PolicyHistoryAdvantage}{A^{\pi}} \newcommand{\PolicyImitationLoss}{\mathcal{L}_{\text{policy}}} \newcommand{\PolicyLipschitzBound}{L_{\text{lip}}} \newcommand{\PolicyObservedState}{s} \newcommand{\PolicyPassRate}{f} \newcommand{\PolicyProbabilityRatio}{\rho} \newcommand{\PolicyRemainingReturn}{V^{\pi}} \newcommand{\PolicyRequestLength}{S_{\pi}} \newcommand{\PolicyStateActionDistribution}{\rho_{\pi_\theta}} \newcommand{\PolicyTrajectoryDistribution}{p_\theta} \newcommand{\PolicyTti}{T_{\text{TTI}}} \newcommand{\PolicyUpdateStepTime}{T_{\text{step}}} \newcommand{\PolyakAveragingCoefficient}{\tau} \newcommand{\PolynomialCoefficientVector}{\mathbf{a}} \newcommand{\PolynomialTrajectoryCoefficient}{a} \newcommand{\PomdpActionSet}{\mathsf{A}} \newcommand{\PomdpObservationFunction}{\mathsf{O}} \newcommand{\PomdpObservationSet}{\Omega} \newcommand{\PomdpRewardFunction}{\mathsf{R}} \newcommand{\PomdpStateSpace}{\mathsf{S}} \newcommand{\PomdpTransitionFunction}{\mathsf{T}} \newcommand{\PoolResidentMemory}{M_{\text{pool}}} \newcommand{\PooledAcceptanceProbability}{\bar{p}} \newcommand{\PooledConversionRate}{\hat{p}} \newcommand{\PooledSampleApprovalRate}{\hat{p}} \newcommand{\PopulationStabilityBinCount}{n_{\text{bins}}} \newcommand{\PopulationStabilitySmoothingConstant}{\epsilon_{\text{smooth}}} \newcommand{\PortCycleNetEnergy}{\Delta E} \newcommand{\PortEffort}{\mathbf{F}} \newcommand{\PortFlow}{\dot{\mathbf{x}}} \newcommand{\PortInput}{\mathbf{u}} \newcommand{\PortOutput}{\mathbf{y}} \newcommand{\PortStoredEnergy}{E} \newcommand{\PortVelocity}{v} \newcommand{\Pose}{\mathbf{T}} \newcommand{\PoseTwistPerturbation}{\boldsymbol{\epsilon}} \newcommand{\PoseTwistPerturbationMatrix}{\hat{\boldsymbol{\epsilon}}} \newcommand{\PositionComponent}{p} \newcommand{\PositionConfidenceEllipsoidRadius}{\chi_{3,0.95}} \newcommand{\PositionErrorBound}{E} \newcommand{\PositionErrorCeiling}{e_{\max}} \newcommand{\PositionErrorCovariance}{\mathbf{P}_{pp}} \newcommand{\PositionErrorEnvelope}{e} \newcommand{\PositionLossMask}{m} \newcommand{\PositionUncertaintyRadius}{r} \newcommand{\PositionalTaskTolerance}{r_{\text{tol}}} \newcommand{\PositiveClassInput}{x_{+}} \newcommand{\PositiveIntegerExponent}{n} \newcommand{\PostContactDrivenStroke}{\Delta x_{\text{driven}}} \newcommand{\PostImpactNormalVelocity}{v_n^+} \newcommand{\PostRevocationDelay}{\tau_{\text{rev}}} \newcommand{\PosteriorCovarianceMatrix}{\boldsymbol{\Sigma}_{\text{post}}} \newcommand{\PosteriorDifferentialEntropy}{h_{\text{post}}} \newcommand{\PostprocessingLatency}{L_{\text{lat,post}}} \newcommand{\PotentialOutcome}{Y^{\text{pot}}} \newcommand{\PowerCriticalQuantile}{z_{\beta}} \newcommand{\PowerLimitBase}{a} \newcommand{\PowerRailInductance}{L_{\text{bus}}} \newcommand{\PowerRailResistance}{R_{\text{bus}}} \newcommand{\PoweredHoldCommand}{\mathbf{u}_{\text{hold}}} \newcommand{\PoweredHoldState}{\mathbf{x}_{\text{hold}}} \newcommand{\PoweredServerCount}{N} \newcommand{\PpoClippedSurrogateObjective}{\mathcal{L}^{\text{CLIP}}} \newcommand{\PqApproximateDistance}{\tilde{d}} \newcommand{\PqCentroidCode}{c^{\text{pq}}} \newcommand{\PqSubspaceIndex}{j} \newcommand{\PqSubvectorCount}{m} \newcommand{\PreForwardEnvironmentState}{\sigma_0} \newcommand{\PreImpactNormalVelocity}{v_n^-} \newcommand{\PreImpactSeparationDistance}{d_{\text{sep}}} \newcommand{\PrePivotCatchRate}{v} \newcommand{\PreTriggerWindowDuration}{T_{\text{pre}}} \newcommand{\PreactivationMatrix}{\mathbf{Z}} \newcommand{\PreactivationVector}{\mathbf{z}} \newcommand{\PrebrakeDelay}{\tau_{\text{delay}}} \newcommand{\PrebrakeDelayCeiling}{\tau_{\text{delay},\max}} \newcommand{\PredecessorGraphVertex}{u} \newcommand{\PredicateLipschitzConstant}{L_{\phi}} \newcommand{\PredicateNormalizationScale}{c} \newcommand{\PredictedActionComponent}{\hat{a}} \newcommand{\PredictedClassProbability}{p} \newcommand{\PredictedConfidence}{\hat{p}} \newcommand{\PredictedDecision}{\hat{Y}} \newcommand{\PredictedEnvironmentLatent}{\hat{\mathbf{z}}} \newcommand{\PredictedErrorCovariance}{\mathbf{P}_{k|k-1}} \newcommand{\PredictedForceReading}{\hat{y}} \newcommand{\PredictedOutput}{\hat{\mathbf{y}}} \newcommand{\PredictedOutputComponent}{\hat{y}} \newcommand{\PredictedPolicyAction}{\hat{\mathbf{a}}} \newcommand{\PredictedProtectedAttribute}{\hat{a}} \newcommand{\PredictedRelativeDepth}{z_{\text{pred}}} \newcommand{\PredictedStateEmbedding}{\mathbf{e}_{\text{state}}} \newcommand{\PredictedStateEstimate}{\hat{\mathbf{x}}_{k|k-1}} \newcommand{\PredictionHeadFunction}{g} \newcommand{\PredictionStepIndex}{i} \newcommand{\PredictiveEntropy}{H_{\text{pred}}} \newcommand{\PreemptionFanoutCount}{k} \newcommand{\PreemptionRate}{\lambda_{\text{preempt}}} \newcommand{\PreemptionTaxTime}{T_{\text{preempt}}} \newcommand{\PreferenceMargin}{z} \newcommand{\PreferencePairDataset}{\mathcal{D}} \newcommand{\PreferenceScale}{\beta} \newcommand{\PreferenceScoredPositionSet}{\mathcal{A}} \newcommand{\PreferredReferenceRelativeScore}{\Delta_w} \newcommand{\PreferredTrajectory}{\tau_w} \newcommand{\PrefetchBufferCount}{N_{\text{prefetch}}} \newcommand{\PrefillAllocatedTokenCount}{C} \newcommand{\PrefillArithmeticIntensity}{I_{\text{prefill}}} \newcommand{\PrefillChunkSize}{C_{\text{chunk}}} \newcommand{\PrefillOperations}{O_{\text{prefill}}} \newcommand{\PrefillRequestIndex}{i} \newcommand{\PrefillTime}{T_{\text{prefill}}} \newcommand{\PrefixHitRate}{\rho_{\text{prefix}}} \newcommand{\PregraspPosition}{\mathbf{p}_{\text{pre}}} \newcommand{\PreprocessingLatency}{L_{\text{lat,pre}}} \newcommand{\PreprocessingServiceTime}{T_{\text{preprocessing}}} \newcommand{\PreprocessingThroughput}{R_{\text{preprocessing}}} \newcommand{\PresaturationTorqueCommand}{\boldsymbol{\tau}_{\text{cmd}}} \newcommand{\PreviousLayerWidth}{n_{\ell-1}} \newcommand{\PreviousPeriodCost}{C_{\text{previous}}} \newcommand{\PreviousRangeObservationHistory}{z_{1:t-1}} \newcommand{\PreviousUpdatedErrorCovariance}{\mathbf{P}_{k-1|k-1}} \newcommand{\PreviousUpdatedStateEstimate}{\hat{\mathbf{x}}_{k-1|k-1}} \newcommand{\PrimitiveOperation}{\phi} \newcommand{\PrincipalPointColumn}{c_x} \newcommand{\PrincipalPointRow}{c_y} \newcommand{\PriorCovarianceMatrix}{\boldsymbol{\Sigma}_{\text{prior}}} \newcommand{\PriorDifferentialEntropy}{h_{\text{prior}}} \newcommand{\PriorStandardDeviation}{\sigma_0} \newcommand{\PriorTurnCount}{j} \newcommand{\PrivacyAdditiveSlack}{\delta} \newcommand{\PrivacyBudget}{\epsilon} \newcommand{\PrivacyLossVariable}{\mathcal{L}_{\text{priv}}} \newcommand{\PrivacyNoiseMultiplier}{\sigma} \newcommand{\PrivatizedQuery}{\tilde{f}} \newcommand{\PrivilegeTrapTime}{T_{\text{trap}}} \newcommand{\PrivilegedSimulatorState}{s_{\text{priv}}} \newcommand{\PrivilegedStateDimension}{d_{\text{priv}}} \newcommand{\PrivilegedStateEncoder}{E} \newcommand{\ProbabilityFunction}{p} \newcommand{\ProbabilitySimplex}{\Delta} \newcommand{\ProbedCellCount}{n_{\text{probe}}} \newcommand{\ProcessConditionCheckTime}{T_{\text{proc}}} \newcommand{\ProcessConditionPassProbability}{p_{\text{proc}}} \newcommand{\ProcessNoiseCovariance}{\mathbf{Q}} \newcommand{\ProcessNoiseIntensity}{\mathbf{Q}} \newcommand{\ProcessNoiseVector}{\mathbf{w}} \newcommand{\ProcessedDataVolume}{D_{\text{vol,processed}}} \newcommand{\ProcessedKeyTileIndex}{t} \newcommand{\ProcessedSampleCount}{N_{\text{samples}}} \newcommand{\ProcessingBufferCount}{N_{\text{processing}}} \newcommand{\ProcessingPrice}{R_{\text{process/GB}}} \newcommand{\ProductFactorIndex}{j} \newcommand{\ProductionExecutionCount}{N_{\text{prod}}} \newcommand{\ProductionModelCount}{N_{\text{models}}} \newcommand{\ProductionOnlyFailureCount}{n_{\text{prod}}} \newcommand{\ProfileAccelerationBound}{a_{\max}} \newcommand{\ProfileJerk}{\dot{a}} \newcommand{\ProgramGoodput}{\eta_{\text{program}}} \newcommand{\ProgramInvariantPredicate}{P} \newcommand{\ProgramState}{s} \newcommand{\ProgramStateSpace}{\Sigma} \newcommand{\ProjectedSeamState}{\hat{\mathbf{x}}_{\text{seam}}} \newcommand{\ProjectedTrajectoryRecord}{R} \newcommand{\ProjectedTurnGradientContribution}{Z} \newcommand{\ProjectionBallRadius}{\epsilon} \newcommand{\ProjectionConstraintSet}{\mathcal{C}} \newcommand{\ProjectiveDistanceSample}{s} \newcommand{\ProjectiveRayScale}{\lambda} \newcommand{\ProjectiveScaleFactor}{s} \newcommand{\PromotedFusionInputRank}{r'} \newcommand{\PromptLength}{S_{\text{prompt}}} \newcommand{\PromptToken}{x} \newcommand{\PromptTokensSent}{S_{\text{sent}}} \newcommand{\PropagatedPositionStandardDeviation}{\sigma_p} \newcommand{\PropensityPriorApprovalShape}{a} \newcommand{\PropensityPriorRejectionShape}{b} \newcommand{\ProportionTestStatistic}{z} \newcommand{\ProportionalGainMatrix}{\mathbf{K}_{p}} \newcommand{\ProportionalPotentialEnergy}{\mathcal{L}_{\text{pos}}} \newcommand{\ProposalDeserializationTime}{t_{\text{deser}}} \newcommand{\ProposalExpiryInstant}{t_{\text{valid}}} \newcommand{\ProposalFirstWaypoint}{\mathbf{a}_0} \newcommand{\ProposalLinkTransportTime}{t_{\text{link}}} \newcommand{\ProposalParameterVector}{\boldsymbol{\psi}} \newcommand{\ProposalPayload}{\mathcal{P}} \newcommand{\ProposedAccess}{r} \newcommand{\ProposedContactForce}{F_{\text{nom}}} \newcommand{\ProposedEndEffectorPoseSequence}{\mathbf{X}_{1:H}} \newcommand{\ProposedGripperCommandSequence}{\mathbf{g}_{1:H}} \newcommand{\ProposedJointPositionSequence}{\mathbf{Q}_{1:H}} \newcommand{\ProposedJointVelocitySequence}{\dot{\mathbf{Q}}_{1:H}} \newcommand{\ProposedOperation}{o} \newcommand{\ProposerConfidenceScore}{\hat{p}} \newcommand{\ProposerEvaluationRate}{f} \newcommand{\ProposerInferenceTime}{t_{\text{infer}}} \newcommand{\ProprioceptiveInputSpace}{\mathcal{X}} \newcommand{\ProprioceptiveInputVector}{\mathbf{x}} \newcommand{\ProprioceptiveTokenEmbeddings}{\mathbf{z}_{\text{proprio}}} \newcommand{\ProtectedAttribute}{a} \newcommand{\ProtectedGroupMembership}{G} \newcommand{\ProtectedTrainingRecord}{R} \newcommand{\ProtectionSwitchResistance}{R_{\text{switch}}} \newcommand{\ProtectiveClearanceMargin}{\delta_{\text{margin}}} \newcommand{\ProtectiveSeparationDistance}{S_p} \newcommand{\ProtectiveSpringStiffness}{k_{\text{spring}}} \newcommand{\ProtectiveSpringTravel}{\delta} \newcommand{\ProxyTrajectoryReward}{\hat{R}} \newcommand{\PrunedWeightMatrix}{\hat{\mathbf{W}}} \newcommand{\PruningMask}{\mathbf{M}} \newcommand{\PruningMaskEntry}{M_{i,j}} \newcommand{\PruningThreshold}{\delta_{\text{prune}}} \newcommand{\PsuMttf}{\text{MTTF}_{\text{psu}}} \newcommand{\PtpExchangeTimestamp}{t} \newcommand{\PtpForwardPathDelay}{T_{\text{prop}, M \to S}} \newcommand{\PtpHardwareTimestamp}{t_{\text{PTP}}} \newcommand{\PtpPropagationDelay}{T_{\text{prop}}} \newcommand{\PtpReversePathDelay}{T_{\text{prop}, S \to M}} \newcommand{\PublicationEpoch}{t_{\text{pub}}} \newcommand{\PufChallenge}{C} \newcommand{\PufResponse}{R} \newcommand{\PufResponseBit}{r} \newcommand{\PulseRoundTripTime}{\Delta t} \newcommand{\PureNoiseActionChunk}{\mathbf{A}^N} \newcommand{\PureTransportDelay}{T_d} \newcommand{\PwmPeriod}{T_{\text{pwm}}} \newcommand{\QuadratureAxisInductance}{L_q} \newcommand{\QuadratureAxisVoltage}{v_q} \newcommand{\QualifiedAdmissionRate}{r} \newcommand{\QualityObjective}{S_{\text{quality}}} \newcommand{\QuantileLevel}{u} \newcommand{\QuantileProbabilityLevel}{q} \newcommand{\QuantileThresholdCandidate}{x} \newcommand{\QuantizationBitWidth}{b} \newcommand{\QuantizationBlockSize}{b_{\text{block}}} \newcommand{\QuantizationScale}{s} \newcommand{\QuantizationStep}{\delta} \newcommand{\QuantizationZeroPoint}{z} \newcommand{\QuantizedGradient}{\mathbf{g}_{\text{int8}}} \newcommand{\QuantizedIntegerCode}{x_q} \newcommand{\QuantizedWeightEntry}{W_{ik}} \newcommand{\QuantizerInput}{x} \newcommand{\QuarterCycleCompressionTime}{t_{\text{peak}}} \newcommand{\QueryAxisLabel}{i} \newcommand{\QueryBlockCount}{T_r} \newcommand{\QueryBlockIndex}{i} \newcommand{\QueryBlockSize}{B_r} \newcommand{\QueryBoundaryCount}{S_{\text{eff}}} \newcommand{\QueryBufferPosition}{i} \newcommand{\QueryComponent}{q_{im}} \newcommand{\QueryPrice}{p_{\text{query}}} \newcommand{\QueryProjectionMatrix}{\mathbf{W}_{Q}} \newcommand{\QuerySensitivity}{\Delta} \newcommand{\QuerySourceMatrix}{\mathbf{X}_{Q}} \newcommand{\QueryVector}{\mathbf{q}} \newcommand{\QueryWord}{q} \newcommand{\QueryWordDocumentFrequency}{n} \newcommand{\QueryWordFrequency}{f} \newcommand{\QueryWorkspaceGeneration}{g_q} \newcommand{\QueueArrivalTime}{t_{\text{arr}, i}} \newcommand{\QueueServerCount}{c} \newcommand{\QueueServiceVariationCoefficient}{c_{s}} \newcommand{\QueueSystemCapacity}{K} \newcommand{\QueueWaitTime}{W_{q}} \newcommand{\QueuedJobCount}{N_{\text{queue}}} \newcommand{\QueuedTransactionBytes}{D_{\text{vol}}} \newcommand{\QueuedTransactionCount}{K} \newcommand{\QueuedTransactionSet}{\mathcal{Q}} \newcommand{\QueueingLatency}{L_{\text{lat,queue}}} \newcommand{\QuiescentJunctionTemperature}{T_{\text{j},\text{target}}} \newcommand{\QuiescentSocPower}{P_{\text{base}}} \newcommand{\QuinticBlendCoefficient}{\mathbf{a}} \newcommand{\QuotaReductionSensitivity}{\gamma_{\text{rate}}} \newcommand{\RadarRangeResolution}{\Delta R} \newcommand{\RadialBasisKernelCoefficient}{\gamma} \newcommand{\RadialDistortionCoefficient}{k} \newcommand{\RadialRange}{R} \newcommand{\RadialRangeStandardDeviation}{\sigma_R} \newcommand{\RadiationWavelength}{\lambda} \newcommand{\RailVoltageTolerance}{\delta_{\text{tol}}} \newcommand{\RandomEnvironmentState}{S} \newcommand{\RandomRetainedElementCount}{K_{\text{rand}}} \newcommand{\RandomSampleCollectionSize}{D_{\text{eval,total}}} \newcommand{\RandomVectorDimension}{d} \newcommand{\RandomizationClusterCount}{K} \newcommand{\RandomizedMechanism}{\mathcal{M}} \newcommand{\RandomizedSmoothingNoise}{\boldsymbol{\delta}} \newcommand{\RangeObservation}{z} \newcommand{\RangeObservationHistory}{z_{1:t}} \newcommand{\RankComponentIndex}{s} \newcommand{\RankConstrainedMatrix}{\mathbf{A}} \newcommand{\RankContribution}{x} \newcommand{\RankCountBinaryExponent}{m} \newcommand{\RankFusionSmoothingConstant}{k_{\text{rrf}}} \newcommand{\RankIndex}{i} \newcommand{\RankReductionResult}{y} \newcommand{\RankingFunction}{V} \newcommand{\RatedActuatorTorque}{\tau_{\text{rated}}} \newcommand{\RatedCurrentEquilibriumTemperature}{T_{\text{eq}}} \newcommand{\RatedFatigueLife}{L_{10}} \newcommand{\RatedJointTorque}{\boldsymbol{\tau}_{\text{rated}}} \newcommand{\RatingCategory}{y} \newcommand{\RatioClippingWidth}{\epsilon_{\text{clip}}} \newcommand{\RationaleTokens}{z} \newcommand{\RawClearanceBarrierFunction}{h_{\text{raw}}} \newcommand{\RawDataUploadEnergy}{E_{\text{raw}}} \newcommand{\RawHardwareFaultRate}{\lambda_{\text{raw}}} \newcommand{\RawPipelineInput}{x} \newcommand{\RawRecordCount}{N} \newcommand{\RawSensoryData}{\mathbf{S}} \newcommand{\RayReturnRange}{r_{\text{hit}}} \newcommand{\RayStepCount}{N_{\text{steps}}} \newcommand{\RayTraversalLength}{d_{\text{ray}}} \newcommand{\RayVoxelRange}{r_{\text{voxel}}} \newcommand{\RayleighDissipationFunction}{\mathcal{D}} \newcommand{\ReachabilityCostate}{\mathbf{p}} \newcommand{\ReachabilityHamiltonian}{\mathcal{H}} \newcommand{\ReachabilityHorizonInstant}{t'} \newcommand{\ReachabilityLevelFunction}{V} \newcommand{\ReachabilityTerminalTime}{T} \newcommand{\ReachableArtifactNode}{u} \newcommand{\ReachableDistance}{d_{\text{reach}}} \newcommand{\ReachableWorkspace}{\mathcal{W}} \newcommand{\ReadEndSequenceCount}{c_{\text{end}}} \newcommand{\ReadStartSequenceCount}{c_{\text{start}}} \newcommand{\ReadTimeCeiling}{R} \newcommand{\RealDataset}{\mathcal{S}_{\text{real}}} \newcommand{\RealTimeTaskIndex}{i} \newcommand{\RealityGapVector}{\boldsymbol{\Delta}_{\text{sim2real}}} \newcommand{\RealizedActuatorEffort}{u_{\text{act}}} \newcommand{\RealizedArrivalCount}{n} \newcommand{\RealizedDamageOutcome}{y} \newcommand{\RealizedDampingPower}{P_d} \newcommand{\RealizedDeviceComputeRate}{R} \newcommand{\RealizedFalseAlarmProbability}{\alpha_{*}} \newcommand{\RealizedMissedDegradationProbability}{\beta_{*}} \newcommand{\RealizedServiceTime}{s} \newcommand{\ReceiptSampleIndex}{t_{\text{recv}}} \newcommand{\ReceiveBandwidth}{\text{BW}_{\text{rx}}} \newcommand{\ReceiverOverhead}{o_{\text{recv}}} \newcommand{\ReceiverTimingJitter}{\sigma_{\Delta t}} \newcommand{\RecentUsageShare}{F_{\text{actual}}} \newcommand{\RecommenderItemCount}{N_{\text{items}}} \newcommand{\RecommenderUserCount}{N_{\text{users}}} \newcommand{\ReconcilableToolInterface}{\mathbb{T}_{a}} \newcommand{\ReconstructedGradient}{\hat{\mathbf{g}}} \newcommand{\ReconstructedWeight}{\hat{w}} \newcommand{\RecordAdequacyPassProbability}{p_{\text{record}}} \newcommand{\RecordSizeCeiling}{s_{\max}} \newcommand{\RecordedAuthorityState}{S_{\text{auth}}} \newcommand{\RecoveryCompletionInstant}{t_{\text{rec}}} \newcommand{\RecoveryPoseTolerance}{\epsilon_{\text{sync}}} \newcommand{\RecoveryTargetLogPosition}{j_{\text{target}}} \newcommand{\RecoveryWarmupTime}{T_{\text{warmup}}} \newcommand{\RecurrentHiddenBias}{\mathbf{b}_{\text{h}}} \newcommand{\RecurrentHiddenState}{\mathbf{h}} \newcommand{\RecurrentInputWeights}{\mathbf{W}_{\text{hx}}} \newcommand{\RecurrentOutputWeights}{\mathbf{W}_{\text{yh}}} \newcommand{\RecurrentStateWeights}{\mathbf{W}_{\text{hh}}} \newcommand{\ReduceScatterCompletionTime}{T_{\text{reducescatter}}} \newcommand{\ReducedBoundaryConditionVector}{\mathbf{b}_{\text{red}}} \newcommand{\ReducedImpactMass}{m_{\text{red}}} \newcommand{\ReducibleLoss}{\hat{\mathcal{L}}} \newcommand{\ReductionInputCount}{n} \newcommand{\RedundantComponentCount}{N_{\text{red}}} \newcommand{\RedundantReplicaCount}{k} \newcommand{\RedundantServiceAvailability}{A_{\text{system}}} \newcommand{\ReferenceActionDisadvantage}{A_t^{\pi^*}} \newcommand{\ReferenceAssessedFailure}{F} \newcommand{\ReferenceBinIndex}{b} \newcommand{\ReferenceBinProportion}{E} \newcommand{\ReferenceCostToGo}{Q_t^{\pi^*}} \newcommand{\ReferenceDisagreementProbability}{\mathcal{L}} \newcommand{\ReferenceDistribution}{p} \newcommand{\ReferenceJointAccelerations}{\ddot{\mathbf{q}}^{\text{ref}}} \newcommand{\ReferenceJointPosition}{q_{\text{reference}}} \newcommand{\ReferenceJointPositions}{\mathbf{q}^{\text{ref}}} \newcommand{\ReferenceJointVelocities}{\dot{\mathbf{q}}^{\text{ref}}} \newcommand{\ReferenceLogProbabilitySum}{\Delta_{\text{ref}}} \newcommand{\ReferenceMixingProbability}{\lambda} \newcommand{\ReferenceNextTokenDistribution}{q} \newcommand{\ReferencePosition}{\mathbf{r}} \newcommand{\ReferenceProbabilityRatio}{z} \newcommand{\ReferenceRelativeScore}{\Delta_\theta} \newcommand{\ReferenceRequestLength}{S_{\text{ref}}} \newcommand{\ReferenceSampleEmpiricalCdf}{F} \newcommand{\ReferenceStateDisagreementRate}{\epsilon_E} \newcommand{\ReferenceStateDistribution}{d_{\pi^*}} \newcommand{\ReferenceStepDisagreementRate}{\epsilon} \newcommand{\ReferenceWindingResistance}{R_0} \newcommand{\ReflectedContactForce}{F_{\text{contact}}} \newcommand{\ReflectedRotorInertia}{J_{\text{ref}}} \newcommand{\ReflectedRotorInertiaMatrix}{\mathbf{J}_m} \newcommand{\ReflectedTransmissionInputInertia}{J_{\text{ref,in}}} \newcommand{\ReflectionAngle}{\theta_{\text{refl}}} \newcommand{\ReflexCollisionBudget}{T_{\text{reflex\_budget}}} \newcommand{\RegeneratedBrakingEnergy}{E_{\text{regen}}} \newcommand{\RegenerativeBrakingTorque}{\tau_{\text{brake}}} \newcommand{\RegenerativeRecoveryEfficiency}{\eta_{\text{regen}}} \newcommand{\RegisterSetupTime}{t_{\text{setup}}} \newcommand{\RegisteredDescriptorCount}{n_{\text{reg}}} \newcommand{\RegularizedEulerIntegral}{I} \newcommand{\RejectionDecodeStep}{t_{\text{cut}}} \newcommand{\RelationalSelection}{\sigma} \newcommand{\RelativeContrastTolerance}{\epsilon_{\text{contrast}}} \newcommand{\RelativeDeviationBound}{\delta} \newcommand{\RelativeImprovementFraction}{\delta} \newcommand{\RelativeStandardError}{r} \newcommand{\RelevantRecordSet}{\mathcal{D}^*} \newcommand{\ReliabilityTargetIndex}{i} \newcommand{\ReliableDetectionFrameCount}{N_{\text{frames}}} \newcommand{\RemainingCallCount}{N_{\text{rem}}} \newcommand{\RemainingDistanceEstimate}{\hat{s}} \newcommand{\RemainingExecutionLease}{T_{\text{lease,rem}}} \newcommand{\RemainingHarmDistance}{d_{\text{rem}}} \newcommand{\RemainingIntentTime}{T_{\text{rem}}} \newcommand{\RemainingReturn}{R_{\geq k}} \newcommand{\RemainingUprightDistance}{s} \newcommand{\RemoteHardwareEfficiency}{\eta_{\text{hw,remote}}} \newcommand{\RemotePathTime}{T_{\text{remote}}} \newcommand{\RemotePeakRate}{R_{\text{peak,remote}}} \newcommand{\RenderedPixelColor}{C} \newcommand{\RenewalJitterAllowance}{T_{\text{jitter}}} \newcommand{\RenyiDivergence}{\mathcal{D}_{\alpha_{\text{R}}}} \newcommand{\RenyiOrder}{\alpha_{\text{R}}} \newcommand{\RenyiPrivacyBudget}{\epsilon_{\text{R}}} \newcommand{\RepairAttemptCost}{C_{\text{repair}}} \newcommand{\RepairCap}{K_{\text{repair}}} \newcommand{\RepairCapabilityGrant}{\Gamma_{\text{repair}}} \newcommand{\RepairFirstCost}{C_{\text{repair\ first}}} \newcommand{\RepairPatchArtifact}{P} \newcommand{\RepairSuccessProbability}{p} \newcommand{\RepairTurnLatency}{T_{\text{repair}}} \newcommand{\ReparameterizationNoise}{\boldsymbol{\epsilon}} \newcommand{\RepeatedRunCount}{k} \newcommand{\RepeatedRunMean}{\mu_{\text{run}}} \newcommand{\RepeatedRunStandardDeviation}{\sigma_{\text{run}}} \newcommand{\ReplacementLatency}{L} \newcommand{\ReplacementTimingReserve}{T_{\text{reserve}}} \newcommand{\ReplanRequestOffset}{T_{\text{request}}} \newcommand{\ReplayBuffer}{\mathcal{M}} \newcommand{\ReplayBufferTransitionCount}{n_{\text{replay}}} \newcommand{\ReplayedErrorCovariance}{\mathbf{P}_{t_{\text{recv}}}} \newcommand{\ReplayedStateEstimate}{\hat{\mathbf{x}}_{t_{\text{recv}}}} \newcommand{\ReplicaAvailability}{A_{\text{single}}} \newcommand{\ReplicaColdStartTime}{T_{\text{cold-start}}} \newcommand{\ReplicaCount}{R} \newcommand{\ReplicaModelLoadTime}{T_{\text{load}}} \newcommand{\ReplicaProvisioningTime}{T_{\text{provision}}} \newcommand{\ReplicaWarmupTime}{T_{\text{warmup}}} \newcommand{\ReplyLossProbability}{q_{\text{rep}}} \newcommand{\RepositoryEdgeSourceIndex}{i} \newcommand{\RepositoryEdgeTargetIndex}{j} \newcommand{\RepositoryEdgeWeight}{A} \newcommand{\RepositoryEdgeWeightMatrix}{\mathbf{A}} \newcommand{\RepositoryFileCount}{n} \newcommand{\RepositoryGraphEdgeSet}{E} \newcommand{\RepositoryGraphVertexSet}{V} \newcommand{\RepositoryTransitionMatrix}{\mathbf{P}_{\text{graph}}} \newcommand{\ReprojectionResidual}{\epsilon_{\text{reproj}}} \newcommand{\RepublicationIndex}{k} \newcommand{\RepublicationPeriod}{T_{\text{rep}}} \newcommand{\RequantizationScale}{s_{\text{eff}}} \newcommand{\RequestCompressionRatio}{\gamma_{\text{req}}} \newcommand{\RequestConcurrency}{Q_{\text{req}}} \newcommand{\RequestLossProbability}{q_{\text{req}}} \newcommand{\RequestOutputLength}{S} \newcommand{\RequestPromptTokens}{\mathbf{x}} \newcommand{\RequestQueueTime}{T_{\text{queue}}} \newcommand{\RequestResidenceTime}{W} \newcommand{\RequestResponseTime}{t} \newcommand{\RequestSeenBatchSize}{B_{\text{req}}} \newcommand{\RequestServiceTime}{T_{\text{svc}}} \newcommand{\RequestTimeInSystem}{T_{\text{lat}}} \newcommand{\RequestedActionTap}{a_{\text{req}}} \newcommand{\RequiredClearance}{C_{\text{safe}}} \newcommand{\RequiredComponentCount}{N} \newcommand{\RequiredDetectionRange}{d_{\text{detect}}} \newcommand{\RequiredInputBandwidth}{\text{BW}_{\text{required}}} \newcommand{\RequiredMemoryBandwidth}{\text{BW}_{\text{req}}} \newcommand{\RequiredPremiseClaim}{P} \newcommand{\RequiredPremiseConfidence}{p} \newcommand{\RequiredPremiseCount}{n} \newcommand{\RequiredResultCount}{k} \newcommand{\RequiredScenarioCellCount}{N_{\text{req}}} \newcommand{\RequiredScenarioSet}{\mathcal{S}_{\text{req}}} \newcommand{\RequiredServiceRate}{\mu_{\text{required}}} \newcommand{\RequiredTaskPairCount}{N'} \newcommand{\RequiredUsersPerVariant}{n} \newcommand{\ResampledReplacementToken}{T_4'} \newcommand{\ReservedDeviceMemory}{M_{\text{reserve}}} \newcommand{\ResetCalibrationTime}{t_{\text{calibration}}} \newcommand{\ResetDuration}{t_{\text{rst}}} \newcommand{\ResetLatency}{T_{\text{reset}}} \newcommand{\ResidentStopDistance}{d_{\text{suffix}}} \newcommand{\ResidentWeightMemory}{M_{\text{weights,resident}}} \newcommand{\ResidualAdapterFunction}{A} \newcommand{\ResidualBlockOutput}{\mathbf{y}} \newcommand{\ResidualCorrectionCeiling}{\Delta_{\max}} \newcommand{\ResidualDynamicsPerturbation}{\Delta \mathbf{f}} \newcommand{\ResidualFrequencyError}{\Delta f_{\text{res}}} \newcommand{\ResidualFunction}{\mathcal{F}} \newcommand{\ResidualGate}{g} \newcommand{\ResidualPolicyTorque}{\boldsymbol{\tau}_{\text{res},\theta}} \newcommand{\ResidualSamplingDistribution}{p_{\text{res}}} \newcommand{\ResizedWorkerCount}{N_{\text{new}}} \newcommand{\ResolutionScalingRatio}{\gamma} \newcommand{\ResourceChangeRate}{r_{\text{chg}}} \newcommand{\ResourceCostBudget}{C_{\text{max}}} \newcommand{\ResourceTypeIndex}{r} \newcommand{\ResourceUtilization}{U} \newcommand{\ResponseActionTokens}{a} \newcommand{\ResponseMetadata}{\mathbf{m}} \newcommand{\ResponsePayload}{\mathbf{y}} \newcommand{\ResponseReward}{r} \newcommand{\ResponseThreshold}{\tau} \newcommand{\ResponseTimeDistributionFunction}{F} \newcommand{\ResponseTimeIterationIndex}{\ell} \newcommand{\ResponseTimeStandardDeviation}{\sigma_t} \newcommand{\RestConfiguration}{\mathbf{q}_{\text{rest}}} \newcommand{\RestitutionCoefficient}{e} \newcommand{\RestoreWorkerCount}{w} \newcommand{\RestrictedAccelerationBound}{a_{\text{restricted}}} \newcommand{\RestrictedSpeedBound}{v_{\text{restricted}}} \newcommand{\ResultActionTime}{T_{\text{action}}} \newcommand{\ResumeTime}{T_{\text{resume}}} \newcommand{\RetainedDigestCount}{m} \newcommand{\RetainedGradientElementCount}{K_{\text{top}}} \newcommand{\RetainedProductiveTime}{T_{\text{productive}}} \newcommand{\RetainedSpectralEnergyFraction}{\eta_r} \newcommand{\RetainingCallCount}{H_{\text{rem}}} \newcommand{\RetiringChunkJointVelocity}{\dot{q}_A} \newcommand{\RetiringChunkReferenceState}{\mathbf{x}_A} \newcommand{\RetrainingComputeCost}{C_{\text{compute}}} \newcommand{\RetrainingDeploymentCost}{C_{\text{deployment}}} \newcommand{\RetrainingInterval}{T} \newcommand{\RetrainingRiskCost}{C_{\text{risk}}} \newcommand{\RetrainingRunCost}{C} \newcommand{\RetrainingValidationCost}{C_{\text{validation}}} \newcommand{\RetrievalCollectionSize}{N} \newcommand{\RetrievalCutoffCount}{k} \newcommand{\RetrievalMethodIndex}{i} \newcommand{\RetrievedRecordSet}{\mathcal{R}} \newcommand{\RetryAttemptIndex}{j} \newcommand{\RetryBackoffInterval}{b} \newcommand{\RetryJitterDelay}{d} \newcommand{\ReturnLevel}{z} \newcommand{\ReturnPeriodTrialCount}{T} \newcommand{\ReturnStepOffset}{k} \newcommand{\ReturnedClassLabel}{c} \newcommand{\ReusedPrefixLength}{S_{\text{match}}} \newcommand{\ReverseModeWorkConstant}{C} \newcommand{\ReverseTransitionCovariance}{\boldsymbol{\Sigma}} \newcommand{\ReverseTransitionMean}{\boldsymbol{\mu}_\theta} \newcommand{\RevertFidelity}{\rho_{\text{revert}}} \newcommand{\ReviewerFalseApprovalIndicator}{X} \newcommand{\ReviewerIndex}{j} \newcommand{\RevisionPassProbability}{p_{\text{rev}}} \newcommand{\Reward}{r} \newcommand{\RewardFunction}{r} \newcommand{\RewardModel}{r} \newcommand{\RightEvasionAction}{\mathbf{a}_{\text{right}}} \newcommand{\RightSingularVectorMatrix}{\mathbf{Q}} \newcommand{\RigidGangJob}{J} \newcommand{\RigidImpactInstant}{t_{\text{impact}}} \newcommand{\RigidTransformTranslation}{\mathbf{t}} \newcommand{\RingAllReduceBandwidthTime}{T_{\text{bandwidth}}} \newcommand{\RingAllReduceCompletionTime}{T_{\text{ring}}} \newcommand{\RingAllReduceStartupTime}{T_{\text{latency}}} \newcommand{\RingBufferHorizon}{T_{\text{buffer}}} \newcommand{\RingBufferSlotCount}{N_{\text{buffer}}} \newcommand{\RingStepIndex}{s} \newcommand{\RingTreeCrossoverPayload}{M_{\text{crossover}}} \newcommand{\RmsMotorTorque}{\tau_{\text{rms}}} \newcommand{\RmspropSquaredGradientAverage}{s} \newcommand{\RobotAction}{\mathbf{a}} \newcommand{\RobotApproachSpeed}{v_r} \newcommand{\RobotApproachVelocity}{v_{\text{robot}}} \newcommand{\RobotObservation}{\mathbf{o}} \newcommand{\RobotPosition}{x_{\text{robot}}} \newcommand{\RobotPositionUncertainty}{Z_r} \newcommand{\RobotReactionTime}{T_r} \newcommand{\RobotReactionTravel}{S_r} \newcommand{\RobotStoppingTravel}{S_s} \newcommand{\RobotStructuralStiffness}{k_{\text{robot}}} \newcommand{\RobotTransitVolume}{\mathcal{T}_{\text{robot}}} \newcommand{\RollingShutterDistortion}{\Delta \mathbf{x}} \newcommand{\RollingShutterFrameSkew}{\Delta t_{\text{skew}}} \newcommand{\RollingShutterRowReadout}{t_{\text{row}}} \newcommand{\RolloutAction}{a} \newcommand{\RolloutActionSequence}{\mathbf{a}_{0:T}} \newcommand{\RolloutAdmissionAge}{\Delta T_{\text{rollout}}} \newcommand{\RolloutAssessmentTime}{T_{v}} \newcommand{\RolloutDuration}{T_{\text{rollout}}} \newcommand{\RolloutEnvironmentState}{s} \newcommand{\RolloutHorizon}{T} \newcommand{\RolloutLoss}{\mathcal{L}} \newcommand{\RolloutPolicyParameters}{\theta_{\text{old}}} \newcommand{\RolloutPolicyTokenCount}{N} \newcommand{\RolloutStateSequence}{s_{0:T}} \newcommand{\RolloutStepCount}{N} \newcommand{\RolloutStepIndex}{k} \newcommand{\RolloutSurrogateObjective}{\mathcal{L}} \newcommand{\RolloutTurnIndex}{k} \newcommand{\RooflineRidgePoint}{I_{\text{ridge}}} \newcommand{\RotaryRotationMatrix}{\mathbf{R}} \newcommand{\RotatedActivationMatrix}{\mathbf{X}'} \newcommand{\RotatedWeightMatrix}{\mathbf{W}'} \newcommand{\RotatingBodyAngularSpeed}{\omega} \newcommand{\RotatingBodyInertia}{J} \newcommand{\RotationOriginAcceleration}{\mathbf{a}_O} \newcommand{\RotationOriginVelocity}{\mathbf{v}_O} \newcommand{\RotationalKineticEnergy}{E_{k,\text{rot}}} \newcommand{\RotationalSpringStiffness}{K} \newcommand{\RotorAngularSpeed}{\omega_m} \newcommand{\RotorInertia}{J_{\text{rotor}}} \newcommand{\RotorPolePairCount}{N_{\text{poles}}} \newcommand{\RoundCommunicationVolume}{M_r} \newcommand{\RoundDownloadVolume}{M_{\text{download},r}} \newcommand{\RoundDuration}{t_r} \newcommand{\RoundEmittedTokenCount}{N_{\text{emit}}} \newcommand{\RoundProtocolVolume}{M_{\text{protocol},r}} \newcommand{\RoundRetryVolume}{M_{\text{retry},r}} \newcommand{\RoundSampleCount}{n_{\text{round}}} \newcommand{\RoundUploadVolume}{M_{\text{upload},r}} \newcommand{\RoundedClassProbability}{p^{\text{rnd}}} \newcommand{\RoundingDecimalCount}{d_{\text{dec}}} \newcommand{\RoutedExpertCount}{k_{\text{experts}}} \newcommand{\RouterGateProbability}{p_{\text{gate}}} \newcommand{\RowActivationDelay}{t_{\text{RCD}}} \newcommand{\RowActiveTime}{t_{\text{RAS}}} \newcommand{\RowAttitudeIncrement}{\Delta \boldsymbol{\theta}_{\text{att}}} \newcommand{\RowConflictCount}{N_{\text{conflict}}} \newcommand{\RowCycleTime}{t_{\text{RC}}} \newcommand{\RowExposureStartTime}{t_{\text{scan}}} \newcommand{\RowModeComponentVector}{\mathbf{a}_s} \newcommand{\RowModeFactorMatrix}{\mathbf{A}} \newcommand{\RowModeFactorSlice}{\mathbf{a}} \newcommand{\RowParallelOutputMatrix}{\mathbf{Z}} \newcommand{\RowParallelWeightMatrix}{\mathbf{B}} \newcommand{\RowPrechargeTime}{t_{\text{RP}}} \newcommand{\RunIndexSubset}{J} \newcommand{\RuntimeGoodput}{\eta_{\text{runtime}}} \newcommand{\RuntimeReserveMemory}{M_{\text{runtime}}} \newcommand{\SCurveAccelerationPhaseTime}{T_{\text{acc}}} \newcommand{\SafeApproachSpeedEnvelope}{v_{\text{safe}}} \newcommand{\SafeControlSet}{\mathcal{U}_{\text{safe}}} \newcommand{\SafeOverrideCommand}{\mathbf{u}_{\text{safe}}} \newcommand{\SafeSeparationDistance}{d_{\text{safe}}} \newcommand{\SafeSetProjection}{\mathcal{P}_{\mathcal{C}}} \newcommand{\SafeStateConstraintSet}{\mathcal{X}_{\text{safe}}} \newcommand{\SafeStateSet}{\mathcal{X}_{\text{safe}}} \newcommand{\SafeWorldState}{s_A} \newcommand{\SafeguardSeparationDistance}{S} \newcommand{\SafeguardStoppingTime}{T} \newcommand{\SafetyBoundaryManifold}{\partial \mathcal{C}} \newcommand{\SagaCompensatingStep}{C} \newcommand{\SagaFailedForwardStep}{F_k^{\text{fail}}} \newcommand{\SagaForwardStep}{F} \newcommand{\SagaStepIndex}{k} \newcommand{\SampleAcquisitionPrice}{c_{\text{sample}}} \newcommand{\SampleGradientStandardDeviation}{\sigma} \newcommand{\SampleLabelingPrice}{c_{\text{label}}} \newcommand{\SampleStatistic}{\widehat{\theta}} \newcommand{\SampleStorageSize}{s_{\text{sample}}} \newcommand{\SampledPolicyToken}{w} \newcommand{\SampledSimulationParameterVector}{\tilde{\boldsymbol{\xi}}} \newcommand{\SampledUnit}{y} \newcommand{\SampledUnitCount}{m} \newcommand{\SamplingParameters}{\mathbf{\Theta}_{\text{sample}}} \newcommand{\SamplingPeriod}{T_s} \newcommand{\SamplingRate}{f_s} \newcommand{\SamplingTemperature}{\tau_{\text{temp}}} \newcommand{\SandboxColdBootTime}{T_{\text{cold}}} \newcommand{\SaturatedJointTorque}{\boldsymbol{\tau}_{\text{act}}} \newcommand{\SavedEngineeringTime}{T_{\text{saved}}} \newcommand{\ScalarFieldSize}{k} \newcommand{\ScalarGraphFunction}{f} \newcommand{\ScalarKalmanGain}{g} \newcommand{\ScalarTrackingError}{e} \newcommand{\ScalarTrackingErrorAcceleration}{\ddot{e}} \newcommand{\ScalarTrackingErrorRate}{\dot{e}} \newcommand{\ScaleCoefficient}{A_{\mathcal{L}}} \newcommand{\ScaledBatchSize}{B_{\text{new}}} \newcommand{\ScaledJointStiffnessMatrix}{\tilde{\mathbf{K}}} \newcommand{\ScaledLearningRate}{\eta_{\text{new}}} \newcommand{\ScaledResource}{X} \newcommand{\ScaledSerialFraction}{s} \newcommand{\ScalingCurveWorkerCount}{k} \newcommand{\ScalingEfficiency}{\eta_{\text{scaling}}} \newcommand{\ScalingExponent}{\alpha_{\text{scale}}} \newcommand{\ScalingLawLoss}{\mathcal{L}} \newcommand{\ScanCapabilityGrant}{\Gamma_{\text{scan}}} \newcommand{\ScatteringCrossSection}{\sigma_s} \newcommand{\ScenarioCellRecordCount}{N_{\text{cell}}} \newcommand{\SceneRadiance}{I} \newcommand{\ScheduleFinishTime}{T_{\text{finish}}} \newcommand{\ScheduledSessionDuration}{T_{\text{sched}}} \newcommand{\SchedulingClassWeight}{w} \newcommand{\SchedulingGoodput}{\eta_{\text{scheduling}}} \newcommand{\SchedulingIntervalLength}{t} \newcommand{\ScoreNoiseStandardDeviation}{\sigma} \newcommand{\ScoreNoiseVector}{\mathbf{z}} \newcommand{\ScoreRefreshInterval}{k_{\text{refresh}}} \newcommand{\ScoredPrefixLength}{S_{\text{step}}} \newcommand{\ScoredStepCount}{J} \newcommand{\ScoredStepIndex}{j} \newcommand{\ScoredToolCall}{a} \newcommand{\ScoredToolCallCount}{N} \newcommand{\ScoringErrorStandardDeviation}{\sigma} \newcommand{\ScreenSpaceCovariance}{\boldsymbol{\Sigma}_{2D}} \newcommand{\ScreenedFeature}{x} \newcommand{\ScreenedFeatureSet}{X} \newcommand{\ScreeningMissRate}{m} \newcommand{\SeamActualAccelerations}{\ddot{\mathbf{q}}_{\text{actual}}} \newcommand{\SeamActualConfiguration}{\mathbf{q}_{\text{actual}}} \newcommand{\SeamActualVelocities}{\dot{\mathbf{q}}_{\text{actual}}} \newcommand{\SeamBlendReference}{\mathbf{s}} \newcommand{\SeamBridgeDuration}{T_{\text{blend}}} \newcommand{\SeamBridgePosition}{q_{\text{blend}}} \newcommand{\SeamInstant}{t_{\text{seam}}} \newcommand{\SeamStepTorque}{\tau_{\text{request}}} \newcommand{\SearchBranchingFactor}{b} \newcommand{\SearchDepth}{d_{\max}} \newcommand{\SearchDepthIndex}{d} \newcommand{\SearchQueryEmbedding}{\mathbf{q}} \newcommand{\SecondAdjacentCheckIndex}{b} \newcommand{\SecondAdjacentCheckPassProbability}{p_{b}} \newcommand{\SecondAdjacentCheckSlotTime}{T_{b}} \newcommand{\SecondAtomicGradientUpdate}{B} \newcommand{\SecondCatalogDefinitionCount}{n_{\text{def},B}} \newcommand{\SecondCatalogDefinitionSize}{S_{B}} \newcommand{\SecondClassCoverageFloor}{b} \newcommand{\SecondClientMaskedUpdate}{\mathbf{y}_B} \newcommand{\SecondClientModelParameters}{\theta_B} \newcommand{\SecondComparedGroupLabel}{b} \newcommand{\SecondComparedItem}{j} \newcommand{\SecondFloatingPointAddend}{b} \newcommand{\SecondGroupClassificationThreshold}{\tau_{\text{thr},b}} \newcommand{\SecondGroupQualifiedFraction}{q_b} \newcommand{\SecondGroupSampleApprovalRate}{\hat{p}_b} \newcommand{\SecondGroupSampleSize}{n_b} \newcommand{\SecondJaccardSet}{\mathcal{B}} \newcommand{\SecondRankComputeTime}{T_{\text{rank}_1}} \newcommand{\SecondRaterCategoryFraction}{p_{y,2}} \newcommand{\SecondRingTraceElement}{b} \newcommand{\SecondSummandStandardDeviation}{\sigma_b} \newcommand{\SecondTwinCriticReturnEstimate}{Q_{\phi_2}} \newcommand{\SecurityLabelLattice}{\mathbb{L}} \newcommand{\SecurityLabelSet}{\mathcal{S}_{\text{lab}}} \newcommand{\SelectedActuationCommand}{\mathbf{u}_{\text{act}}} \newcommand{\SelectedDescriptorCount}{n_{\text{sel}}} \newcommand{\SelectedLayerSet}{\mathcal{S}} \newcommand{\SelectionOverheadSize}{S_{\text{sel}}} \newcommand{\SelectionScoreFunction}{f} \newcommand{\SelectionTime}{T_{\text{selection}}} \newcommand{\SelectiveAcceptanceScore}{\kappa} \newcommand{\SelfConsistencySampleCount}{k} \newcommand{\SelfWatchdogTimeout}{T_{\text{self}}} \newcommand{\SenderOverhead}{o_{\text{send}}} \newcommand{\SensingRealityGap}{\Delta_{\text{sens}}} \newcommand{\SensingStageLatency}{T_{\text{sense}}} \newcommand{\SensorErrorBound}{\epsilon} \newcommand{\SensorFeatureTokens}{\mathbf{z}_{\text{sensor}}} \newcommand{\SensorLeverArm}{\mathbf{r}_{P/O}} \newcommand{\SensorLeverArmLength}{r} \newcommand{\SensorLinkTransportTime}{t_{\text{transport}}} \newcommand{\SensorNoiseBound}{\epsilon} \newcommand{\SensorNoiseDensity}{N_{\text{IMU}}} \newcommand{\SensorNoiseStandardDeviation}{\sigma} \newcommand{\SensorObservationFunction}{g} \newcommand{\SensorPatternDictionary}{\mathbf{\Phi}_{\text{dict}}} \newcommand{\SensorPitchAngle}{\theta_{\text{pitch}}} \newcommand{\SensorPointAcceleration}{\mathbf{a}_P} \newcommand{\SensorPointVelocity}{\mathbf{v}_P} \newcommand{\SensorReadoutTime}{t_{\text{readout}}} \newcommand{\SensorReferenceFrame}{\mathcal{F}_{\text{sensor}}} \newcommand{\SensorRowIndex}{y} \newcommand{\SensorTraceMatrix}{\mathbf{X}} \newcommand{\SequenceCounterReading}{S} \newcommand{\SequenceIterationOperations}{c_{\text{decode}}} \newcommand{\SequenceLength}{S} \newcommand{\SequenceToken}{x} \newcommand{\SequentialAttemptIndex}{j} \newcommand{\SequentialBackwardCommunicationTime}{T_{\text{sequential}}} \newcommand{\SequentialCandidateCount}{M} \newcommand{\SequentialCostPerAcceptedTask}{C_{\text{eff,seq}}} \newcommand{\SequentialExecutionTime}{T_{\text{sequential}}} \newcommand{\SequentialLikelihoodRatio}{\Lambda_m} \newcommand{\SequentialLogLikelihoodRatio}{\Lambda_m} \newcommand{\SequentialTestObservation}{X} \newcommand{\SequentialTrialCount}{m} \newcommand{\SerialAutocorrelation}{\rho} \newcommand{\SerialCallCount}{n} \newcommand{\SerialFraction}{r} \newcommand{\SerialLinkClockFrequency}{f_{\text{link}}} \newcommand{\SerialReferenceTime}{T_{\text{serial}}} \newcommand{\SerializationLatency}{L_{\text{lat,serialization}}} \newcommand{\SerializedChunkVolume}{D_{\text{vol,chunk}}} \newcommand{\SerializedTrainingExample}{X} \newcommand{\SeriesComponentCount}{N_{\text{series}}} \newcommand{\SeriesElasticStiffness}{k} \newcommand{\SeriesPsuCount}{n_{\text{psu}}} \newcommand{\ServerAggregationEnergy}{E_{\text{aggregation}}} \newcommand{\ServerIndex}{i} \newcommand{\ServerPower}{P_{\text{server}}} \newcommand{\ServerRoutingWeight}{w} \newcommand{\ServiceRate}{\mu} \newcommand{\ServiceTimeStandardDeviation}{\sigma} \newcommand{\ServiceTimeVariationCoefficient}{c_{s}} \newcommand{\ServingCostPerQuery}{C_{\text{serving}}} \newcommand{\ServingEmpiricalCdf}{F_{P_t}} \newcommand{\ServingPathPredictor}{f_{\text{serve}}} \newcommand{\ServingTransformFunction}{f_{\text{serve}}} \newcommand{\ServingUtilization}{\rho_{\text{serv}}} \newcommand{\ServoFrequencyCorrection}{\Delta f} \newcommand{\SessionAttemptCount}{N_{\text{att}}} \newcommand{\SessionRequestCount}{N_{\text{session}}} \newcommand{\SetMemberPoint}{\mathbf{z}} \newcommand{\SetpointSampleIndex}{k} \newcommand{\SetpointStepInterval}{\Delta t_{\text{step}}} \newcommand{\SettledOperationCharge}{c} \newcommand{\SettledTrajectoryCost}{C} \newcommand{\SetupShareCap}{\phi} \newcommand{\ShadowOnlyFailureCount}{n_{\text{shadow}}} \newcommand{\ShannonEntropy}{H} \newcommand{\ShapedObservationSize}{S_{\text{shaped}}} \newcommand{\ShapedTotalReward}{r_{\text{total}}} \newcommand{\ShapingPotential}{\Phi} \newcommand{\ShardIndex}{s} \newcommand{\ShardReaderCount}{n_{\text{workers}}} \newcommand{\SharedBusBandwidth}{\text{BW}_{\text{bus}}} \newcommand{\SharedHardwareInterferenceDelay}{T_{\text{interf,shared}}} \newcommand{\SharedPoolWorkerCount}{N_{\text{pool}}} \newcommand{\SharedPrefixFraction}{f} \newcommand{\SharedPrefixLength}{S_{\text{prefix}}} \newcommand{\SharedPrefixRequestCount}{n_{\text{req}}} \newcommand{\ShellRelativeThickness}{\epsilon} \newcommand{\ShieldInterceptionCoverage}{c_h} \newcommand{\ShiftedMpcControlSequence}{\tilde{\mathbf{u}}_{0:N_{\text{mpc}}-1}} \newcommand{\ShiftedTestDistribution}{\mathcal{D}'} \newcommand{\ShingleLength}{w} \newcommand{\ShipDecision}{\mathbf{1}_{\text{ship}}} \newcommand{\ShootThroughCurrent}{I_{\text{shoot-through}}} \newcommand{\SiblingPolicyAction}{a'} \newcommand{\SiblingTeamAllocation}{U_{\text{allocated}}} \newcommand{\SightlineRange}{d} \newcommand{\SigmoidFunction}{\sigma} \newcommand{\SignalDimension}{n} \newcommand{\SignalHandoff}{\mathcal{H}} \newcommand{\SignalPropagationDelay}{t_{\text{prop}}} \newcommand{\SignalTrajectory}{s} \newcommand{\SignatureBandCount}{b} \newcommand{\SignificanceCriticalQuantile}{z_{1-\alpha_{\text{sig}}/2}} \newcommand{\SignificanceLevel}{\alpha} \newcommand{\SiliconThermalTimeConstant}{\tau_{\text{th,silicon}}} \newcommand{\SimplexProjection}{\Pi_{\Delta^{K-1}}} \newcommand{\SimulatedPlantDynamics}{f_{\text{sim}}} \newcommand{\SimulatedReturnLevel}{z_{T, \text{sim}}} \newcommand{\SimulatedStateTrajectory}{s_{\text{sim}}} \newcommand{\SimulatedStlRobustness}{\rho_{\text{sim}}} \newcommand{\SimulatedTrajectorySet}{\mathcal{S}_{\text{sim}}} \newcommand{\SimulatedTransportDelay}{T_{d,\text{sim}}} \newcommand{\SimulatedUnbrakedImpactForce}{F_{\text{unbraked,sim}}} \newcommand{\SimulationParameterSet}{\Xi} \newcommand{\SimulationParameterVector}{\boldsymbol{\xi}} \newcommand{\SimulatorStepFunction}{\mathbf{F}} \newcommand{\SingleAgentAcceptanceProbability}{p_{\text{single}}} \newcommand{\SingleDeviceContextLength}{S_{\text{single}}} \newcommand{\SingleDeviceRunTime}{T_1} \newcommand{\SingleJointAccelerationLimit}{\ddot{q}_{i,\max}} \newcommand{\SingleJointInertia}{M} \newcommand{\SingleJointVelocityLimit}{\dot{q}_{i,\max}} \newcommand{\SingleLinkBandwidth}{\text{BW}_{\text{link}}} \newcommand{\SinglePrecisionGemvIntensity}{I_{\text{GEMV, 32-bit}}} \newcommand{\SingleStepImitationError}{\epsilon} \newcommand{\SingularSpectrumMatrix}{\mathbf{\Sigma}} \newcommand{\SisaShardCount}{K} \newcommand{\SisaTrainingShard}{S} \newcommand{\SixthHarmonicTorqueRipple}{\tau_{\text{ripple}}} \newcommand{\SkewDisplacementEnvelope}{d_{\text{skew}}} \newcommand{\SkillSelectionDistribution}{p} \newcommand{\SlaveDriveCount}{S} \newcommand{\SlaveDriveIndex}{s} \newcommand{\SlaveForwardingDelay}{t_{\text{slave},s}} \newcommand{\SlipAccelerationBound}{a_{\text{slip}}} \newcommand{\SlipRegularizationSpeed}{\epsilon_{\text{reg}}} \newcommand{\SloVector}{\mathbf{S}} \newcommand{\SlowdownPersistenceUpdateCount}{K} \newcommand{\SmallChange}{\delta} \newcommand{\SmallPerturbation}{\delta} \newcommand{\SmallestJacobianSingularNumber}{\sigma_{\min}} \newcommand{\SmallestKeySingularNumber}{\sigma_{\min(S, d_{\text{head}})}} \newcommand{\SmoothedClassifier}{g} \newcommand{\SmoothedRunnerUpProbability}{p_{B}} \newcommand{\SmoothedTargetAction}{\tilde{\mathbf{a}}'} \newcommand{\SmoothedTopClassProbability}{p_{A}} \newcommand{\SmoothingNoiseClipBound}{c} \newcommand{\SmoothingNoiseStandardDeviation}{\sigma} \newcommand{\SmoothnessConstant}{L_s} \newcommand{\SnapshotReadTime}{t_{\text{own}}} \newcommand{\SnapshotResetCycleTime}{T_{\text{cycle,snap}}} \newcommand{\SnapshotStepIndex}{s} \newcommand{\SoftExpectedActionReturn}{Q} \newcommand{\SoftExpectedRemainingReturn}{V} \newcommand{\SoftenedStudentProbabilityVector}{\mathbf{p}_{\text{student}}^{(T_{\text{distill}})}} \newcommand{\SoftenedTeacherProbabilityVector}{\mathbf{p}_{\text{teacher}}^{(T_{\text{distill}})}} \newcommand{\SoftmaxFunction}{\sigma} \newcommand{\SoftmaxInputScore}{x} \newcommand{\SoftmaxInputVector}{\mathbf{x}} \newcommand{\SoftmaxNormalizer}{z} \newcommand{\SoftmaxOutputProbability}{p} \newcommand{\SoftmaxRowMaximum}{m} \newcommand{\SoftmaxRowScore}{s} \newcommand{\SoftmaxRunningMaximum}{m} \newcommand{\SoftmaxVectorLength}{n} \newcommand{\SontagStabilizingControl}{\mathbf{u}_{\text{Sontag}}} \newcommand{\SourceCurrent}{I_{\text{source}}} \newcommand{\SourceEventTime}{T_{\text{event}}} \newcommand{\SourceFramePoint}{\mathbf{p}_B} \newcommand{\SourceSinkPathSet}{\Pi} \newcommand{\SourceVoltage}{V_{\text{source}}} \newcommand{\SourceWriteShardGrant}{\Gamma_{c}} \newcommand{\SpareStoppingClearance}{d_{\text{spare}}} \newcommand{\SparseMatrixEntryCount}{n_{\text{elem}}} \newcommand{\SparseMatrixRowCount}{n_{\text{rows}}} \newcommand{\SparseProductInputComponent}{v} \newcommand{\SparseWeightMatrix}{\mathbf{W}_{\text{sparse}}} \newcommand{\SparsityPenaltyWeight}{\lambda_{\text{L1}}} \newcommand{\SparsityRatio}{\rho_{\text{sparse}}} \newcommand{\SpatialClearancePredicate}{P_{\text{clear}}} \newcommand{\SpatialColumnIndex}{j} \newcommand{\SpatialCovarianceEmbedding}{\mathbf{e}_{\Sigma}} \newcommand{\SpatialErrorVector}{\boldsymbol{\epsilon}_{\text{spatial}}} \newcommand{\SpatialHashFunction}{h} \newcommand{\SpatialMemoryMap}{\mathcal{M}} \newcommand{\SpatialPositionCount}{N_{\text{pix}}} \newcommand{\SpatialRowIndex}{i} \newcommand{\SpatialTransformation}{\mathcal{T}} \newcommand{\SpecialEuclideanAlgebra}{\mathfrak{se}(3)} \newcommand{\SpecialEuclideanGroup}{SE(3)} \newcommand{\SpecialOrthogonalGroup}{SO(3)} \newcommand{\SpecializedEnergyProductivity}{\rho_{\text{energy,specific}}} \newcommand{\SpecificHeatCapacity}{c_p} \newcommand{\SpectrallyNormalizedWeightMatrix}{\overline{\mathbf{W}}} \newcommand{\SpeculativeDecodingSpeedup}{S_{\text{spec}}} \newcommand{\SpeculativeDraftLength}{K} \newcommand{\SpeculativeDraftTokenCount}{k} \newcommand{\SpeedAtDetection}{v} \newcommand{\SpeedBound}{v_{\max}} \newcommand{\SpendingWindowDuration}{T_{\text{win}}} \newcommand{\SphereSurfaceArea}{S_{D-1}} \newcommand{\SplineControlPoint}{\mathbf{p}} \newcommand{\SplineDegree}{p} \newcommand{\SplineFinalControlIndex}{L} \newcommand{\SplineKnotTime}{\xi} \newcommand{\SplitAssignmentMap}{s} \newcommand{\SplitMessageCount}{N_{\text{msg}}} \newcommand{\SpotHourlyPrice}{C_{\text{spot}}} \newcommand{\SpringBrakeEngagementTime}{t_{\text{engage}}} \newcommand{\SpringCompressionForce}{F} \newcommand{\SprtExpectedLogIncrement}{m} \newcommand{\SprtLowerBoundary}{\Lambda_{\text{lo}}} \newcommand{\SprtLowerLogBoundary}{b_{\text{low}}} \newcommand{\SprtStoppingSampleCount}{N_{\text{stop}}} \newcommand{\SprtUpperBoundary}{\Lambda_{\text{up}}} \newcommand{\SprtUpperLogBoundary}{u} \newcommand{\SquareGemmDimension}{N} \newcommand{\SquaredGaussianSumQuantile}{\chi} \newcommand{\SquaredPathVelocity}{x} \newcommand{\SquaredRadiusSubstitution}{u} \newcommand{\SquashedActionComponent}{a} \newcommand{\SramCapacity}{M_{\text{SRAM}}} \newcommand{\StabilizationErrorThreshold}{\epsilon_{\text{stable}}} \newcommand{\StabilizationSlewCeiling}{j_{\text{stable}}} \newcommand{\StackedContactForces}{\mathbf{f}_{\text{c}}} \newcommand{\StageConditionalAcceptanceProbability}{q} \newcommand{\StageEpisodeCount}{N_{\text{episodes}}} \newcommand{\StageReachProbability}{r} \newcommand{\StagedDefinitionCount}{n_{\text{def}}} \newcommand{\StagingExhaustionTime}{T_{\text{exhaust}}} \newcommand{\StagingStoreCapacity}{M_{\text{stage}}} \newcommand{\StaleSupportRate}{\epsilon_{\text{stale}}} \newcommand{\StalenessAdjustedLearningRate}{\eta'} \newcommand{\StalenessBound}{s} \newcommand{\StallCounterTorque}{\tau_{\text{stall}}} \newcommand{\StallTravelBound}{d_{\text{F1}}} \newcommand{\StandardDeviationMultiple}{k} \newcommand{\StandardNormalCumulativeDistribution}{\Phi} \newcommand{\StandardNormalQuantile}{z_q} \newcommand{\StandbyInstanceMemory}{M_{\text{standby}}} \newcommand{\StandbyPower}{P_{\text{idle}}} \newcommand{\StandbyReserveCount}{N_{\text{reserve}}} \newcommand{\StandstillSpeedThreshold}{\epsilon_{\text{vel}}} \newcommand{\StateConstraintMatrix}{\mathbf{H}_x} \newcommand{\StateConstraintVector}{\mathbf{b}_x} \newcommand{\StateCotangentSpace}{T_{\mathbf{x}}^*} \newcommand{\StateDimension}{n} \newcommand{\StateDistribution}{d_\pi} \newcommand{\StateEstimate}{\hat{\mathbf{x}}} \newcommand{\StateEstimateDerivative}{\dot{\hat{\mathbf{x}}}} \newcommand{\StateEstimationError}{\mathbf{e}} \newcommand{\StateExposureLevel}{S} \newcommand{\StateNormWeighting}{W} \newcommand{\StateOperation}{f} \newcommand{\StateParameterSensitivity}{\mathbf{S}} \newcommand{\StateRecurrencePeriod}{\ell} \newcommand{\StateScalarFunction}{\phi} \newcommand{\StateSpaceDimension}{d_s} \newcommand{\StateSpaceInputMatrix}{\mathbf{B}} \newcommand{\StateSpaceSystemMatrix}{\mathbf{A}_{\text{sys}}} \newcommand{\StateTokenCount}{K_s} \newcommand{\StateTrackingWeightMatrix}{\mathbf{W}_q} \newcommand{\StateTransitionMatrix}{\mathbf{F}} \newcommand{\StatelessCursorPayload}{d} \newcommand{\StaticBatchingOperations}{O_{\text{traditional}}} \newcommand{\StaticChassisPower}{P_{\text{chassis\_static}}} \newcommand{\StaticDataDistribution}{p_{\text{data}}} \newcommand{\StationaryConditionPolynomial}{P} \newcommand{\StatisticalDivergence}{\mathcal{D}(P_t \| P_0)} \newcommand{\StatisticalFalseNegativeRate}{\beta} \newcommand{\StatisticalHypothesis}{H} \newcommand{\StatisticalPowerQuantile}{z_{1-\beta}} \newcommand{\StatisticalSignificanceLevel}{\alpha_{\text{sig}}} \newcommand{\StatorCoreTemperature}{T_{\text{core}}} \newcommand{\StatorIronTemperature}{T_{\text{iron}}} \newcommand{\StatorThermalCapacitance}{C_{\text{th}}} \newcommand{\StatusPollCount}{N_{\text{poll}}} \newcommand{\SteadyDeceleration}{a} \newcommand{\SteadyStateAvailability}{A} \newcommand{\SteadyStateCurrent}{I_{\text{final}}} \newcommand{\SteadyStateErrorCovariance}{\mathbf{P}_{\text{est}}} \newcommand{\SteadyStateIntegratorState}{\mathbf{z}_{\text{ss}}} \newcommand{\SteadyStateTemperatureRise}{\Delta T_{\max}} \newcommand{\SteadyStateTrackingError}{\mathbf{e}_{\text{ss}}} \newcommand{\SteeringTransferTime}{T} \newcommand{\StepFailureHazard}{a} \newcommand{\StepGenerationCost}{C_{\text{gen}}} \newcommand{\StepGenerationTime}{T_{\text{step}}} \newcommand{\StepIoTime}{T_{\text{IO}}} \newcommand{\StepResponsePhaseLag}{\Delta \phi} \newcommand{\StepSettlingTime}{t_{\text{settle}}} \newcommand{\StepSuccessProbability}{p} \newcommand{\StepTestVoltage}{V_{\text{step}}} \newcommand{\StepTimePenalty}{c_{\text{time}}} \newcommand{\StepTokenLogit}{z_{t,v}} \newcommand{\StereoBaseline}{b} \newcommand{\StereoDisparity}{d} \newcommand{\StlEventuallyDeadline}{\tau} \newcommand{\StlFormula}{\phi} \newcommand{\StlIntervalEnd}{b} \newcommand{\StlIntervalStart}{a} \newcommand{\StlPredicateFunction}{f} \newcommand{\StlRobustness}{\rho} \newcommand{\StlUntilOperator}{\mathcal{U}_{[a, b]}} \newcommand{\StockoutNormalQuantile}{z_{1-\epsilon}} \newcommand{\StockoutProbabilityTarget}{\epsilon} \newcommand{\StopAxisAcceleration}{\ddot{q}_{\text{stop}}} \newcommand{\StopAxisPosition}{q_{\text{stop}}} \newcommand{\StopCompletionInstant}{t_{\text{stop\_end}}} \newcommand{\StopDecisionComputeBound}{T_{\text{compute}}} \newcommand{\StopProgress}{u} \newcommand{\StopSequenceSet}{\mathcal{S}_{\text{stop}}} \newcommand{\StoppingBoundaryClearance}{z} \newcommand{\StoppingCrossoverSpeed}{v^{*}} \newcommand{\StoppingDeadline}{t_{\text{deadline,stop}}} \newcommand{\StoppingDistance}{d_{\text{stop}}} \newcommand{\StoppingDistanceBudget}{d_{\text{budget}}} \newcommand{\StoppingDuration}{T_{\text{stop}}} \newcommand{\StorageAccessFactor}{F_{\text{access}}} \newcommand{\StorageBandwidth}{\text{BW}_{\text{storage}}} \newcommand{\StorageCapacityPrice}{C_{\text{storage/byte-time}}} \newcommand{\StorageEquipmentPower}{P_{\text{storage}}} \newcommand{\StorageFunction}{V} \newcommand{\StorageFunctionDerivative}{\dot{V}} \newcommand{\StorageIngestBandwidth}{\text{BW}_{\text{ingest}}} \newcommand{\StoragePrice}{c_{\text{storage}}} \newcommand{\StorageReadTime}{T_{\text{read}}} \newcommand{\StorageRetentionTime}{T_{\text{months}}} \newcommand{\StorageThroughput}{R_{\text{storage}}} \newcommand{\StoredDataVolume}{D_{\text{vol,store}}} \newcommand{\StoredEmbedding}{\mathbf{z}} \newcommand{\StoredIndexVector}{\mathbf{x}} \newcommand{\StoredSystemState}{s} \newcommand{\StoredTokenVolume}{V} \newcommand{\StragglerStepTime}{T_{\text{step,straggler}}} \newcommand{\StreamAcceptanceProbability}{p} \newcommand{\StreamingEndToEndLatency}{T_{\text{streaming}}} \newcommand{\StrideCheckpointCount}{N} \newcommand{\StrongConfigurationAttemptCost}{c_{\text{big}}} \newcommand{\StrongConfigurationPassProbability}{p_{\text{big}}} \newcommand{\StruckObjectMass}{m_{\text{obj}}} \newcommand{\StructuredSparsityGroupSize}{m_{\text{group}}} \newcommand{\StructuredSparsityNonzeroCount}{n_{\text{keep}}} \newcommand{\StudentProbabilityVector}{\mathbf{p}_{\text{student}}} \newcommand{\StuffBitTime}{t_{\text{stuff},i}} \newcommand{\SubgroupIndex}{g} \newcommand{\SubgroupSampleSize}{n} \newcommand{\SubintervalFailureProbability}{p} \newcommand{\SublevelSetThreshold}{c} \newcommand{\SubsequentArrivalTime}{\tau} \newcommand{\SubsetAllPassIndicator}{I_J^{\text{all}}} \newcommand{\SubsetAnyPassIndicator}{I_J} \newcommand{\SubsetDatasetSize}{D_{\text{subset}}} \newcommand{\SuccessCountIndex}{j} \newcommand{\SuccessLowerConfidenceLimit}{p_{\text{lower}}} \newcommand{\SuccessfulTrialCount}{k} \newcommand{\SuccessorActionVector}{\mathbf{a}'} \newcommand{\SuccessorPlanningState}{s'} \newcommand{\SuffixFoldTime}{T_{\text{fold}}} \newcommand{\SummaryOutputLength}{K_{\text{sum}}} \newcommand{\SummaryTokenEmbedding}{\mathbf{x}_{\text{class}}} \newcommand{\SupervisoryMtbi}{T_{\text{MTBI}}} \newcommand{\SupervisoryTakeoverLatency}{T_{\Sigma}} \newcommand{\SupplyVoltage}{V} \newcommand{\SupportPolygon}{\mathcal{P}_{\text{support}}} \newcommand{\SupportSetSize}{n_{\text{shot}}} \newcommand{\SustainableAttemptRate}{R_{\text{attempt}}} \newcommand{\SustainableCopperLossPower}{P_{\text{loss,ss}}} \newcommand{\SustainableHoldingTorque}{\tau_{\text{hold,max}}} \newcommand{\SustainedComputeRate}{R_{\text{sustained}}} \newcommand{\SustainedDropoutFrameCount}{N_{\text{drop}}} \newcommand{\SustainedMemoryBandwidth}{\text{BW}_{\text{mem}}} \newcommand{\SweepCandidateCostFraction}{f} \newcommand{\SweepCandidateCount}{k} \newcommand{\SwitchBreakdownVoltage}{V_{\text{breakdown}}} \newcommand{\SwitchInputCapacitance}{C_{\text{iss}}} \newcommand{\SwitchOnResistance}{R_{\text{ds(on)}}} \newcommand{\SwitchRadix}{k} \newcommand{\SwitchedCapacitance}{C} \newcommand{\SwitchingActivityFactor}{\alpha} \newcommand{\SwitchingEnergy}{E} \newcommand{\SwitchingTransitionTime}{t_{\text{sw}}} \newcommand{\SymbolicPlanningState}{s} \newcommand{\SymmetricClippingThreshold}{\alpha_{\text{sym}}} \newcommand{\SymmetricMessageOverhead}{o} \newcommand{\SymplecticEulerTransitionMatrix}{\mathbf{A}_{\text{symp}}} \newcommand{\SyncMessageInterval}{\Delta t_{\text{interval}}} \newcommand{\SyncPairingDisplacement}{\Delta \mathbf{x}_{\text{sync}}} \newcommand{\SynchronizationBlackout}{T_{\text{blackout}}} \newcommand{\SynchronizationClearanceMargin}{d_{\text{sync}}} \newcommand{\SynchronizationErrorBound}{\epsilon_{\text{sync}}} \newcommand{\SynchronizationStepIndex}{k} \newcommand{\SynchronizationTime}{T_{\text{sync}}} \newcommand{\SyntheticDataGenerator}{G_{\theta}} \newcommand{\SyntheticDataset}{\mathcal{S}_{\text{synthetic}}} \newcommand{\SystemCallFilterTime}{T_{\text{filter}}} \newcommand{\SystemCallOverheadTime}{T_{\text{syscall}}} \newcommand{\SystemFailureRate}{\lambda_{\text{system}}} \newcommand{\SystemHazardRate}{\lambda_{\text{system}, h}} \newcommand{\SystemInstructionTokenCount}{S_{\text{system}}} \newcommand{\SystemMatrixPowerIndex}{k} \newcommand{\SystemMemoryBandwidth}{\text{BW}_{\text{system}}} \newcommand{\SystemMtbf}{\text{MTBF}_{\text{system}}} \newcommand{\SystemReliability}{R_{\text{system}}} \newcommand{\TableRowCount}{N} \newcommand{\TailByteAllocation}{M_{\text{tail}}} \newcommand{\TailMomentOrder}{k} \newcommand{\TailPerformanceMetric}{X} \newcommand{\TailRequestLatency}{T_{\text{lat},\text{p99}}} \newcommand{\TailRequestSeenBatchSize}{B_{\text{req,p99}}} \newcommand{\TailRiskDistributionFunction}{F} \newcommand{\TailRiskObservation}{X} \newcommand{\TailRiskObservationLevel}{x} \newcommand{\TailShapeParameter}{\xi} \newcommand{\TailStepIoTime}{T_{\text{IO,p99}}} \newcommand{\TailSupportUpperEndpoint}{x_F} \newcommand{\TakeoverInstant}{t_{\text{takeover}}} \newcommand{\TakeoverResponseTime}{T_{\Sigma, 1}} \newcommand{\TakeoverStateVisitationDistribution}{p^{\text{takeover}}} \newcommand{\TakeoverTrackingError}{\mathbf{e}_{\text{track}}} \newcommand{\TangentDirection}{\mathbf{v}} \newcommand{\TangentSeedVector}{\dot{\mathbf{x}}} \newcommand{\TangentialContactShear}{\mathbf{f}_{k, \parallel}} \newcommand{\TangentialSpeed}{v_{\text{tangential}}} \newcommand{\TapeIntermediateResult}{y_{\text{tape}}} \newcommand{\TargetAcceptanceDifference}{\Delta} \newcommand{\TargetActionReturnEstimate}{\hat{Q}} \newcommand{\TargetActorParameters}{\theta'} \newcommand{\TargetBatchSize}{B_{\text{target}}} \newcommand{\TargetCompletionQuantile}{q} \newcommand{\TargetComputeRate}{R_{\text{ops}}} \newcommand{\TargetComputeTimeFraction}{\eta_{\text{target}}} \newcommand{\TargetCriticParameters}{\phi'} \newcommand{\TargetCriticReturnEstimate}{Q_{\phi'}} \newcommand{\TargetDeterministicPolicy}{\mu_{\theta'}} \newcommand{\TargetError}{\epsilon} \newcommand{\TargetExceedanceProbability}{\epsilon} \newcommand{\TargetFairShare}{F_{\text{target}}} \newcommand{\TargetFramePoint}{\mathbf{p}_A} \newcommand{\TargetHazardRate}{\lambda_{\text{target}}} \newcommand{\TargetImpedanceDampingMatrix}{\mathbf{D}_d} \newcommand{\TargetImpedanceInertiaMatrix}{\mathbf{M}_d} \newcommand{\TargetImpedanceStiffnessMatrix}{\mathbf{K}_d} \newcommand{\TargetInferenceLatency}{L_{\text{lat,target}}} \newcommand{\TargetKeyAttentionWeight}{\alpha_{\text{target}}} \newcommand{\TargetKeyLogit}{z_{\text{target}}} \newcommand{\TargetModelDistribution}{p_{\theta}} \newcommand{\TargetOrientation}{\mathbf{R}_{\text{target}}} \newcommand{\TargetPlantState}{\mathbf{x}_{f}} \newcommand{\TargetPolicyEntropy}{\overline{\mathcal{H}}} \newcommand{\TargetPose}{\mathbf{T}_{\text{target}}} \newcommand{\TargetPosition}{\mathbf{p}_{\text{target}}} \newcommand{\TargetPositionComponent}{p_{\text{target},i}} \newcommand{\TargetRange}{z} \newcommand{\TargetRepeatedRunConsistency}{p_{\text{target}}} \newcommand{\TargetSamplingDistribution}{p} \newcommand{\TargetServingUtilization}{\rho_{\text{target}}} \newcommand{\TargetSmoothingNoise}{\boldsymbol{\epsilon}} \newcommand{\TargetSmoothingNoiseStandardDeviation}{\sigma} \newcommand{\TargetTokenVolume}{W} \newcommand{\TargetTravelDistance}{d} \newcommand{\TargetTrialFailureProbability}{p_{*}} \newcommand{\TargetTrialSuccessProbability}{p_{\text{target}}} \newcommand{\TargetTwinCriticReturnEstimate}{Q_{\phi'_i}} \newcommand{\TargetUnitQuaternion}{\mathbf{q}_{\text{quat,target}}} \newcommand{\TargetUpdateCount}{K_{\text{target}}} \newcommand{\TargetUtilizationBatchSize}{B_{\text{util}}} \newcommand{\TargetXPosition}{x} \newcommand{\TargetYPosition}{p_y} \newcommand{\TargetZPosition}{z} \newcommand{\TaskAcceptanceLabel}{x} \newcommand{\TaskBlockingTime}{B} \newcommand{\TaskContract}{\mathcal{C}} \newcommand{\TaskContractGoal}{G} \newcommand{\TaskCost}{C_{\text{task}}} \newcommand{\TaskCount}{K} \newcommand{\TaskCoverageProbability}{Q} \newcommand{\TaskCriticalSections}{cs} \newcommand{\TaskDerivativeGain}{\mathbf{K}_{d,i}} \newcommand{\TaskDistance}{d_{\text{task}}} \newcommand{\TaskEnvironment}{\mathcal{E}_{\text{env}}} \newcommand{\TaskErrorTolerance}{\tau_{\text{tol}}} \newcommand{\TaskGroupMap}{g} \newcommand{\TaskIndex}{i} \newcommand{\TaskInterferenceTime}{I} \newcommand{\TaskJacobian}{\mathbf{J}} \newcommand{\TaskJacobianDerivative}{\dot{\mathbf{J}}} \newcommand{\TaskJacobianPseudoinverse}{\mathbf{J}^\dagger} \newcommand{\TaskKinematicMap}{f} \newcommand{\TaskLoss}{\mathcal{L}_{\text{task}}} \newcommand{\TaskLossGradient}{\nabla \mathcal{L}} \newcommand{\TaskPeriod}{T} \newcommand{\TaskProportionalGain}{\mathbf{K}_{p,i}} \newcommand{\TaskReadCount}{n_{\text{read}}} \newcommand{\TaskRelativeDeadline}{D} \newcommand{\TaskRelevantOutcome}{\mathbf{Y}_{\text{task}}} \newcommand{\TaskReward}{r_{\text{task}}} \newcommand{\TaskSetUtilization}{U} \newcommand{\TaskSpaceAcceleration}{\ddot{\mathbf{x}}} \newcommand{\TaskSpaceCoordinates}{\mathbf{x}} \newcommand{\TaskSpaceDimension}{m} \newcommand{\TaskSpaceReference}{\mathbf{x}_i^{\text{ref}}} \newcommand{\TaskSpaceReferenceAcceleration}{\ddot{\mathbf{x}}^{\text{ref}}} \newcommand{\TaskSpaceReferenceVelocity}{\dot{\mathbf{x}}^{\text{ref}}} \newcommand{\TaskSpaceVelocity}{\dot{\mathbf{x}}} \newcommand{\TaskSpecificLoss}{\mathcal{L}} \newcommand{\TaskStateTokenCount}{S_{\text{state}}} \newcommand{\TaskToleranceSemiAxes}{\mathbf{r}} \newcommand{\TaskToleranceSemiAxis}{r} \newcommand{\TaskTurnCost}{C_{\text{call}}} \newcommand{\TaskWeight}{w} \newcommand{\TasksPerComparisonArm}{N_{\text{arm}}} \newcommand{\TeacherProbabilityVector}{\mathbf{p}_{\text{teacher}}} \newcommand{\TeamQuotaCap}{Q_{\text{team}}} \newcommand{\TelemetryFlushTime}{t_{\text{telemetry\_flush}}} \newcommand{\TelemetryFreshnessBound}{\Delta t_{\text{fresh}}} \newcommand{\TelemetryRetentionDuration}{T_{\text{retention}}} \newcommand{\TelemetrySamplingFrequency}{f_{\text{sample}}} \newcommand{\TelemetrySeriesCount}{N_{\text{series}}} \newcommand{\TelemetryTickInterval}{\Delta t_s} \newcommand{\TeleoperationCommandLatency}{t_{\text{cmd}}} \newcommand{\TeleoperationDownlinkTime}{T_{\text{downlink}}} \newcommand{\TeleoperationRoundTripLatency}{t_{\text{loop}}} \newcommand{\TeleoperationRoundTripTime}{T_{\text{RTT}}} \newcommand{\TeleoperationStateVisitationDistribution}{p^{\pi_{\text{teleop}}}} \newcommand{\TeleoperationUplinkTime}{T_{\text{uplink}}} \newcommand{\TeleoperationVideoLatency}{T_{\text{video}}} \newcommand{\TemperatureDualObjective}{\mathcal{L}} \newcommand{\TemperatureStepSize}{\lambda_{\alpha}} \newcommand{\TemplateSharedMemory}{M_{\text{template}}} \newcommand{\TemporalDifferenceResidual}{\delta} \newcommand{\TemporalEnsemblingWeight}{w_i} \newcommand{\TenantIndex}{i} \newcommand{\TenantResourceAllocation}{a_{i,r}} \newcommand{\TensorAxisCount}{n} \newcommand{\TensorColumnModeSize}{J} \newcommand{\TensorCoreAccumulatorMatrix}{\mathbf{C}_{\text{acc}}} \newcommand{\TensorCoreLeftInput}{\mathbf{A}_{\text{tc}}} \newcommand{\TensorCoreOutputMatrix}{\mathbf{D}_{\text{tc}}} \newcommand{\TensorCoreRightInput}{\mathbf{B}_{\text{tc}}} \newcommand{\TensorDepthModeSize}{T} \newcommand{\TensorElementCount}{N} \newcommand{\TensorModeIndex}{n_{\text{mode}}} \newcommand{\TensorParallelDegree}{N_{\text{TP}}} \newcommand{\TensorParallelLayerTime}{T_{\text{inference}}} \newcommand{\TensorRowModeSize}{I} \newcommand{\TerminalFeedbackGain}{\mathbf{K}_f} \newcommand{\TerminalInvariantSet}{\mathcal{X}_{f}} \newcommand{\TerminalPlantState}{\mathbf{x}_N} \newcommand{\TerminalTransitTime}{t_{\text{transit}}} \newcommand{\TerminalVoltageLimit}{V_{\max}} \newcommand{\TerminationProtocol}{\kappa} \newcommand{\TestExample}{z_{\text{test}}} \newcommand{\TestFamilySize}{k} \newcommand{\TestPhaseCapabilityGrant}{\Gamma_{\text{test}}} \newcommand{\TestsDirectoryShardGrant}{\Gamma_{a}} \newcommand{\TextTokenCount}{S_{\text{text}}} \newcommand{\TextTokenEmbeddings}{\mathbf{z}_{\text{text}}} \newcommand{\ThermalExpansionCoefficient}{\alpha} \newcommand{\ThermalPenaltyWeight}{\lambda_T} \newcommand{\ThermalPowerLimit}{P_{\text{thermal}}} \newcommand{\ThermalResistance}{R_{\text{th}}} \newcommand{\ThermalTimeConstant}{\tau_{\text{th}}} \newcommand{\ThirdAtomicGradientUpdate}{C} \newcommand{\ThirdFloatingPointAddend}{c} \newcommand{\ThirdRingTraceElement}{c} \newcommand{\ThresholdExceedanceCount}{N_u} \newcommand{\ThresholdExceedanceRate}{\zeta_u} \newcommand{\ThresholdExcess}{y} \newcommand{\ThresholdExcessVariable}{Y} \newcommand{\ThresholdedSparsityRatio}{\rho_{\text{sparse},\delta}} \newcommand{\ThrottleClearTemperature}{T_{\text{clear}}} \newcommand{\ThrottleOnsetJunctionTemperature}{T_{\text{j},\text{start}}} \newcommand{\ThrottleRecoveryTime}{t_{\text{recov}}} \newcommand{\ThrottleTripTemperature}{T_{\text{trip}}} \newcommand{\ThrottledClockFrequency}{f_{\text{throt}}} \newcommand{\TickCycleCount}{N} \newcommand{\TickIndex}{n} \newcommand{\TickPeriodJitterBound}{J_{\text{phase}}} \newcommand{\TieredRequestServiceTime}{T} \newcommand{\TightenedDiscreteSafeSet}{\mathcal{C}_{\text{discrete}}} \newcommand{\TileRowIndex}{m} \newcommand{\TiltAngle}{\theta_{\text{tilt}}} \newcommand{\Time}{T} \newcommand{\TimeBudgetUsedFraction}{\rho_T} \newcommand{\TimeInstant}{t} \newcommand{\TimeScaleSeparationRatio}{\epsilon} \newcommand{\TimeStepIndex}{t} \newcommand{\TimeToResult}{T_{\text{result}}} \newcommand{\TimeToTarget}{T_{\text{target}}} \newcommand{\TimeoutSafetyMultiplier}{k} \newcommand{\TimeoutTrialCount}{n_{\text{timeout}}} \newcommand{\TimerClockPeriod}{T_{\text{timer\_clk}}} \newcommand{\TimestampJitterDelay}{\delta_{\text{jitter}}} \newcommand{\TimestampQuantizationBound}{T_{\text{quant}}} \newcommand{\TimestampSkew}{t_{\text{skew}}} \newcommand{\TimingJitter}{\sigma_{\text{jitter}}} \newcommand{\TimingRealityGap}{\Delta_{\text{lat}}} \newcommand{\TokenAuthenticationCode}{\sigma} \newcommand{\TokenAveragedBatchLoss}{\mathcal{L}_{\text{token}}} \newcommand{\TokenBucketDepth}{b} \newcommand{\TokenBucketRefillRate}{r} \newcommand{\TokenBudgetUsedFraction}{\rho_N} \newcommand{\TokenByteDecoding}{s} \newcommand{\TokenCaveat}{c} \newcommand{\TokenDispatchTime}{T_{\text{dispatch}}} \newcommand{\TokenIdentifierSize}{s_{\text{id}}} \newcommand{\TokenIndex}{t} \newcommand{\TokenPrefix}{x_{<t}} \newcommand{\TokenVocabulary}{\mathcal{V}} \newcommand{\TokenizationTime}{T_{\text{tokenize}}} \newcommand{\ToleranceEllipsoidMatrix}{\mathbf{E}} \newcommand{\ToleratedFailureProbability}{\epsilon} \newcommand{\ToleratedPositionError}{\epsilon_{\text{pos}}} \newcommand{\TombstonedNodeSet}{V_{\text{tomb}}} \newcommand{\TombstonedRecordFraction}{\rho_{\text{dead}}} \newcommand{\ToolArgumentKey}{p} \newcommand{\ToolCallCategory}{y} \newcommand{\ToolCallCost}{c_{\text{tool}}} \newcommand{\ToolCallIndex}{i} \newcommand{\ToolCallReadSet}{R} \newcommand{\ToolCallWriteSet}{W} \newcommand{\ToolCartesianPose}{\mathbf{x}} \newcommand{\ToolCartesianVelocity}{\dot{\mathbf{x}}} \newcommand{\ToolCenterPointAxis}{\hat{\mathbf{z}}_{\text{TCP}}} \newcommand{\ToolCenterPointFrame}{\mathcal{F}_{\text{TCP}}} \newcommand{\ToolCenterPointPose}{\mathbf{T}_{\text{TCP}}} \newcommand{\ToolCenterPointPosition}{\mathbf{p}_{\text{TCP}}} \newcommand{\ToolClearanceDistance}{d_{\text{tool}}} \newcommand{\ToolDeclarationTokenCount}{S_{\text{tools}}} \newcommand{\ToolDescriptorSize}{S_{\text{desc}}} \newcommand{\ToolPlanarAbscissa}{x} \newcommand{\ToolPlanarOrdinate}{y} \newcommand{\ToolPositionError}{e_{\text{tool}}} \newcommand{\ToolServiceCount}{N_{\text{tool}}} \newcommand{\ToolSpeedLimit}{v_{\text{TCP}}} \newcommand{\ToolTargetState}{s} \newcommand{\ToolTime}{T_{\text{tool}}} \newcommand{\ToolTipPose}{\mathbf{T}_{\text{tool}}} \newcommand{\TopClassCount}{k} \newcommand{\TopMagnitudeIndicator}{\mathbf{1}_{|\mathbf{g}| \geq |\mathbf{g}|_{(K_{\text{top}})}}} \newcommand{\TopTokenSampleCount}{k} \newcommand{\TopologicalPlaceNode}{p^{\text{place}}} \newcommand{\TopologyEndpointCount}{N} \newcommand{\TorqueCutoffCommand}{\mathbf{u}_{\text{cutoff}}} \newcommand{\TorqueEffortPenaltyWeight}{\lambda_{\tau}} \newcommand{\TorqueProducingCurrent}{i_q} \newcommand{\TorqueRateLimit}{\dot{\tau}_{\max}} \newcommand{\TorqueRegularizationWeight}{w_\tau} \newcommand{\TorqueSlewPenaltyWeight}{\lambda_{\dot{\tau}}} \newcommand{\TorusFirstAxisChipCount}{X} \newcommand{\TorusSecondAxisChipCount}{Y} \newcommand{\TorusThirdAxisChipCount}{Z} \newcommand{\TotalChipPower}{P_{\text{total}}} \newcommand{\TotalCollisionQueryTime}{T_{\text{query\_total}}} \newcommand{\TotalDataCost}{C_{\text{total}}} \newcommand{\TotalDelayPhaseShift}{\phi_{\text{total}}} \newcommand{\TotalEnergy}{E_{\text{total}}} \newcommand{\TotalExecutedTrialCount}{N_{\text{total}}} \newcommand{\TotalFailureRecoveryTime}{T_{\text{recovery}}} \newcommand{\TotalGateCharge}{Q_g} \newcommand{\TotalInterventionCount}{N_{\text{int}}} \newcommand{\TotalKineticEnergy}{E_{k,\text{total}}} \newcommand{\TotalMemoryFootprint}{M_{\text{total}}} \newcommand{\TotalPipelineLatency}{L_{\text{lat,total}}} \newcommand{\TotalTrainingRunCost}{C_{\text{total}}} \newcommand{\TraceCrashCount}{N_{\text{crash}}} \newcommand{\TraceCrashIndex}{i} \newcommand{\TraceDecay}{\lambda} \newcommand{\TraceIntermediateAdjoint}{\bar{v}} \newcommand{\TraceIntermediateTangent}{\dot{v}} \newcommand{\TraceIntermediateVariable}{v} \newcommand{\TrackIndex}{i} \newcommand{\TrackLastUpdateTime}{t_{\text{last}}} \newcommand{\TrackLossTimeout}{T_{\text{lost}}} \newcommand{\TrackPositionDeviation}{\sigma_{\text{track}}} \newcommand{\TrackPredictedErrorCovariance}{\mathbf{P}_{t|t-1}} \newcommand{\TrackPredictedStateEstimate}{\hat{\mathbf{x}}_{t|t-1}} \newcommand{\TrackedEvidenceHorizon}{\tau_{\text{ev,tracked}}} \newcommand{\TrackerFrameIndex}{t} \newcommand{\TrackingErrorAcceleration}{\ddot{\mathbf{e}}} \newcommand{\TrackingErrorAllowance}{\epsilon_{\text{pos}}} \newcommand{\TrackingErrorBound}{\epsilon_{\text{track}}} \newcommand{\TrackingErrorDistance}{e} \newcommand{\TrackingErrorRate}{\dot{\mathbf{e}}} \newcommand{\TrackingErrorVector}{\mathbf{e}} \newcommand{\TrackingRelaxationSlack}{\delta} \newcommand{\TrackingSlackPenaltyWeight}{p} \newcommand{\TrackingStartInstant}{t_{\text{start}}} \newcommand{\TractionLimitedDeceleration}{a} \newcommand{\TractiveForce}{F_x} \newcommand{\TrainableStateMemory}{M_{\text{train}}} \newcommand{\TrainerUpdateTime}{T_{\text{train}}} \newcommand{\TrainingCompute}{O_{\text{train}}} \newcommand{\TrainingCost}{C_{\text{train}}} \newcommand{\TrainingDataset}{D} \newcommand{\TrainingDistribution}{P_0} \newcommand{\TrainingEmpiricalCdf}{F_{P_0}} \newcommand{\TrainingExample}{z} \newcommand{\TrainingFailureCount}{N_{\text{failures}}} \newcommand{\TrainingFeatureMean}{\mu} \newcommand{\TrainingFeatureStandardDeviation}{\sigma} \newcommand{\TrainingLabelMask}{\mathcal{M}_{\text{train}}} \newcommand{\TrainingLoss}{\mathcal{L}_{\text{train}}} \newcommand{\TrainingPathPredictor}{f_{\text{train}}} \newcommand{\TrainingPipelineFunction}{f} \newcommand{\TrainingRunCount}{N_{\text{runs}}} \newcommand{\TrainingSampleThroughput}{R_{\text{train}}} \newcommand{\TrainingSchemaKeySet}{\mathcal{K}_{\text{train}}} \newcommand{\TrainingServingSkew}{S_{\text{skew}}} \newcommand{\TrainingSplitFraction}{f_{\text{train}}} \newcommand{\TrainingStepCount}{K} \newcommand{\TrainingStepEnergy}{E_{\text{step}}} \newcommand{\TrainingStepOperations}{O_{\text{step}}} \newcommand{\TrainingStepTime}{T_{\text{step}}} \newcommand{\TrainingThroughput}{R_{\text{training}}} \newcommand{\TrainingTime}{T_{\text{train}}} \newcommand{\TrainingTransformFunction}{f_{\text{train}}} \newcommand{\Trajectory}{\tau} \newcommand{\TrajectoryAction}{a} \newcommand{\TrajectoryAdmissionRate}{\lambda_{\text{traj}}} \newcommand{\TrajectoryBudget}{\mathbf{B}} \newcommand{\TrajectoryCallCount}{N_{\text{call}}} \newcommand{\TrajectoryCategoryIndex}{j} \newcommand{\TrajectoryCheckpointCount}{N_{\text{ckpt}}} \newcommand{\TrajectoryDivergenceResidual}{e_{\text{div}}} \newcommand{\TrajectoryDuration}{T_{\text{traj}}} \newcommand{\TrajectoryGoodput}{\mathcal{G}} \newcommand{\TrajectoryObservation}{o} \newcommand{\TrajectoryOptimizationObjective}{\mathcal{U}} \newcommand{\TrajectoryRecordDuration}{T_{\text{record}}} \newcommand{\TrajectoryRecordFrame}{\mathcal{F}} \newcommand{\TrajectoryReturn}{R} \newcommand{\TrajectoryReward}{R} \newcommand{\TrajectorySampleCount}{N} \newcommand{\TrajectoryState}{s} \newcommand{\TrajectoryStateSpace}{\mathcal{S}} \newcommand{\TrajectoryTimeLimit}{T_{\max}} \newcommand{\TrajectoryTokenCost}{C_{\text{session}}} \newcommand{\TrajectoryTokenLimit}{N_{\max}} \newcommand{\TrajectoryTurnLimit}{H_{\max}} \newcommand{\TransceiverDelay}{t_{\text{transceiver}}} \newcommand{\TransductionInstant}{t_{\text{transduction}}} \newcommand{\TransferBufferCount}{N_{\text{transfer}}} \newcommand{\TransferDiscrepancyBound}{\epsilon_{\text{gap}}} \newcommand{\TransferTimeForPayload}{T_{\text{transfer}}} \newcommand{\TransferredDataVolume}{D_{\text{vol,transfer}}} \newcommand{\TransformGraph}{\mathcal{G}} \newcommand{\TransformGraphEdgeSet}{\mathcal{E}} \newcommand{\TransformGraphFrame}{\mathcal{F}} \newcommand{\TransformGraphVertexSet}{\mathcal{V}} \newcommand{\TransformRotationBlock}{\mathbf{R}_{AB}} \newcommand{\TransformTranslationBlock}{\mathbf{t}_{AB}} \newcommand{\TransformationInputCount}{k} \newcommand{\TransformedCartesianPosition}{\mathbf{p}'} \newcommand{\TransformedHomogeneousPointCoordinates}{\tilde{\mathbf{p}}'} \newcommand{\TransistorThresholdVoltage}{V_{\text{th}}} \newcommand{\TransitionStorageSize}{b_{\text{tr}}} \newcommand{\TranslationComponent}{v} \newcommand{\TranslationVector}{\mathbf{v}} \newcommand{\TranslationalDriftError}{e_{\text{trans}}} \newcommand{\TranslationalJerk}{j} \newcommand{\TranslationalKineticEnergy}{E_{k,\text{trans}}} \newcommand{\TransmissionEnergyPerByte}{E_{\text{tx}}} \newcommand{\TransmissionInputInertia}{J_{\text{in}}} \newcommand{\TransmissionTorsionalStiffness}{K_{\text{joint}}} \newcommand{\TransverseStandardDeviation}{\sigma_\perp} \newcommand{\TravelPosition}{x} \newcommand{\TraverseDistance}{d} \newcommand{\TreatedNeighborFraction}{e} \newcommand{\TreatmentAssignment}{w} \newcommand{\TreatmentConversionRate}{\hat{p}_B} \newcommand{\TreatmentSampleSize}{m_B} \newcommand{\TreeAllReduceCompletionTime}{T_{\text{tree}}} \newcommand{\TreeLikeAllReduceTime}{T_{\text{tree-like}}} \newcommand{\TreeSearchExplorationWeight}{c_{\text{explore}}} \newcommand{\TreeSearchLeafScore}{V} \newcommand{\TreeSearchMeanReturn}{Q} \newcommand{\TreeSearchPriorDistribution}{p_{\text{prior}}} \newcommand{\TreeSearchVisitCount}{N_{\text{visit}}} \newcommand{\TrialCampaignWallTime}{T_{\text{wall}}} \newcommand{\TrialCompletionIndicator}{Y} \newcommand{\TrialCondition}{c} \newcommand{\TrialControlStepCount}{N_{\text{steps}, i}} \newcommand{\TrialCount}{N} \newcommand{\TrialFailureIndicator}{x} \newcommand{\TrialFailureProbability}{p_{\text{fail}}} \newcommand{\TrialIndex}{n} \newcommand{\TrialInterventionCount}{n_{\text{int}}} \newcommand{\TrialLoadReversalCount}{n_{\text{rev}}} \newcommand{\TrialPassProbability}{p_{\text{trial}}} \newcommand{\TrialPathDistance}{d} \newcommand{\TrialResetLatency}{T_{\text{reset}}} \newcommand{\TrialResetTime}{t_{\text{reset}}} \newcommand{\TrialRolloutTime}{t_{\text{rollout}}} \newcommand{\TrialRunTime}{t_{\text{run}}} \newcommand{\TrialSuccessProbability}{p} \newcommand{\TriggeredWindowArrivalCount}{Q_{\text{arr}}} \newcommand{\TrueClearance}{C_{\text{true}}} \newcommand{\TrueLabelComponent}{y} \newcommand{\TrueOutcome}{Y} \newcommand{\TrueOutcomeLevel}{v} \newcommand{\TrueReferentScore}{c_{y_j}} \newcommand{\TruncatedDistanceSample}{d_{\mu}} \newcommand{\TruncatedKeyApproximation}{\hat{\mathbf{K}}_r} \newcommand{\TruncatedKeyLeftSingularMatrix}{\mathbf{U}_r} \newcommand{\TruncatedKeyRightSingularMatrix}{\mathbf{V}_r} \newcommand{\TruncatedKeySpectrumMatrix}{\mathbf{\Sigma}_r} \newcommand{\TruncationBandVolume}{V_{\text{band}}} \newcommand{\TruncationRank}{r} \newcommand{\TruthInstrumentSet}{\mathcal{I}_{\text{truth}}} \newcommand{\TsdfAccumulatedDistance}{D} \newcommand{\TsdfAccumulatedWeight}{W} \newcommand{\TsdfObservationWeight}{w} \newcommand{\TsdfTruncationBand}{\mu_{\text{tsdf}}} \newcommand{\TsdfWeightCap}{W_{\max}} \newcommand{\TuckerCoreTensor}{\mathcal{G}} \newcommand{\TurnAppendLength}{\Delta S_{\text{turn}}} \newcommand{\TurnBoundaryDelay}{t_{\text{boundary}}} \newcommand{\TurnBudgetUsedFraction}{\rho_H} \newcommand{\TurnContext}{c} \newcommand{\TurnContributionDeviationBound}{\sigma} \newcommand{\TurnCovarianceBoundScale}{C} \newcommand{\TurnCovarianceDecayRatio}{\alpha_{\text{corr}}} \newcommand{\TurnFailureRate}{\lambda_{\text{fail}}} \newcommand{\TurnGeneratedTokenCount}{n_{\text{gen}}} \newcommand{\TurnHorizon}{H} \newcommand{\TurnIndex}{t} \newcommand{\TurnInputTokenCost}{C_{\text{in}}} \newcommand{\TurnOffGateCurrent}{I_{g,\text{off}}} \newcommand{\TurnOffGateResistance}{R_{g,\text{off}}} \newcommand{\TurnOnGateResistance}{R_{g,\text{on}}} \newcommand{\TurnOutputTokenCost}{C_{\text{out}}} \newcommand{\TurnPayloadProbability}{q_{\text{turn}}} \newcommand{\TurnReadCount}{r} \newcommand{\TurnReconstructionTime}{T_{\text{recon}}} \newcommand{\TurnReexecutionTime}{T_{\text{exec}}} \newcommand{\TurnReward}{r} \newcommand{\TurnSandboxCost}{C_{\text{sandbox}}} \newcommand{\TurnStateGrowth}{s_{\text{turn}}} \newcommand{\TurnToolFeeCost}{C_{\text{tools}}} \newcommand{\TustinEigenvalue}{\lambda_{\text{Tustin}}} \newcommand{\TustinTransitionMatrix}{\mathbf{A}_{\text{Tustin}}} \newcommand{\TwinCriticReturnEstimate}{Q_{\phi_i}} \newcommand{\TwistCoordinates}{\boldsymbol{\xi}} \newcommand{\TwistCovarianceMatrix}{\boldsymbol{\Sigma}_{\boldsymbol{\xi}}} \newcommand{\TwistMatrix}{\hat{\boldsymbol{\xi}}} \newcommand{\TwistRotationAngle}{\theta_{\text{rot}}} \newcommand{\TwistRotationCoordinates}{\boldsymbol{\omega}} \newcommand{\TwistTranslationMatrix}{\mathbf{V}} \newcommand{\TwistWedgeOperator}{\wedge} \newcommand{\UnacceptedTaskMeanCost}{C_{\text{fail}}} \newcommand{\UnassistedCompletionCount}{N_{\text{unassisted}}} \newcommand{\UnassistedSuccessIndicator}{A} \newcommand{\UnbiasedAngularBrakingDeceleration}{\alpha_{\text{nom}}} \newcommand{\UnbrakedImpactForce}{F_{\text{unbraked}}} \newcommand{\UncachedInputTokenCount}{n_{\text{in}}} \newcommand{\UncachedPromptLength}{S_{\text{new}}} \newcommand{\UncertainScenarioParameters}{x} \newcommand{\UnconstrainedCallLatency}{T_{\text{free}}} \newcommand{\UnconstrainedParseFailureRate}{p_{\text{err}}} \newcommand{\UndampedNaturalFrequency}{\omega_n} \newcommand{\UnfoldedConvolutionOutput}{\mathbf{Y}_{\text{col}}} \newcommand{\UnfoldedPatchMatrix}{\mathbf{X}_{\text{col}}} \newcommand{\UniformDistribution}{\mathcal{U}} \newcommand{\UniformLoopTurnCost}{C_{\text{turn}}} \newcommand{\UnitAliasMultiplier}{k} \newcommand{\UnitImpulseFunction}{\delta} \newcommand{\UnitQuaternion}{\mathbf{q}_{\text{quat}}} \newcommand{\UnitQuaternionScalarComponent}{q_w} \newcommand{\UnitQuaternionSphere}{S^3} \newcommand{\UnitQuaternionXComponent}{q_x} \newcommand{\UnitQuaternionYComponent}{q_y} \newcommand{\UnitQuaternionZComponent}{q_z} \newcommand{\UnitTemperatureProbabilityVector}{\mathbf{p}_{\tau_{\text{temp}}=1}} \newcommand{\UnlabeledPool}{U} \newcommand{\UnloadedTickExecutionTime}{t_{\text{unloaded}}} \newcommand{\UnmitigatedHardwareFaultRate}{\lambda_{\text{unmitigated}}} \newcommand{\UnmodeledCommandPathDelay}{\Delta t_{\text{bus}}} \newcommand{\UnobservableForceOffset}{\Delta} \newcommand{\UnobservedUnknownSpace}{\mathcal{M}_{\text{unknown}}} \newcommand{\UnprojectionJacobian}{\mathbf{J}_{\text{unproj}}} \newcommand{\UnrecoverableDamageCost}{C_{\text{blast}}} \newcommand{\UnreservedStopDelay}{\delta} \newcommand{\UnscaledAttentionScoreMatrix}{\mathbf{A}} \newcommand{\UnshardedLocalExecutionTime}{T_{\text{compute}}} \newcommand{\UnsquashedLatentAction}{\mathbf{u}} \newcommand{\UntilPrefixTime}{t''} \newcommand{\UntrackedEvidenceHorizon}{\tau_{\text{ev,untracked}}} \newcommand{\UpdatedErrorCovariance}{\mathbf{P}_{k|k}} \newcommand{\UpdatedModelParameters}{\theta_{\text{new}}} \newcommand{\UpdatedParameterSubset}{\theta_{\text{updated}}} \newcommand{\UpdatedSoftmaxRunningMaximum}{m'} \newcommand{\UpdatedStateEstimate}{\hat{\mathbf{x}}_{k|k}} \newcommand{\UpperRatioClippingWidth}{\epsilon_{\text{high}}} \newcommand{\UprightPosition}{\mathbf{p}_{\text{upright}}} \newcommand{\UprightRange}{r} \newcommand{\UpstreamGradientElement}{\bar{y}} \newcommand{\UpstreamGradientVector}{\mathbf{v}} \newcommand{\UpstreamStageLatency}{X} \newcommand{\UsableDemonstrationYield}{Y_{\text{usable}}} \newcommand{\UsefulAcceleratorHourCost}{C_{\text{useful}}} \newcommand{\UsefulComputeFraction}{f_{\text{compute}}} \newcommand{\UsefulModelFlops}{O_{\text{useful}}} \newcommand{\UsefulStepCount}{N} \newcommand{\UsefulTrainingTime}{T_{\text{useful}}} \newcommand{\UserConnectionSet}{\mathcal{N}} \newcommand{\UserSpaceSetupTime}{T_{\text{user}}} \newcommand{\UvloThresholdVoltage}{V_{\text{UVLO}}} \newcommand{\VacuumLightSpeed}{c} \newcommand{\ValidCandidateRate}{p_{\text{valid}}} \newcommand{\ValidTokenSet}{\mathcal{V}_{\text{valid}}} \newcommand{\ValidatedMotionDuration}{T_{\text{yield}}} \newcommand{\ValidatedProposalEvent}{e_{\text{prop}}} \newcommand{\ValidationDataset}{\mathcal{D}_{\text{val}}} \newcommand{\ValidationGateThreshold}{\gamma_{\text{gate}}} \newcommand{\ValidationLoss}{\mathcal{L}_{\text{val}}} \newcommand{\VanishingTimeOffset}{\epsilon} \newcommand{\VariationalDistribution}{q_\phi} \newcommand{\VariationalParameters}{\phi} \newcommand{\VectorAngle}{\phi} \newcommand{\VectorElementCount}{N_{\text{vec}}} \newcommand{\Velocity}{\mathbf{v}} \newcommand{\VelocitySaturationExponent}{\alpha} \newcommand{\VerificationCheckCost}{C_{\text{ver}}} \newcommand{\VerificationCheckCount}{K} \newcommand{\VerificationPoolCapacity}{\mu_{\text{verify}}} \newcommand{\VerificationScheduleCost}{C} \newcommand{\VerificationTrialCount}{n_{\text{trial}}} \newcommand{\VerificationTrialIndex}{j} \newcommand{\VerificationTrialTime}{T_{\text{trial}}} \newcommand{\VerifiedDemonstrationDataset}{\mathcal{D}_{\text{verified}}} \newcommand{\VerifierFalseAcceptanceRate}{\epsilon_{\text{FA}}} \newcommand{\VerifierFalseRejectionRate}{\epsilon_{\text{FR}}} \newcommand{\VerifierPassProbability}{q} \newcommand{\VerifierPrecision}{\Pi_{V}} \newcommand{\VerifierTimeout}{T_{\text{out}}} \newcommand{\VerifierTrueAcceptanceRate}{u} \newcommand{\VerifierVerdict}{V} \newcommand{\VersionSkewBound}{k_{\text{skew}}} \newcommand{\VertexSlotTime}{d} \newcommand{\VerticalFocalLength}{f_y} \newcommand{\VibrationFrequency}{f_{\text{vib}}} \newcommand{\VirtualAccelerationCommand}{\ddot{\mathbf{q}}^*} \newcommand{\VirtualDampingMatrix}{\mathbf{D}_{\text{virt}}} \newcommand{\VirtualPipelineStagesPerDevice}{V} \newcommand{\ViscousDampingMatrix}{\mathbf{D}} \newcommand{\VisionBackboneTime}{t_{\text{backbone}}} \newcommand{\VisionTokenEmbeddings}{\mathbf{z}_{\text{vision}}} \newcommand{\VisualConditioningEmbedding}{\mathbf{E}} \newcommand{\VisualEncodingTime}{t_{\text{vis}}} \newcommand{\VitImagePatch}{\mathbf{x}_p} \newcommand{\VitPatchProjectionWeights}{\mathbf{W}_{\text{patch}}} \newcommand{\VitPatchSize}{p_{\text{patch}}} \newcommand{\VitPatchTokenEmbedding}{\mathbf{z}} \newcommand{\VocabularyToken}{v} \newcommand{\VocabularyTokenLogit}{o} \newcommand{\VolumetricFlowRate}{\dot{V}} \newcommand{\VoxelBlockCoordinate}{\mathbf{b}} \newcommand{\VoxelBlockEdgeLength}{L_{\text{blk}}} \newcommand{\VoxelCenterPosition}{\mathbf{p}_{\text{vox}}} \newcommand{\VoxelIndex}{i} \newcommand{\VoxelOccupancyState}{m} \newcommand{\VoxelPitch}{r} \newcommand{\VoxelStorageSize}{s_{\text{voxel}}} \newcommand{\VoxelUpdateTraffic}{s_{\text{rw}}} \newcommand{\WarmupEpochCount}{N_{\text{warmup}}} \newcommand{\WarmupStepCount}{W} \newcommand{\WatchdogClockFrequency}{f_{\text{wdg}}} \newcommand{\WatchdogCounterReading}{W} \newcommand{\WatchdogEarliestServiceTime}{T_{\text{lower}}} \newcommand{\WatchdogLatestServiceTime}{T_{\text{upper}}} \newcommand{\WatchdogLowerWindowCount}{W_{\text{lower}}} \newcommand{\WatchdogReloadCount}{W_{\text{init}}} \newcommand{\WatchdogServiceTime}{t_{\text{service}}} \newcommand{\WatchdogToken}{T} \newcommand{\WatchdogUpperWindowCount}{W_{\text{upper}}} \newcommand{\WaveImpedance}{b} \newcommand{\WeightElementStorageSize}{s_{\text{elem,W}}} \newcommand{\WeightMatrix}{\mathbf{W}} \newcommand{\WeightMatrixColumnCount}{n} \newcommand{\WeightMatrixEntry}{W_{ij}} \newcommand{\WeightMatrixRowCount}{m} \newcommand{\WeightMemory}{M_{\text{weights}}} \newcommand{\WeightOnlyStepTime}{t} \newcommand{\WeightPenaltyStrength}{\lambda_{\text{reg}}} \newcommand{\WeightQuantizationScale}{s_W} \newcommand{\WeightRangeBound}{W_{\text{max}}} \newcommand{\WeightStreamingDecodeTime}{T_{\text{decode}}} \newcommand{\WeightVector}{\mathbf{w}} \newcommand{\WeightedNormArgument}{\mathbf{z}} \newcommand{\WheelAngularSpeed}{\omega} \newcommand{\WheelDiameter}{D_{\text{wheel}}} \newcommand{\WheelInertia}{J_{\text{wheel}}} \newcommand{\WheelNormalLoad}{F_z} \newcommand{\WheelRadius}{r} \newcommand{\WheelRevolutionCount}{N_{\text{rev}}} \newcommand{\WheelTrackWidth}{b} \newcommand{\WhiteNoiseProcess}{\mathcal{WN}} \newcommand{\WholeBodyDecisionVariables}{\mathbf{z}} \newcommand{\WholeRepositoryShardGrant}{\Gamma_{b}} \newcommand{\WidthMultiplier}{w_{\text{mult}}} \newcommand{\WidthScalingRatio}{\beta} \newcommand{\WilsonIntervalCenter}{\tilde{p}} \newcommand{\WindingCoreThermalResistance}{R_{\text{th,wc}}} \newcommand{\WindingCurrent}{I} \newcommand{\WindingJouleHeat}{E_{\text{thermal}}} \newcommand{\WindingLossPower}{P_{\text{loss}}} \newcommand{\WindingTemperature}{T_{\text{winding}}} \newcommand{\WindingTemperatureLimit}{T_{\text{limit}}} \newcommand{\WindingTerminalVoltage}{V_{\text{terminal}}} \newcommand{\WindingThermalCapacitance}{C_{\text{wind}}} \newcommand{\WindowArrivalCount}{k} \newcommand{\WindowArrivalOffset}{t} \newcommand{\WindowSpendingLimit}{C_{\text{win}}} \newcommand{\WithinTaskRunStandardDeviation}{\sigma_{\text{run}}} \newcommand{\WorkedTraceProduct}{c} \newcommand{\WorkedTraceProductAdjoint}{\bar{c}} \newcommand{\WorkedTraceSine}{b} \newcommand{\WorkedTraceSineAdjoint}{\bar{b}} \newcommand{\WorkedTraceSquare}{a} \newcommand{\WorkedTraceSquareAdjoint}{\bar{a}} \newcommand{\WorkerBaseCommitHash}{h_{\text{base}}} \newcommand{\WorkerCandidateCommitHash}{h_{\text{worker}}} \newcommand{\WorkerCompletionDistribution}{F} \newcommand{\WorkerCompletionTime}{T} \newcommand{\WorkerCount}{N_{\text{workers}}} \newcommand{\WorkerDelayProbability}{p} \newcommand{\WorkerIndex}{k} \newcommand{\WorkerMinibatch}{B} \newcommand{\WorkerOverheadSlope}{\gamma} \newcommand{\WorkerTransformTime}{T_{\text{transform}}} \newcommand{\WorkerWrittenFileCount}{w} \newcommand{\WorkloadMeanOutputLength}{\mu} \newcommand{\WorkloadRequestIndex}{i} \newcommand{\WorkspaceExtentX}{L_x} \newcommand{\WorkspaceExtentY}{L_y} \newcommand{\WorkspaceExtentZ}{L_z} \newcommand{\WorkspaceRestoreTime}{T_{\text{ws}}} \newcommand{\WorkspaceVolume}{V_{\text{ws}}} \newcommand{\WorldBaseTransform}{\mathbf{T}_{WB}} \newcommand{\WorldBodyTransform}{\mathbf{T}_{wb}} \newcommand{\WorldFramePoint}{\mathbf{p}_{\text{world}}} \newcommand{\WorldLidarTransform}{\mathbf{T}_{wl}} \newcommand{\WorldMapTransform}{\mathbf{T}_{\text{world}}^{\text{map}}} \newcommand{\WorldPointCovariance}{\boldsymbol{\Sigma}_{\text{world}}} \newcommand{\WorldReferenceFrame}{\mathcal{F}_W} \newcommand{\WorldStateSpace}{\mathcal{S}} \newcommand{\WorldToCameraRotation}{\mathbf{R}_{CW}} \newcommand{\WorldToCameraTransform}{\mathbf{T}_{CW}} \newcommand{\WorldToCameraTranslation}{\mathbf{t}_{CW}} \newcommand{\WornPlantTransitionDistribution}{p_{n \gg 1}} \newcommand{\WorseArmSuccessProbability}{p_{\text{low}}} \newcommand{\WorstCaseExecutionTime}{C} \newcommand{\WorstCaseInterruptLatency}{t_{\text{irq,lat}}} \newcommand{\WorstCasePermissionCycleTime}{T_{\text{exec}}} \newcommand{\WorstCaseResponseTime}{R} \newcommand{\WristAngularVelocity}{\boldsymbol{\omega}_{\text{wrist}}} \newcommand{\WristCameraEmbedding}{\mathbf{e}_{\text{wrist}}} \newcommand{\WristLinearVelocity}{\mathbf{v}_{\text{wrist}}} \newcommand{\WristObjectTransform}{\mathbf{T}_{\text{wrist} \leftarrow \text{object}}} \newcommand{\WristSkewDisplacement}{\Delta \mathbf{p}_{\text{skew}}} \newcommand{\XAxisAngularRate}{\omega_x} \newcommand{\XAxisRotationCoordinate}{\omega_x} \newcommand{\XForceCeiling}{F_x} \newcommand{\XPositionErrorEnvelope}{e_x} \newcommand{\XTaskToleranceSemiAxis}{r_x} \newcommand{\XTorqueCeiling}{\tau_x} \newcommand{\YAxisAngularRate}{\omega_y} \newcommand{\YAxisRotationCoordinate}{\omega_y} \newcommand{\YForceCeiling}{F_y} \newcommand{\YPositionErrorEnvelope}{e_y} \newcommand{\YTaskToleranceSemiAxis}{r_y} \newcommand{\YTorqueCeiling}{\tau_y} \newcommand{\YawRate}{\omega_z} \newcommand{\YoshikawaManipulability}{w} \newcommand{\ZAxisRotationCoordinate}{\omega_z} \newcommand{\ZForceCeiling}{F_z} \newcommand{\ZPositionErrorEnvelope}{e_z} \newcommand{\ZTaskToleranceSemiAxis}{r_z} \newcommand{\ZTorqueCeiling}{\tau_z} \newcommand{\ZTransformVariable}{z} \newcommand{\ZeroEntryIndicator}{\mathbf{1}_{\{(\mathbf{W}_{\text{sparse}})_{ij} = 0\}}} \newcommand{\ZeroFailureTrialCount}{n} \newcommand{\ZeroFailureUpperConfidenceLimit}{p_{\text{fail, upper}}^{95\%}} \newcommand{\ZeroMatrix}{\mathbf{0}} \newcommand{\ZeroMomentPoint}{\mathbf{p}_{\text{ZMP}}} \newcommand{\ZeroVector}{\mathbf{0}} \newcommand{\ZohHoldTravel}{d_{\text{ZOH}}} \newcommand{\ZohPhaseShift}{\phi_{\text{ZOH}}} \newcommand{\ZohTransportDelay}{\tau_{\text{ZOH}}} \newcommand{\AuthorityLevels}{\AuthorityExposureLevel} \newcommand{\BreakEvenTaskVolume}{\BreakEvenTaskCount} \newcommand{\PertokenPricesCache}{\CachedInputTokenPrice} \newcommand{\ContentionAndCoherencyCoefficientsTwo}{\CoherencyCoefficient} \newcommand{\CoherencyContentionCoefficient}{\CoherencyCoefficient} \newcommand{\TaskDeadline}{\CompletionDeadline} \newcommand{\Deadline}{\CompletionDeadline} \newcommand{\Confidentiality}{\ConfidentialityLabel} \newcommand{\ContentionAndCoherencyCoefficients}{\ContentionCoefficient} \newcommand{\CostPerAcceptedTaskEff}{\CostPerAcceptedTask} \newcommand{\DuplicateeffectProbability}{\DuplicateEffectProbability} \newcommand{\EstimatedAdvantageK}{\EstimatedHistoryAdvantage} \newcommand{\EstimatedValueK}{\EstimatedRemainingReturn} \newcommand{\ExpectedIrreversibleLossA}{\ExpectedIrreversibleLoss} \newcommand{\PertokenPricesIn}{\InputTokenPrice} \newcommand{\CohensKappa}{\InterAnnotatorAgreement} \newcommand{\KvBlockSizeBlk}{\KvBlockSize} \newcommand{\MaskedFinetuningLossSft}{\MaskedFinetuningLoss} \newcommand{\ValidityIntervalOfAMemoryEntryBirth}{\MemoryEntryBirthGeneration} \newcommand{\ValidityIntervalOfAMemoryEntryDeath}{\MemoryEntryDeathGeneration} \newcommand{\MemoryHeldDuringAWait}{\MemoryHoldDuringWait} \newcommand{\OptimalCheckpointIntervalCkpt}{\OptimalCheckpointInterval} \newcommand{\PertokenPricesOut}{\OutputTokenPrice} \newcommand{\PertokenDecodeTime}{\PerTokenDecodeTime} \newcommand{\TokenLossMask}{\PositionLossMask} \newcommand{\LossMaskT}{\PositionLossMask} \newcommand{\ValidityIntervalOfAMemoryEntryQ}{\QueryWorkspaceGeneration} \newcommand{\RequestAndReplylossProbabilitiesTwo}{\ReplyLossProbability} \newcommand{\RequestAndReplylossProbabilities}{\RequestLossProbability} \newcommand{\EnvironmentStateK}{\RolloutEnvironmentState} \newcommand{\StalesupportRate}{\StaleSupportRate} \newcommand{\StateLevels}{\StateExposureLevel} \newcommand{\GoalContract}{\TaskContractGoal} \newcommand{\Environment}{\TaskEnvironment} \newcommand{\Vocabulary}{\TokenVocabulary} \newcommand{\ActionProposal}{\TrajectoryAction} \newcommand{\ConcurrentTrajectoriesTwo}{\TrajectoryAdmissionRate} \newcommand{\ActionObservation}{\TrajectoryObservation} \newcommand{\Observation}{\TrajectoryObservation} \newcommand{\StateAtTurn}{\TrajectoryState} \newcommand{\PerturnAppend}{\TurnAppendLength} \newcommand{\Context}{\TurnContext} \newcommand{\Horizon}{\TurnHorizon} \newcommand{\VerifierFalseacceptance}{\VerifierFalseAcceptanceRate} \newcommand{\VerifierFalseacceptanceFr}{\VerifierFalseRejectionRate} \newcommand{\WorkerCountWorkers}{\WorkerCount} \newcommand{\AllocationHoldTime}{\AllocatedWallTime} \newcommand{\CheckpointIntervalCkpt}{\CheckpointInterval} \newcommand{\AcceleratorsPerNodeNodes}{\ClusterNodeCount} \newcommand{\CommunicationcomputationRatio}{\CommunicationComputeRatio} \newcommand{\PercomponentFailureRate}{\ComponentFailureRate} \newcommand{\Correlation}{\CorrelationCoefficient} \newcommand{\DataparallelDegreeDp}{\DataParallelDegree} \newcommand{\NumberOfDevices}{\DeviceCount} \newcommand{\TypeIAndTypeIiErrorRatesStat}{\HypothesisTestFalseNegativeRate} \newcommand{\TypeIAndTypeIiErrorRatesSig}{\HypothesisTestSignificanceLevel} \newcommand{\DollarCostInfer}{\InferenceCost} \newcommand{\KvcacheBytesPerToken}{\KvCacheBytesPerToken} \newcommand{\KvcacheMemory}{\KvCacheMemory} \newcommand{\CrossoverPoint}{\LatencyBandwidthCrossoverSize} \newcommand{\LoggpLongmessageTime}{\LoggpLongMessageTime} \newcommand{\LogploggpNetworkLatency}{\LogpNetworkLatency} \newcommand{\LongmessageGapPerByte}{\LongMessageGapPerByte} \newcommand{\MeanTimeBetweenFailuresThree}{\MeanTimeBetweenFailures} \newcommand{\PermessageLatency}{\MessageStartupLatency} \newcommand{\NdeviceTime}{\MultiDeviceRunTime} \newcommand{\PipelineparallelDegreePp}{\PipelineParallelDegree} \newcommand{\MlProductivityGoodputFactorsProgram}{\ProgramGoodput} \newcommand{\ReceiverOverheadRecv}{\ReceiverOverhead} \newcommand{\CollectiveCompletionTimeRing}{\RingAllReduceCompletionTime} \newcommand{\RingtreeCrossoverPayload}{\RingTreeCrossoverPayload} \newcommand{\MlProductivityGoodputFactorsRuntime}{\RuntimeGoodput} \newcommand{\GoodputRatio}{\RuntimeGoodput} \newcommand{\ScalingExponentScale}{\ScalingExponent} \newcommand{\MlProductivityGoodputFactorsScheduling}{\SchedulingGoodput} \newcommand{\SingledeviceTimeOne}{\SingleDeviceRunTime} \newcommand{\ReliabilityFunctionSystem}{\SystemReliability} \newcommand{\TensorparallelDegreeTp}{\TensorParallelDegree} \newcommand{\SmallConstant}{\ToleratedFailureProbability} \newcommand{\DollarCostTrain}{\TrainingCost} \newcommand{\CollectiveCompletionTimeTree}{\TreeAllReduceCompletionTime} \newcommand{\UsefulComputetimeFraction}{\UsefulComputeFraction} \newcommand{\AccuracyAtTime}{\AccuracyAfterDeployment} \newcommand{\NumberOfAttentionHeads}{\AttentionHeadCount} \newcommand{\Distribution}{\InputDistribution} \newcommand{\NumberOfKeyValueHeads}{\KvHeadCount} \newcommand{\NumberOfKeyvalueHeadsKv}{\KvHeadCount} \newcommand{\NumberOfLayers}{\LayerCount} \newcommand{\LayerInputAndOutputWidths}{\LayerInputWidth} \newcommand{\LayerInputAndOutputWidthsTwo}{\LayerOutputWidth} \newcommand{\Gradient}{\LossGradient} \newcommand{\TrainingDistributionZero}{\TrainingDistribution} \newcommand{\AcceleratorCountGpu}{\AcceleratorCount} \newcommand{\ActivationMemoryActivations}{\ActivationMemory} \newcommand{\BatchServiceTimeSvc}{\BatchServiceTime} \newcommand{\EnergyPerOperationCompute}{\EnergyPerOperation} \newcommand{\GradientMemoryGradients}{\GradientMemory} \newcommand{\IronlawTermTimesCompute}{\IronLawComputeTime} \newcommand{\SingleDeviceComputeTime}{\IronLawComputeTime} \newcommand{\IronlawTermTimesMemory}{\IronLawMemoryTime} \newcommand{\LossscaleFactor}{\LossScaleFactor} \newcommand{\OptimizerstateMemory}{\OptimizerStateMemory} \newcommand{\RequestTimeInSystemLat}{\RequestTimeInSystem} \newcommand{\StoragePricePerByteTime}{\StorageCapacityPrice} \newcommand{\WeightMemoryWeights}{\WeightMemory} \newcommand{\WindingAndAmbientTemperatureTwo}{\AmbientTemperature} \newcommand{\BackemfVoltageBemf}{\BackEmfVoltage} \newcommand{\CoordinateReferenceFramesB}{\BodyReferenceFrame} \newcommand{\CameraframeThreedCoordinate}{\CameraFramePoint} \newcommand{\CartesianThreedPosition}{\CartesianPosition} \newcommand{\CommandTransportTimeBus}{\CommandTransportTime} \newcommand{\ContactForceVectorK}{\ContactPointForce} \newcommand{\ContactPointJacobianK}{\ContactPointJacobian} \newcommand{\ContinuousPeakCurrent}{\ContinuousCurrent} \newcommand{\CredibleDecelerationBrake}{\CredibleBrakingDeceleration} \newcommand{\OpenloopCrossoverFrequency}{\CrossoverFrequency} \newcommand{\PhaseLagDegradation}{\DelayPhaseLag} \newcommand{\DiffusionScheduleParameterK}{\DiffusionCumulativeSchedule} \newcommand{\DispatchtoadmissionIntervalDa}{\DispatchAdmissionInterval} \newcommand{\EmittedTokenCountOut}{\EmittedTokenCount} \newcommand{\FundamentalAndEssentialMatricesTwo}{\EssentialMatrix} \newcommand{\ForwardinvariantSafeSet}{\ForwardInvariantSafeSet} \newcommand{\FreespaceDepth}{\FreeSpaceDepth} \newcommand{\FundamentalAndEssentialMatrices}{\FundamentalMatrix} \newcommand{\TransmissionEfficiencyGear}{\GearboxTransmissionEfficiency} \newcommand{\HardwareAndCommoncauseRateOther}{\HardwareCommonCauseRate} \newcommand{\ContinuousPeakTorqueHold}{\HoldingTorque} \newcommand{\OptimalInertiamatchingRatio}{\InertiaMatchingRatio} \newcommand{\IntentleaseExpiryIntentexp}{\IntentLeaseExpiry} \newcommand{\LatentStyleStateEmbedding}{\LatentStyleVariable} \newcommand{\LinearBarrierDecayRateCbf}{\LinearBarrierDecayRate} \newcommand{\Momentum}{\LinearMomentum} \newcommand{\RotorAndLoadInertiaTwo}{\LoadInertia} \newcommand{\LqrGainAndWeights}{\LqrFeedbackGain} \newcommand{\CenterOfMass}{\MassCenterPosition} \newcommand{\TorqueAndBackemfConstants}{\MotorTorqueConstant} \newcommand{\NoisePredictionNetworkTwo}{\NoisedActionChunk} \newcommand{\ObservabilityMatricesNl}{\NonlinearObservationSpace} \newcommand{\ObservabilityMatrices}{\ObservabilityMatrix} \newcommand{\ContinuousPeakCurrentTwo}{\PeakCurrent} \newcommand{\ContinuousPeakTorque}{\PeakTorque} \newcommand{\PermissionloopPeriodTick}{\PermissionLoopPeriod} \newcommand{\PhaseInductanceAndResistance}{\PhaseInductance} \newcommand{\PhaseInductanceAndResistanceTwo}{\PhaseResistance} \newcommand{\InitialAndCeilingError}{\PositionErrorCeiling} \newcommand{\RenewaljitterAllowance}{\RenewalJitterAllowance} \newcommand{\ResidentStopDistanceSuffix}{\ResidentStopDistance} \newcommand{\CoefficientOfRestitution}{\RestitutionCoefficient} \newcommand{\RigidtransformTranslation}{\RigidTransformTranslation} \newcommand{\RotorAndLoadInertia}{\RotorInertia} \newcommand{\SamplingPeriodAndRate}{\SamplingPeriod} \newcommand{\SensorLeverarmVector}{\SensorLeverArm} \newcommand{\SequentialLoglikelihoodRatioM}{\SequentialLogLikelihoodRatio} \newcommand{\SinglestepImitationError}{\SingleStepImitationError} \newcommand{\SprtBoundariesLo}{\SprtLowerBoundary} \newcommand{\SprtBoundariesUp}{\SprtUpperBoundary} \newcommand{\LinearStatespaceMatrices}{\StateSpaceInputMatrix} \newcommand{\LinearStatespaceMatricesSys}{\StateSpaceSystemMatrix} \newcommand{\PertrialProbabilitiesTarget}{\TargetTrialSuccessProbability} \newcommand{\TorqueproducingCurrent}{\TorqueProducingCurrent} \newcommand{\TrackingerrorBound}{\TrackingErrorBound} \newcommand{\PertrialProbabilitiesFail}{\TrialFailureProbability} \newcommand{\TsdfAccumulatedVolumeVox}{\TsdfAccumulatedWeight} \newcommand{\VirtualDampingAndStiffness}{\VirtualDampingMatrix} \newcommand{\Radius}{\WheelRadius} \newcommand{\WindingAndAmbientTemperature}{\WindingTemperature} \newcommand{\CoordinateReferenceFramesW}{\WorldReferenceFrame} \newcommand{\ZerofailureTrialCount}{\ZeroFailureTrialCount} \newcommand{\ZeroMomentPointZmp}{\ZeroMomentPoint} \newcommand{\Glyph}[1]{#1} $$

5 Neural Computation
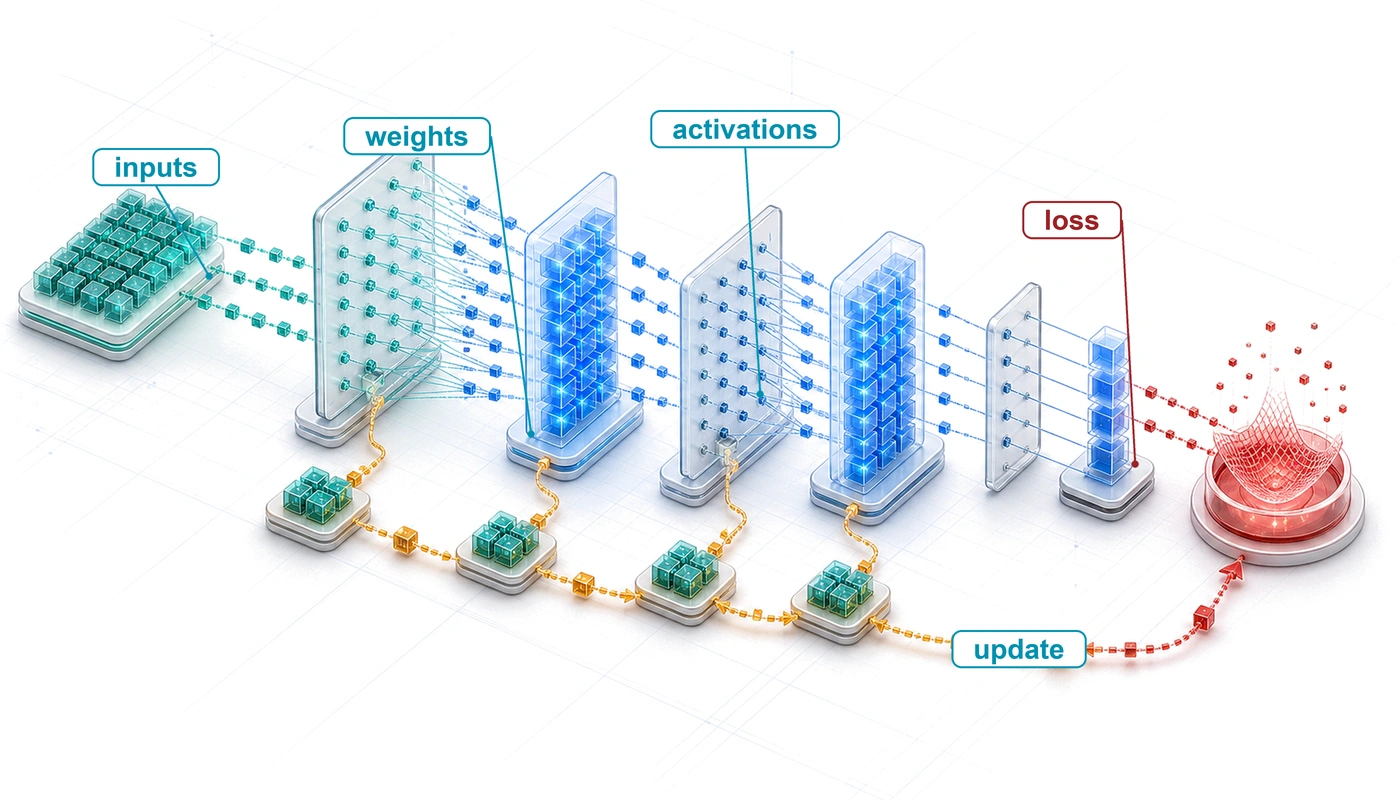
Layered isometric blueprint of neural computation where inputs move through weighted layers, activations form, and a loss signal returns through the model.

Purpose

Machine Learning Systems Architecture Stack

Architecture stack focus for this chapter.

Why does understanding a neural network’s math matter more than reading its code?

Neural network code can look deceptively simple because a few tensor operations hide the workload that every layer of the system must execute. Matrix dimensions determine arithmetic and data movement; intermediate values determine memory pressure; numerical ranges and gradients determine whether learning remains stable. An operation that looks cheap in isolation can dominate a system when repeated across a batch or when its outputs must be retained for learning, so source-code length gives little indication of resource cost. Doubling both input and output dimensions quadruples a dense layer’s arithmetic, and keeping activations for the backward pass can multiply memory use several times over, while the code looks no more complicated than before. Two implementations of the same model can run very differently because batch shape, precision, and the target machine change what fits, how quickly it runs, and whether its calculations remain numerically valid. When training stalls or deployment exhausts memory, reading a framework call rarely identifies which resource is the binding constraint. A numerical failure, a memory bottleneck, and an inefficient implementation can produce similar high-level symptoms while demanding different remedies. Diagnosis and planning therefore require reasoning from the underlying operations to the bytes moved, values retained, and work repeated. This view can expose a mismatch before an expensive training run or deployment attempt does, when correcting it still costs an edit rather than a week of lost compute. Those primitives provide a stable vocabulary across architectures and make software abstractions auditable, turning opaque code into a workload that can be measured, diagnosed, and mapped to hardware. In D·A·M terms, neural computation is the interface where algorithmic structure becomes machine work and where physical limits feed back into model design.

Learning Objectives
  • Explain why learned arithmetic replaced rule-based logic and why it fails numerically rather than logically
  • Compare activation functions by nonlinearity, gradient behavior, and hardware execution cost
  • Calculate parameter counts, multiply-accumulate operations, activation storage, and the arithmetic intensity that batching raises in dense layers
  • Apply cross-entropy loss and gradient updates to reason about supervised learning dynamics
  • Derive forward and backward propagation as matrix operations over batches
  • Analyze training vs. inference workloads using compute, memory, and deployment constraints
  • Evaluate an end-to-end document-recognition pipeline from preprocessing through decision thresholds and human review

5.1 From Logic to Arithmetic

Recognizing one handwritten digit costs the small network at the center of this chapter 109,184 MACs. A multiply-accumulate (MAC) multiplies one weight by one input value and adds the product to a running sum (\(\MacAccumulator\leftarrow \MacAccumulator+ \ModelWeight\cdot \LayerInputComponent\)), and the usual convention counts it as two floating-point operations (\(1\text{ MAC} = 2\text{ FLOPs}\)), so the digit costs 218,368 FLOPs. None of that work is a logical branch. A program that once tested pixel thresholds and stroke patterns with if-then-else rules has become a fixed sequence of arithmetic, and how fast it runs now depends on how quickly the machine can supply operands to that arithmetic, whether memory bandwidth or arithmetic capacity runs out first. Such a program also fails differently. It rarely fails logically; it fails numerically, as values grow or shrink until they stop carrying information.

The pipeline of Data Engineering ends with a clean, versioned training set. One example from such a set, a handwritten digit, is where the model’s work begins. An example does not learn on its own. The next system boundary is the model, the algorithm axis of D·A·M, where data becomes learned behavior, and this chapter follows what the model does with that one digit. Matrix multiplications and activation functions carry it forward to ten scores, the chain rule carries the error in those scores back as gradients, and an update folds the gradients into the weights.

The silicon contract (principle 4) says which hardware resource a model architecture will saturate first. This chapter supplies the model’s side of that contract. The architecture’s mathematical operators fix the work to be done and the state to be held. Precision, data layout, implementation, and hardware then fix how many bytes actually move, and therefore the realized latency and energy. Honoring the contract requires understanding both the operators and how they map to the machine.

↩︎ The hardware’s side of the silicon contract, the terms that memory bandwidth, peak compute rate, and fixed overhead set for any model, is established on the single-node stack in Inside one machine: The single-node stack.

The digit passes through five stages in the life of a model. The forward pass carries the image through three weight matrices to ten class scores, the loss reduces those scores to one number that says how wrong they are, the backward pass carries that signal back through the layers with the chain rule, the update adjusts every parameter, and serving runs the forward pass alone with frozen weights. The iron law of ML systems (principle 3) charges each stage for the bytes it moves, the operations it performs, and its fixed overhead, and table 1 shows how differently the five stages spend those terms. The loss costs almost nothing, yet it is the only signal training receives; the update does little arithmetic but touches every parameter; the backward pass cannot run without the activations the forward pass left behind. Training repeats the first four stages millions of times and serving repeats only the first, and that asymmetry produces the chapter’s central result, the gap between what training and inference must hold in memory.

Table 1: Where Each Stage Spends Its Budget: Work, data movement, and retained state for the five stages in the life of a model, for the running 784-128-64-10 network. Training repeats the first four stages for every batch, while serving runs only the forward pass. Later sections derive each row, and the summary returns to the table.
Stage Work Data moved State left behind Usually dominant cost
Forward pass One MAC per weight per example (109,184 MACs per digit) Every weight read; each layer’s activations written and read Activations, kept until the backward pass Bytes at small batch, operations at large
Loss A few operations per class Ten scores per example One number per batch Negligible
Backward pass Up to twice the forward pass Weights and saved activations read; gradients written Gradients Operations or bytes, as in the forward pass
Update A few operations per parameter Every weight, gradient, and optimizer value read and written Optimizer state Bytes
Serving The forward pass alone Weights plus two short-lived activation buffers Nothing beyond the weights Bytes and fixed overhead at small batch

Example 5.1: Running example: MNIST digit recognition
Scenario: A handwritten-digit classifier receives \(28{\times}28\) grayscale images from the Modified National Institute of Standards and Technology (MNIST) dataset (LeCun et al. 1998), flattens each into 784 pixel values, and maps them through hidden layers of 128 and 64 units to 10 class scores, one per digit (784 → 128 → 64 → 10).

Diagnosis: The network holds 109,386 parameters, which occupy 438 KB in 32-bit floating point (FP32), and it spends 109,184 MACs (218,368 FLOPs) to classify one digit. Those three numbers summarize what one classification costs.

Systems lesson: The task is small enough to compute by hand yet exercises every mechanism that larger networks scale up. Each later section either derives one of these numbers or asks what happens to it when the network trains, grows, or ships.

Even this small network is deep in the sense the field uses. Each of its layers computes new features from the layer before, and training learns those features from examples instead of receiving them from a designer.

Definition 5.1: Deep learning

Deep learning is the computational paradigm that learns layered feature representations from data by composing nonlinear transformations. For suitable tasks, those learned representations can reduce manual feature engineering while increasing computation \((\Operations)\) and state.

  1. Significance: For suitable compositional function classes, depth can represent a hierarchy much more parameter-efficiently than a shallow network. Each layer adds work and state, and the resulting binding constraint may lie on the data, algorithm, or machine axis depending on the workload.
  2. Distinction: Shallow methods such as logistic regression and support vector machines can work well with appropriate representations. Deep learning instead uses multiple nonlinear stages to learn representations jointly with the prediction task, which can reduce manual feature design and sometimes support transfer across tasks.
  3. Common pitfall: A frequent misconception is that parameter count alone explains deep learning. Two networks with the same parameter count can differ sharply in what they learn, because architecture, data, optimization, and scale together determine the practical result.

Learning representations end to end also introduces engineering failure modes that conventional software debugging cannot isolate. Deep learning failures produce subtle symptoms: gradient instabilities1 that halt convergence, numerical precision errors that corrupt parameter state across millions of updates, or inefficient memory access patterns in tensor operations (operations on multidimensional arrays of numbers) that leave accelerator compute units underutilized. Resolving these failures requires reasoning about the physical execution of tensor algebra on hardware rather than stepping through procedural control flow, and those hardware demands depend first on representation: whether patterns are expressed through hand-authored rules, engineered statistical features, or learned parameters.

1 Gradient instabilities: In a simplified 20-layer path through sigmoid (S-shaped) activations, the activation-derivative factors alone are bounded above by \(0.25^{20}\), or \(9.1 \times 10^{-13}\). The complete gradient also includes weights and other operations, but repeated saturated derivatives can still make early-layer updates negligible. Plateaus or not-a-number (NaN) values can reveal the symptom without identifying the cause; rectified linear unit (ReLU) activations and careful initialization (both taught later in this chapter), together with normalization, better optimizers, and residual connections, all helped make deep networks trainable, and Skip connections and gradient flow treats residual connections in detail.

Self-Check: Question
  1. An engineer deploys the same neural network model on an accelerator with high GPU memory and on an older accelerator with smaller memory capacity. The model executes cleanly on the larger card but crashes mid-batch on the smaller card with a CUDA out-of-memory error on an intermediate activation tensor, without generating a Python traceback. Per the Silicon Contract perspective of neural computation, which diagnostic approach addresses the root cause of this failure?

    1. Audit the Python application code and framework version to identify an unhandled control-flow software exception.
    2. Increase logging verbosity to capture a Python traceback, assuming the crash stems from glue-code syntax errors.
    3. Downgrade the GPU driver and CUDA toolkit under the assumption that the newer driver introduced backward-incompatibility bugs.
    4. Calculate the intermediate activation and parameter memory requirements directly from layer tensor dimensions, because the mathematical operators—not the application code—determine the physical memory demands.
  2. Recognizing one MNIST digit requires approximately \(109{,}000\) multiply-accumulate operations. Explain why a traditional control-flow debugger is insufficient when such a network fails, and describe how its failures differ from those of a rule-based program.

  3. True or False: In the iron law of ML systems (\(T = \frac{D_{\text{vol}}}{\text{BW}} + \frac{O}{R_{\text{peak}} \cdot \eta_{\text{hw}}} + L_{\text{lat}}\)), the shift from rule-based logic to dense neural computation primarily increases the network latency term \(L_{\text{lat}}\) because matrix multiplications introduce distributed network round-trips.

See Answers →

5.2 Computing with Patterns

One task makes the history concrete: classifying a \(28{\times}28\) grayscale image of a handwritten digit. Computing has attacked that task with three representation strategies, hand-authored decision logic, engineered feature extractors, and learned neural representations. Under illustrative implementations, one digit costs roughly one hundred comparisons under the first, several thousand arithmetic operations under the second, and more than one hundred thousand MACs under the third. Each approach replaced one whose representations ran out, and each shifted which hardware resource binds.

↩︎ The succession of logic, knowledge, feature-engineering, and infrastructure bottlenecks that these paradigms answered is established in The Evolution of AI Bottlenecks.

5.2.1 From rules to engineered features

Writing explicit if-else rules to recognize a handwritten digit breaks as soon as a writer tilts a stroke, thickens a line, or leaves a loop open. Rule-based programming requires developers to specify every procedure that maps inputs to outputs: in the classical flow of figure 1, human-authored rules and input data enter the program together, and the program deterministically computes the answers.
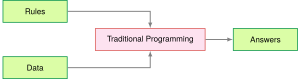
Figure 1: Traditional Programming Flow: Answers are the program’s output, never its input. This input-output pattern formed the basis for early AI systems but lacks the adaptability needed for complex pattern recognition tasks.

An illustrative rule-based classifier for the digit compares pixel intensities against fixed thresholds, checks stroke patterns in localized regions, and branches on the results. Under this toy implementation, the computation requires roughly 100 comparisons over 784 bytes of pixel data, a workload that is small, predictable, and easily held in an ordinary CPU cache. The comparison establishes a workload baseline, not the accuracy of a production rule system. Rules fail on coverage rather than cost: every new writing style demands new branches, and the expert systems of the 1970s and 1980s stalled on perception tasks because visual competence is implicit and resists explicit rules.

The failures of rule-based systems suggested an alternative. Rather than encoding human knowledge as explicit rules, the system could discover patterns from data, and machine learning took that direction by replacing a rule for every situation with programs that identified patterns in examples. The success of these methods, however, still depended heavily on human insight to define which patterns to look for, a process known as feature engineering.

Feature engineering transformed raw data into representations that expose patterns to learning algorithms. The histogram of oriented gradients (HOG)2 (Dalal and Triggs 2005) exemplifies this approach. In figure 2, the feature-extraction pipeline divides an image into spatial cells and bins local pixel gradient directions into eight orientation histograms, turning raw pixels into shape descriptors that tolerate lighting changes and small shifts in position.

2 Histogram of oriented gradients (HOG): An influential handcrafted descriptor for pedestrian detection before deep learning (Dalal and Triggs 2005). One common configuration computes gradient orientations in \(8{\times}8\) pixel cells, with cell size and other choices tuned for the task. HOG’s fixed computation graph can run efficiently on CPUs with predictable latency, while learned features can reduce descriptor redesign but do not automatically transfer across domains and often benefit from accelerators only as model and batch scale grow.

Dalal, Navneet, and Bill Triggs. 2005. “Histograms of Oriented Gradients for Human Detection.” 2005 IEEE Computer Society Conference on Computer Vision and Pattern Recognition (CVPR’05) 1: 886–93. https://doi.org/10.1109/cvpr.2005.177.
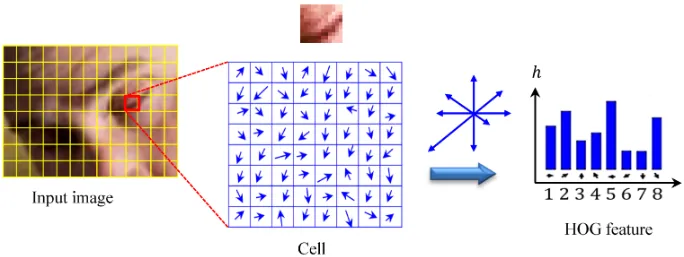
Figure 2: HOG Method: A local image patch is divided into cells, gradient orientations are accumulated into a histogram, and the resulting descriptor summarizes local shape while reducing sensitivity to illumination. Source: Figure 5 of Bakheet and Al-Hamadi (2021), licensed under CC BY 4.0.
Bakheet, Samy, and Ayoub Al-Hamadi. 2021. “A Framework for Instantaneous Driver Drowsiness Detection Based on Improved HOG Features and Naïve Bayesian Classification.” Brain Sciences 11 (2): 240. https://doi.org/10.3390/brainsci11020240.

Feature engineering raises the digit’s cost while keeping it CPU friendly. For the same \(28{\times}28\) digit, an illustrative HOG implementation divides the image into a 7 by 7 grid of 4 by 4 cells, computes gradient magnitudes and orientations, bins them into 9 orientation histograms per cell (the diagram draws eight directions; the bin count, like the cell size, is a tuning choice), and produces a 441-element feature vector. A linear support vector machine (SVM) classifier then performs ten dot products over that vector. The result is roughly 8,000 operations and about 2 KB of working memory, about 80× the work of the toy rule-based baseline, but still structured and well served by CPU vector units using single instruction, multiple data (SIMD). Descriptor size, class count, and implementation all change this cost.

These descriptors carried face and pedestrian detection through the 2000s, but every new problem needed an expert to design a new extractor, and the resulting features missed whatever patterns their designers had not anticipated. Human expertise, not computation, set the ceiling on how much real-world visual variation a system could absorb.

5.2.2 Automatic pattern discovery

Neural networks remove that ceiling by discovering their own features, learning representations directly from raw data instead of following explicit rules or human-designed extractors. Supervised learning inverts the traditional programming relationship. Engineers provide examples and target answers, and optimization produces the decision rules as output rather than taking them as input (figure 3). Humans still shape the task through data, objectives, architectures, and evaluation.
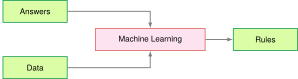
Figure 3: Data-Driven Rule Discovery: The flow diagram inverts the traditional programming pattern: data and answers serve as inputs to the machine learning process, which produces a learned decision function as output. This shift replaces a hand-coded decision policy while leaving engineers responsible for the data, objective, architecture, and evaluation.

The same digit, processed by the chapter’s three-layer network (784 → 128 → 64 → 10), costs 109,184 MACs, 1,100× the work of the toy rule-based baseline. The 109,386 parameters occupy 438 KB in FP32, more than most L1 caches hold, so even inference creates traffic between cache levels. Training multiplies the cost further. Each image is processed forward and backward before an update, at two to three forward passes of dense-layer arithmetic, repeated over 60,000 images for multiple epochs (full passes over the training set). Dense matrix multiplications now dominate the arithmetic and favor parallel hardware, shifting the engineering challenge from control-flow branching to memory bandwidth, data reuse, and hardware parallelism.
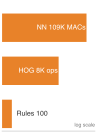
Vertical log-scale ladder of orange bars, smallest at bottom: rule-based comparisons, then HOG operations, then neural-network matrix MACs at the top, spanning several orders of magnitude.

In this MNIST comparison, learned features spend far more arithmetic.

This trade is the bitter lesson at the scale of a single layer. HOG encodes an expert’s knowledge of edges and orientations in 8,000 operations that never change; the learned first layer spends far more arithmetic and lets the data decide which pixel combinations matter. As computation became cheap enough, the general method that converts arithmetic into accuracy overtook the hand-built one. That victory demands the arithmetic, memory traffic, and training infrastructure that the rest of this chapter quantifies.

↩︎ Why general methods that scale with computation keep overtaking methods built on human knowledge, the bitter lesson, is established in The Bitter Lesson.

The escalation matters less for its 1,100× operation count than for what each step does to the binding resource, which moves from branch-heavy CPU control, to batch-oriented feature pipelines, to memory-fed matrix parallelism (table 2). Dense matrix work meets the memory wall, the widening gap between compute throughput and off-chip memory bandwidth, whenever an operation performs too little arithmetic per byte it moves. That ratio is the arithmetic intensity introduced alongside the iron law; the forward-pass analysis later in this chapter measures it for the running network, and Performance Bounds develops it into a full performance bound.

↩︎ The memory wall and the physical reasons that off-chip bandwidth lags arithmetic are established in Physical Constraints on Deployment.

↪ The AI memory wall, the point at which added FLOP/s stops reducing runtime because data movement dominates, is developed in The AI memory wall.

Table 2: System Resource Tendencies: The illustrated implementations shift from control-oriented rules to structured feature pipelines and then to matrix-heavy neural computation. These are workload tendencies rather than requirements of every program in each paradigm.
System Aspect Traditional Programming ML with Features Deep Learning
Computation Often control-flow oriented Structured parallel ops Often matrix-parallel
Memory Access Workload dependent Commonly batch-oriented Large tensor working sets
Data Movement Program and input dependent Feature-pipeline movement Parameter and activation movement
Hardware Needs Commonly CPU-centric Often CPU with vector units Frequently accelerator-friendly
Resource Scaling Input and program dependent Descriptor and data driven Driven by width, batch, state, and reuse

Scale therefore has costs as well as gains. Larger models and training budgets turn arithmetic throughput, memory bandwidth, storage capacity, and communication into potential bottlenecks, and model size is not a decision rule. Choosing a model requires comparing candidates on representative deployment data and on the complete cost of training, serving, monitoring, and maintenance, with the uncertainty in both gains and costs included. The useful question is whether the measured gain from additional scale earns those system costs.

↪ How model size, training data, and compute trade off along a compute-optimal frontier is developed in The compute-optimal frontier.

Systems Perspective 5.1: When to use neural networks

Not every problem benefits from deep learning. Stage 1: Problem Definition established that a problem definition must require a learned system to improve on an existing baseline by more than its added cost. Table 3 lists the conditions under which a neural network tends to win that comparison, and table 4 the conditions under which a classical method tends to match it with less training, serving, and maintenance effort.

Table 3: Neural-Network Candidates: Conditions under which deep learning is likely to outperform classical methods.
Condition Evidence to seek Rationale
Representative data Training and validation cover deployment conditions Capacity cannot replace missing coverage
Exploitable structure Spatial, sequential, or hierarchical patterns Architecture can encode a useful prior
Baseline gap Simpler methods miss the required task-quality target Complexity buys a measured gain
Operational fit Gain survives latency, memory, and cost limits Offline accuracy alone is insufficient
Maintenance advantage Learned features reduce recurring manual updates Full-system maintenance becomes simpler
Table 4: Classical-Method Candidates: Conditions under which simpler models are likely to match or beat a neural network.
Condition Baseline to test Reason to prefer it
Limited labeled data Linear model or tree ensemble Lower variance and easier validation
Structured tabular inputs Gradient boosting or linear model Strong accuracy without learned features
Approximately linear signal Linear or additive model Transparent and inexpensive execution
Hard resource bound Rules or compact classical model Predictable latency, memory use, and energy demand
Direct auditability needed Constrained tree or linear model Decisions are easier to inspect

Systems insight: Establish a simple baseline before building a neural network, and retain the neural approach only when its measured benefit justifies the added system. The document-recognition history in section 5.6 shows why the comparison must include preprocessing, rejection policy, and the cost of human review rather than model accuracy alone.

5.2.3 Why backpropagation waited for systems

Every increase in a neural network’s size multiplies its forward operations, saved activations, gradient computations, and parameter updates, which is why backpropagation waited decades for hardware and data to catch up with the algorithm. Paul Werbos applied backpropagation3 to neural networks in 1974 (Werbos 1974), building on Seppo Linnainmaa’s 1970 work on automatic differentiation (Linnainmaa 1970), and Rumelhart, Hinton, and Williams showed in 1986 that hidden units could learn useful internal features (Rumelhart et al. 1986). That demonstration did not resolve the systems cost exposed by the digit classifier: the decades between early backpropagation work and widespread adoption required the maturation of parallel hardware, large datasets, weight initialization, non-saturating nonlinearities, and software frameworks. An algorithm can be viable in principle long before its surrounding system makes it useful in practice. The lesson does not run in reverse: a computationally expensive idea is not vindicated by expense alone, and it must be evaluated together with the data, software, hardware, and task regime that would make it useful.

3 Backpropagation: Short for “backward propagation of errors,” the algorithm uses the chain rule to compute how the loss is locally sensitive to millions of weights in one backward traversal. Its systems cost is memory rather than arithmetic, because the backward pass needs the forward-pass activations, which training must store alongside gradients and optimizer state, the several-times-larger footprint quantified in section 5.4.5.5.

Werbos, Paul. 1974. “Beyond Regression: New Tools for Prediction and Analysis in the Behavioral Sciences.” PhD thesis, Harvard University.
Linnainmaa, Seppo. 1970. “The Representation of the Cumulative Rounding Error of an Algorithm as a Taylor Expansion of the Local Rounding Errors.” Master's thesis, University of Helsinki.
Rumelhart, David E., Geoffrey E. Hinton, and Ronald J. Williams. 1986. “Learning Representations by Back-Propagating Errors.” Nature 323 (6088): 533–36. https://doi.org/10.1038/323533a0.

↩︎ How AlexNet, GPUs, and ImageNet ended the feature-engineering era, and why infrastructure became the next bottleneck, is established in The deep learning era and the infrastructure bottleneck.

Checkpoint 5.1: Understanding deep learning's emergence
Before turning to the primitives that set these costs, verify your understanding of why deep learning emerged when it did:

If any of these concepts remain unclear, review the relevant sections before continuing.

The digit classifier’s cost and the adoption lag lead to the same conclusion. What a network costs the machine is fixed by the primitives it is built from, and those primitives are the subject of the rest of this chapter.

Self-Check: Question
  1. A team replaces a hand-coded digit recognition system (\(\approx 100\) conditional comparisons, \(784\text{ bytes}\) of working state) with a \(784 \to 128 \to 64 \to 10\) MLP (\(\approx 109{,}184\text{ MACs}\), \(\approx 438\text{ KB}\) of weights) on the same MNIST input. Which systems consequence should they expect when deploying this new model on a commodity CPU?

    1. The workload becomes dominated by branch mispredictions because artificial neurons execute frequent if-then branching decisions.
    2. The workload transitions from branch-heavy scalar code to dense matrix arithmetic whose weight footprint exceeds L1 cache capacity, generating cache-level memory traffic absent in the rule-based system.
    3. Execution memory traffic drops to zero because the \(438\text{ KB}\) weight footprint fits entirely within standard CPU register files.
    4. The model executes without using arithmetic logic units (ALUs) because learned representations bypass hardware compute pipelines.
  2. A hardware vendor claims that increasing single-threaded CPU clock frequencies by \(5\times\) will eliminate the necessity of specialized accelerators (such as GPUs or TPUs) for deep neural networks. Based on the computational profile of neural networks, what is the strongest technical refutation of this claim?

    1. Deep learning is dominated by massive parallel matrix multiplications bounded by arithmetic throughput and memory bandwidth, which benefit from thousands of parallel SIMD/tensor units rather than higher scalar clock speeds.
    2. Higher CPU clock frequencies force the loss function to become non-convex, destabilizing gradient descent.
    3. Modern neural networks require asynchronous analog circuits that cannot be simulated on digital CPU cores.
    4. Increasing CPU clock frequencies reduces the numerical precision of floating-point registers to 4-bit integers.
  3. A computer vision team evaluates two approaches for a multi-class recognition task: (a) a handcrafted feature pipeline (e.g. HOG + SVM) and (b) an end-to-end convolutional neural network. Compare the systems engineering trade-offs between these two approaches when the product must scale from 2 initial categories to 50 diverse object categories.

  4. Explain the systems-level concept of the ‘algorithm-hardware adoption lag’ using the historical trajectory of backpropagation (Werbos 1974 / Rumelhart et al. 1986) and modern deep learning. Which surrounding factors had to mature before the algorithm achieved widespread practical viability?

  5. True or False: For a tabular dataset with 500 records and linear relationships between features and targets, deploying a deep neural network is generally superior to a linear regression model because deep networks inherently generalize better across all problem scales.

  6. Order the pattern-computing paradigms as the chapter presents their progression, from explicit logic to learned representations: (1) Deep learning with automatic hierarchical feature discovery on parallel accelerators, (2) Rule-based programming with explicit hand-authored logical branches, (3) Classical machine learning pairing hand-engineered feature extractors (e.g. HOG) with statistical classifiers.

See Answers →

5.3 Neural Network Fundamentals

Each of the 109,184 MACs that classify a single digit belongs to some neuron combining its inputs. Individually those operations are trivial. At network scale, a processor spends more time waiting for operands than computing whenever its memory system cannot supply them fast enough, and an accelerator such as a graphics processing unit (GPU) outruns a CPU on suitable neural workloads because it devotes silicon to wide arithmetic arrays and high-bandwidth memory rather than to branch prediction. The structure of the network primitives determines how data flows through that hardware and how memory demands scale during training and inference.

Those primitives (weighted sums, nonlinear activations, and gradient-based learning) anchor the feed-forward networks of this chapter and recur inside the larger architectures that later chapters introduce, which add operators and execution patterns this simple model does not contain. Parallelism and the memory wall, the pressures traced through the paradigm comparison, follow from that structure. Many simple units operate simultaneously on shared inputs, weights change during training, and layers compose low-level features into high-level ones. That structure begins with the artificial neuron.4 Understanding it plays the role for a neural network that understanding a single transistor plays for a processor.

4 Neuron: McCulloch and Pitts (1943) introduced a mathematical threshold model of nervous activity: inputs combine and an all-or-none output fires when a threshold is met. That logical neuron is an origin point for the artificial-neuron abstraction and for networks built from many simple units. Learned weights, deep hierarchies, and modern fused multiply-add (FMA) accelerator datapaths are later developments that turn this abstraction into the matrix-heavy workloads studied in this chapter.

McCulloch, Warren S., and Walter Pitts. 1943. “A Logical Calculus of the Ideas Immanent in Nervous Activity.” The Bulletin of Mathematical Biophysics 5 (4): 115–33. https://doi.org/10.1007/bf02478259.

5.3.1 One neuron

To test whether a \(28{\times}28\) image contains a particular stroke, a single computing unit must weigh all 784 pixel intensities, sum the evidence, and decide how strongly to fire. That basic unit of neural computation, the artificial neuron (or node), began as a simplified mathematical model of nervous activity (McCulloch and Pitts 1943) before digital implementations turned it into a standard arithmetic primitive. Figure 4 sets the biological cell and its mathematical counterpart side by side. The left panel draws a biological cell, with branching dendrites that receive signals, a cell body that holds the nucleus, and an axon that carries the output away. The right panel draws the mathematical model, in which the inputs \(\LayerInputComponent_1\), \(\LayerInputComponent_2\), and onward, plus a constant input of one that carries the bias, flow along weighted edges into a node that first forms a linear sum \(\NeuronPreactivation\) and then applies an activation function \(\ActivationFunction\) to emit the output \(\NetworkOutput\). The column of labels between the panels pairs each biological structure with its arithmetic counterpart: dendrites with inputs, synapses with weights, the soma (cell body) with the linear sum, and axon firing with the activation.
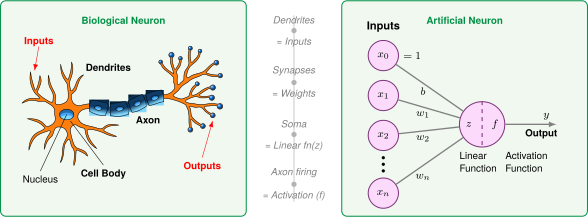
Figure 4: Biological-to-Artificial Neuron Mapping: Each biological structure on the left has an arithmetic counterpart on the right. Read the mapping as an abstraction rather than a resemblance claim, since it keeps only what reduces to arithmetic and discards the electrochemistry that produced the behavior.

Read from left to right, the right panel of figure 4 carries one signal through four stages, and each stage takes its name from one label pair in the column between the panels:

  1. Input Reception (Dendrites → \(\LayerInputComponent_1, \LayerInputComponent_2, \dots, \LayerInputComponent_n\)): The column of circles on the left of the panel is the vector of input features \(\InputFeatureVector\) that the artificial neuron receives. In MNIST digit recognition, these represent pixel intensities. The dendrite analogy captures reception of many signals without claiming biological equivalence.
  2. Weighted Modulation (Synapses → \(\ModelWeight_1, \ModelWeight_2, \dots, \ModelWeight_n\)): Each input is multiplied by a learnable weight \(\ModelWeight_i\), just as synaptic strengths modulate biological signals. These weights act as “gain” controls, determining how much influence each feature has on the final decision. A bias term \(\NeuronBias\) (shown as the top input \(\LayerInputComponent_0 = 1\) in figure 4) shifts the activation threshold. Across a network, learned behavior is distributed over many such parameters rather than stored in one weight.
  3. Signal Aggregation (Cell Body → Linear Function \(\NeuronPreactivation\)): The left half of the split node, labeled \(\NeuronPreactivation\), integrates the weighted signals, producing a single scalar value \(\NeuronPreactivation= \sum (\LayerInputComponent_i \cdot \ModelWeight_i) + \NeuronBias\). This mirrors how a biological cell body sums incoming electrochemical signals to determine whether the neuron has received enough evidence for a particular pattern.
  4. Nonlinear Activation (Axon → Activation Function \(\ActivationFunction\)): In the right half of the node, labeled \(\ActivationFunction\), the aggregated signal passes through an activation function \(\ActivationFunction(\NeuronPreactivation)\) and leaves along the output arrow, producing the activation output \(\NeuronActivation= \ActivationFunction(\NeuronPreactivation)\) (often denoted \(\NetworkOutput\)). This mirrors the axon’s all-or-nothing firing decision, since the nonlinearity determines whether the neuron “fires” a signal to the next layer. Unlike the biological case, \(\ActivationFunction\) can produce graded outputs (ReLU, for example, passes positive values through and zeroes negatives), but the principle of thresholding followed by propagation is the same.

For the machine, one neuron costs \(\LayerInputWidth\) MAC5 operations. A direct scalar evaluation loads \(\LayerInputWidth\) inputs, \(\LayerInputWidth\) weights, and a bias before writing one output, so without reuse it moves about two values per MAC. Batched and tiled kernels reuse inputs and weights across many neuron evaluations and cut that traffic per MAC, which is why performance at network scale depends on how well the implementation reuses data as much as on how many operations it performs. Once neurons are composed into a network, three constraints appear that a single unit hides. Inside any one layer, neurons can evaluate in parallel, yet moving their parameters and activations across memory often limits throughput before arithmetic capacity runs out; across layers, layer \(\LayerIndex+1\) cannot start until layer \(\LayerIndex\) finishes, placing a sequential floor under end-to-end latency. Numerical precision cuts across both limits, because narrower formats move fewer bytes and run on denser arithmetic units, provided task quality survives the search for minimum viable precision that Model Compression develops. The perceptron formalization in section 5.3.2.1 turns the four stages into the equations that this accounting counts.

5 MAC (multiply-accumulate): Hardware data sheets report fused multiply-add throughput in FLOP/s, so a quoted FLOP/s rate is twice the corresponding MAC/s rate. Layer and batch choices also create activation, communication, and data-movement costs, so MAC count is necessary but not sufficient for a systems budget.

5.3.2 From neurons to layers

Composing neurons into a network turns one neuron’s cost into a network’s, and each architectural choice, from how neurons connect to how layers are organized, fixes a computational pattern that hardware must then execute. The running network of Example 5.1 is built from exactly these choices, and the subsections below derive its parameter and operation counts one decision at a time, starting with the weighted sum inside each unit.

The perceptron’s weighted sum

The computational machinery within each dense layer is the perceptron,6 which Rosenblatt introduced as a learning form of the artificial neuron (Rosenblatt 1958). Its signal path (inputs, weights, bias, aggregation, activation) is the one section 5.3.1 traced through its biological origins. What remains is to formalize that path mathematically, because this repeated operation becomes the layer-level kernel that hardware executes. In the MNIST network, a first-layer unit combines all 784 pixel intensities into one activation that may respond to a learned pattern, such as a vertical edge shared by “one” and “seven.” Inside one unit (figure 5), input features \(\LayerInputComponent_i\) travel along weighted channels \(\NeuronConnectionWeight\) and accumulate into a scalar sum with bias \(\NeuronBias_j\), and the resulting linear score \(\NeuronPreactivation_j\) passes through an activation \(\ActivationFunction\) to produce output \(\PredictedOutputComponent\). Different neurons repeat the same structure with different learned weights, allowing one layer to test many patterns against the same input.

6 Perceptron: A machine built to execute a learning algorithm, directly linking hardware and software from the start. A single linear-threshold layer cannot represent nonlinearly separable functions such as XOR, regardless of additional input hardware (Minsky and Papert 1969). Multilayer nonlinear networks expand the representable function class, but they also introduce the training and systems costs developed in this chapter.

Minsky, Marvin, and Seymour A. Papert. 1969. Perceptrons: An Introduction to Computational Geometry. The MIT Press.
Rosenblatt, Frank. 1958. “The Perceptron: A Probabilistic Model for Information Storage and Organization in the Brain.” Psychological Review 65 (6): 386–408. https://doi.org/10.1037/h0042519.
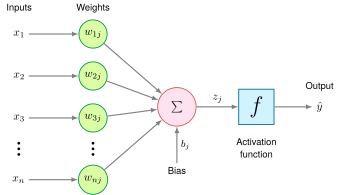
Figure 5: Perceptron Architecture: Inputs enter on the left, each scaled by its own weight, and the weighted products plus a bias meet at the summation node before a single activation function produces the output. The multiplies and the accumulation along this path are the per-neuron unit of work that the chapter’s layer-cost calculations multiply out.

Each input \(\LayerInputComponent_i\) has a corresponding weight \(\NeuronConnectionWeight\), and the perceptron multiplies each input by its matching weight. The intermediate output, \(\NeuronPreactivation_j\), is computed as the weighted sum of inputs in equation 1: \[ \NeuronPreactivation_j = \sum_i (\LayerInputComponent_i \cdot \NeuronConnectionWeight) \tag{1}\]

Here, \(\NeuronIndex\) identifies the receiving neuron once perceptrons are assembled into a layer, and the sum runs over all input indices \(\InputFeatureIndex\). In plain terms, each input feature is scaled by how important it is (its weight), and the results are summed into a single score. This is the dot product of two vectors.

A bias term \(\NeuronBias_j\) shifts the linear output up or down, giving the model additional flexibility to fit the data. Thus, the intermediate linear combination computed by the perceptron including the bias becomes equation 2: \[ \NeuronPreactivation_j = \sum_i (\LayerInputComponent_i \cdot \NeuronConnectionWeight) + \NeuronBias_j \tag{2}\]

With this weighted sum in hand, a suitable output activation and loss can support regression or classification. A binary linear-threshold classifier selects one of two classes around a threshold; multiclass networks instead produce several scores and commonly normalize them into probabilities with softmax, an output function developed with the other activation functions below.

The formalization turns the neuron’s cost into a layer’s. A dense layer of \(\LayerOutputWidth\) neurons repeats the weighted sum \(\LayerOutputWidth\) times, so its arithmetic cost is \(\LayerInputWidth \times \LayerOutputWidth\) MACs, exactly the matrix multiplication \(\InputFeatureVector\WeightMatrix\) that hardware must execute, and the form in which the rest of this chapter counts work. The dot product is the operation that accelerators are built to execute at maximum throughput, which is why neural network performance is quoted in MACs or FLOPs completed per second; how those machines are organized around it is developed in Matrix operations in neural networks. A weighted sum alone, however, can only draw straight boundaries, and the activation applied to it decides what the layer can represent.

Nonlinear activation functions

Without a nonlinearity between layers, a stack of linear weight matrices collapses algebraically into a single linear transformation and can only draw straight decision boundaries, no matter how many intermediate matrices the machine evaluates. Activation functions break that collapse by converting each neuron’s linear weighted sum into a nonlinear output, making them the point where expressiveness, gradient flow, and hardware cost meet. Applying an activation \(\ActivationFunction\) to the weighted sum of equation 2 yields the generic artificial-neuron computation in equation 3: \[ \PredictedOutputComponent_j = \ActivationFunction(\NeuronPreactivation_j) = \ActivationFunction\left(\sum_i (\LayerInputComponent_i \cdot \NeuronConnectionWeight) + \NeuronBias_j\right) \tag{3}\]

In figure 6, a network without activation functions is constrained to a straight decision boundary (left panel) that misclassifies overlapping point clusters, whereas nonlinear activations allow curved boundaries (right panel) that separate the two classes cleanly. The plot illustrates representational capacity rather than an optimization guarantee; training dynamics and sample coverage still govern whether optimization finds that boundary.
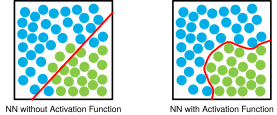
Figure 6: Linear vs. Nonlinear Decision Boundaries: Two scatter plots compare the decision boundary a network draws on the same points with and without an activation function.

XOR is the classic function that no single weighted sum can compute, and its four input pairs show why a hidden nonlinear layer changes what a network can represent.

Example 5.2: Building intuition: The XOR problem
Consider a network learning the XOR function, a classic problem that requires nonlinearity. With inputs \(\LayerInputComponent_1\) and \(\LayerInputComponent_2\) that can be 0 or 1, XOR outputs 1 when inputs differ and 0 when they are the same.

Setup: Two inputs → two hidden neurons → one output

Example: With hidden units \(\HiddenUnitOutput_1 = \text{ReLU}(\LayerInputComponent_1 + \LayerInputComponent_2)\) and \(\HiddenUnitOutput_2 = \text{ReLU}(\LayerInputComponent_1 + \LayerInputComponent_2 - 1)\), the output \(\NetworkOutput= \HiddenUnitOutput_1 - 2\HiddenUnitOutput_2\) gives 0, 1, 1, 0 for inputs \((0,0)\), \((0,1)\), \((1,0)\), \((1,1)\). The input \((1,1)\) drives both hidden units, and the second one cancels the first. No single weighted sum of \(\LayerInputComponent_1\) and \(\LayerInputComponent_2\) can produce that pattern.

Systems insight: Hidden layers do not merely add capacity; they change the class of functions the system can represent. XOR, which no single-layer perceptron can compute (Minsky and Papert 1969), is the small example that makes depth a structural requirement rather than a decorative design choice.

7 Universal approximation theorem: Under conditions on the activation, target function, compact domain, and approximation tolerance, a sufficiently wide single-hidden-layer network can approximate the target arbitrarily well (Cybenko 1989; Hornik et al. 1989). This existence result is nonconstructive: it does not specify how to find the weights or how many neurons practical training will require. Why depth can nonetheless beat width is the subject of section 5.3.5.

Cybenko, George. 1989. “Approximation by Superpositions of a Sigmoidal Function.” Mathematics of Control, Signals, and Systems 2 (4): 303–14. https://doi.org/10.1007/bf02551274.
Hornik, Kurt, Maxwell Stinchcombe, and Halbert White. 1989. “Multilayer Feedforward Networks Are Universal Approximators.” Neural Networks 2 (5): 359–66. https://doi.org/10.1016/0893-6080(89)90020-8.

The XOR network is the smallest case of a general result. The universal approximation theorem7 establishes that sufficiently wide networks with suitable activation functions can approximate broad classes of functions arbitrarily well. The theorem, however, states a pure existence result under the assumption of unlimited width; it says nothing about the accelerator executing the computation. ML systems impose hard limits on both dimensions of the width-vs.-depth trade-off. A single hidden layer wide enough to approximate a complex function requires parameter storage and activation memory that can exhaust the accelerator’s device memory (VRAM) entirely, and a network too deep to fit its activations in memory stalls the backward pass on the same constraint. The engineering problem is therefore not whether a network of sufficient width or depth exists, but whether it fits within the memory and bandwidth envelope of the target hardware.

Comparing activation functions requires one idea from training, which section 5.4 develops fully. Training adjusts each weight by its gradient, a number measuring how much the prediction error would change if that weight moved slightly. That signal travels backward through the network, a pass called backpropagation, and is multiplied at each layer by the activation’s slope, so an activation whose slope is near zero passes almost no learning signal to the layers before it.

The choice of activation function therefore affects both learning and computational efficiency. ReLU8 (\(\max(0, \NeuronPreactivation)\)) became a common hidden-layer activation for feed-forward networks because it is inexpensive, has local derivative one for positive inputs, and can produce sparse activations (Nair and Hinton 2010; Glorot et al. 2011). Earlier differentiable deep networks often used sigmoid or tanh. Their smooth S-curves saturate, a failure the sigmoid discussion below develops. That contrast is not a simple ranking: sigmoid remains appropriate for some binary outputs, tanh remains useful when bounded zero-centered activations are desired, and modern architectures use additional activation families. The relevant design question is which function supplies the required output semantics and gradient behavior at an acceptable execution cost. Figure 7 charts the response curves and output ranges of three standard element-wise nonlinearities alongside the vector-level softmax function, contrasting their saturation regimes.

8 ReLU (rectified linear unit): ReLU’s cheap comparison-and-select evaluation and its non-saturating positive branch made deep networks markedly faster to train; in the AlexNet paper, a four-layer convolutional network reached 25 percent training error on CIFAR-10 six times sooner with ReLU than with tanh (Krizhevsky et al. 2012).

Krizhevsky, Alex, Ilya Sutskever, and Geoffrey E. Hinton. 2012. “ImageNet Classification with Deep Convolutional Neural Networks.” Advances in Neural Information Processing Systems (NeurIPS) 25.
Nair, Vinod, and Geoffrey E. Hinton. 2010. “Rectified Linear Units Improve Restricted Boltzmann Machines.” Proceedings of the 27th International Conference on Machine Learning (ICML-10), 807–14.
Glorot, Xavier, Antoine Bordes, and Yoshua Bengio. 2011. Deep Sparse Rectifier Neural Networks. International Conference on Artificial Intelligence and Statistics (AISTATS).
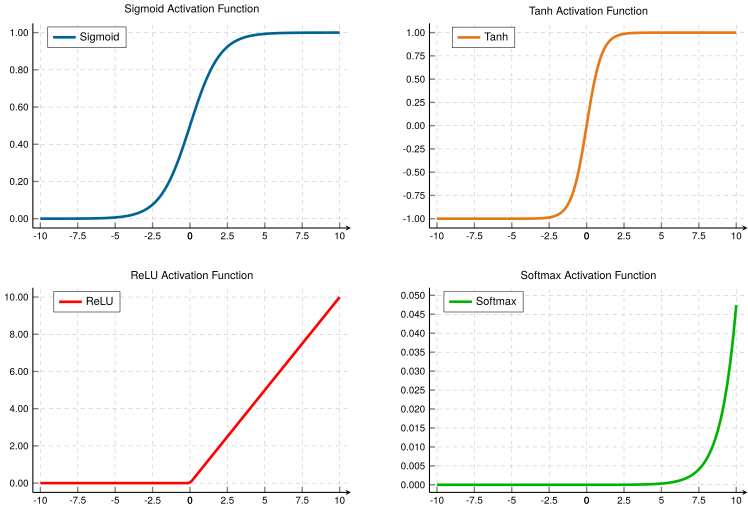
Figure 7: Common Activation Functions: Four panels plot nonlinear activation functions with their output ranges. Sigmoid maps inputs to \((0,1)\) with smooth gradients, tanh provides zero-centered outputs in \((-1,1)\), and ReLU outputs zero for negative inputs. Softmax (bottom-right) shows one component of a 3-element vector while the other two logits are fixed at 13 and 0. Its magnified y-axis (roughly \(0\) to \(0.05\)) is not comparable to the other panels, and it shows only one component of a vector whose outputs are interdependent and sum to 1.
Sigmoid

The logistic sigmoid function9 squashes continuous inputs onto the open interval \((0,1)\) (equation 4): \[ \SigmoidFunction(\NeuronPreactivation) = \frac{1}{1 + e^{-\NeuronPreactivation}} \tag{4}\]

9 Sigmoid: From Greek sigma + eidos (“sigma-shaped”), referring to the S-curve that maps inputs to the bounded (0, 1) range. The mapping requires an exponential approximation, commonly implemented through specialized instructions, lookup tables, or polynomial methods. It is generally more expensive than ReLU’s comparison-and-selection operation, although the measured gap depends on precision, vectorization, and hardware. ReLU’s adoption reflected both easier gradient flow on its positive branch and cheaper execution.

The S-shaped curve maps logits, the raw unnormalized scores a layer produces, to \((0,1)\), so sigmoid can parameterize a binary probability. It approaches one for large positive inputs and zero for large negative inputs. Sigmoid is smooth and differentiable everywhere. Gradient-based learning does not require that smoothness; ReLU, introduced below, has a corner at zero, and implementations simply assign it a slope there.

Sigmoid’s main limitation is saturation. For inputs with large absolute values (far from zero), its gradient becomes extremely small, a phenomenon called the vanishing gradient problem (Bengio et al. 1994). Even at its peak, sigmoid’s derivative is only 0.25, so each sigmoid layer can shrink the activation-derivative part of the gradient by at least a factor of four. During backpropagation these small activation derivatives multiply with weight-dependent factors across layers, the compounding that the chapter’s opening footnote evaluated over 20 layers. Repeated saturation can make early-layer gradients and weight updates negligibly small, preventing useful learning along those paths.

Bengio, Yoshua, Patrice Simard, and Paolo Frasconi. 1994. “Learning Long-Term Dependencies with Gradient Descent Is Difficult.” IEEE Transactions on Neural Networks 5 (2): 157–66. https://doi.org/10.1109/72.279181.
Tanh

The hyperbolic tangent10 centers output activations around zero over the interval \((-1,1)\) (equation 5): \[ \tanh(\NeuronPreactivation) = \frac{e^\NeuronPreactivation- e^{-\NeuronPreactivation}}{e^\NeuronPreactivation+ e^{-\NeuronPreactivation}} \tag{5}\]

10 Tanh (hyperbolic tangent): By centering its output range on zero, tanh can reduce the correlated-update behavior associated with all-positive activations. Its computational cost is similar to sigmoid because it also depends on exponential approximations, while its saturation behavior still permits vanishing gradients.

Tanh produces an S-shaped curve similar to sigmoid but centered at zero: negative inputs map to negative outputs and positive inputs to positive outputs, a symmetry that balances gradient flow during training and often yields faster convergence than sigmoid. Like sigmoid, tanh is smooth and differentiable everywhere, and it saturates near -1 and 1, so it shares the vanishing gradient problem for inputs with large magnitudes; even so, its zero-centered outputs make it preferable to sigmoid in recurrent neural networks, which reapply the same layer at every step of a sequence and must keep activations balanced across time steps. Both S-curves therefore carry two costs, saturation during training and an exponential evaluation in hardware, whereas ReLU removes saturation for positive inputs and replaces the exponential with a comparison.

ReLU

ReLU sets negative values to zero while maintaining linear identity for positive inputs (equation 6): \[ \text{ReLU}(\NeuronPreactivation) = \max(0, \NeuronPreactivation) = \begin{cases} \NeuronPreactivation& \text{if } \NeuronPreactivation> 0 \\ 0 & \text{if } \NeuronPreactivation\leq 0 \end{cases} \tag{6}\]

ReLU’s characteristic shape, a straight line for positive inputs and zero for negative inputs, provides three advantages. First, its local derivative is one for positive inputs, avoiding activation saturation on that branch; the complete network gradient can still shrink or grow through weights and other operations. Second, ReLU introduces deterministic activation sparsity by setting negative values to zero. Third, ReLU uses a comparison and selection, output = (input > 0) ? input : 0, rather than an exponential approximation. These are local properties of the operator, while end-to-end performance depends on how it is fused with neighboring work.

ReLU is not without drawbacks. The dying ReLU problem occurs when neurons become stuck in the inactive state, permanently outputting zero and ceasing to learn. If a neuron’s weights evolve during training such that the preactivation \(\NeuronPreactivation= \InputFeatureVector\WeightVector+ \NeuronBias\) is consistently negative across all training examples, the neuron outputs zero for every input. Since ReLU’s gradient is also zero for negative inputs, no gradient flows back through this neuron during backpropagation. The weights cannot update, and the neuron remains dead. This can happen when the learning rate, the step size that scales each weight update, is large enough to push weights into unfavorable regions. Careful initialization (He et al. 2015), moderate learning rates, leaky ReLU variants, and normalization layers11 help mitigate dying ReLUs by keeping preactivation distributions well scaled.

11 Batch normalization: Normalization layers (Ioffe and Szegedy 2015) stabilize intermediate activations across training batches, permitting higher learning rates and reducing the risk of dying ReLUs. Normalization and activation stability examines the trade-offs among normalization variants, and Compression-specific fusion shows how batch normalization folds into adjacent weights for inference.

Ioffe, Sergey, and Christian Szegedy. 2015. “Batch Normalization: Accelerating Deep Network Training by Reducing Internal Covariate Shift.” Proceedings of the 32nd International Conference on Machine Learning (ICML) 37: 448–56.
Softmax

Unlike element-wise activation functions that operate independently on each value, softmax12 is a vector-level function that considers all values together to produce a probability distribution. In simple classifiers, softmax is commonly used in the output layer rather than as an element-wise hidden activation; it also normalizes learned importance-score vectors in attention architectures. The softmax function is defined in equation 7: \[ \text{softmax}(\NeuronPreactivation_i) = \frac{e^{\NeuronPreactivation_i}}{\sum_{j=1}^\ClassCount e^{\NeuronPreactivation_j}} \tag{7}\]

12 Softmax: The name, coined by Bridle (1990), reflects its role as a “soft” or differentiable version of argmax, a function that must evaluate an entire vector to find its maximum value. This vector-wise operation is not used as a drop-in replacement for element-wise nonlinearities such as ReLU, but it is central whenever a model must normalize a vector of scores, including classification heads and attention layers. Direct exponentiation can overflow in 32-bit floating point, so stable implementations subtract the largest logit first (section 5.4.3.3).

Bridle, John S. 1990. “Probabilistic Interpretation of Feedforward Classification Network Outputs, with Relationships to Statistical Pattern Recognition.” In Neurocomputing: Algorithms, Architectures and Applications, edited by Françoise Fogelman Soulié and Jeanny Hérault, vol. 68. NATO ASI Series f: Computer and Systems Sciences. Springer. https://doi.org/10.1007/978-3-642-76153-9_28.

13 Logits: In multiclass neural classifiers, logits are unnormalized output scores. Score differences correspond to log probability ratios after softmax, while an individual multiclass logit is not itself a calibrated log-odds quantity. Because argmax over logits and argmax over softmax probabilities select the same class, inference can skip softmax when only the top class is needed.

For a vector of \(\ClassCount\) values (often called logits13), softmax transforms arbitrary real-valued scores into \(\ClassCount\) normalized predicted probabilities that sum to 1, although those values are not necessarily calibrated confidence estimates. As plotted in the bottom-right panel of figure 7, individual softmax components grow exponentially across logit values while the denominator couples all vector elements so that the class with the largest logit receives the highest probability. Because this mapping from logits to probabilities is differentiable, gradients flow cleanly back through softmax during training, and combining softmax with cross-entropy loss (section 5.4.3) yields simple gradient expressions that guide learning effectively.

Activation choice also carries a silicon cost, a transistor tax paid in circuit complexity, area, and switching energy; a ReLU datapath needs only a sign-bit comparator and a multiplexer, roughly 50 transistor equivalents, whereas an exponential approximation for sigmoid or tanh is modeled here as a stylized budget of 2,500 transistor equivalents, 50× the comparator, an order-of-magnitude teaching ratio rather than a constant across manufacturing nodes. Logic area is only half the cost, because an element-wise activation run as its own kernel is limited by memory traffic rather than arithmetic, a gap the forward-pass analysis later quantifies, so compilers fuse it into the preceding matrix multiplication, and ReLU’s backward pass needs only one bit per unit recording whether the unit was active. A dead ReLU unit still occupies weight memory and still costs MACs on every inference while contributing nothing to the output, and ReLU’s zeros save no work in a dense kernel unless sparse hardware or routines exploit them. One neuron is now complete, and the next question is how many of them run side by side.
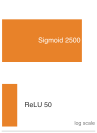
Log-scale ladder of two orange bars: a long sigmoid bar labeled 2,500 above a short ReLU bar labeled 50, with a dimension bracket between the two bar ends labeled 50×.

Sigmoid’s exponential datapath dwarfs ReLU in transistor-equivalents (illustrative).

Layers and connections

Neurons run side by side in layers, collections of units that execute in parallel across shared inputs, and the power of neural networks comes from that organization rather than from any single unit. An input layer ingests raw feature tensors; one or more hidden layers transform those representations through successive matrix multiplications and nonlinear activations; and an output layer emits task-specific predictions or decision logits.

In the feedforward schematic of figure 8, the task fixes only the two ends. The input layer’s width matches the four input features and the output layer’s width matches the two predictions. The hidden layers between them can widen and narrow freely, which is why hidden width is a design decision rather than a property of the data. Each hidden layer applies a parameterized linear transformation followed by an element-wise nonlinearity, progressively constructing higher-level abstractions from raw input signals.
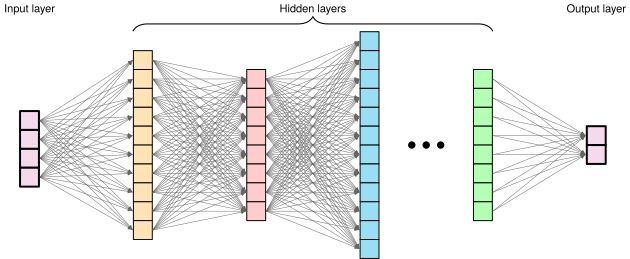
Figure 8: Layered Network Architecture: Deep neural networks transform data through successive layers, enabling the extraction of increasingly complex features and patterns. Each layer applies nonlinear transformations to the outputs of the previous layer, ultimately mapping raw inputs to desired outputs.

As data flows through the network, it is transformed at each layer to extract meaningful patterns. Each layer applies the neuron’s weighted sum and activation in parallel across all its neurons, and its outputs become the next layer’s inputs. Simple features detected in early layers combine into increasingly complex patterns in deeper layers.

On the machine, a layer is one matrix multiplication over all of its neurons at once, and the boundary between layers is where data moves and waits. Each layer writes its output as an activation tensor that the next layer must read, inference can discard that tensor once the next layer has consumed it, and training must keep it until the backward pass. The next layer cannot start until that tensor exists, which is the source of the latency floor that no amount of parallel hardware inside a layer removes. Figure 9 traces that translation in three steps. One neuron is a dot product of \(\LayerInputWidth\) MACs; stacking a layer’s neurons and a batch of \(\BatchSize\) examples (inputs processed together in one pass) turns those dot products into one matrix multiply of \(\BatchSize\cdot\PreviousLayerWidth\cdot\CurrentLayerWidth\) MACs (for the first MNIST layer at batch 32, \((32{\times}784)\cdot(784{\times}128)\)); and the hardware executes that multiply by holding a tile of weights in an array of multiply-accumulate units while rows of inputs stream past, so each weight fetched from memory serves every example in the batch. What each of those multiplications reads besides the activations is the layer’s parameters.
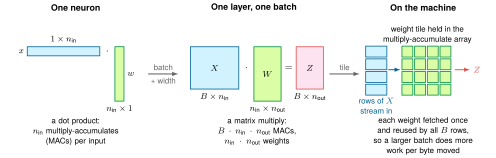
Figure 9: From Neuron to Machine: One neuron is a dot product between an input row and a weight column. A layer applied to a batch stacks those dot products into one matrix multiply whose cost is the product of batch size, input width, and output width. On an accelerator, a tile of the weight matrix stays inside an array of multiply-accumulate units while input rows stream through, so the batch, not the neuron, sets how much arithmetic each fetched weight pays for.

5.3.3 Parameters

Each of those multiplications reads the layer’s learnable parameters,14 its weights and biases, alongside the incoming activations. The parameters decide which transformation a layer applies, and their organization fixes both what the network can learn and how many bytes every pass must move.

14 Parameter memory cost: Parameter count is a misleading proxy for memory importance. The normalization layers that Normalization and activation stability introduces, for example, add a few learned scale and shift parameters per layer that barely affect byte budgets but can strongly affect model behavior when training choices change. Conversely, the bulk of parameters in dense weight matrices require extra state during training: gradients plus optimizer bookkeeping beyond the stored weights themselves. A model that fits in memory for inference may therefore require several times more memory for training, a cost quantified later in the training memory budget.

Weight matrices

In a dense layer with \(\LayerInputWidth\) input features and \(\LayerOutputWidth\) neurons, the weights form a matrix \(\WeightMatrix\in \mathbb{R}^{\LayerInputWidth \times \LayerOutputWidth}\) whose column \(\NeuronIndex\) holds neuron \(\NeuronIndex\)’s weights, so the layer computes all \(\LayerOutputWidth\) preactivations as the single product in equation 8: \[ \PreactivationVector= \InputFeatureVector\WeightMatrix+ \BiasVector \tag{8}\]

The canonical case studied here connects each neuron in a layer to every neuron in the previous layer, forming a “dense” or “fully connected” layer. This pattern allows each neuron to use all features from the previous layer. Fully connected layers establish the mathematical principles needed here, while alternative connectivity patterns exploit structure in the data and can reduce work or improve statistical efficiency.

Figure 10 details this dense interconnect topology on a concrete two-layer network (\(3 \to 4 \to 2\) units). Layer counts in this chapter count layers of weights, not layers of units, so this network has two and the MNIST network (\(784 \to 128 \to 64 \to 10\)) has three. The figure labels every scalar weight \(\NeuronConnectionWeight\) and layer bias \(\NeuronBias_j\) alongside intermediate node activations. Reading the incoming edges for any single destination neuron isolates one column of the weight matrix, while evaluating all destinations in parallel forms the complete matrix-vector multiplication. The numerical values illustrate parameter placement rather than an active inference pass; the essential systems property is the matrix dimension. For layers of widths \((\LayerWidth_0, \LayerWidth_1, \LayerWidth_2)\), with \(\LayerWidth_0\) the input width, the weight matrices span \(\WeightMatrix^{(1)} \in \mathbb{R}^{\LayerWidth_0 \times \LayerWidth_1}\) and \(\WeightMatrix^{(2)} \in \mathbb{R}^{\LayerWidth_1 \times \LayerWidth_2}\), requiring \(\LayerWidth_0\LayerWidth_1+\LayerWidth_1\LayerWidth_2\) weights before biases.
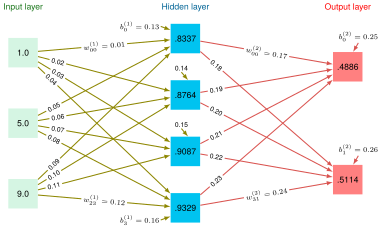
Figure 10: Fully Connected Layers: A two-layer network (three layers of units) connects every neuron to all neurons in the preceding layer. Labeled edges and nodes illustrate the organization of weights, biases, and activations; they are not a worked numerical forward pass.

These products account for most of the work in a dense feed-forward network; whether they are compute bound or memory bound depends on their dimensions, batch size, precision, implementation, and target hardware. The layer looks elementary, yet the same dense layer is the feed-forward block inside every transformer layer and the towers of the deep learning recommendation model (DLRM), so the arithmetic counted here is the arithmetic those lighthouses spend. A transformer layer whose feed-forward block widens to four times the model width \(\HiddenDimension\) holds \(8\HiddenDimension^2\) feed-forward weights against \(4\HiddenDimension^2\) in its attention projections (the four square weight matrices that prepare the layer’s attention inputs and combine its outputs), so the feed-forward block holds 67 percent of the layer’s weights; in the GPT-2 lighthouse, with \(\HiddenDimension\) = 1,600, that is about 20.5M of each layer’s 30.7M weights. Network Architectures develops both architectures in full.

Bias terms

Alongside its column of weights, each neuron in a layer carries one more parameter, a bias term15. For a layer with \(\LayerOutputWidth\) neurons, these parameters form a vector \(\BiasVector\in \mathbb{R}^{\LayerOutputWidth}\) added to the weighted sum in equation 8: while weights determine the relative importance of inputs, each entry of \(\BiasVector\) shifts its neuron’s activation threshold independently at the cost of one addition per output value. The arithmetic is negligible, but its placement is not: run as a separate step, the bias addition would read the layer’s entire output tensor from memory and write it back for one addition per value, so optimized libraries apply it, together with the activation, while each output tile is still on chip at the end of the matrix multiply.

15 Bias terms: Biases add one parameter per neuron, compared with \(\LayerInputWidth\) weights for a neuron with \(\LayerInputWidth\) inputs, so they account for \(1/(\LayerInputWidth+1)\) of that layer’s parameters. Their model-wide share and effect on accuracy depend on layer widths, architecture, and normalization. Some modern architectures omit biases in layers followed by batch normalization because the normalization transform includes a learned shift.

The organization of weights and biases across a feed-forward network follows a systematic pattern. For each parameterized affine layer \(\LayerIndex\), three components define its computation; the weights and biases are learned, while the activation function is usually chosen by the designer:

  • A weight matrix \(\WeightMatrix^{(\LayerIndex)}\)
  • A bias vector \(\BiasVector^{(\LayerIndex)}\)
  • An activation function \(\ActivationFunction^{(\LayerIndex)}\)

This yields the complete layer computation in equation 9: \[ \ActivationVector^{(\LayerIndex)} = \ActivationFunction^{(\LayerIndex)}(\PreactivationVector^{(\LayerIndex)}) = \ActivationFunction^{(\LayerIndex)}(\ActivationVector^{(\LayerIndex-1)}\WeightMatrix^{(\LayerIndex)} + \BiasVector^{(\LayerIndex)}) \tag{9}\]

Here, \(\ActivationVector^{(\LayerIndex)}\) (written as \(\ActivationMatrix^{(\LayerIndex)}\) for batches) represents the layer’s activation output. The row-vector convention is adopted throughout: each sample is a row, and the weight matrix \(\WeightMatrix^{(\LayerIndex)} \in \mathbb{R}^{\PreviousLayerWidth \times \CurrentLayerWidth}\) maps from the previous layer’s width to the current layer’s width. With equation 9, one layer is fully specified, and what remains is choosing the layers themselves: how many, how wide, and how connected.

5.3.4 Choosing a topology

A single layer of neurons cannot even compute XOR (Example 5.2), yet adding or widening hidden layers to gain capacity immediately multiplies the parameters and activations the machine must store and move. Network topology, how neurons organize into layers and connect across them, fixes both what the network can represent and what it costs to run. The chapter’s MNIST digit recognizer shows how problem structure fixes the input and output dimensions while leaving the hidden layers as a systems design choice.

Feedforward network architecture

Applying the three-layer architecture to MNIST reveals how data characteristics and task requirements constrain network design. The dual-panel layout in figure 11 contrasts the conceptual and physical representations of this input mapping: panel (a) sets a \(28{\times}28\) pixel grayscale image of digit 7 beside the input units and ten class outputs, while panel (b) illustrates the physical flattening of those 784 pixels into a contiguous one-dimensional column vector before feeding the input layer. Fully connected layers assign an independent weight to every coordinate of this 784-element vector, flattening out spatial coordinates and discarding pixel adjacency. Convolutional architectures instead encode spatial locality directly. That choice is an inductive bias, a built-in structural assumption about the data (here, that nearby pixels matter together) which restricts the functions a model can learn toward those expected to be useful (Mitchell 1980). The fully connected network makes almost no such assumption, so it must learn from data the structure that a stronger bias would supply, and that learning requires more parameters.

Mitchell, Tom M. 1980. The Need for Biases in Learning Generalizations. CBM-TR-117. Rutgers University, Department of Computer Science.

↪ How spatial locality and weight sharing replace the parameter overhead of fully connected layers is developed as a spatial inductive bias in CNNs: Spatial Pattern Processing.

The two ends of the network are fixed before any architecture search begins: the data format sets the input layer’s width, so a 28 by 28 pixel image requires 784 input neurons (one per pixel intensity in the flattened vector), while the task sets the output layer’s width, so 10-class digit recognition provisions 10 output neurons (one for each digit 0–9) whose logits a softmax can convert into predicted class probabilities. Between those fixed endpoints, the number of hidden layers and their respective widths remain open engineering choices. Adding layers increases the network’s depth so that it can compose more abstract features through successive transformations, whereas widening a layer expands its capacity to represent distinct features at that level of abstraction.

Widening both hidden layers from 100 to 1000 neurons, comparing a \(784 \to 100 \to 100 \to 10\) network with a \(784 \to 1000 \to 1000 \to 10\) network, increases parameters from ~89.6K to ~1.8M (~358 KB vs. ~7 MB in FP32). Whether the wider network improves accuracy requires training and evaluation; the storage increase alone already matters for mobile deployment budgets.

Figure 11: MNIST Network Topology: Both panels draw the same network; only the form of the input changes, from a two-dimensional image in panel (a) to the flattened vector the input layer actually receives in panel (b).

Layer connectivity design patterns

The fully connected architecture in section 5.3.3 maximizes flexibility by connecting every neuron to every neuron in the next layer, but connectivity itself is an engineering decision. Dense, sparse, and skip patterns trade learning flexibility against parameter count, locality, and gradient flow.

Dense connectivity represents the standard pattern where each neuron connects to every neuron in the subsequent layer. In the MNIST example, connecting the 784-dimensional input layer to a hidden layer of 128 neurons requires 100,352 weight parameters (\(784{\times}128\)). This full connectivity enables the layer to learn arbitrary linear combinations of its inputs, which nonlinear activations between layers extend to nonlinear relationships, and it maps directly onto the dense matrix-multiplication kernels that accelerators are built to execute. Because the parameter count grows as the product of adjacent layer widths, however, widening one layer scales parameters linearly while widening both scales them quadratically.

Sparse connectivity cuts that parameter growth by restricting each neuron to a subset of the inputs in the adjacent layer, much as biological neurons connect only to nearby cells; in visual processing tasks like MNIST, neurons might connect only to nearby pixels to reflect the local nature of visual features. Although sparse connections reduce theoretical parameter counts and FLOPs, a sparse weight matrix does not automatically execute faster than a dense one on standard hardware. Unless the hardware supports a regular, structured sparsity pattern that its kernels can predict (developed in N:M structured sparsity mechanics), the arithmetic reduction does not translate into a proportional reduction in execution time.

Whereas sparse connections prune links within a layer, skip connections add direct paths between nonadjacent layers (He et al. 2016) to keep deeper networks trainable. As networks grow deeper, the longer path from input to output complicates gradient flow; skip connections supplement the standard layer-by-layer progression so that later layers in a digit recognition pipeline can reference both high-level patterns and earlier representations while preserving the backward gradient paths that very deep architectures depend on.

Model size and computational complexity

Every connectivity choice ends in a parameter count. How parameters (weights and biases) are arranged determines both learning capacity and computational cost. The parameter count, its numerical precision, and the operations it requires are the concrete terms of the model’s side of the silicon contract. Parameter count grows with network width and depth, and table 5 lays it out for the running network layer by layer.

Table 5: MNIST Parameters and MACs by Layer: Weight, bias, parameter, and per-image multiply-accumulate counts for the 784-128-64-10 network. A dense layer performs one MAC per weight for each input, so the weight and MAC columns match. Layer 1 (Input → Hidden1) dominates both because it multiplies the 784-dimensional input by 128 hidden units; deeper layers shrink rapidly as the representation compresses toward the 10-class output.
Layer Weights Biases Parameters MACs per Image
Input → Hidden1 \(784{\times}128\) = 100,352 128 100,480 100,352
Hidden1 → Hidden2 \(128{\times}64\) = 8,192 64 8,256 8,192
Hidden2 → Output \(64{\times}10\) = 640 10 650 640
Total 109,184 202 109,386 109,184

The first layer alone holds 100,352 of the 109,184 weights. Because a dense layer performs one multiply-accumulate per weight for each input, the same table also counts the arithmetic per image, and the parameter and MAC columns differ only by the 202 biases. At four bytes per FP32 value, the 109,386 parameters occupy 438 KB. Each must be stored in memory, read on every forward pass, and updated during learning, and the training and inference memory estimates later in this chapter start from this table rather than recounting it.

5.3.5 Why depth matters

A single-layer network attempting to classify handwritten digits must map all 784 raw pixels directly to ten class labels in one step, relearning every stroke pattern separately for each digit. The running network spreads its weights over three layers instead so that deeper layers can exploit compositionality, in which complex patterns decompose into simpler patterns that themselves decompose further. In image recognition, learned representations can progress from local edges and textures toward parts and objects; such hierarchical regularities occur in many datasets and motivate layered models, although a trained network need not recover this exact sequence.

Consider recognizing the digit “seven” in the MNIST example. Rather than mapping all 784 pixel values directly to a decision, a deep network can compute the decision more parameter-efficiently by reusing intermediate features:

  • Layer 1 learns simple edge detectors: vertical lines, horizontal lines, diagonal strokes
  • Layer 2 combines edges into shapes: the horizontal top stroke of a “seven,” the diagonal downstroke
  • Layer 3 combines shapes into complete digit patterns

Each layer builds on the previous, allowing later computations to reuse earlier features. The same edge detectors learned for “seven” can also contribute to recognizing “one,” “four,” and other digits. This parameter reuse helps explain why depth is an effective design choice without implying a fixed parameter advantage for every task. The choice between adding layers and widening existing ones is not symmetric, however, because depth and width contribute to representational capacity through different mechanisms and cost the machine different things.

Systems Perspective 5.2: The depth vs. width trade-off
For certain function classes, depth provides an exponential representational advantage: a network with \(\LayerCount\) layers can represent functions that require exponentially more units in a shallow network (Telgarsky 2016). This restricted theoretical result explains why nonlinear composition can be parameter-efficient; it is not a universal guarantee for every task.

Modern architectures balance depth against width. A network with 10 layers of 100 neurons has the same 1,000 total hidden units as one with 2 layers of 500, but not the same parameter count, function class, or execution graph. Both expose parallelism within each layer; the deeper network adds sequential dependencies and may represent some compositional functions more efficiently.

Telgarsky, Matus. 2016. “Benefits of Depth in Neural Networks.” Proceedings of the 29th Annual Conference on Learning Theory, 1517–39.

The cost side of that trade-off follows from counting. For a fully connected network with layer widths running from \(\LayerWidth_0\) (the input) to \(\FinalLayerWidth\) (the output), each layer \(\LayerIndex\) holds a \(\PreviousLayerWidth{\times}\CurrentLayerWidth\) weight matrix and \(\CurrentLayerWidth\) biases, and its forward pass performs one MAC per weight for every example. The training pass must also retain each layer’s output for every example in a batch of \(\BatchSize\), so the parameter count \(\Parameters\), the forward operations per example \(\Operations\) (two FLOPs per MAC), and the retained activation memory \(\ActivationMemory\) follow equation 10: \[ \Parameters = \sum_{\LayerIndex=1}^{\LayerCount} (\PreviousLayerWidth + 1)\,\CurrentLayerWidth, \qquad \Operations = 2\sum_{\LayerIndex=1}^{\LayerCount} \PreviousLayerWidth\,\CurrentLayerWidth, \qquad \ActivationMemory \propto \BatchSize \sum_{\LayerIndex=1}^{\LayerCount} \CurrentLayerWidth \tag{10}\]

When every hidden layer has the same width \(\HiddenDimension\), the sums collapse. Parameters and operations grow as \(\LayerCount\HiddenDimension^2\), linear in depth and quadratic in width, while retained activations grow as \(\BatchSize\LayerCount\HiddenDimension\), linear in both. Figure 12 plots the two sweeps on the running network’s input and output widths. Holding the network at two hidden layers and doubling their width from 2,048 to 4,096 multiplies MACs per example by 3.4×, short of four only because the input layer’s share still grows linearly, while holding the width at 512 and doubling depth from 16 to 32 hidden layers multiplies MACs by 2.0× and retained activations by 1.9×.

Figure 12: Width Costs Quadratically, Depth Costs Linearly: Forward multiply-accumulate operations (MACs) per example for fully connected networks on the MNIST input (784) and output (10) widths. Left: two hidden layers whose shared width sweeps from 64 to 4,096 on log-log axes; once the hidden-to-hidden matrix dominates, the curve follows the dashed slope-two guide, and the running 784-128-64-10 network sits near the narrow end. Right: hidden width fixed at 512 while depth sweeps from 1 to 32 hidden layers; MACs per example (left axis) and activations retained per example for training (right axis) both rise in a straight line.

Depth and width add capacity on different terms. Depth adds capacity at linear cost in parameters, operations, and activation memory, but every added layer is another step that must finish before the next begins, so depth raises the latency floor of a single example, lengthens the list of activations that training must hold until the backward pass, and lengthens the path a gradient must survive on its way back to the first layer. Width adds capacity at quadratic cost in parameters and operations (activation memory still grows only linearly), yet all of it lands inside one matrix multiplication whose rows and columns can be spread across parallel hardware, so a wider layer keeps an accelerator busy without adding a sequential step. Choosing between them is therefore a choice between paying in serialized steps and memory or paying in arithmetic, and the batch size \(\BatchSize\), which multiplies only the activation term, decides how heavily the memory side weighs during training.

Checkpoint 5.2: Neural network architecture fundamentals
Before proceeding to training, verify your understanding of the foundational concepts:

Use the MNIST architecture 784 → 128 → 64 → 10 as the running check.

If any of these feel unclear, review the earlier sections on neural network fundamentals, artificial neurons, and parameters before continuing. The upcoming sections on training and optimization build directly on these foundations.

Network architecture, neurons, and parameters are now in place, but nothing yet explains how randomly initialized parameters become useful. Architecture answers what the model computes; training answers how it learns. The mechanics reveal systems constraints because training adds backward computation, saved activations, gradients, and optimizer state. Batch size then becomes a joint statistical and hardware choice, because it changes gradient noise, activation memory, data reuse, and parallel efficiency at once.

Self-Check: Question
  1. In a fully connected multilayer perceptron with layer dimensions \(784 \to 128 \to 64 \to 10\), which layer represents the primary parameter storage and computational hotspot, and what is its weight parameter count?

    1. The \(64 \to 10\) output layer with \(640\) weights, because the softmax denominator forces quadratic parameter expansion.
    2. The \(128 \to 64\) hidden layer with \(8{,}192\) weights, because it bridges intermediate representations.
    3. The \(784 \to 128\) input layer with \(100{,}352\) weights (\(784 \times 128\)), accounting for over \(91\%\) of the network’s total weight parameters and forward MACs.
    4. All three layers have identical parameter counts because linear algebra kernels require static square matrix padding.
  2. From a hardware and systems engineering perspective, why has the Rectified Linear Unit (\(\text{ReLU}(z) = \max(0, z)\)) largely replaced Sigmoid (\(\sigma(z) = \frac{1}{1 + e^{-z}}\)) in deep hidden layers?

    1. ReLU makes many activations exactly zero, which by itself guarantees dense end-to-end training speedups on standard hardware and prevents gradient decay through the whole network.
    2. ReLU uses a simple comparison/select operation instead of exponential-based computation, and its derivative is \(1\) on the positive branch, which avoids local saturation there even though full-network gradients still depend on weights and other layers.
    3. Sigmoid and ReLU have essentially the same execution cost on modern hardware, so the preference for ReLU comes mainly from its bounded output range \([0,1]\).
    4. Because ReLU has lower local compute cost than sigmoid, switching activations alone always reduces end-to-end training time regardless of the rest of the model or input pipeline.
  3. Explain why stacking multiple linear layers without nonlinear activation functions (\(\mathbf{y} = \mathbf{x}\mathbf{W}_1\mathbf{W}_2\mathbf{W}_3\)) fails to increase the expressive capacity of a neural network, and describe what changes once nonlinear activation functions are inserted between the layers.

  4. True or False: For compositional target functions where complex patterns decompose hierarchically into reusable sub-patterns, deep networks can represent some functions much more parameter-efficiently than shallow networks, and in restricted function classes that advantage can be exponential.

  5. In hardware accelerators for neural networks, the illustrative silicon-area and energy penalty of implementing transcendental activations such as sigmoid or softmax rather than simple piecewise-linear activations is referred to as the transistor ____.

  6. Order the computational and memory staging steps required to execute the forward pass of a single dense hidden layer for a batch of input tokens: (1) Apply the element-wise nonlinear activation function (e.g. ReLU) to preactivations, (2) Load the input activation matrix \(\mathbf{X}\) and layer weight matrix \(\mathbf{W}\) into execution registers/caches, (3) Perform the dense matrix multiplication \(\mathbf{X}\mathbf{W}\), (4) Broadcast and add the bias vector \(\mathbf{b}\) to obtain layer preactivations \(\mathbf{Z}\).

See Answers →

5.4 Learning Process

The MNIST network currently holds 109,386 parameters set to random values, numbers that encode no knowledge at all. Learning turns them into a working classifier by repeating one short cycle of computation millions of times, and that repetition multiplies every cost the previous sections counted for a single forward pass.

5.4.1 Supervised learning from labeled examples

At that starting point the network classifies digits no better than guessing among ten classes (about 10 percent accuracy). Transforming it into a 95 percent-accurate classifier requires supervised learning: showing the network labeled examples and adjusting its weights based on the errors it makes. For the MNIST digit recognition task, the dataset contains 60,000 training images, each a \(28{\times}28\) pixel grayscale image paired with its correct digit label. To close that accuracy gap, training runs as a loop where each iteration processes a subset of training examples called a batch through four operations: forward computation through the network layers generates predictions, a loss function measures prediction error under the chosen objective, backpropagation computes parameter gradients, and an optimizer uses those gradients to update the weights.

Definition 5.2: Mini-batch

Mini-batch is the subset of \(\BatchSize\) training examples that pass together through one forward and one backward pass and whose gradients are averaged into a single parameter update; during training, an unqualified batch in this book means a mini-batch.

  1. Significance: The batch size \(\BatchSize\) is the training loop’s main systems knob. It sets how many examples share each weight read from memory, it multiplies the activations that training must keep until the backward pass, and it fixes how many updates one pass over the training set produces, so doubling \(\BatchSize\) roughly doubles activation memory and halves the updates per pass.
  2. Distinction: Full-batch gradient descent uses the entire training set for every update, and purely stochastic gradient descent uses a single example. A micro-batch is a slice of a mini-batch whose gradients are accumulated before the one update, and an inference batch groups incoming requests without updating anything.
  3. Common pitfall: A frequent misconception is that a larger batch is free throughput. Each request waits longer, and beyond some size the optimizer needs more passes over the data to reach the same accuracy.

Tracing dataflow along the red horizontal arrow in figure 13 shows forward activations traversing the layers to evaluate loss, whereas the orange arrow running the opposite way carries gradients backward through the layers; the optimizer then turns those gradients into weight updates. This operational asymmetry creates a central memory obligation: training must retain intermediate forward activations in memory until the corresponding backward pass completes.
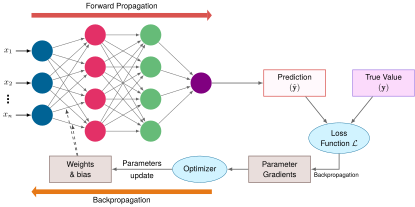
Figure 13: Training Loop Architecture: A prediction and true value meet at the loss function; backpropagation computes parameter gradients, and the optimizer turns those gradients into parameter updates for the next forward pass.

The iterative approach can be expressed mathematically. Given an input image \(\InputFeatureVector\) and its true label \(\LabelVector\), the network computes its prediction according to equation 11: \[ \PredictedOutput = \NetworkFunction(\InputFeatureVector; \ModelParameters) \tag{11}\]

This equation encapsulates the entire forward pass: the network \(\NetworkFunction\) takes an input \(\InputFeatureVector\) (say, a \(28{\times}28\) digit image) and, using its current parameters \(\ModelParameters\) (weights and biases across all layers), produces a prediction \(\PredictedOutput\) (a vector of ten probabilities, one per digit). The semicolon notation \(\NetworkFunction(\InputFeatureVector; \ModelParameters)\) distinguishes the input \(\InputFeatureVector\), which changes with every example, from \(\ModelParameters\), which remains fixed during inference but evolves during training. The network’s error is measured by a loss function16 \(\LossFunction\) (equation 12): \[ \text{loss} = \LossFunction(\PredictedOutput, \LabelVector) \tag{12}\]

16 Loss function: Formalized by Abraham Wald in statistical decision theory (Wald 1949) as the “cost” of an incorrect decision, \(\LossFunction\) quantifies the gap between prediction \(\PredictedOutput\) and ground truth \(\LabelVector\). The choice of loss function shapes the optimization geometry: it determines the gradient landscape that backpropagation must navigate. A loss with flat regions near incorrect predictions produces weak gradients that stall learning, while a loss with steep gradients near the decision boundary accelerates convergence where it matters most, a systems consequence explored in section 5.4.3.

Wald, Abraham. 1949. “Statistical Decision Functions.” The Annals of Mathematical Statistics 20 (2): 165–205. https://doi.org/10.1214/aoms/1177730030.

The error measurement drives the adjustment of network parameters: gradient descent (section 5.4.4) moves each parameter against its loss gradient, and backpropagation (section 5.4.5) computes those gradients. In practice, training operates on batches of examples rather than individual inputs. For the MNIST dataset, each training iteration might process 32, 64, or 128 images simultaneously for reasons developed in section 5.4.4.1. The training cycle continues until the network achieves sufficient accuracy or reaches a predetermined number of iterations, and each iteration begins with the forward pass that turns a batch of input images into predictions.

↪ How long this cycle takes to reach a target accuracy, the time-to-accuracy measure that training benchmarks prefer over raw throughput, is developed in Time and throughput.

5.4.2 Forward pass computation

An MNIST image becomes ten class scores by moving through weighted layers and nonlinear activations. That computation is forward propagation: input data flows through the network’s layers to generate predictions. During training, those predictions are paired with ground-truth targets at the loss function, closing the training loop of figure 13. The forward pass itself underlies both inference and training.

The process begins with the input layer, where each pixel’s grayscale value becomes an input feature. For MNIST, this means 784 input values (\(28{\times}28\) = 784), each normalized between 0 and 1. The first layer alone performs 100,352 MACs per sample. When processing multiple samples in a batch, these operations multiply accordingly, requiring careful management of memory bandwidth and computational resources. Accelerators execute these operations efficiently by running many MACs in parallel, a design developed in Hardware Acceleration.

Individual layer processing

Each layer of the digit classifier turns its input into a more abstract representation in two steps, a linear transformation of inputs followed by a nonlinear activation. The linear transformation applies the same weighted sum operation defined in equation 2, but now using notation that tracks layer indices (equation 13): \[ \PreactivationMatrix^{(\LayerIndex)} = \ActivationMatrix^{(\LayerIndex-1)}\WeightMatrix^{(\LayerIndex)} + \BiasVector^{(\LayerIndex)} \tag{13}\]

Here, \(\ActivationMatrix^{(\LayerIndex-1)}\) contains the activations from the previous layer (the outputs after applying activation functions), \(\WeightMatrix^{(\LayerIndex)} \in \mathbb{R}^{\PreviousLayerWidth \times \CurrentLayerWidth}\) is the weight matrix for layer \(\LayerIndex\), and \(\BiasVector^{(\LayerIndex)}\) is the bias vector (broadcast across the batch). The superscript \((\LayerIndex)\) keeps track of which layer each parameter belongs to. This row-vector convention matches the single-sample equation in equation 2: each row of \(\ActivationMatrix\) is one sample, and right-multiplying by \(\WeightMatrix\) transforms it to the next layer’s width.

Following this linear transformation, each layer applies a nonlinear activation function \(\ActivationFunction\) (here, \(\ActivationFunction\) or \(\ActivationFunction^{(\LayerIndex)}\) denotes a generic activation function at layer \(\LayerIndex\)), as expressed in equation 14: \[ \ActivationMatrix^{(\LayerIndex)} = \ActivationFunction(\PreactivationMatrix^{(\LayerIndex)}) \tag{14}\]

This process repeats at each layer, creating a chain of transformations: \[ \text{Input} \rightarrow \text{Linear Transform} \rightarrow \text{Activation} \rightarrow \text{Linear Transform} \rightarrow \text{Activation} \rightarrow \cdots \rightarrow \text{Output} \]

The batch form is what the machine executes. Every one of the \(\BatchSize\) rows of \(\ActivationMatrix^{(\LayerIndex-1)}\) meets the same \(\WeightMatrix^{(\LayerIndex)}\), so a single read of the weights serves the whole batch, the reuse that figure 9 drew. For the digit classifier, the first such product turns the 784-dimensional input into 128 hidden values, and two more produce the ten class scores.

Matrix multiplication formulation

For a network with \(\LayerCount\) layers, the complete forward propagation process can be expressed as a composition of layer transformations (equation 15): \[ \ActivationMatrix^{(\LayerCount)} = \ActivationFunction^{(\LayerCount)}\!\Big(\cdots \ActivationFunction^{(2)}\!\Big(\ActivationFunction^{(1)}(\LayerInputMatrix\WeightMatrix^{(1)} + \BiasVector^{(1)})\WeightMatrix^{(2)} + \BiasVector^{(2)}\Big)\cdots \WeightMatrix^{(\LayerCount)} + \BiasVector^{(\LayerCount)}\Big) \tag{15}\]

Horizontal bar of the forward-pass floating-point budget. An orange segment labeled MatMul over 99 percent fills nearly the entire bar; a hairline gray sliver at the right end, marked by a leader, is labeled element-wise under 1 percent.

Matrix multiplication is over 99 percent of this network’s forward-pass FLOPs.

The nested expression unfolds layer by layer, each step consuming the previous layer’s activations:

  1. First layer: \[\begin{gather*} \mathbf{Z}^{(1)} = \mathbf{X}\mathbf{W}^{(1)} + \mathbf{b}^{(1)} \\[0.2ex] \mathbf{A}^{(1)} = f^{(1)}(\mathbf{Z}^{(1)}) \end{gather*}\]

  2. Hidden layers \((\LayerIndex = 2,\ldots, \LayerCount-1)\): \[\begin{gather*} \mathbf{Z}^{(\LayerIndex)} = \mathbf{A}^{(\LayerIndex-1)}\mathbf{W}^{(\LayerIndex)} + \mathbf{b}^{(\LayerIndex)} \\[0.2ex] \mathbf{A}^{(\LayerIndex)} = f^{(\LayerIndex)}(\mathbf{Z}^{(\LayerIndex)}) \end{gather*}\]

  3. Output layer: \[\begin{gather*} \mathbf{Z}^{(\NumberOfLayers)} = \mathbf{A}^{(\NumberOfLayers-1)}\mathbf{W}^{(\NumberOfLayers)} + \mathbf{b}^{(\NumberOfLayers)} \\[0.2ex] \mathbf{A}^{(\NumberOfLayers)} = f^{(\NumberOfLayers)}(\mathbf{Z}^{(\NumberOfLayers)}) \end{gather*}\] For a batch of \(\BatchSize\) images in the MNIST network, four tensor dimensions govern the forward pass:

  • Input \(\LayerInputMatrix\): \(\BatchSize{\times}784\)
  • First layer weights \(\WeightMatrix^{(1)}\): \(784{\times}\LayerWidth_1\)
  • Hidden layer weights \(\WeightMatrix^{(\LayerIndex)}\): \(\PreviousLayerWidth{\times}\CurrentLayerWidth\)
  • Output layer weights \(\WeightMatrix^{(\LayerCount)}\): \(\PenultimateLayerWidth{\times}10\)

Of the two kinds of operation in that chain, the matrix multiplications dominate AI computation, and arithmetic intensity explains why.

Definition 5.3: Arithmetic intensity

Arithmetic intensity is the ratio of operations a kernel performs to the bytes it transfers across the memory interface being modeled, \(\ArithmeticIntensity = \Operations/\DataVolume\) in FLOP/byte.

  1. Significance: It decides whether a kernel is limited by arithmetic or by data movement. An accelerator can perform far more operations per second than its off-chip memory can deliver bytes, so a kernel that does little work per byte leaves the arithmetic units waiting however fast they are, and the remedy is more reuse per byte (tiling, batching, fusion) rather than more peak compute.
  2. Distinction: Unlike total FLOPs (a count of operations), arithmetic intensity is a ratio that characterizes the shape of a workload’s hardware demand. Two kernels with identical FLOPs but different memory access patterns can have different arithmetic intensities and run at very different speeds on the same hardware.
  3. Common pitfall: A frequent misconception is that arithmetic intensity is a fixed property of an operation. It depends on implementation and on batch size. A naive matrix multiplication that reloads operands from main memory for each output element has low arithmetic intensity, a tiled implementation that reuses data from on-chip memory has high arithmetic intensity, and a dense layer reaches more of that reuse as the batch grows, because each weight read then serves every example in the batch.

Tiled dense matrix multiplication reuses each loaded value many times, whereas an unfused element-wise operation does little work per byte it moves. Writing \(\ElementStorageSize\) for the bytes needed to store one value (4 bytes in FP32), table 6 compares their idealized intensities.

Table 6: Idealized Arithmetic Intensity of Matrix Multiply vs. Element-Wise ReLU: A tiled dense \(\SquareGemmDimension{\times}\SquareGemmDimension\) matrix multiplication performs \(2\SquareGemmDimension^3\) operations while moving at least about \(3\SquareGemmDimension^2 \ElementStorageSize\) bytes for \(\ElementStorageSize\) bytes per value, so potential reuse grows with \(\SquareGemmDimension\). A standalone element-wise activation remains at \(1/(2 \ElementStorageSize)\) FLOP/byte (0.125 FLOP/byte for FP32); implementations often fuse it with a neighboring kernel to avoid a separate memory round trip.
Operation Operation Count (\(\Operations\)) Minimum Data Movement Idealized Intensity Typical Optimization
Matrix Mul \((\SquareGemmDimension{\times}\SquareGemmDimension)\) \(2\SquareGemmDimension^3\) \(3\SquareGemmDimension^2 \ElementStorageSize\) bytes \(\approx 2\SquareGemmDimension/(3 \ElementStorageSize)\) Tiling on CPU/GPU/TPU
Element-wise (ReLU) \(\SquareGemmDimension^2\) \(2\SquareGemmDimension^2 \ElementStorageSize\) bytes \(1/(2 \ElementStorageSize)\) Vectorization and fusion

Systems Perspective 5.3: Why matrix multiplication dominates AI
Modern accelerators have large compute arrays relative to off-chip memory bandwidth. They approach peak arithmetic throughput only when operations expose enough reuse and parallel work. Dense and convolutional layers map well to optimized kernels; custom element-wise sequences are often fused so that their intermediate values remain on chip. How accelerators organize their compute arrays around matrix multiplication is developed in Compute Primitives.

For a single sample, the layer operation \(\InputFeatureVector\WeightMatrix\) is a general matrix-vector multiply (GEMV). Batching multiple samples turns this into \(\LayerInputMatrix\WeightMatrix\), a general matrix multiply (GEMM). Accelerators pack wide parallel units and high-bandwidth memory hierarchies optimized for 2D matrix transformations. Because hardware vendors invest the bulk of their silicon area and compiler optimizations in GEMM throughput, almost every neural network layer is structured to execute as matrix multiplication, and Dense projections shows how the convolution and attention layers of later chapters lower to that shared primitive. Matrix operations account for over 99 percent of the floating-point operations in this chapter’s dense network and dominate modern neural workloads. Model architectures are therefore shaped around the operations that matrix engines execute efficiently, which is the core of hardware-software co-design. The tiling that gives these kernels their data reuse is developed in Tiling, and how GEMM arithmetic intensity grows with matrix dimension is collected for reference in General matrix multiply (GEMM).

Step-by-step computation sequence

Consider a batch of 32 images entering the network. Each image starts as a \(28{\times}28\) grid of pixel values, which flattens into a 784-dimensional vector. For the entire batch, this yields an input matrix \(\LayerInputMatrix\) of size \(32{\times}784\), where each row represents one image. The values are typically normalized to lie between 0 and 1.

The transformation at each layer proceeds as a shape-changing sequence; the shapes determine both kernel choice and activation storage. The network first takes the input matrix \(\LayerInputMatrix\) (\(32{\times}784\)) and transforms it using the first layer’s weights. If the first hidden layer has 128 neurons, \(\WeightMatrix^{(1)}\) is a \(784{\times}128\) matrix, so the computation \(\LayerInputMatrix\WeightMatrix^{(1)}\) produces a \(32{\times}128\) matrix. Each element in this matrix then has its corresponding bias added and passes through an activation function. For example, with a ReLU activation, any negative values become zero while positive values remain unchanged. The final layer transforms its inputs into a \(32{\times}10\) matrix, where each row contains 10 class scores. Let \(\NeuronPreactivation_j\) denote the raw score (logit) for digit \(\ClassIndex\) and let \(\NeuronPreactivation_k\) range over all 10 digits. Often, these scores are converted to probabilities using the softmax function in equation 7: \[ \PredictedOutputComponent_j = \frac{e^{\NeuronPreactivation_j}}{\sum_{k=1}^{10} e^{\NeuronPreactivation_k}} \]

For each image in the batch, the ten values \(\PredictedOutputComponent_j\) form a probability distribution over the possible digits. The digit with the highest probability represents the network’s prediction.

Napkin Math 5.1: Counting operations in forward pass

Problem: Determine the total arithmetic operation count (\(\Operations\)) for one forward pass through the MNIST network (784 → 128 → 64 → 10) with batch size 32.

Background: A matrix multiplication of dimensions \((\GemmRowDimension{\times}\GemmInnerDimension) \times (\GemmInnerDimension{\times}\GemmColumnDimension)\) requires \(2 \times \GemmRowDimension\times \GemmInnerDimension\times \GemmColumnDimension\) FLOPs (one multiply and one add per output element, summed over \(\GemmInnerDimension\) terms). Bias addition adds \(\GemmRowDimension\times \GemmColumnDimension\) floating-point additions. ReLU activation adds \(\GemmRowDimension\times \GemmColumnDimension\) comparisons, so the table reports total operation-equivalent work rather than pure FLOPs for activation rows.

Solution: Table 7 breaks down the operation count layer by layer. The total comes to ~7 MOp, or 7 MOp ÷ 32 = ~219 KOp per image. This per-image figure reconciles with the count at the start of the chapter. The three matrix-multiplication rows contribute 218,368 FLOPs per image, exactly two FLOPs for each of the 109,184 MACs, and the bias and activation rows add less than 1 percent on top.

Systems insight:

  1. Layer 1 dominates: The first layer accounts for 91.9 percent of all operations because it processes the largest input (784 dimensions). Shrinking the input or the first hidden width is therefore the largest single lever on this network’s arithmetic.
  2. Compute vs. memory: At batch 1, 219 KOp must amortize a parameter read for only one image, giving an arithmetic intensity of ~0.5 FLOP/byte under this traffic model. At batch 32, one parameter read, one input read, one final-output write, and a write followed by a read for each hidden tensor move ~588 KB and raise the intensity to ~11.9 FLOP/byte. This idealized FP32 model treats each dense layer as a separate kernel with fused bias and activation, and counts transfers across a memory boundary at which no operands remain resident between kernels or batches. A hidden activation contributes twice because its producer writes it and its consumer reads it. Cache residency or cross-layer fusion can reduce traffic at that boundary; extra transfers can increase it. The comparison shows why batching improves reuse, but memory- or compute-bound behavior still depends on the machine’s ridge point, the balance \(\PeakRate/\Bandwidth\) introduced with the iron law, which the roofline model in Performance Bounds develops.
  3. Scaling intuition: Doubling the hidden layer widths (784 → 256 → 128 → 10) increases the operation count by about 2.1× to about 15 MOp. This comes from recomputing each layer: layers 1 and 3 double, layer 2 quadruples, so the total roughly doubles rather than quadrupling.
Table 7: MNIST Forward Pass Operation Count by Layer: Operation-equivalent breakdown for a single forward pass through the 784-128-64-10 network at batch size 32. Matrix multiplication rows are FLOPs; bias, ReLU, and softmax rows are elementwise operations included to show their negligible contribution. Layer 1’s matrix multiply dominates because it multiplies the 784-dimensional input against the widest weight matrix; bias and activation operations contribute under 1 percent of the total.
Layer Operation Dimensions Operations
Layer 1 MatMul (\(32{\times}784\)) \(\times\) (\(784{\times}128\)) \(2 \times 32 \times 784{\times}128\) = 6,422,528
Layer 1 Bias + ReLU \(32{\times}128\) \(2{\times}4{,}096\) = 8,192
Layer 2 MatMul (\(32{\times}128\)) \(\times\) (\(128{\times}64\)) \(2 \times 32 \times 128{\times}64\) = 524,288
Layer 2 Bias + ReLU \(32{\times}64\) \(2{\times}2{,}048\) = 4,096
Layer 3 MatMul (\(32{\times}64\)) \(\times\) (\(64{\times}10\)) \(2 \times 32 \times 64{\times}10\) = 40,960
Layer 3 Bias + Softmax \(32{\times}10\) ~640 (simplified)
Total ~7 MOp

Implementation and optimization considerations

Forward propagation is easy to state mathematically, but its implementation is constrained by activation storage, batch size, memory layout, and hardware fit. During training, each layer’s activations must stay in memory until the backward pass consumes them. For the MNIST network at batch size 32, the input holds \(32{\times}784\) = 25,088 values, the hidden layers hold 4,096 and 2,048, and the output holds 320, a total of 31,552 values per batch that section 5.4.5.5 converts into bytes alongside the other training-state terms. Every one of these counts scales linearly with batch size, so doubling the batch to 64 doubles activation storage.

The same batch size sets the other side of the trade. Notebook 5.1 estimated arithmetic intensity rising from ~0.5 FLOP/byte at batch 1 to ~11.9 FLOP/byte at batch 32, because one read of each weight now serves 32 images. Batching therefore trades memory for reuse. Memory capacity bounds how far that trade can go, while gradient noise and per-request latency bound it from other directions. Memory layout and optimized linear-algebra libraries decide how much of that reuse an implementation actually captures, which is why parallel processors that can be fed from on-chip storage run large dense matrix operations substantially faster than CPUs, and why specialized accelerators add reduced-precision arithmetic and dataflows tailored to these patterns. Energy follows the same logic. Power alone does not determine energy per inference; the relevant quantity is power integrated over execution time for the same workload and quality target, and memory hierarchy and data movement often explain most of the difference between platforms.

A roofline (Williams et al. 2009) plots a machine’s attainable throughput against arithmetic intensity, with a sloped segment equal to bandwidth times intensity that meets a flat roof at peak compute; The roofline model develops that throughput bound in full. Figure 14 places those two intensities on the rooflines of two machines whose FP32 ridge points happen to sit near the same value. At both batch sizes the running network lies on the sloped, bandwidth-limited side of both machines, so its attainable rate is bandwidth times intensity. Batching therefore gains more than an order of magnitude by climbing that slope, and at these intensities the accelerator outruns the CPU because it moves bytes faster, not because it multiplies faster. The plot assumes that every operand streams from main memory, as the notebook’s traffic model does; a model this small can instead stay in a CPU’s cache, which raises the bandwidth that actually feeds it.

Williams, Samuel, Andrew Waterman, and David Patterson. 2009. “Roofline: An Insightful Visual Performance Model for Multicore Architectures.” Communications of the ACM 52 (4): 65–76. https://doi.org/10.1145/1498765.1498785.
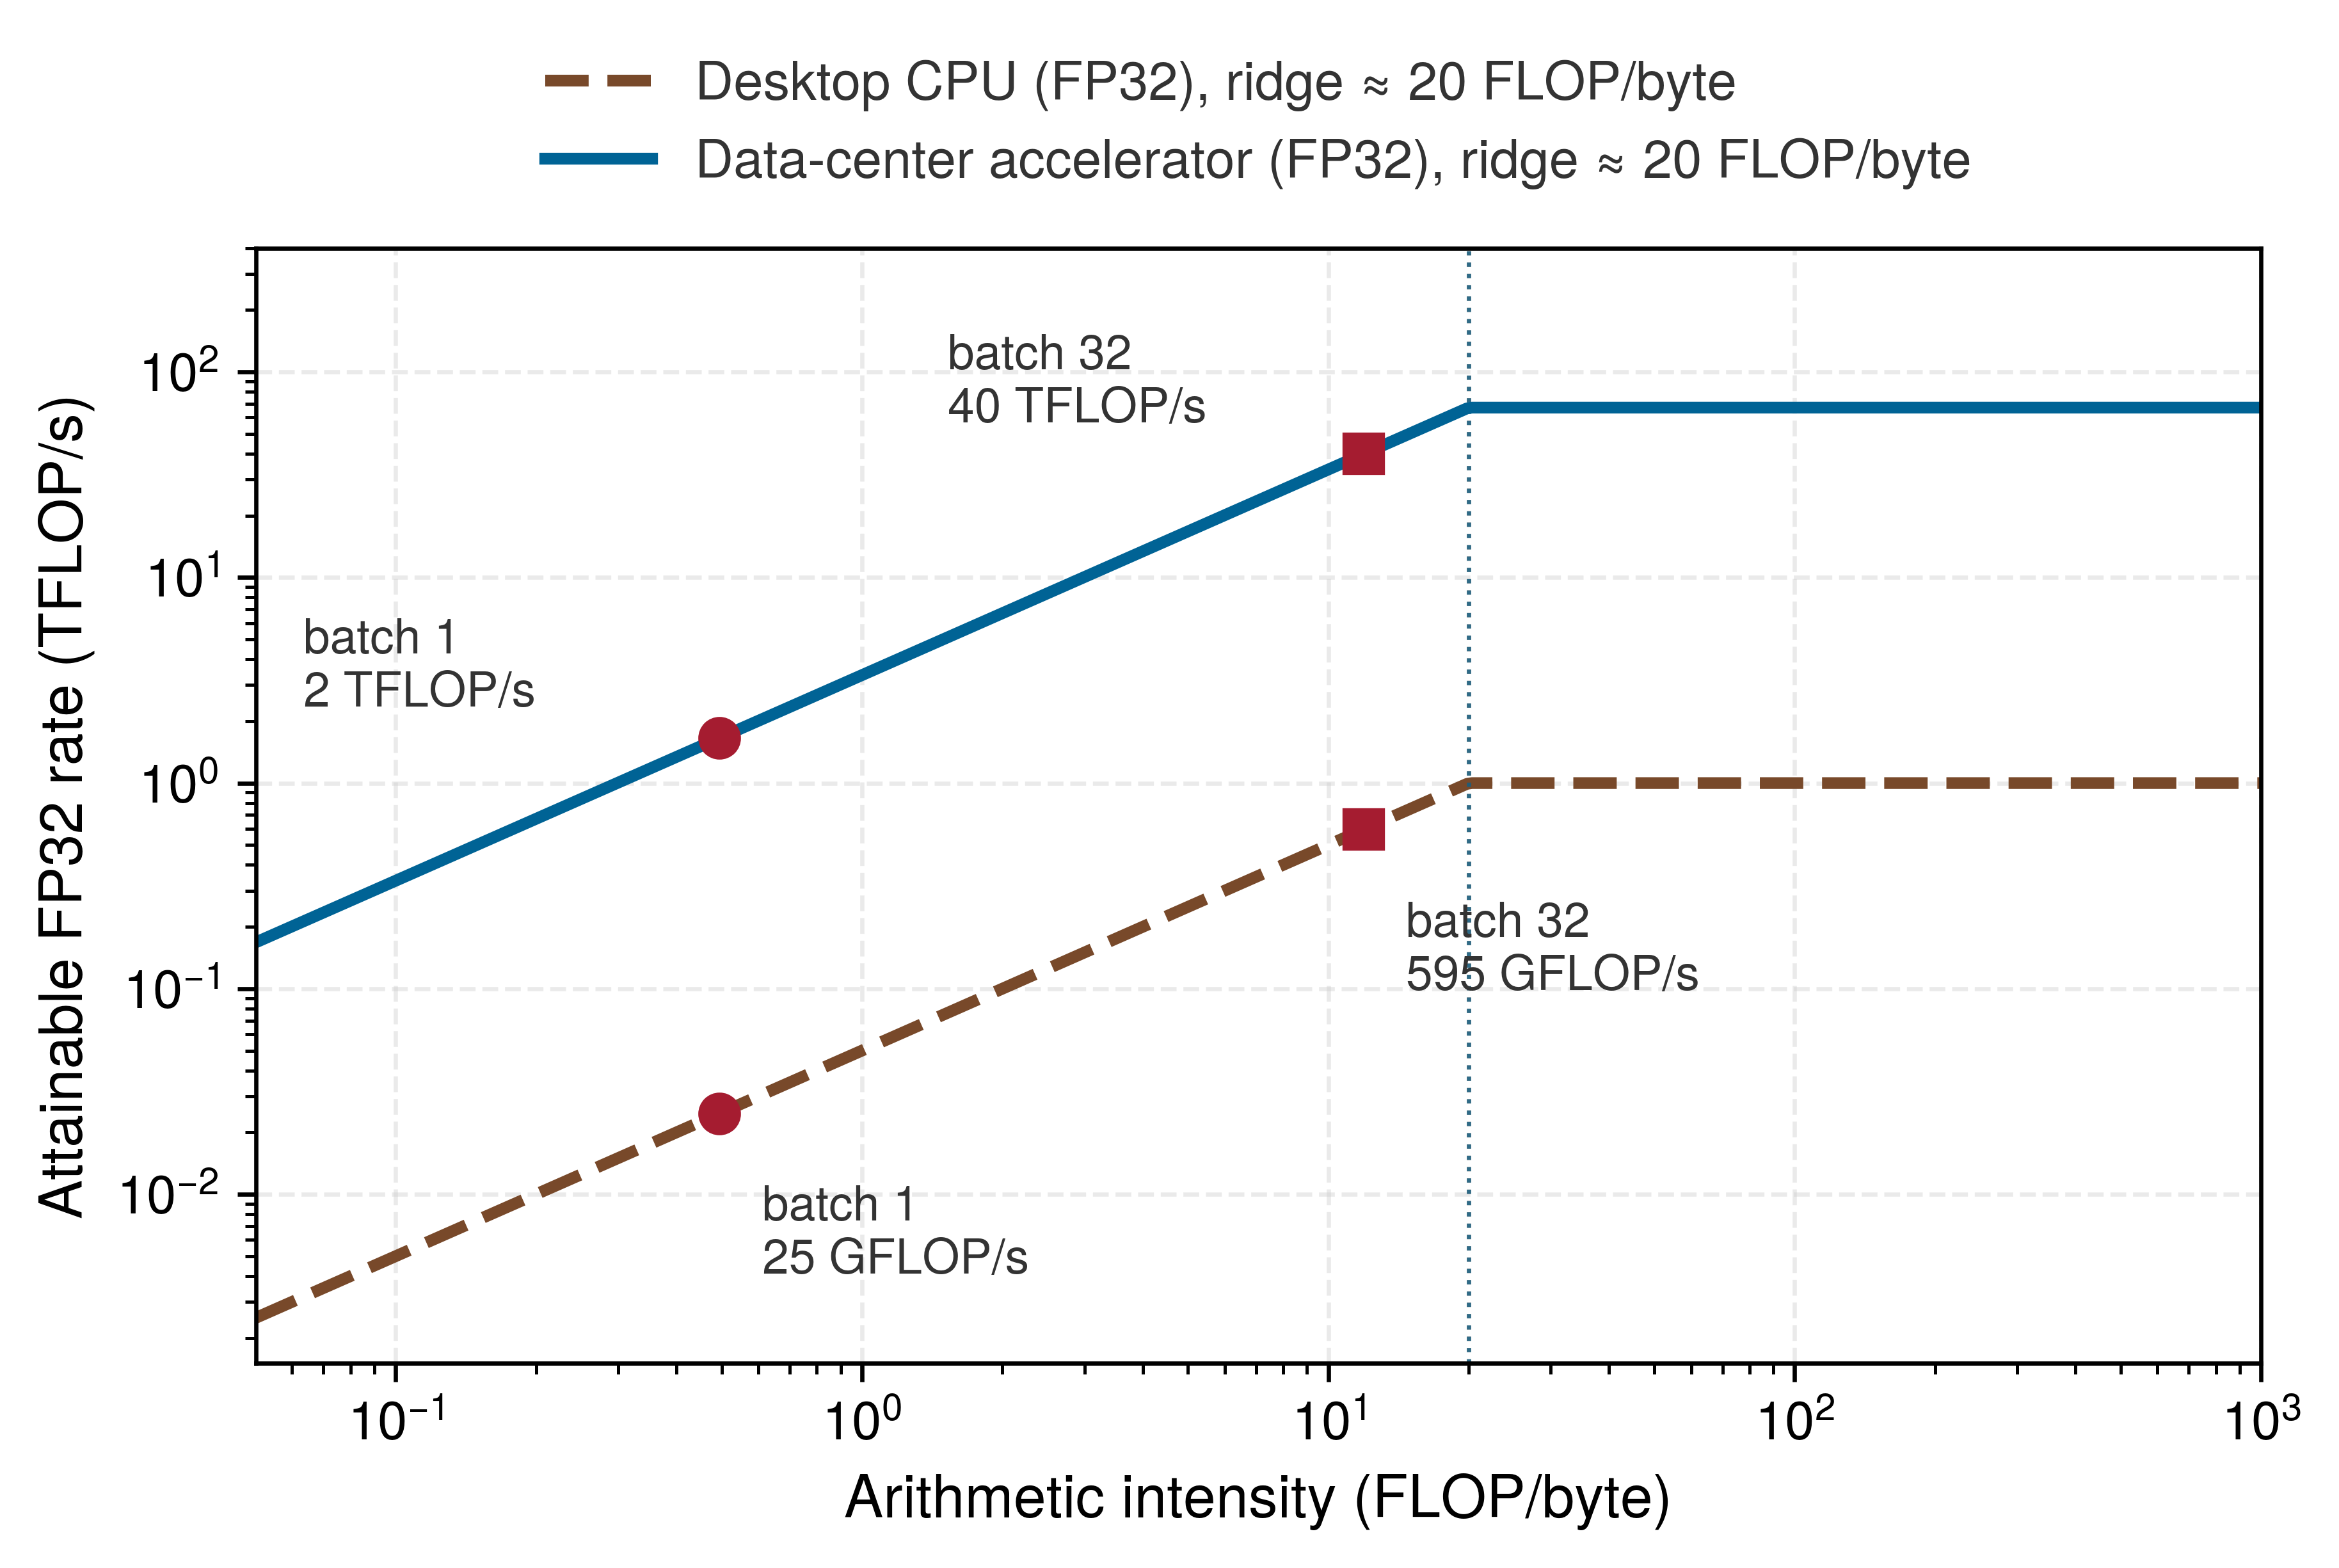
Figure 14: The Running Network on the Roofline: Attainable FP32 throughput against arithmetic intensity for a desktop CPU and a data-center accelerator, with the running network’s forward pass at batch 1 and batch 32 under the main-memory traffic model of the operation-count notebook. Both points sit left of both ridge points, so batching raises throughput by climbing the bandwidth slope, and at these intensities the accelerator’s lead equals its memory-bandwidth advantage rather than its arithmetic advantage.

5.4.3 Loss functions

When the MNIST network sees a handwritten “seven” and places a probability of 0.6 on “three” and only 0.1 on “seven,” the forward pass alone has no way to turn that mistake into a weight correction. Inference needs only the forward pass because a deployed model merely reports its prediction. Training needs one more quantity: an error metric that measures how far the ten predicted class scores fall from the true label. Loss functions supply that metric, turning the gap between prediction and reality into a single number that optimization can minimize.

Error measurement fundamentals

A loss function assigns a scalar cost to a prediction and target under a chosen objective. For the machine it is the cheapest stage of the training step, a few operations for each of ten class scores against the 109,184 MACs per image that produced them, so what the system must get right about the loss is its numerical range rather than its cost. Lower loss indicates a better value of that objective on the evaluated examples, but it is not the same as higher accuracy: confidence and calibration can change while the predicted class remains unchanged. During training, gradients of the loss guide parameter updates.

Mathematically, a loss function \(\LossFunction\) takes two inputs: the network’s predictions \(\PredictedOutput\) and the true values \(\LabelVector\). For a single training example in digit classification, the loss measures the discrepancy between prediction and truth. When training with batches of data, the system computes the mean loss across all examples in the batch (equation 16): \[ \BatchLoss = \frac{1}{\BatchSize}\sum_{i=1}^\BatchSize\LossFunction(\PredictedOutput_i, \LabelVector_i) \tag{16}\] where \(\BatchSize\) is the batch size and \((\PredictedOutput_i, \LabelVector_i)\) represents the prediction and truth for the \(\ExampleIndex\)-th example. Averaging keeps the loss and mean-gradient scale comparable across batch sizes, although the best learning rate can still change with batch size and optimization regime. The summation also maps naturally to parallel hardware: each example’s loss can be computed independently before a reduction combines them.

The choice of loss function depends on the type of task. For digit classification, the loss function must handle probability distributions over multiple classes, provide meaningful gradients that guide learning, penalize wrong predictions in proportion to their severity, and scale efficiently with batch processing. Cross-entropy loss satisfies all four requirements.

Cross-entropy and classification loss functions

For classification tasks like MNIST digit recognition, cross-entropy loss compares the predicted probability distribution with the true class label. The information-theoretic idea of entropy traces to Shannon (Shannon 1948); in supervised classification, cross-entropy penalizes low probability assigned to the correct class because the logarithm grows sharply as the correct-class probability approaches zero. This shape produces strong gradients for confidently wrong predictions and makes the correct-class probability the objective’s central quantity.

Shannon, Claude E. 1948. “A Mathematical Theory of Communication.” Bell System Technical Journal 27 (3): 379–423. https://doi.org/10.1002/j.1538-7305.1948.tb01338.x.

17 One-hot encoding: Representing each class as a binary vector with one entry per class, exactly one of which is 1. The encoding is sparse by construction, and for MNIST’s 10 classes, 90 percent of each label vector is zeros. Implementations commonly store an integer class index instead of materializing that vector. For very large output spaces, methods such as sampled softmax can also reduce the output computation.

For a single digit image, the network outputs a probability distribution over the 10 possible digits. Ground truth is represented as a one-hot vector17 where all entries are 0 except for a one at the correct digit’s position. For instance, if the true digit is “seven,” the label is \(\LabelVector= \big[0, 0, 0, 0, 0, 0, 0, 1, 0, 0\big]\).

The cross-entropy loss for this example is defined in equation 17: \[ \LossFunction(\PredictedOutput, \LabelVector) = -\sum_{j=1}^{10} \TrueLabelComponent_j \log(\PredictedOutputComponent_j) \tag{17}\] where \(\PredictedOutputComponent_j\) represents the network’s predicted probability for digit \(\ClassIndex\). Because \(\LabelVector\) is one-hot, this simplifies to equation 18: \[ \LossFunction(\PredictedOutput, \LabelVector) = -\log(\CorrectClassProbability) \tag{18}\] where \(\CorrectClassIndex\) is the index of the correct class. The loss therefore depends only on the predicted probability for the correct digit; the network is penalized based on how confident it is in the right answer.

For example, suppose the network assigns the probabilities in the left panel of figure 15 to an image of a “seven.” The prediction is a distribution over all ten digits, while the label is a single one at the correct class and zero everywhere else.
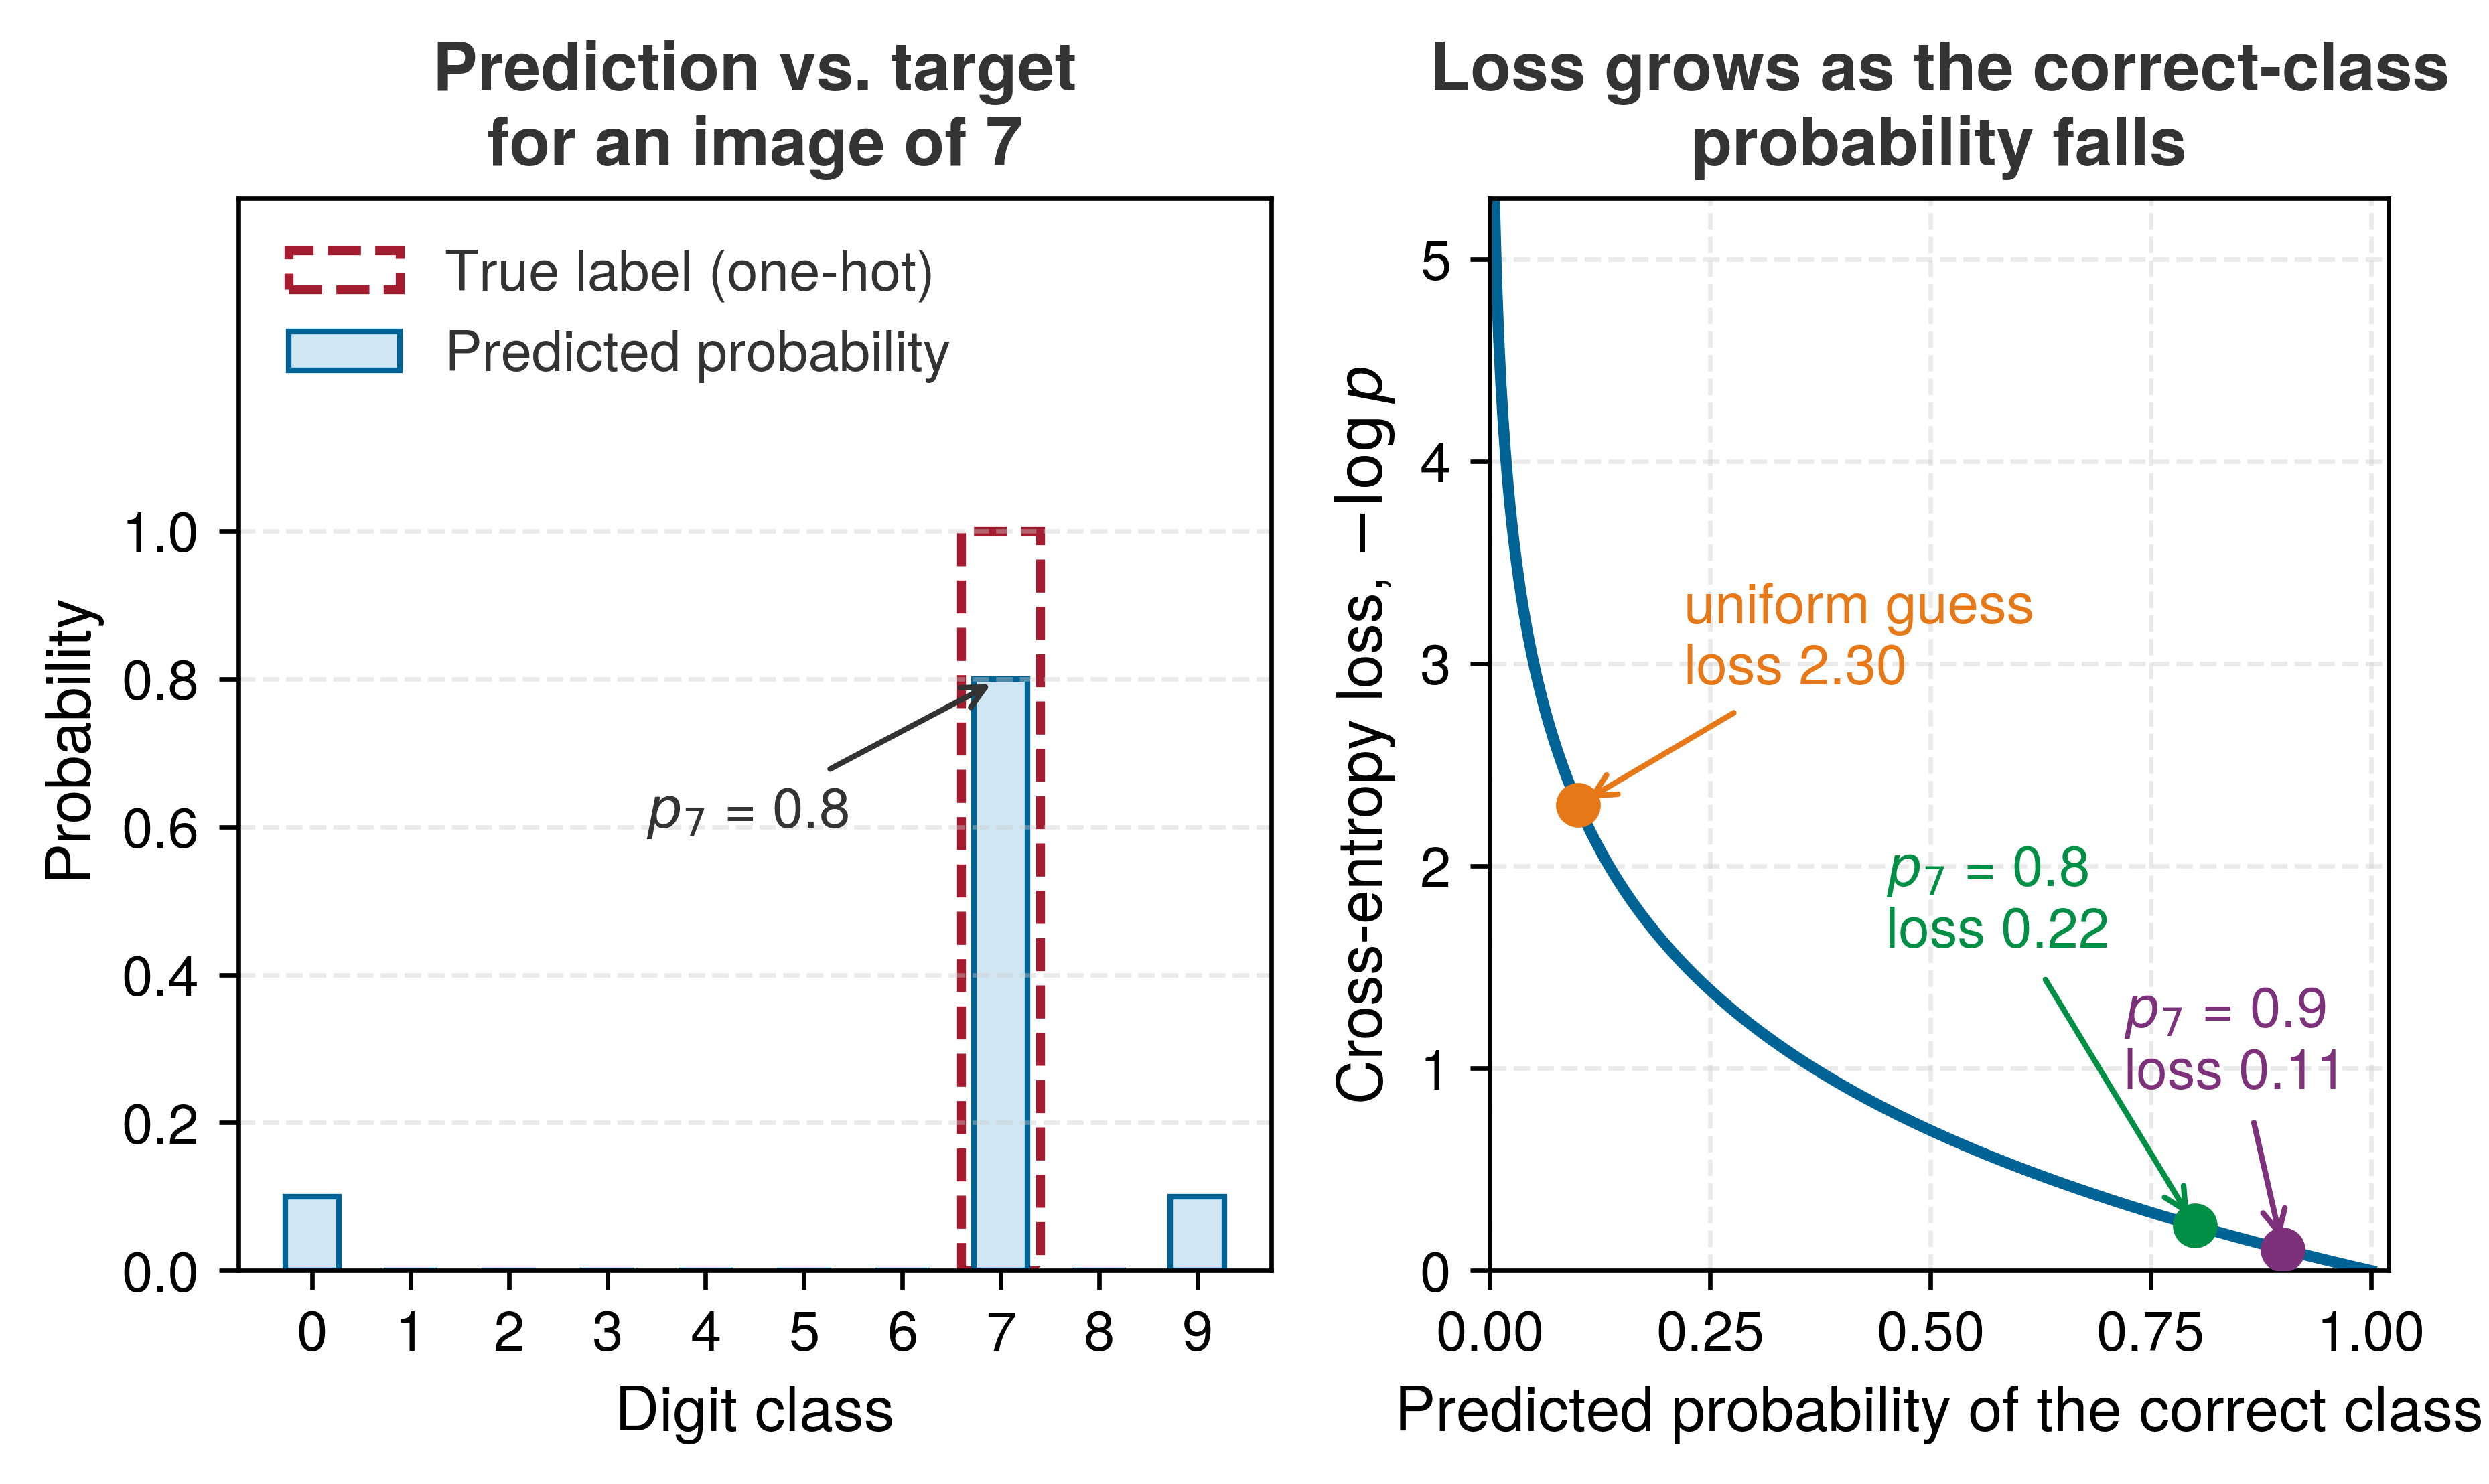
Figure 15: Cross-Entropy Compares a Distribution with a One-Hot Label: Left: the network places 0.8 on the correct class and 0.1 each on digits 0 and 9, while the target places all of its mass on the correct class. Right: because the target is one-hot, the loss reduces to the negative log of the correct-class probability. A uniform guess over ten classes costs about 2.3, a confident correct prediction costs little, and the penalty grows without bound as the probability assigned to the truth approaches zero.

The loss is \(-\log(0.8)\), approximately 0.223. If the network were more confident and predicted 0.9 for the correct digit, the loss would decrease to approximately 0.105. The right panel of figure 15 shows why the logarithm suits training. Raising a correct-class probability that is already high earns little, while a confident mistake, a small probability on the true digit, produces a large loss and therefore a large corrective gradient.

Batch loss calculation methods

Evaluating cross-entropy naively across a batch can crash a training run in a single step: if an unshifted softmax rounds a tiny correct-class probability down to zero in finite floating-point arithmetic, \(\log(0)\) evaluates to \(-\infty\) and subsequent gradient arithmetic produces a not-a-number value (NaN). For a batch of \(\BatchSize\) examples, the cross-entropy objective averages the per-example losses across all examples (equation 19): \[ \BatchLoss = -\frac{1}{\BatchSize}\sum_{i=1}^\BatchSize\sum_{j=1}^{10} \BatchLabelComponent \log(\BatchPredictedProbability) \tag{19}\]

Here, \(\ExampleIndex\) indexes examples in the batch, \(\ClassIndex\) indexes the ten output classes, \(\BatchLabelComponent\) is the one-hot target indicator for class \(\ClassIndex\) on example \(\ExampleIndex\), and \(\BatchPredictedProbability\) is the predicted probability for that class. Averaging over \(\BatchSize\) keeps the loss scale comparable as batch size changes, but each term in the sum must stay within the floating-point format’s representable range.

Stable implementations avoid materializing a numerically fragile probability before taking its logarithm:

  1. Shift logits before exponentiation, the core of the log-sum-exp trick collected for reference in Logits and numerical stability; equation 20 subtracts the largest logit from every exponent: \[ \text{softmax}(\NeuronPreactivation_i) = \frac{\exp\big(\NeuronPreactivation_i - \max(\PreactivationVector)\big)}{\sum_j \exp\big(\NeuronPreactivation_j - \max(\PreactivationVector)\big)} \tag{20}\]

Subtracting the same \(\max(\PreactivationVector)\) from every logit leaves the softmax probabilities unchanged because the common factor cancels between numerator and denominator. The numerical effect is decisive: the largest shifted logit becomes zero, so the largest exponential is \(\exp(0)=1\) rather than a potentially overflowing value.

  1. Prefer fused cross-entropy from logits. For target class \(\CorrectClassIndex\) and \(\MaximumLogit=\max(\PreactivationVector)\), a stable implementation evaluates \[ \LossFunction= -(\CorrectClassLogit-\MaximumLogit) + \log\!\sum_j \exp(\NeuronPreactivation_j-\MaximumLogit) \tag{21}\] Equation 21 is mathematically equivalent to \(-\log \CorrectClassProbability\) but never rounds a tiny softmax probability to zero first. Clamping a probability or adding \(\NumericalStabilityConstant\) can be a defensive fallback, but it changes the objective and should not replace the stable formulation.

Impact on learning dynamics

With a batch size of 32 and 10 output classes, each training step processes 32 sets of 10 scores, computes a loss for each example, and averages them into one batch loss. During training, that value serves two roles: its gradient supplies the update direction, and its trend helps diagnose whether optimization is progressing, stalling, or diverging. For the MNIST classifier, training loss often begins near \(\log(10) \approx 2.3\) when class probabilities are close to uniform, falls rapidly during early optimization, and then improves more slowly. Because a low training loss reflects confidence on the training examples rather than proof of generalization, task accuracy, calibration, and validation loss must still be measured separately on held-out data.

The loss function’s gradients with respect to the network’s output logits provide the initial error signal that drives backpropagation. For one example, when softmax and cross-entropy are combined, each logit gradient has a particularly simple form: the difference between the predicted and target probabilities, \(\PredictedOutputComponent_j - \TrueLabelComponent_j\) for logit \(\NeuronPreactivation_j\). This property makes cross-entropy loss especially suitable for classification, because it provides strong gradients even when predictions are far from the target. The same cancellation is the main reason runtimes fuse softmax and cross-entropy into a single operator, which collapses the backward step to the subtraction \(\PredictedOutput - \LabelVector\), saves a separate kernel and its memory round trip, and avoids an underflow-prone probability tensor.

The choice of loss function also influences other training decisions. Gradient scale interacts with the learning rate, while loss averaging across batches affects gradient noise and thus the useful batch-size regime. Curvature influences optimizer behavior, and convergence decisions require validation metrics and a stopping rule rather than the training-loss trajectory alone.

5.4.4 Gradient descent and parameter updates

The loss gives training a single number to reduce, and gradient descent is the rule for reducing it. Consider one weight \(\ModelWeight\) and the batch loss plotted against it, as in figure 16. At the current value of \(\ModelWeight\), the curve has a slope \(\partial \LossFunction/\partial \ModelWeight\), which is the gradient previewed in section 5.3.2.2. A positive slope means that increasing \(\ModelWeight\) raises the loss, so the weight should move down; a negative slope means it should move up. Taking a small step against the slope, recomputing the slope, and stepping again walks the weight downhill toward lower loss. A network has one such slope per parameter. Collecting them gives the gradient vector \(\nabla_{\ModelParameters}\LossFunction\), which points in the direction of steepest loss increase, and each update steps the opposite way.

Definition 5.4: Gradient descent

Gradient descent is the iterative optimization algorithm that updates model parameters in the direction of the negative gradient, \(\ModelParameters \leftarrow \ModelParameters - \LearningRate \nabla_\ModelParameters \LossFunction\) with learning rate \(\LearningRate\), trading computational steps \((\Operations)\) for loss reduction.

  1. Significance: The update rule itself sets a memory floor. Every parameter needs a gradient of the same size, so in FP32 plain gradient descent holds 8 bytes per parameter (the weight plus its gradient) before counting saved activations. Optimizers that keep extra per-parameter state raise that floor, as the training-memory estimate later in this chapter shows, and Memory management develops the complete accounting.
  2. Distinction: Backpropagation computes gradients (the “what to change” signal); an optimizer applies updates (the “change it” action).
  3. Common pitfall: A frequent misconception is that gradient descent finds the global minimum. Neural network loss landscapes are nonconvex with many local minima, saddle points, and plateaus. In practice, gradient descent and its variants converge to regions of low loss that generalize well, but the path depends on the learning rate schedule, batch size, and initialization.

Gradient descent turns each parameter’s gradient into a parameter change, using each weight’s local loss sensitivity to reduce the loss over successive steps. The fundamental update rule is defined in equation 22: \[ \UpdatedModelParameters= \CurrentModelParameters- \LearningRate \nabla_{\ModelParameters}\LossFunction \tag{22}\] where \(\ModelParameters\) represents the collection of network parameters (weights and biases), \(\LearningRate\) is the learning rate, and \(\nabla_{\ModelParameters}\LossFunction\) is the gradient of the loss with respect to those parameters, which backpropagation (section 5.4.5) computes efficiently.

For the digit classifier, the update aims to reduce the chosen loss. If the network frequently confuses “seven”s with “one”s, the loss gradients from those examples guide the weight changes. The learning rate \(\LearningRate\) controls adjustment magnitude. Values that are too large overshoot good parameters, values that are too small converge slowly, and the right value shifts with batch size, a coupling Batch size and parameter updates develops. Figure 16 shows the first failure on a single weight, where every step lands on the far side of the minimum.
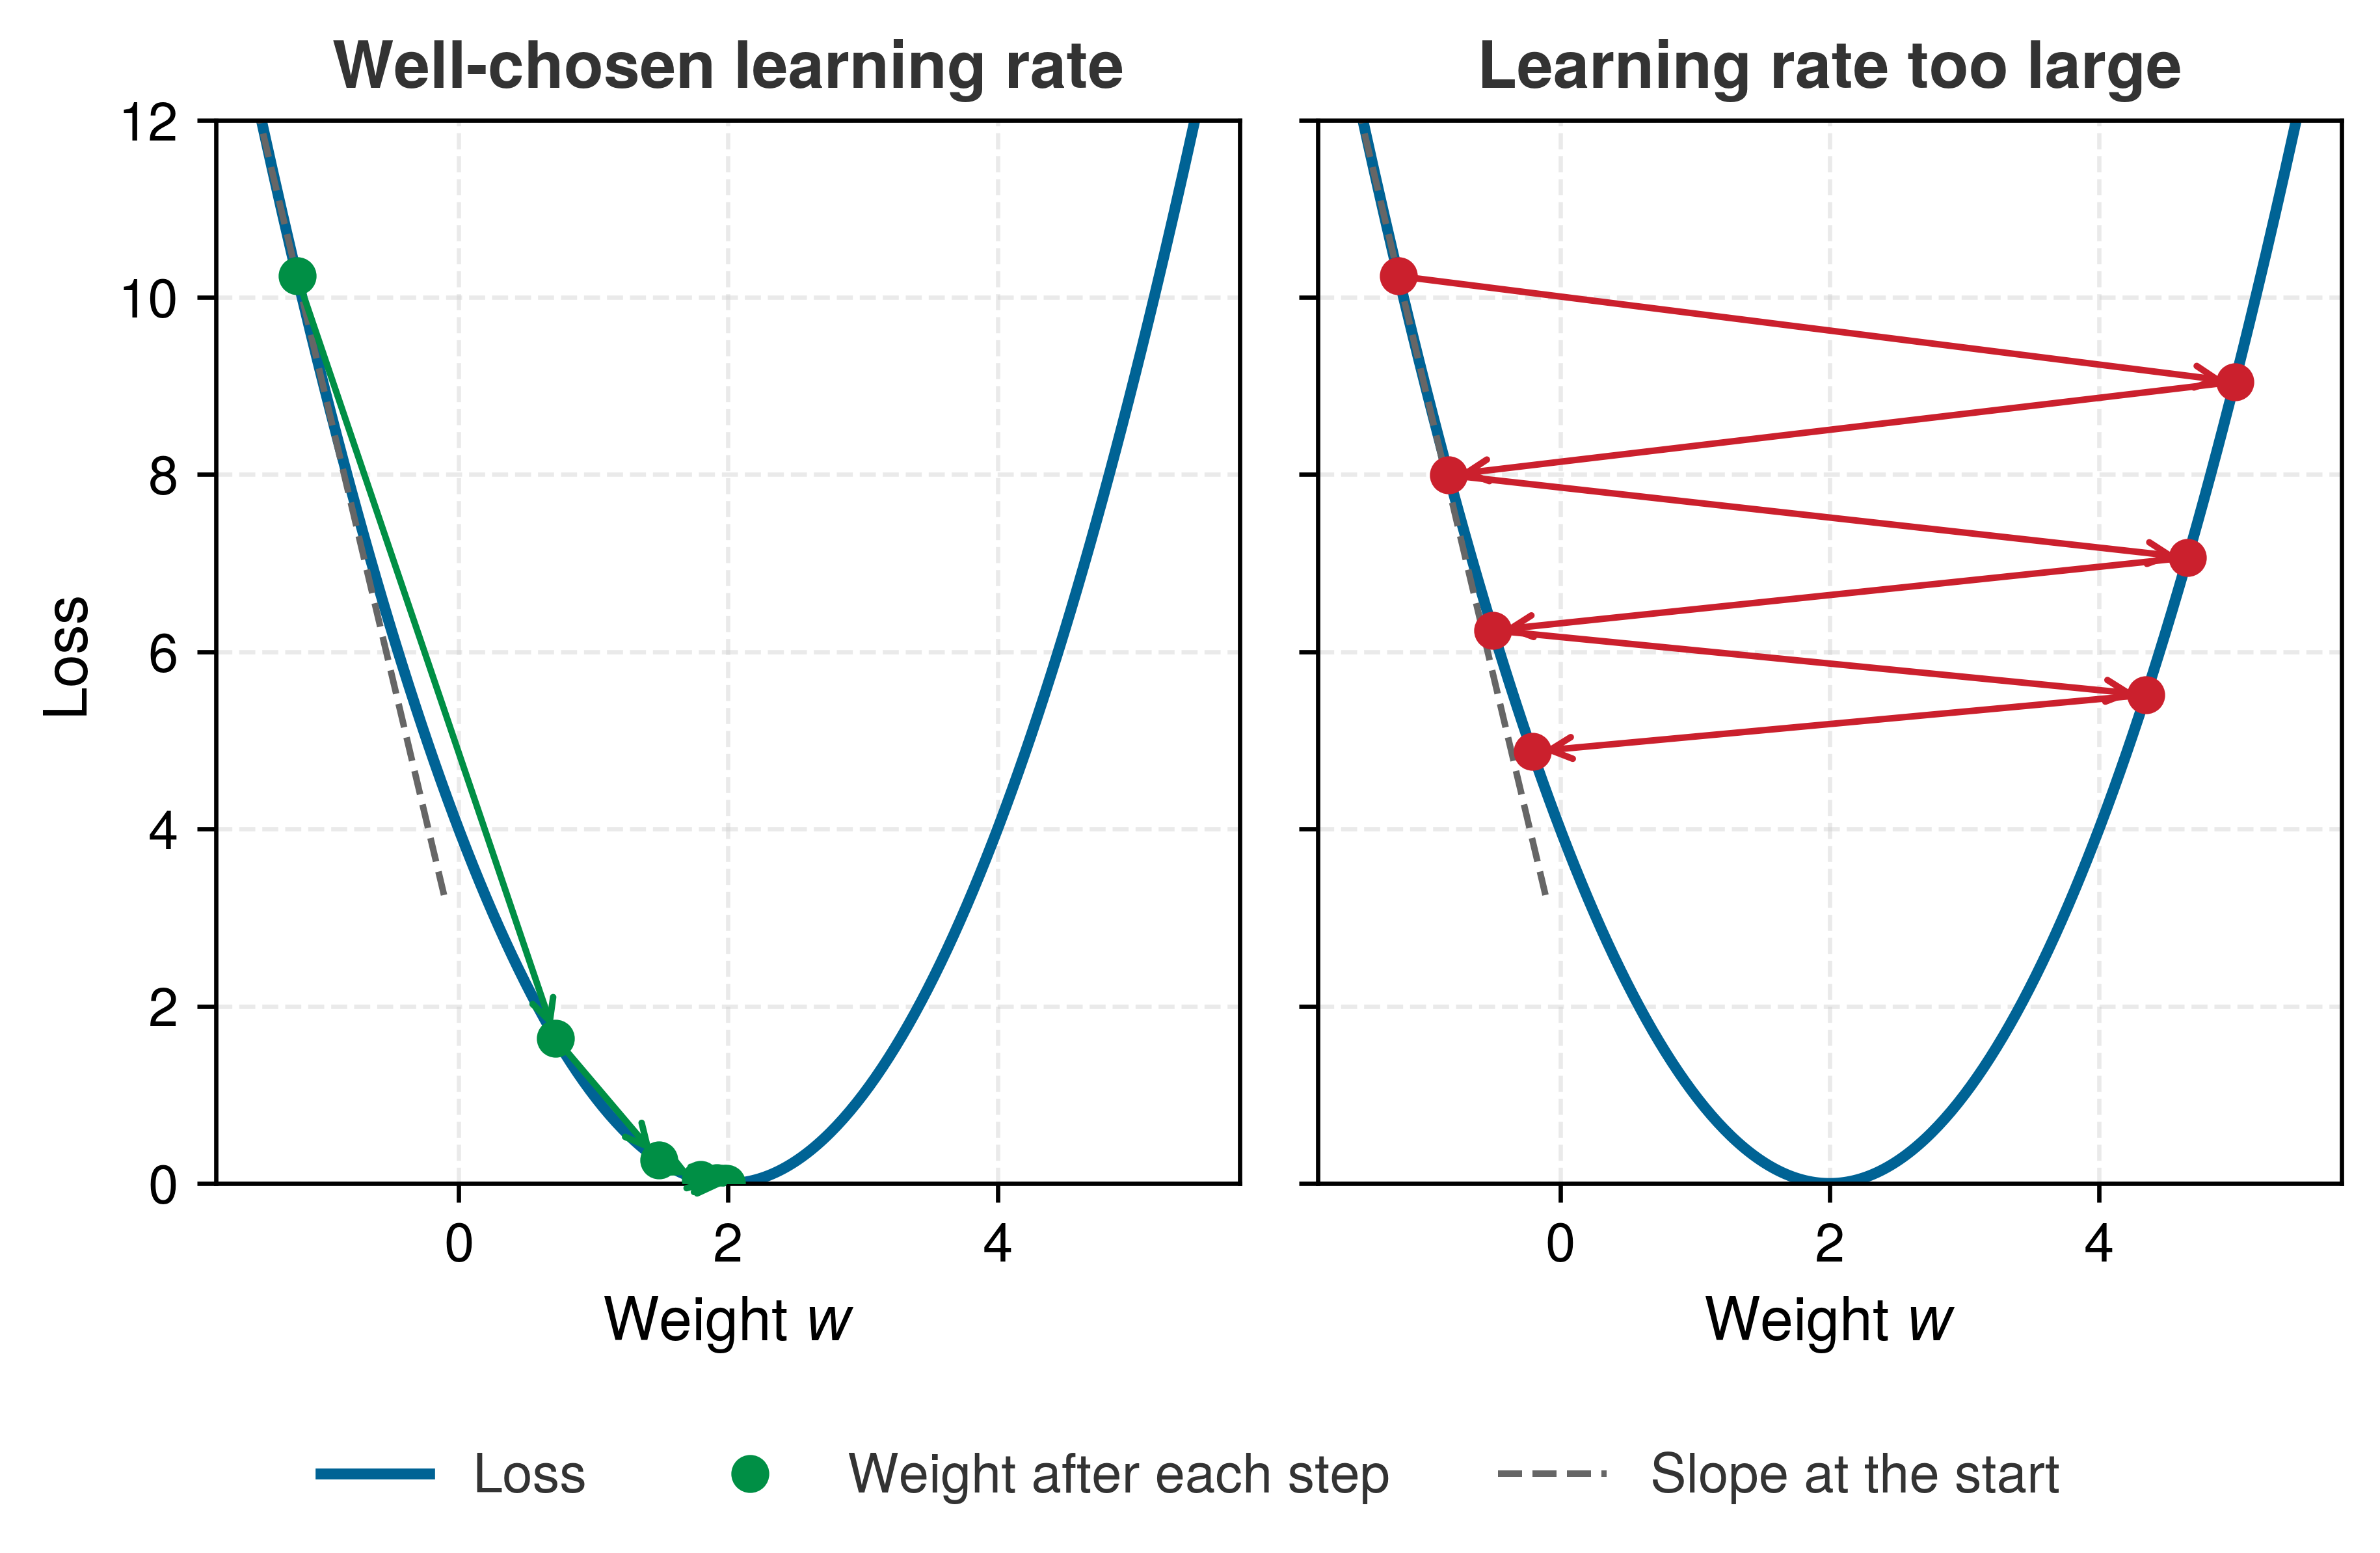
Figure 16: Gradient Descent on One Weight: An illustrative loss curve for a single weight, with each step moving the weight against the local slope by an amount proportional to the learning rate. Left: a well-chosen learning rate takes large steps where the slope is steep and smaller ones as the slope flattens near the minimum. Right: a learning rate close to the limit this curve tolerates overshoots the minimum on every step, so the weight oscillates from side to side and approaches the minimum only slowly; a slightly larger rate would diverge.

Plain gradient descent applies equation 22 directly to every weight. Practical optimizers refine it by adapting the step size for each parameter or by carrying momentum across iterations. No optimizer is universally best across all possible problems (Wolpert and Macready 1997), so neural-network training depends on choosing update rules and hyperparameters that match the model, data, and hardware constraints.

Wolpert, D. H., and W. G. Macready. 1997. “No Free Lunch Theorems for Optimization.” IEEE Transactions on Evolutionary Computation 1 (1): 67–82. https://doi.org/10.1109/4235.585893.
Neyshabur, Behnam, Srinadh Bhojanapalli, David McAllester, and Nati Srebro. 2017. “Exploring Generalization in Deep Learning.” Advances in Neural Information Processing Systems 30.

Despite neural network loss landscapes being highly nonconvex, gradient-based methods often find useful solutions when the model, data, initialization, and optimization regime are well matched. Why they do remains an active research question; one line of work, for example, studies the implicit bias of gradient descent, its tendency to settle on simple solutions among the many that fit the training data equally well (Neyshabur et al. 2017). For practical ML systems engineering, the consequence is empirical. Learning rates, initialization, regularization, and the training configuration must be validated together.

Mini-batch gradient updates

Applied to mini-batches (Definition 5.2), gradient descent becomes mini-batch gradient descent, which averages the gradients over the batch and performs one update instead of updating the weights after each individual image. For a batch of size \(\BatchSize\), with \(\LossFunction_i\) denoting the loss for example \(\ExampleIndex\), the mean loss gradient is equation 23: \[ \nabla_{\ModelParameters}\BatchLoss = \frac{1}{\BatchSize}\sum_{i=1}^\BatchSize\nabla_{\ModelParameters}\LossFunction_i \tag{23}\]

With a typical batch size of 32, the system performs one forward pass over 32 images, computes 32 per-example losses, averages their gradients, and applies a single weight update. That average smooths noisy per-example gradients, but it also means the accelerator must keep the batch’s activations available until the backward pass consumes them. Batch size therefore influences available parallelism and utilization together with model shape, kernel implementation, and hardware. When the batch that optimization wants does not fit in accelerator memory, gradient accumulation splits it into micro-batches whose gradients are summed before a single update, a technique Gradient accumulation develops with its numerical caveats.

5.4.5 Gradient computation and backpropagation

Gradient descent assumes the gradient is already in hand, but the loss alone does not tell the system how sensitive it is to each parameter. With 109,386 parameters in the MNIST network, estimating every derivative through independent perturbations would be computationally prohibitive. This is the credit assignment problem (Minsky 1961): connecting the final error to the parameters and intermediate values that can change it. Backpropagation solves it by applying the chain rule to compute all of those local sensitivities in one backward traversal.

Minsky, Marvin. 1961. “Steps Toward Artificial Intelligence.” Proceedings of the IRE 49 (1): 8–30. https://doi.org/10.1109/JRPROC.1961.287775.
Definition 5.5: Backpropagation

Backpropagation is the gradient-computation algorithm training systems use to apply the chain rule to a computational graph, using recorded operations and saved or recomputed forward-pass values to compute the gradient of the loss with respect to every parameter in a single backward traversal.

  1. Significance: For dense layers that require both parameter and input gradients, the backward pass costs on the order of twice the forward-pass FLOPs (a ratio derived from the layer equations later in this section) and requires retaining or recomputing the intermediate values needed by the chain rule. For a model with \(\LayerCount\) layers, batch size \(\BatchSize\), and layer widths \(\LayerWidth_1,\ldots,\FinalLayerWidth\), the stored activations scale, in a simplified count, as \(\mathcal{O}\!\left(\BatchSize\sum_{\LayerIndex=1}^{\LayerCount} \LayerWidth_\LayerIndex\right)\). Gradients and optimizer state add further memory, so a model that fits on one accelerator for inference may not fit there for training.
  2. Distinction: Numerical differentiation requires a perturbed evaluation for each of the model’s \(\Parameters\) parameters. Reverse-mode automatic differentiation computes all \(\Parameters\) gradients in one backward traversal whose cost is proportional to the computational graph, avoiding \(\Parameters\) separate forward passes.
  3. Common pitfall: A frequent misconception is that backpropagation is learning. It is a gradient computation algorithm; gradient descent performs the actual parameter update. Confusing the two hides which one sets activation storage and which sets optimizer state.

A car factory gives a concrete version of the same credit-assignment problem. Vehicles pass through four stations: frame installation (A), engine mounting (B), wheel attachment (C), and final assembly (D). When inspectors find a defective car, they work backward from the defect to trace responsibility through each station: how much D’s assembly contributed vs. what it received from C, and how much C’s work contributed vs. what came from B. Each station receives adjustment feedback proportional to its contribution, so if Station B’s engine mounting was the primary cause, it receives the strongest signal to change.

Backpropagation follows an analogous backward trace, with each layer in the role of a station, but it computes sensitivity rather than causal blame. Starting from the loss, it evaluates how a small change in each layer’s inputs would change that loss and propagates those derivatives backward by the chain rule of calculus. The gradient at the output layer plays the part of Station D’s adjustment signal, each partial derivative is one station’s local sensitivity, and the optimizer later converts the resulting parameter gradients into actual updates.

The sensitivity is local to the current parameter values, input batch, and loss. It answers a counterfactual question, how an infinitesimal change here would change this loss, not whether a weight is permanently important or historically caused the prediction. A framework computes it mechanically by recording each operation in a computational graph and replaying that graph in reverse from the scalar loss, the reverse-mode mechanism that Reverse mode develops. For a dense network the replay reduces to the layer-by-layer procedure below.

↪ How an eager framework builds that graph on the fly, one operation at a time, is developed in Eager execution with dynamic graphs.

Backpropagation algorithm steps

Take the running example in which the network predicts a “three” for an image of a “seven.” Backward propagation systematically calculates how the loss would respond to a small change in each weight at the current parameter values. The process begins at the network’s output, where the predicted digit probabilities are compared with the true label, and the resulting loss gradient flows backward through the network, giving the local sensitivity of the loss to each layer’s values and weights. That calculation follows the chain rule18 of calculus, breaking down the relationship between weights and loss into local layer steps.

18 Chain rule: The calculus identity \(\frac{\partial \LossFunction}{\partial \ModelWeight} = \frac{\partial \LossFunction}{\partial \NeuronActivation^{(\LayerCount)}} \cdot \frac{\partial \NeuronActivation^{(\LayerCount)}}{\partial \NeuronActivation^{(\LayerCount-1)}} \cdots \frac{\partial \NeuronActivation^{(1)}}{\partial \ModelWeight}\) becomes a product of \(\LayerCount\) terms for an \(\LayerCount\)-layer network. If each partial derivative is slightly less than one, the product vanishes exponentially; if slightly greater, it explodes. This multiplicative structure makes depth a systems constraint rather than an arbitrary design choice: it dictates the numerical precision requirements and initialization strategies (Glorot and Bengio 2010; He et al. 2015) needed to keep training stable.

He, Kaiming, Xiangyu Zhang, Shaoqing Ren, and Jian Sun. 2015. “Delving Deep into Rectifiers: Surpassing Human-Level Performance on ImageNet Classification.” 2015 IEEE International Conference on Computer Vision (ICCV), 1026–34. https://doi.org/10.1109/iccv.2015.123.
Wengert, Ralph E. 1964. “A Simple Automatic Derivative Evaluation Program.” Communications of the ACM 7 (8): 463–64. https://doi.org/10.1145/355586.364791.

Evaluating these chain-rule products by machine predates modern networks. Wengert presented automatic numerical derivative evaluation without requiring analytical derivative expressions (Wengert 1964), an ancestor of the automatic differentiation that frameworks now perform. The chain rule for composed layers is collected for reference in The chain rule and automatic differentiation, which also shows why reverse-mode automatic differentiation computes all parameter gradients in a single backward pass. The implementation contract in algorithm 1 follows from that order, because the forward pass must save the values that the backward pass will need.

Saving activations in the forward loop of algorithm 1 is where the systems cost enters: each activation stays live until the backward pass reaches its layer, so activation memory scales with batch size, layer count, and activation width. This is why training can exceed inference memory even when the parameter count is unchanged.

Error signal propagation

The saved activations are consumed by an error signal that travels the network in reverse, starting from the loss at the output layer and computing how the loss is locally sensitive to each layer and, ultimately, each weight.

A scalar case shows the rule before the matrix form. If \(\ChainRuleOutput= 3\ChainRuleIntermediate\) and \(\ChainRuleIntermediate= \ChainRuleInput^2\), a small change in \(\ChainRuleInput\) changes \(\ChainRuleIntermediate\) by \(2\ChainRuleInput\) per unit, and each unit change in \(\ChainRuleIntermediate\) changes \(\ChainRuleOutput\) by 3, so \(d\ChainRuleOutput/d\ChainRuleInput= 3 \cdot 2\ChainRuleInput\). Backpropagation applies this multiply-the-local-slopes rule layer by layer. With many units per layer, each local slope becomes a matrix of slopes, called a Jacobian, but the rule is unchanged. For a network with \(\LayerCount\) layers, the gradient flow can then be expressed mathematically. At each layer \(\LayerIndex\), the sensitivity of the final loss to that layer’s output is governed by the chain rule and the schematic Jacobian notation in equation 24: \[ \frac{\partial \LossFunction}{\partial \ActivationMatrix^{(\LayerIndex)}} = \frac{\partial \LossFunction}{\partial \ActivationMatrix^{(\LayerIndex+1)}} \frac{\partial \ActivationMatrix^{(\LayerIndex+1)}}{\partial \ActivationMatrix^{(\LayerIndex)}} \tag{24}\]

This computation cascades backward through the network, with each layer’s gradients depending on those from the layer above it. Notebook 5.2 traces these equations with numbers on a two-unit network and can be read first if the matrix form is unfamiliar. The reverse order also fixes when memory peaks. The forward pass finishes holding every layer’s output, the backward pass releases them from the last layer to the first as it consumes them, and gradients accumulate as it goes. A training step’s memory therefore peaks at the turnaround between the two passes when saved activations dominate, or late in the backward pass when parameter state and accumulated gradients do, and section 5.4.5.5 shows both cases for the running network.

Initialization and numerical range

Setting all initial weights to zero causes every neuron in a layer to compute the exact same output and receive the exact same gradient, locking the layer into symmetric updates that prevent diverse feature learning, while starting with random weights that are systematically too large or too small compounds across layers into exploding or vanishing signals, the same multiplicative failure that saturating activations cause (section 5.3.2.2.1). Parameter initialization breaks symmetry and controls signal scale from the first step: weights are drawn randomly from variance-scaled distributions such as Xavier/Glorot initialization19 (Glorot and Bengio 2010) or He initialization (He et al. 2015), while biases start at small constant values or zeros.

19 Xavier/Glorot initialization: For a layer with \(\LayerInputWidth\) inputs and \(\LayerOutputWidth\) outputs, a common Glorot choice uses weight variance \(2/(\LayerInputWidth+\LayerOutputWidth)\) to balance forward activations and backward gradients (Glorot and Bengio 2010). The fix costs zero additional FLOPs; it is purely a matter of setting the random distribution at startup.

Glorot, Xavier, and Yoshua Bengio. 2010. “Understanding the Difficulty of Training Deep Feedforward Neural Networks.” Proceedings of the Thirteenth International Conference on Artificial Intelligence and Statistics (AISTATS) 9: 249–56.

20 FP32 and reduced-precision formats: The IEEE 754 binary32 format uses 32 bits (1 sign bit, 8 exponent bits, 23 fraction bits), whereas 16-bit alternatives split exponent and fraction differently: IEEE 754 FP16 allocates 5 exponent and 10 fraction bits, providing high precision but a narrow dynamic range (\(6.1 \times 10^{-5}\) to \(65{,}504\)), so FP16 training multiplies the loss by a scale factor before the backward pass to keep small gradients representable (dynamic loss scaling). Brain Floating Point (BF16) allocates 8 exponent bits matching FP32’s normal exponent range to reduce underflow risk relative to FP16; sufficiently small values can still underflow. The loss-scaling recipe belongs to the mixed-precision training of Mixed-precision training; the formats are collected for reference in Numerical Representations.

Initialization sets the starting scale, but the backward cascade still multiplies it layer after layer. As gradients flow backward through many layers, they can vanish or explode. Vanishing also has a numeric form, because each floating-point format has a smallest magnitude it can store at full precision, \(1.18 \times 10^{-38}\) in FP32 and \(6.10 \times 10^{-5}\) in FP16, the 2-byte half-precision format that halves memory and traffic relative to 4-byte FP32.20 Below it, values enter the subnormal range, where the format gives up precision bits to represent ever-smaller magnitudes. Some accelerator modes skip that range for speed and flush such values straight to zero, and values smaller still underflow to zero on any hardware. A gradient that reaches zero this way stops updating its weight entirely. At the other extreme, values beyond the representable maximum can overflow to Inf and propagate NaN, destabilizing training.

Arithmetic without branches is not arithmetic without risk, and the danger of an unhandled overflow is not unique to machine learning. Safety-critical systems have failed catastrophically when a numerical invariant was violated.

War Story 5.1: The overflow that became guidance (1996)
Context: The European Space Agency’s Ariane 5 Flight 501 reused inertial reference software from Ariane 4, including numeric conversions whose assumptions matched the older vehicle’s flight profile (European Space Agency 1996).

Mechanism: Ariane 5’s flight profile caused a 64-bit floating-point value to exceed the range of a signed 16-bit integer during conversion, triggering an unhandled operand error.

Impact: About 37 seconds after liftoff, both inertial reference units had shut down, and the on-board computer read the active unit’s diagnostic output as flight data. The launcher veered off its flight path, broke up, and self-destructed.

Response: The inquiry recommended limiting software to functions required during flight, reviewing range assumptions, and designing exception handling so a single conversion failure could not disable redundant units (European Space Agency 1996).

Systems lesson: Numerical ranges, exception handling, and reuse assumptions are part of the systems contract. A computation can be syntactically correct and still be invalid for the physical regime in which it runs. ML systems hit this whenever a numerical format’s representable range fails to match the magnitudes flowing through it. A low-precision multiplication that overflows produces an Inf or NaN that propagates silently through the rest of the computation, making numerical regimes as important to debugging as control flow.

European Space Agency. 1996. Ariane 501: Presentation of Inquiry Board Report. European Space Agency press release.

Range and precision decide whether a gradient survives the backward pass at all. What computing it costs is set by the derivative calculation at each layer.

Derivative calculation process

Computing gradients involves calculating several partial derivatives at each layer: how changes in weights, biases, and activations affect the final loss. These computations follow directly from the chain rule of calculus but must be implemented efficiently for practical training. For a hidden layer \(\LayerIndex\) with an element-wise activation, backpropagation first transforms the incoming signal and then computes weight, bias, and input gradients:

First, the incoming error signal \(\frac{\partial \LossFunction}{\partial \ActivationMatrix^{(\LayerIndex)}}\) is transformed into the preactivation gradient \(\frac{\partial \LossFunction}{\partial \PreactivationMatrix^{(\LayerIndex)}}\) by multiplying element-wise (\(\odot\)) with the local activation function derivative (equation 25): \[ \frac{\partial \LossFunction}{\partial \PreactivationMatrix^{(\LayerIndex)}} = \frac{\partial \LossFunction}{\partial \ActivationMatrix^{(\LayerIndex)}} \odot \ActivationFunction'(\PreactivationMatrix^{(\LayerIndex)}) \tag{25}\] For ReLU activations, \(\ActivationFunction'(\PreactivationMatrix^{(\LayerIndex)})\) acts as a binary mask, passing gradients through active neurons (\(\NeuronPreactivation> 0\)) and zeroing out inactive ones. The classifier’s softmax output couples coordinates, so it does not use this element-wise rule. Instead, its backward pass begins with the combined softmax/cross-entropy logit gradient stated in section 5.4.3.4, predicted probability minus target for each class. For mean batch loss, each example’s predicted-minus-target signal is divided by \(\BatchSize\) at that starting point. The weight, bias, and input products below then propagate the already-normalized signal, applying the batch mean only once.

Weight gradients measure the local sensitivity of the final loss to each weight. With a batch size of \(\BatchSize\), layer input dimension \(\PreviousLayerWidth\), and layer output dimension \(\CurrentLayerWidth\), the incoming activation matrix has shape \(\ActivationMatrix^{(\LayerIndex-1)} \in \mathbb{R}^{\BatchSize\times \PreviousLayerWidth}\) and the sensitivity matrix has shape \(\frac{\partial \LossFunction}{\partial \PreactivationMatrix^{(\LayerIndex)}} \in \mathbb{R}^{\BatchSize\times \CurrentLayerWidth}\). The optimizer uses these gradients to determine parameter updates (equation 26): \[ \frac{\partial \LossFunction}{\partial \WeightMatrix^{(\LayerIndex)}} = {\ActivationMatrix^{(\LayerIndex-1)}}^T \frac{\partial \LossFunction}{\partial \PreactivationMatrix^{(\LayerIndex)}} \tag{26}\]

The matrix product \((\PreviousLayerWidth \times \BatchSize) \times (\BatchSize \times \CurrentLayerWidth) \to (\PreviousLayerWidth \times \CurrentLayerWidth)\) contracts over the batch dimension \(\BatchSize\), summing the outer products of activations and sensitivities across all examples in the mini-batch. With the mean-loss normalization already present in the sensitivity matrix, this product needs no further factor of \(1/\BatchSize\).

Bias gradients measure how changing each bias term affects the loss. Since biases shift the activation threshold of neurons, these gradients indicate whether neurons should become more or less easily activated, as expressed in equation 27: \[ \frac{\partial \LossFunction}{\partial \BiasVector^{(\LayerIndex)}} = \AllOnesVector^T \frac{\partial \LossFunction}{\partial \PreactivationMatrix^{(\LayerIndex)}} \tag{27}\]

Here, \(\AllOnesVector\in\mathbb{R}^{\BatchSize}\) is an all-ones vector, so left multiplication sums the per-example bias gradients across the batch. Because that contraction reduces the batch dimension without touching \(\PreviousLayerWidth\), the bias gradient requires only \(\BatchSize \cdot \CurrentLayerWidth\) additions rather than a matrix multiply.

Input gradients propagate the error signal backward to the previous layer. Rather than directly updating parameters, these gradients serve as the “adjustment signals” that allow earlier layers to learn from the final prediction error (equation 28): \[ \frac{\partial \LossFunction}{\partial \ActivationMatrix^{(\LayerIndex-1)}} = \frac{\partial \LossFunction}{\partial \PreactivationMatrix^{(\LayerIndex)}} {\WeightMatrix^{(\LayerIndex)}}^T \tag{28}\]

Here, the product \((\BatchSize \times \CurrentLayerWidth) \times (\CurrentLayerWidth \times \PreviousLayerWidth) \to (\BatchSize \times \PreviousLayerWidth)\) contracts over the output dimension \(\CurrentLayerWidth\), preserving the per-example activation shape for preceding layers. Together, these equations reveal the physical origin of the classic systems rule that the backward pass requires roughly twice the arithmetic of the forward pass. The forward pass executes one matrix multiplication per dense layer, \(\ActivationMatrix^{(\LayerIndex-1)}\WeightMatrix^{(\LayerIndex)}\). The backward pass executes two of the same size, one for the weight gradient (equation 26) and one for the input gradient that carries the signal to the preceding layer (equation 28). A full training step therefore costs about three times the forward FLOPs, one forward product and two backward products per layer. The weight-gradient product trains that layer’s parameters; the input-gradient product supplies the signal needed to train preceding layers. For ordinary parameter training on fixed MNIST images, no preceding trainable layer consumes the gradient with respect to raw pixels, so the first layer’s input-gradient product can be omitted.

For the running network, the dense matrix work is therefore three forward-pass counts minus the first layer’s forward count, or about 2.08× the forward matrix work for this network, before activation derivatives, bias reductions, loss, and optimizer work. Three times the forward matrix work remains a useful approximation when input gradients are needed throughout, or when the omitted first-layer product is a small fraction of total work. The running network makes the exception visible because its first layer accounts for most of its arithmetic.

The running confusion makes these equations concrete. Suppose that, for an image of a seven, the network assigns probability 0.6 to “three” and only 0.1 to “seven,” so the cross-entropy loss, the negative log of the correct-class probability, is about 2.30. The combined softmax and cross-entropy gradient at each logit is the predicted probability minus the target, so the “three” logit receives \(+0.6\), a push downward, the “seven” logit receives \(-0.9\), a push upward, and the other eight logits receive their small predicted probabilities. That ten-value error signal first meets the output layer. Equation 26 multiplies it by the saved 64-value activation of the second hidden layer to produce all 640 output-weight gradients, and equation 28 multiplies it by the transposed output weights to send a 64-value signal back to that hidden layer. The ReLU mask then zeroes the entries of units that were inactive for this image, and the same two products repeat, yielding 8,192 weight gradients and a 128-value signal for the first hidden layer, and finally 100,352 first-layer weight gradients computed from the saved 784 pixel values. No gradient is needed for the pixels themselves. Every step consumed a value saved during the forward pass, which is why training must keep each activation until this trace reaches its layer.

Systems Perspective 5.4: The memory cost of backprop
Activation retention is one component of a broader training-state budget. Under a simplified single-device accounting that excludes temporary workspaces and framework overhead, equation 29 captures the four principal byte counts: \[ \text{Training Memory} \approx \text{Model Weights} + \text{Gradients} + \text{Optimizer States} + \text{Activations} \tag{29}\]

The derivative equations also record which stored values each step depends on:

  • The weight gradient in equation 26 needs the incoming activation \(\ActivationMatrix^{(\LayerIndex-1)}\).
  • The activation derivative may need \(\PreactivationMatrix^{(\LayerIndex)}\) or a compact mask that records which nonlinear units were active.
  • The input gradient in equation 28 needs the layer weights \(\WeightMatrix^{(\LayerIndex)}\).
  • The optimizer consumes the completed parameter gradients and may add momentum, variance, or other state after backpropagation has produced them.

A training system can retain these values for the fastest backward pass, recompute selected values to save memory, or offload and partition state across memory tiers or devices. None of these choices eliminates cost: recomputation spends additional FLOPs, while offload and partitioning introduce data movement and synchronization. For deep networks with large batches, wide activations, or high-resolution inputs, this trade-off can dominate accelerator capacity. Training memory provides the complete training-memory equation and a worked analysis of weights, gradients, optimizer state, and activation costs.

Two inputs, two ReLU hidden units, and one output are enough to trace every backward product with actual numbers.

Napkin Math 5.2: Tracing gradients: A worked backpropagation example
Setup: Consider a network with two inputs, a hidden layer of two neurons (ReLU activation), and one output neuron (no activation, for simplicity). Suppose the current weights and biases are:

  • Hidden layer: \(\WeightMatrix^{(1)} = \begin{bmatrix} 0.5 & -0.3 \\ 0.8 & 0.2 \end{bmatrix}\), \(\BiasVector^{(1)} = [0,\; 0]\)
  • Output layer: \(\WeightMatrix^{(2)} = \begin{bmatrix} 0.6 \\ -0.4 \end{bmatrix}\), \(\NeuronBias^{(2)} = 0\)

Given input \(\InputFeatureVector= [1.0,\; 0.5]\) and target \(\TrueLabelComponent= 1.0\). Because this toy network produces a single number rather than class probabilities, it uses the simpler squared-error loss, half the squared difference between prediction and target: \(\LossFunction= \frac{1}{2}(\PredictedOutputComponent- \TrueLabelComponent)^2\).

Forward pass (to establish the values backpropagation needs):

  • Hidden preactivation: \[\PreactivationVector^{(1)} = \InputFeatureVector\WeightMatrix^{(1)} + \BiasVector^{(1)} = [1.0 \cdot 0.5 + 0.5 \cdot 0.8,\; 1.0 \cdot (-0.3) + 0.5 \cdot 0.2] = [0.9,\; -0.2]\]
  • Hidden activation (ReLU): \(\ActivationVector^{(1)} = [\max(0, 0.9),\; \max(0, -0.2)] = [0.9,\; 0.0]\)
  • Output: \(\PredictedOutputComponent= \ActivationVector^{(1)}\WeightMatrix^{(2)} + \NeuronBias^{(2)} = 0.9 \cdot 0.6 + 0.0 \cdot (-0.4) = 0.54\)
  • Loss: \(\LossFunction= \frac{1}{2}(0.54 - 1.0)^2 = 0.1058\)

Backward pass (applying the chain rule layer by layer):

Step 1: Output layer gradient. The loss gradient with respect to the output is \[\frac{\partial \LossFunction}{\partial \PredictedOutputComponent} = \PredictedOutputComponent- \TrueLabelComponent= 0.54 - 1.0 = -0.46.\] Step 2: Output weight gradients (applying equation 26). Since the output layer has no activation function \[\frac{\partial \LossFunction}{\partial \NeuronPreactivation^{(2)}} = \frac{\partial \LossFunction}{\partial \PredictedOutputComponent} = -0.46, \quad\text{and}\quad \frac{\partial \LossFunction}{\partial \WeightMatrix^{(2)}} = {\ActivationVector^{(1)}}^T \frac{\partial \LossFunction}{\partial \NeuronPreactivation^{(2)}} = \begin{bmatrix} 0.9 \\ 0.0 \end{bmatrix} \cdot (-0.46) = \begin{bmatrix} -0.414 \\ 0.0 \end{bmatrix}\] Step 3: Propagate to hidden layer (applying equation 28). The error signal sent backward is: \[\frac{\partial \LossFunction}{\partial \ActivationVector^{(1)}} = \frac{\partial \LossFunction}{\partial \NeuronPreactivation^{(2)}} {\WeightMatrix^{(2)}}^T = (-0.46) \cdot [0.6,\; -0.4] = [-0.276,\; 0.184]\]

Step 4: Pass through ReLU. The ReLU derivative is one where \(\NeuronPreactivation> 0\) and 0 otherwise, so \[\frac{\partial \LossFunction}{\partial \PreactivationVector^{(1)}} = [-0.276 \cdot 1,\; 0.184 \cdot 0] = [-0.276,\; 0.0].\] The second neuron’s gradient is zeroed because ReLU blocked its forward signal.

Step 5: Hidden weight gradients (applying equation 26): \[\frac{\partial \LossFunction}{\partial \WeightMatrix^{(1)}} = \InputFeatureVector^T \cdot \frac{\partial \LossFunction}{\partial \PreactivationVector^{(1)}} = \begin{bmatrix} 1.0 \\ 0.5 \end{bmatrix} \cdot [-0.276,\; 0.0] = \begin{bmatrix} -0.276 & 0.0 \\ -0.138 & 0.0 \end{bmatrix}\]

Weight updates (with learning rate \(\LearningRate = 0.1\)): Each weight moves opposite to its gradient. For example, \(\LayerWeightEntry^{(1)}_{11}\) updates from \(0.5\) to \(0.5 - 0.1 \cdot (-0.276) = 0.5276\), nudging the network toward the correct output. The second hidden neuron’s weights receive zero updates for this example because ReLU blocked its activation, illustrating the mechanism that can lead to dead neurons if it happens persistently across the training data.

Systems insight: Backpropagation is a data-dependency graph as well as a calculus procedure. Training systems must preserve the forward activations needed by this backward pass, which is why activation memory becomes a first-order systems cost.

In practice an autograd engine performs this bookkeeping, recording each operation during the forward pass and keeping the values its backward rule needs (Execution: From Graphs to Kernels). What it keeps is the activation memory that the worked example below quantifies.

Worked example: Training vs. inference memory

The four terms of equation 29 can now be evaluated for the running network. A single forward pass through the 784 → 128 → 64 → 10 network costs 109,184 MACs, but the memory a training step holds is set by stored state rather than by that arithmetic. At batch size 32 in 32-bit (4-byte) floating-point precision, each of the four terms can be counted in turn.

The first contribution is the model parameters, already tallied layer by layer in table 5. The 109,386 parameters at 4 bytes each occupy 437.5 KB.

Activations are the next contribution. Table 8 records each layer’s activation tensor and its memory cost at batch size 32.

Table 8: MNIST Activation Memory at Batch Size 32: Per-layer activation tensor shapes, value counts, and 32-bit float memory cost during a single forward pass. Input activations dominate the activation table at 100.4 KB; for this small MNIST multilayer perceptron (MLP), the total activation footprint remains below the parameter footprint, while larger batches and deeper networks make activations a central training-memory concern.
Layer Activation Shape Values Memory
Input \(32{\times}784\) 25,088 100.4 KB
Hidden1 \(32{\times}128\) 4,096 16.4 KB
Hidden2 \(32{\times}64\) 2,048 8.2 KB
Output \(32{\times}10\) 320 1.3 KB
Total 31,552 126 KB

Training adds two memory contributions that inference never pays. Gradients occupy the same space as the parameters they update, here 437.5 KB, and the optimizer adds its own state. The Adaptive Moment Estimation (Adam) optimizer,21 a widely used refinement of gradient descent, keeps two running averages for every parameter, one of its recent gradients (the first moment) and one of its recent squared gradients (the second moment), and uses them to adapt each parameter’s step size. Those two buffers occupy twice the parameter size, another 875.1 KB. Table 9 summarizes the per-component memory footprint for training vs. inference.

21 Adam (adaptive moment estimation): Maintains per-parameter first- and second-moment estimates of the gradient, requiring 2\(\times\) additional FP32 memory beyond the parameters themselves (Kingma and Ba 2015). For a 100K-parameter MNIST model this overhead is negligible, but for a 7-billion parameter model it adds ~56 GB, often the difference between fitting on one GPU or requiring partitioning. Adam is widely used because its adaptive updates work robustly across many tasks, but learning rate, schedule, regularization, and memory strategy still require validation.

Kingma, Diederik P., and Jimmy Ba. 2015. “Adam: A Method for Stochastic Optimization.” 3rd International Conference on Learning Representations (ICLR).
Table 9: MNIST Training vs. Inference Memory at Batch Size 32: A simplified FP32 memory estimate for the MNIST MLP. Training retains saved activations and adds gradients plus two Adam buffers; inference uses the peak adjacent-layer buffer. Framework workspace and memory-saving techniques can change the totals.
Component Training Inference
Parameters 437.5 KB 437.5 KB
Activations 126 KB 117 KB
Gradients 437.5 KB —
Optimizer state 875.1 KB —
Total ~1.9 MB ~554 KB

Figure 17 follows the same memory through one training step. At batch 32 the parameter state of weights, gradients, and Adam buffers sets the peak, and the saved activations are a thin layer on top. Multiplying the batch by 32 leaves the parameter state untouched and multiplies the activation layer by 32, until saved activations are most of the memory and the peak moves to the moment the forward pass ends. The same network and the same arithmetic per example can therefore be parameter-bound or activation-bound in memory, and the batch size decides which.
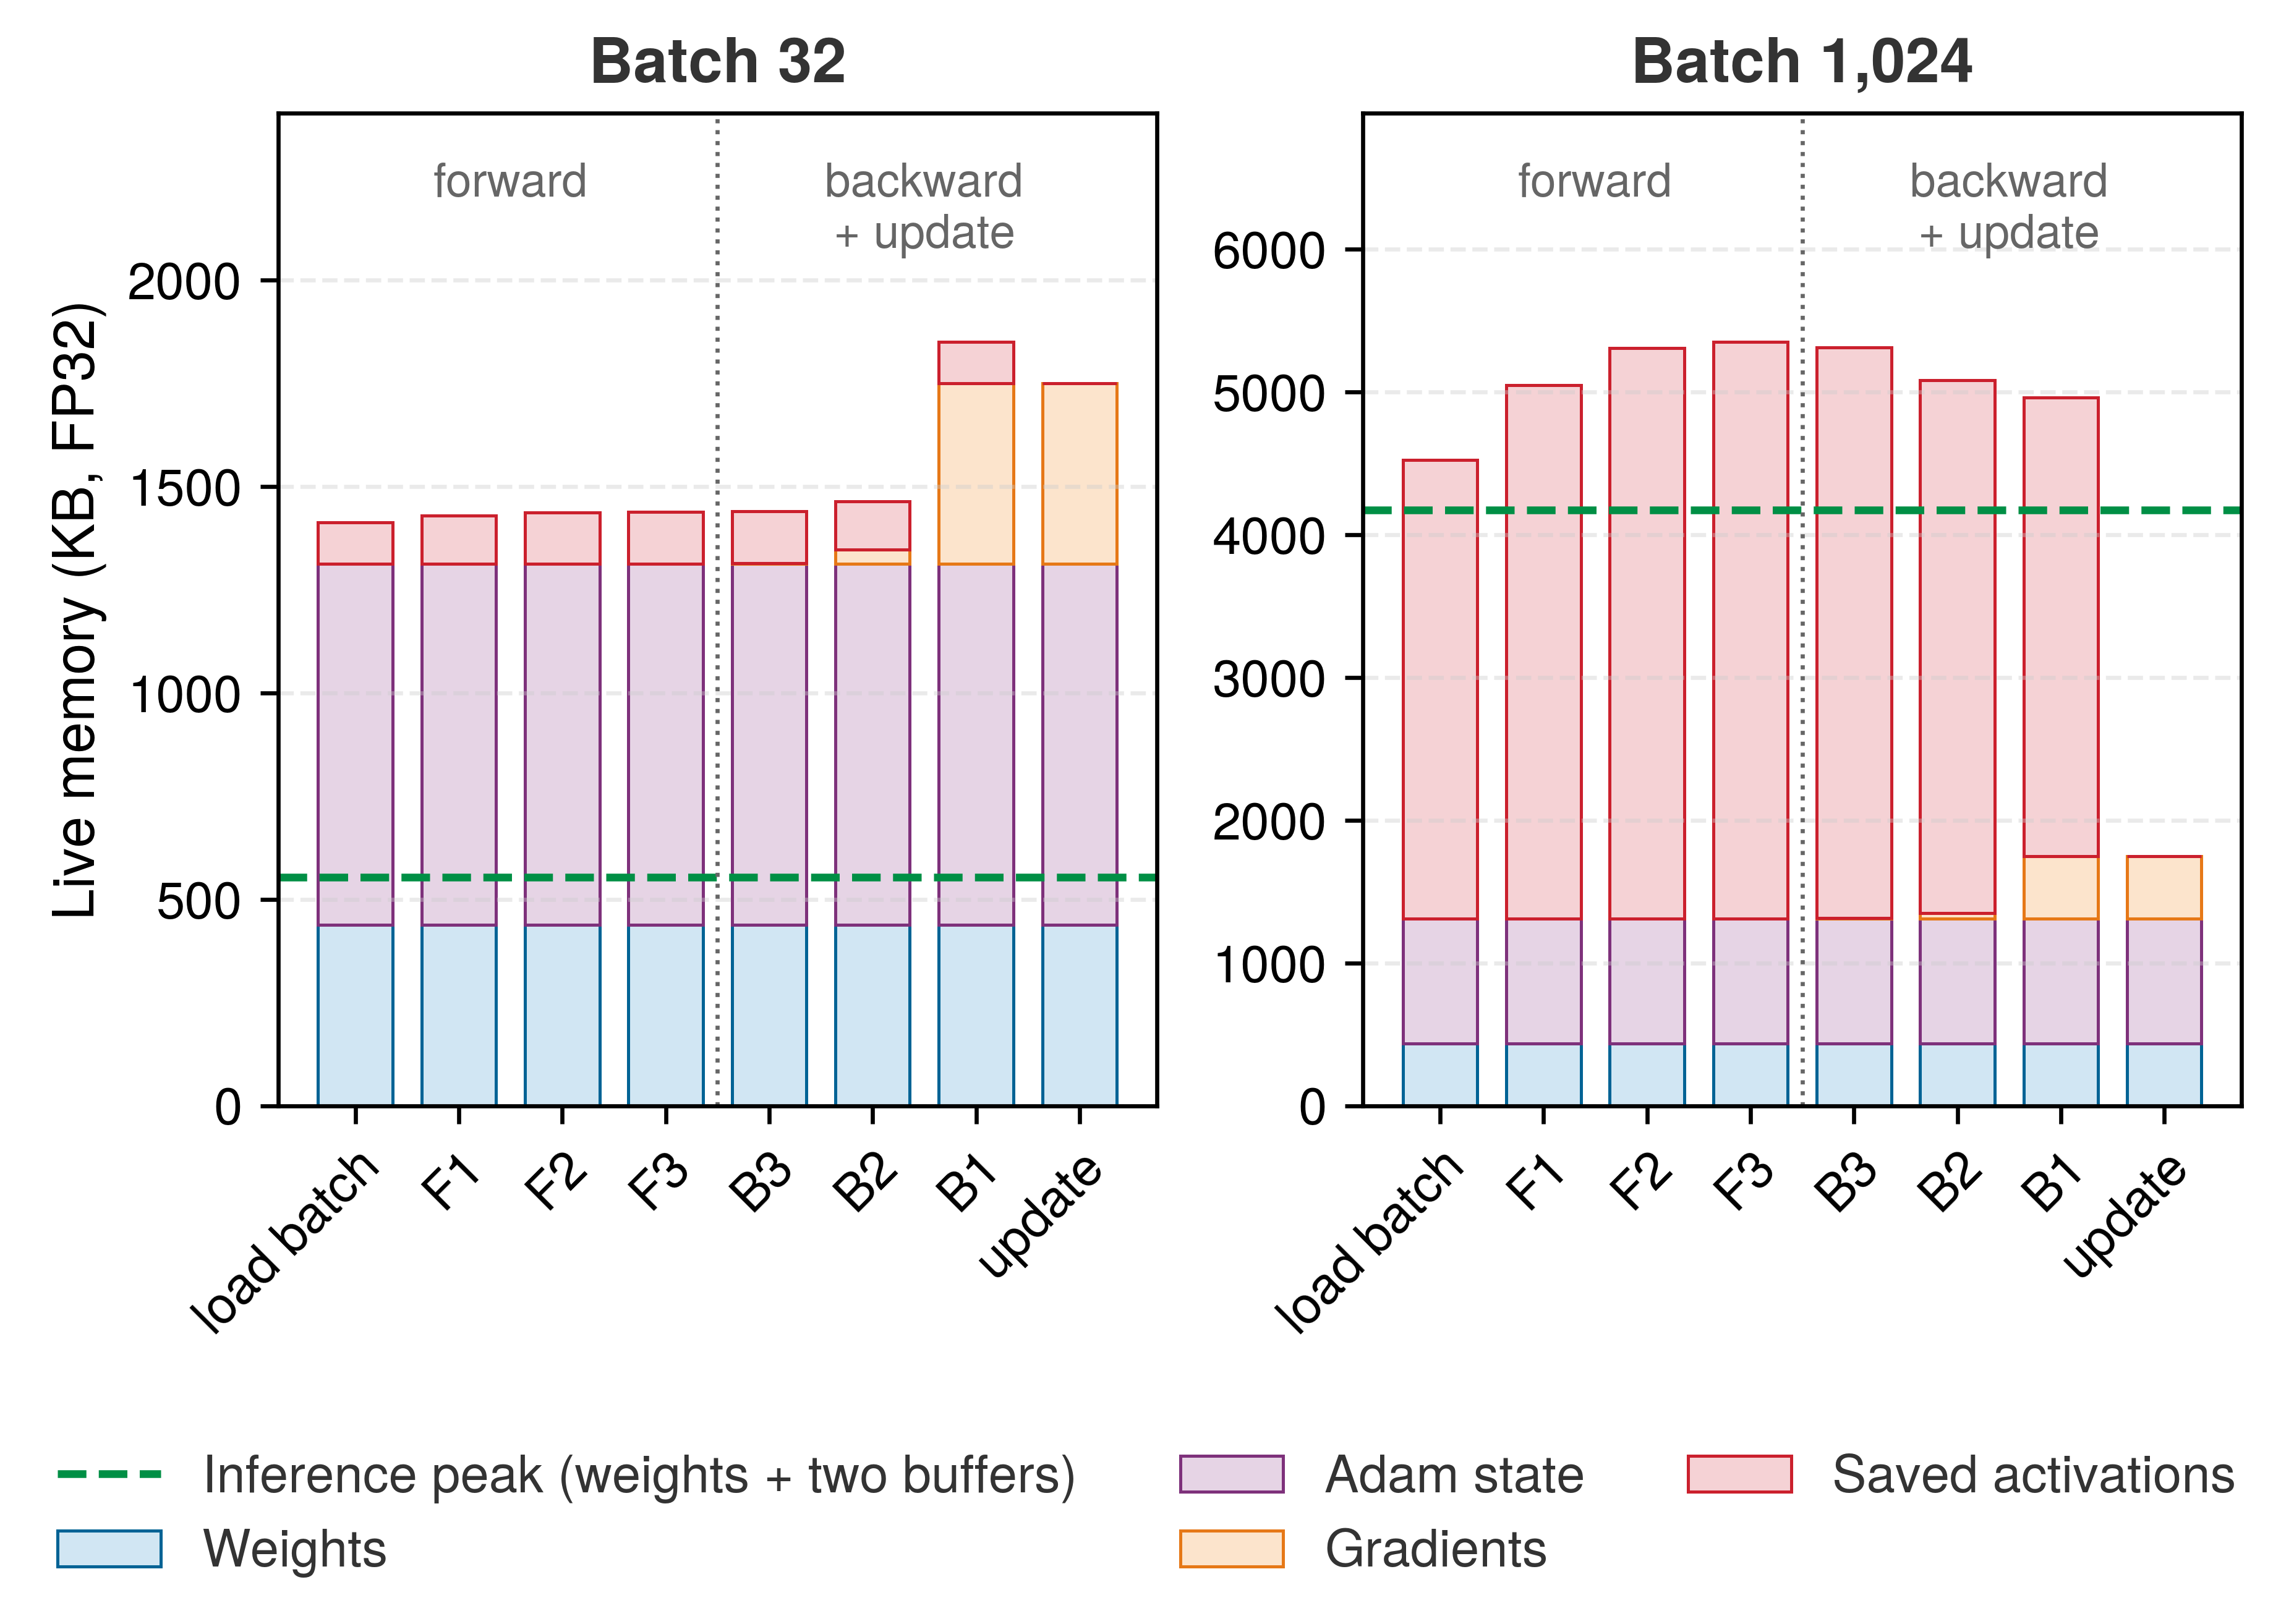
Figure 17: Memory Over One Training Step: Live FP32 memory of the running 784-128-64-10 network at each event of a training step, with weights and the two Adam buffers resident throughout. The forward pass (F1 to F3) keeps every layer’s output, the backward pass (B3 to B1) releases them as it consumes them while gradients accumulate, and the update leaves only parameter state. The left panel runs batch 32 and the right panel batch 1,024. The dashed line is inference: weights plus the largest pair of adjacent activation buffers.

Scale drives the systems lesson. At batch size 32, training requires 3.4× the inference memory in this simplified estimate; the inference column follows from the buffer-lifetime rule of section 5.5.2. The absolute gap grows with parameter and activation storage; the ratio depends on their balance and on implementation choices such as recomputing some activations instead of storing them, numerical precision, and workspace reuse.

Scaling beyond MNIST

The running network is the smallest case in this chapter. Figure 18 plots the parameter counts of 725 notable models published since 1950. Until about 2010 the count doubled roughly every 43 months; after 2010, as deep learning took hold, it doubled about every 10 months, and the largest models now hold more than a trillion parameters. Every dense parameter carries the same three obligations as the running network’s weights, so the per-parameter bookkeeping counted for a small digit classifier is the arithmetic that sets the memory and bandwidth budgets of the models in later chapters. The parameter climb parallels the growth in training compute that figure traced.
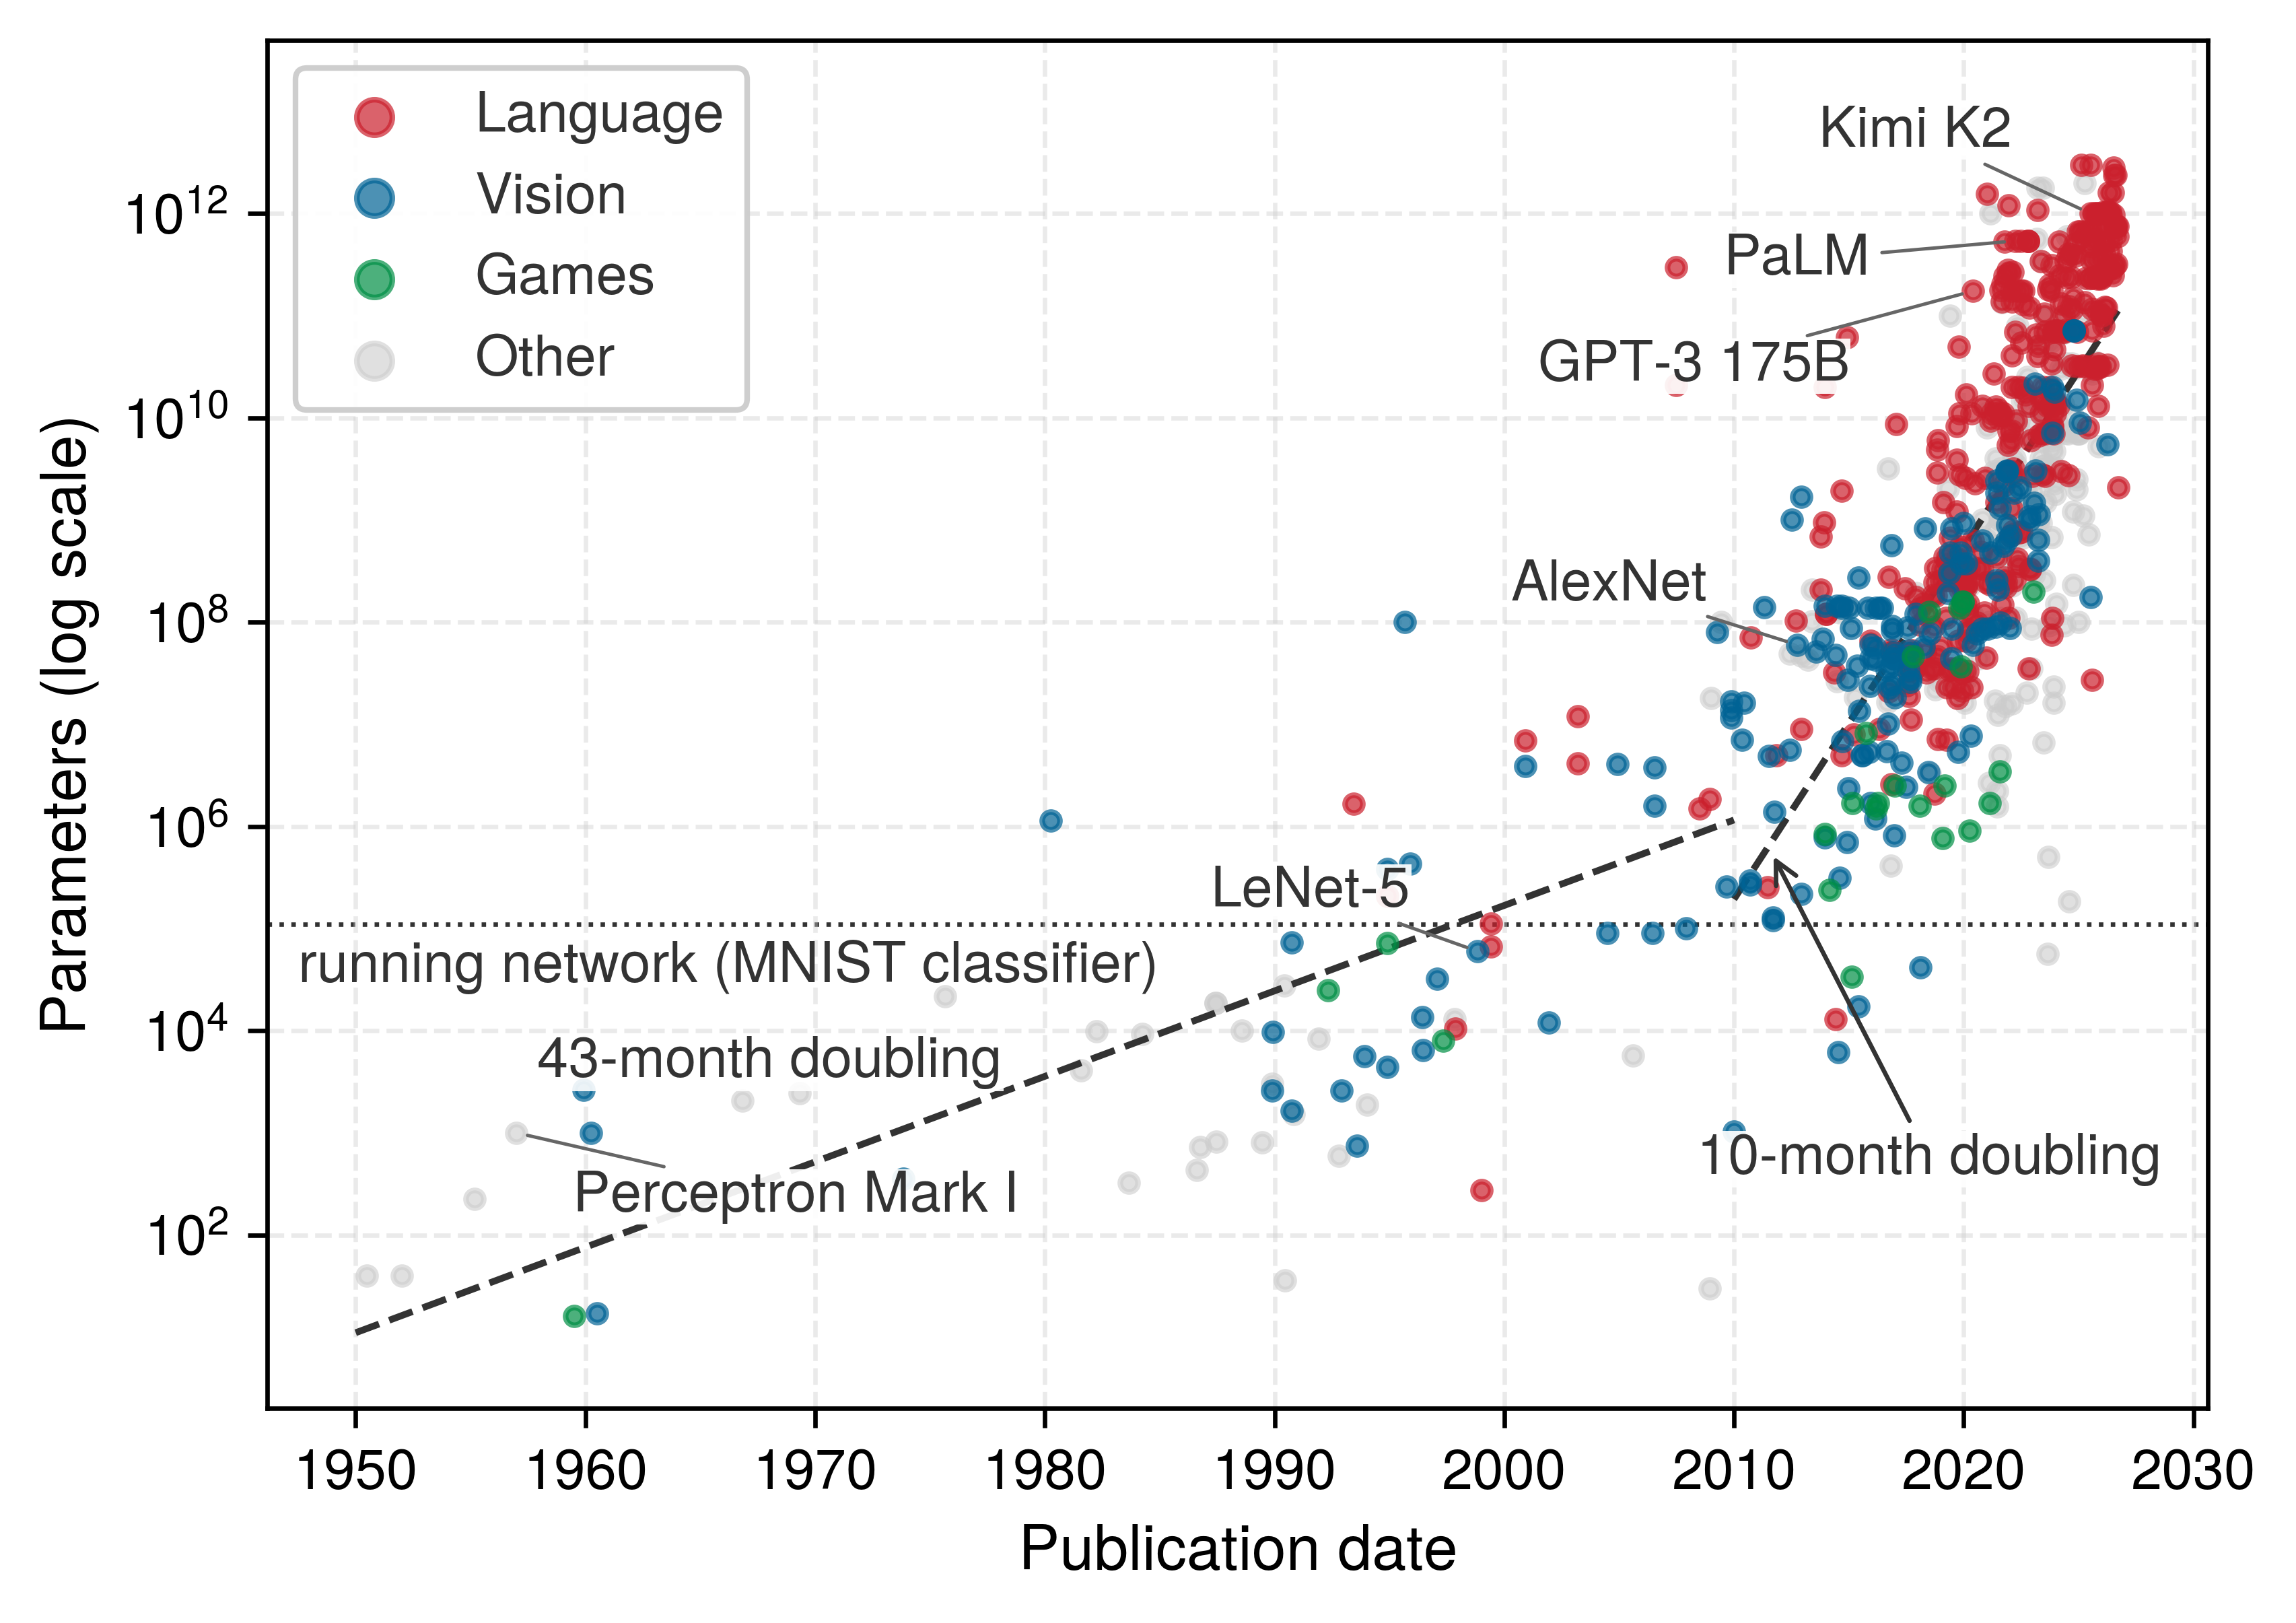
Figure 18: Parameter Counts of Notable Models, 1950 to the Present: Each point is one notable model, colored by domain, plotted by publication date on a logarithmic axis. Dashed lines are least-squares fits before and after 2010; the steeper second segment coincides with the rise of deep learning. Data from Epoch AI (2026).
Epoch AI. 2026. Notable AI Models.

The MNIST network’s memory is small, but each of its terms grows with network width and batch size, as equation 10 showed, and every training step must also move that state, reading parameters, producing gradients, and retaining or recomputing the forward-pass values each layer’s backward calculation needs. For modest networks like the MNIST example, this traffic remains manageable. As models grow, memory bandwidth and activation storage can become binding constraints, motivating high-bandwidth memory, narrower number formats for some tensors (mixed precision), partitioning state across devices, and activation recomputation, which discards selected saved activations and recomputes them during the backward pass. Mixed-precision training develops mixed precision, and Gradient accumulation and checkpointing develops recomputation.

The memory requirements summarized in table 9 seem modest for a digit classifier. At production scale the same four terms move a model into a different tier of the memory hierarchy.

Lighthouse 5.1: MNIST-to-ResNet-to-GPT-2 memory scaling
The MNIST running example and the GPT-2 lighthouse show how model scale changes the data \((\DataVolume)\) term of the iron law of ML systems (principle 3).

  • MNIST (running example): 109,386 parameters at 4 bytes each occupy approximately 438 KB. This entire model fits inside the L2 cache of a modern processor.
  • ResNet-50 (lighthouse): 25.6M parameters occupy approximately 102.4 MB in FP32, far beyond any cache but comfortably inside one accelerator’s device memory.
  • GPT-2 (lighthouse): 1,500,000,000 parameters at 4 bytes each occupy approximately 6 GB before activations and runtime workspace. This exceeds cache capacity and places the model in a device-memory or multi-device regime unless precision is reduced.

Systems insight: Moving from ~109.4K to 1.5B parameters is a 14,000× jump. The increase represents a phase change in engineering, not merely “more parameters.” MNIST can keep its weights near the processor; GPT-2 serving must manage a much larger memory working set. Whether a particular layer is compute or memory bound still depends on batch size, precision, reuse, and hardware balance.

Figure 19 sets the three footprints against the memory that would hold them. Each step to the right is a step down the memory hierarchy, from a microcontroller’s on-chip SRAM through an accelerator’s L2 cache to its high-bandwidth memory (HBM), toward storage that is larger, farther from the arithmetic, and slower to read.

↪ Why weights, gradients, and two Adam moments come to 16 bytes per parameter, in plain FP32 and in the mixed-precision recipe alike, is developed in System cost of optimizer state.
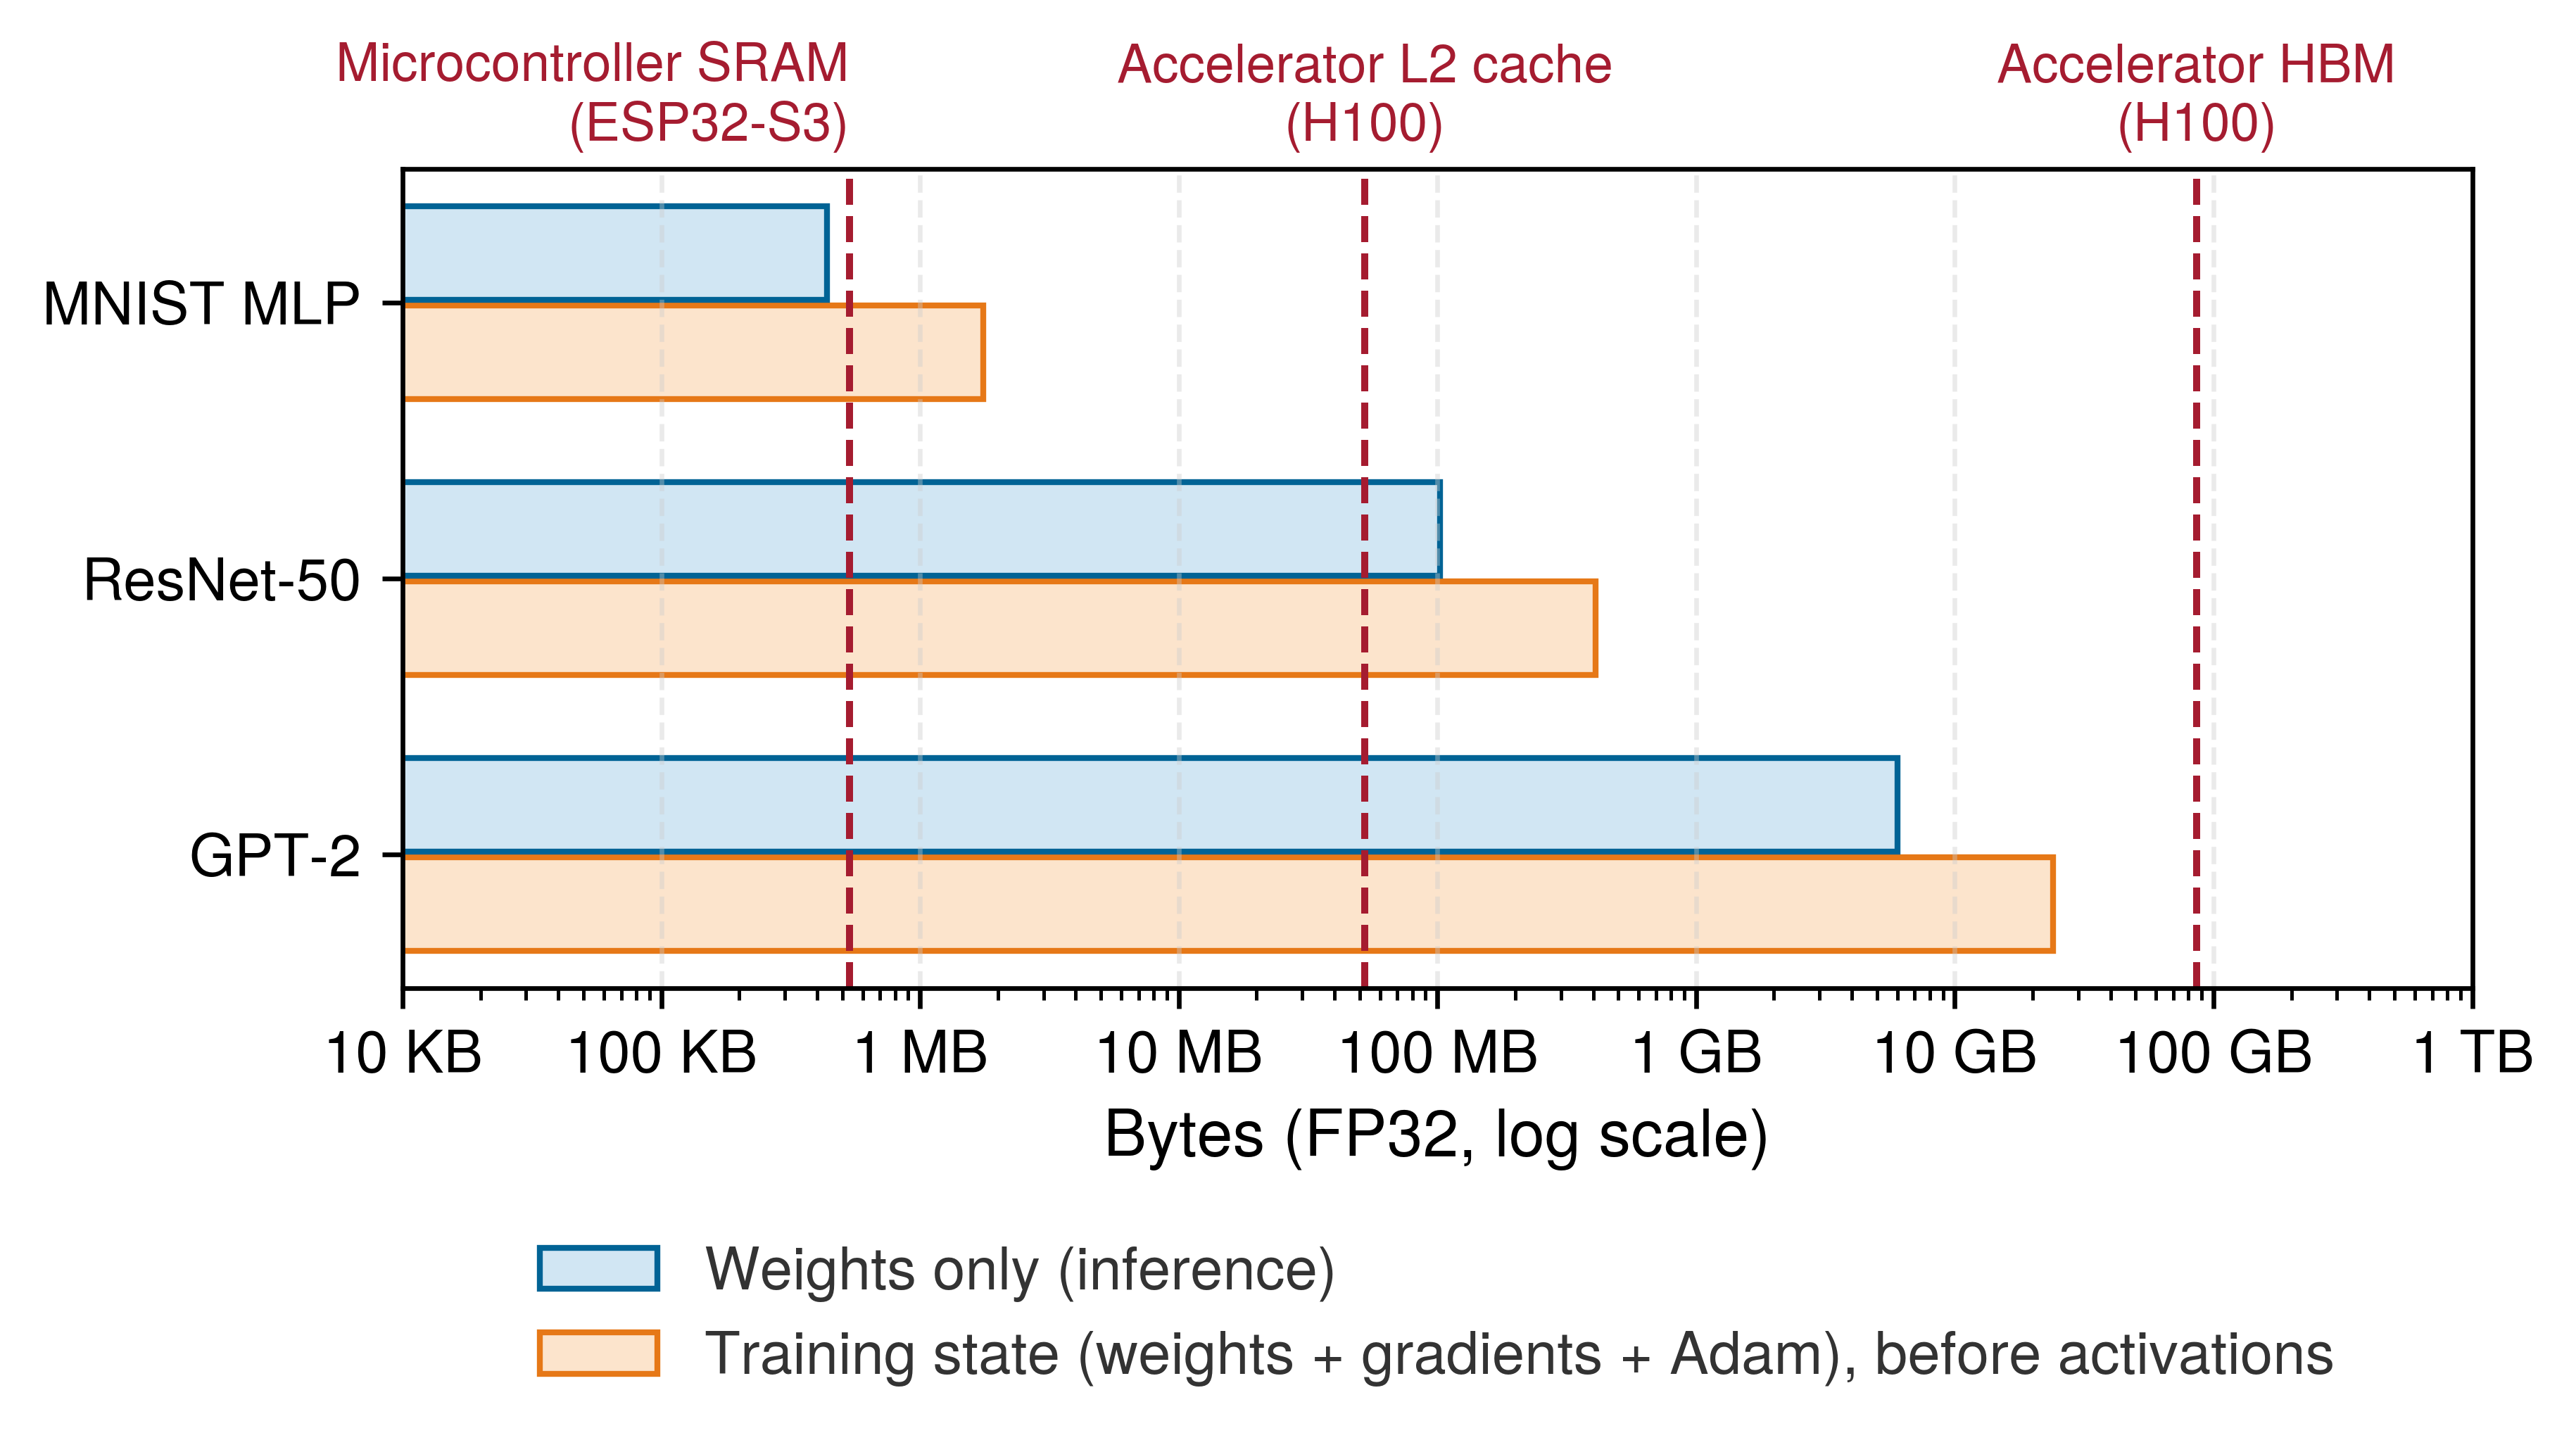
Figure 19: Where the Bytes Live: FP32 footprints of the MNIST network and the ResNet-50 and GPT-2 lighthouses on a log scale, for weights alone (inference) and for weights plus gradients plus two Adam buffers (training, before activations). Dashed lines mark the capacity of a microcontroller’s on-chip SRAM, an accelerator’s L2 cache, and its high-bandwidth device memory. MNIST’s training state crosses a tier boundary that its weights do not; ResNet-50 and GPT-2 sit in device memory either way, and what changes is how much of it they claim.

Engineers also need the same reasoning in seconds rather than minutes. Multiplying parameters by bytes per value and by the number of training-state copies rejects an impossible configuration before any profiling, and Memory management turns those napkin rules into a complete training-memory budget.

Checkpoint 5.3: Backpropagation

The credit assignment problem asks how the loss depends on parameters throughout the network. Backpropagation computes those gradients via the chain rule; verify that the mechanism is clear:

Mechanism

Training vs. inference

5.4.6 Iterative learning process

The cost of one training step is now known in operations and in bytes. Training repeats that step, forward propagation, backward propagation, and a weight update, in a loop that runs until the network achieves satisfactory performance or reaches a predetermined number of iterations.

A single pass through the entire training dataset is called an epoch.22 For MNIST, with 60,000 training images and a batch size of 32, each epoch consists of 1,875 batch iterations. Algorithm 2 lays out the loop of mini-batch stochastic gradient descent (SGD) (Robbins and Monro 1951), so called because each update follows a gradient estimated from a random sample of the data rather than the full dataset. Each epoch shuffles the data, steps through it one mini-batch at a time with a forward and backward pass, and applies a single parameter update per batch.

22 Epoch: The number of passes is a direct multiplier on total work, so a 100-epoch MNIST run executes 100\(\times\) more forward and backward passes than a single epoch. Large language-model training is often specified by a token budget rather than a simple epoch count because data sources may be mixed and sampled at different rates. The same accounting still applies: every additional training token adds another forward and backward computation.

Robbins, Herbert, and Sutton Monro. 1951. “A Stochastic Approximation Method.” The Annals of Mathematical Statistics 22 (3): 400–407. https://doi.org/10.1214/aoms/1177729586.

The mini-batch loop makes the batch size \(\BatchSize\) a hardware unit of work: a larger \(\BatchSize\) can improve matrix utilization and accelerator occupancy but raises activation memory, and because the update fires once per batch rather than once per example, \(\BatchSize\) also sets the gradient-update cadence. The inner loop in algorithm 2 is the unit that the hardware repeatedly executes, and its comments carry the chapter’s cost accounting line by line. The forward line spends the MACs of table 5 for every example in the batch and leaves activations behind, the backward line spends up to twice that and consumes those activations, and the update line does little arithmetic but touches every parameter, so its cost is set by bytes moved rather than operations performed. (In the algorithm, \(\DatasetSize\) counts logical training examples, the \(\text{Samples/Task}\) factor of the iron law, rather than the physical bytes moved \(\DataVolume\) in its memory term.) Notebook 5.3 evaluates one full epoch of this loop in seconds and joules on two machines, charging every operation the fixed dispatch cost whose mechanism Dispatch overhead in eager execution develops.

Napkin Math 5.3: One epoch on two machines
Problem: How long does one training epoch of the running network take on a desktop CPU and on a data-center accelerator, which term of the iron law sets that time, and where does the energy go?

Background: One epoch at batch 32 is 1,875 steps of about 14.5 MFLOP each, the forward work of table 5 scaled by the training-step ratio derived earlier. At batch 32 the network’s arithmetic intensity sits below both machines’ ridge points (figure 14), so each step runs at the bandwidth-limited rate. Every operation a step launches also pays a fixed cost: about 10 μs for the framework to dispatch it and, on the accelerator, about 5 μs more to launch it, across roughly 12 operations per step.

Solution: The arithmetic and data movement of a whole epoch take about 46 ms on the CPU and 0.7 ms on the accelerator, a 67× advantage. The fixed per-operation costs add about 225 ms on the CPU and 337.5 ms on the accelerator, so the totals come to about 271 ms and 338 ms. On the accelerator, 99.8 percent of the epoch is overhead, and the CPU finishes first. Energy tells a parallel story. With the energy constants introduced alongside the iron law (Horowitz 2014), about 160 pJ per byte moved from dynamic random-access memory (DRAM) and 2.3 pJ per FP32 operation (the average of a multiply and an add), moving a step’s bytes costs 5.8× the energy of its arithmetic at batch 32, and 141× at batch 1.

Systems insight: At this scale the third term of the iron law, fixed overhead, decides the run, and the accelerator’s bandwidth advantage disappears behind it; a network this small trains at least as fast on a CPU. Larger models, larger batches, and fewer, fused operations shift the balance back toward the work terms, which is how frameworks gain their speed (ML Frameworks), while the energy result anticipates why reuse, batching, and narrower formats matter as much to power as to time (Iron Law of ML Systems).

Horowitz, Mark. 2014. “1.1 Computing’s Energy Problem (and What We Can Do about It).” 2014 IEEE International Solid-State Circuits Conference Digest of Technical Papers (ISSCC), 10–14. https://doi.org/10.1109/isscc.2014.6757323.

Overfitting, regularization, and convergence

A network that reaches 99.5 percent accuracy on its training batches while stalling at 85 percent on held-out examples has memorized quirks of its training sample instead of learning patterns that transfer to unseen inputs. Training loss tracks the optimization objective on recent batches, whereas validation accuracy measures task performance on a separate held-out validation set (with the test set reserved for final evaluation after model and hyperparameter choices are fixed); a widening gap between the two is the primary symptom of overfitting.

Definition 5.6: Overfitting

Overfitting is a generalization failure in which performance on the training sample improves while performance on relevant unseen data does not.

  1. Significance: The diagnostic signature is measurable: training loss continues to fall while validation loss rises or the relevant validation metric plateaus, creating a widening generalization gap. Data coverage, architecture, optimization, regularization, and the relationship between train and deployment distributions all matter. Parameter count alone does not decide whether a model overfits. Past the point where a model can fit its training set exactly, test error can fall again as capacity grows, a pattern called double descent (Belkin et al. 2019; Nakkiran et al. 2019).
  2. Distinction: Unlike underfitting (where the model lacks the capacity to capture the target function and both training and validation error remain high), overfitting produces low training error but high validation error.
  3. Common pitfall: More data helps only when it is representative of the behavior the system must generalize to. Additional examples, augmentation, regularization, and early stopping are possible interventions, but each must be evaluated on held-out data from the relevant operating regime.
Nakkiran, Preetum, Gal Kaplun, Yamini Bansal, Tristan Yang, Boaz Barak, and Ilya Sutskever. 2019. “Deep Double Descent: Where Bigger Models and More Data Hurt.” arXiv Preprint arXiv:1912.02292.
Belkin, Mikhail, Daniel Hsu, Siyuan Ma, and Soumik Mandal. 2019. “Reconciling Modern Machine-Learning Practice and the Classical Bias–Variance Trade-Off.” Proceedings of the National Academy of Sciences 116 (32): 15849–54. https://doi.org/10.1073/pnas.1903070116.
Srivastava, Nitish, Geoffrey E. Hinton, Alex Krizhevsky, Ilya Sutskever, and Ruslan Salakhutdinov. 2014. “Dropout: A Simple Way to Prevent Neural Networks from Overfitting.” Journal of Machine Learning Research 15 (1): 1929–58.

Regularization controls overfitting by constraining what the network can fit. The most common form adds a penalty on weight magnitude to the loss. An \(\ell_2\) term \(\WeightPenaltyStrength \sum \ModelWeight^2\), where \(\WeightPenaltyStrength\) sets the penalty strength, shrinks every weight slightly at each step, which is why it is also called weight decay. An \(\ell_1\) term \(\WeightPenaltyStrength \sum \lvert \ModelWeight\rvert\) pushes weights toward zero, producing the unstructured sparsity that Model Compression exploits. Neither penalty needs persistent state of its own. Dropout (Srivastava et al. 2014) zeroes a random fraction of activations at every training step so that no unit can rely on a single upstream partner; it costs a fresh random mask per activation during training and disappears at inference. Early stopping, halting training once validation loss stops improving, is the third common control, and it depends on the periodic validation and checkpointing that close this section.

Convergence monitoring provides essential feedback during training and continues into production deployment. A flattening training-loss curve signals slowing optimization, but it does not identify the cause: the run may be approaching a useful solution, encountering an optimization limit, or underfitting. A validation plateau is similarly diagnostic rather than conclusive. The gap between training and validation performance helps distinguish overfitting from improvements that transfer to held-out examples. For the machine, the quantity that matters is time to a target accuracy, which is the number of steps the optimizer needs times the time each step takes. Batch size pulls the two factors in opposite directions. A larger batch means fewer steps per epoch (1,875 for MNIST at batch 32) and better weight reuse per step, but each step costs more time and activation memory, and past some size the optimizer needs more epochs to reach the same accuracy. The useful batch is the one that minimizes that product within the memory available for training.

Selecting a stopping point also requires periodically evaluating the model on the validation set and saving its weights to durable storage, a practice called checkpointing (not to be confused with activation recomputation, which some frameworks also call checkpointing) that Training state and checkpoints develops. For the MNIST network a checkpoint write is negligible; for a model whose parameters occupy tens to hundreds of gigabytes, every checkpoint and every validation pass is a recurring storage and compute cost whose frequency must be balanced against recovery and model-selection needs.

The complete training pipeline runs from forward propagation through loss computation to gradient-based weight updates. Training, however, is preparation, not the end goal. Once parameters are optimized, deploying the model for real-time predictions changes the resource profile entirely.

Checkpoint 5.4: Neural network learning process
The complete training cycle provides the mathematical machinery that enables neural networks to learn from data. Before moving to inference and deployment, verify core understanding of the training cycle:

Use the MNIST network (784 → 128 → 64 → 10) and a batch size of 32 as the running check.

If any concepts feel unclear, review the earlier sections on forward passes, loss functions, backpropagation, and learning before continuing. These mechanisms form the foundation for the training-vs.-inference distinction that follows.

Self-Check: Question
  1. A classification model trained with softmax cross-entropy outputs a predicted probability \(\hat{y}_c = 0.99\) for the correct target class on Example 1, and outputs \(\hat{y}_c = 0.01\) for the correct class on Example 2. Based on the definition of cross-entropy loss (\(\mathcal{L} = -\log(\hat{y}_c)\)) and the combined softmax cross-entropy logit gradient (\(\frac{\partial \mathcal{L}}{\partial z_c} = \hat{y}_c - 1\)), what are the relative loss values and gradient magnitudes for these two examples?

    1. Example 1 produces loss \(\approx 4.61\) and logit gradient \(-0.99\), while Example 2 produces loss \(\approx 0.01\) and logit gradient \(-0.01\).
    2. Both examples generate identical gradient magnitudes because softmax normalization forces the sum of class gradients to equal zero.
    3. Example 2 produces negative loss because probabilities below \(0.5\) invert the sign of the cross-entropy objective.
    4. Example 2 produces high loss (\(-\log(0.01) \approx 4.61\)) and an error gradient of \(0.01 - 1 = -0.99\), while Example 1 produces near-zero loss (\(-\log(0.99) \approx 0.01\)) and an error gradient of \(0.99 - 1 = -0.01\), yielding an error signal roughly \(99\times\) stronger on the misclassified example.
  2. What is the primary computational complexity advantage of reverse-mode automatic differentiation (backpropagation) over numerical differentiation (finite differences) when training a neural network with \(P\) parameters?

    1. Backpropagation computes exact gradients for all \(P\) parameters in a single reverse graph traversal costing on the order of the forward graph, often approximately \(2\times\) forward-pass FLOPs for dense layers when both weight and input gradients are required, whereas numerical differentiation requires \(P\) separate forward passes costing \(\mathcal{O}(P \times \text{graph})\).
    2. Numerical differentiation is unstable for integer parameters, while backpropagation converts all tensors to complex numbers.
    3. Backpropagation eliminates the requirement to store or cache intermediate activations from the forward pass.
    4. Reverse-mode automatic differentiation executes without using the mathematical chain rule.
  3. Distinguish between backpropagation and gradient descent (the optimizer) in terms of their computational roles and memory requirements during training.

  4. Explain why the peak memory footprint during model training significantly exceeds the memory footprint during inference for the same model architecture and batch size. Identify the three major tensor categories present during training that are absent during inference.

  5. True or False: In deep neural networks, vanishing gradients can occur when the full product of layer-wise Jacobian factors during backpropagation shrinks with depth, causing early-layer gradients to become extremely small.

  6. Order the computational phases executed within a single supervised mini-batch training step: (1) Update model weights using the optimizer update rule, (2) Evaluate the loss function by comparing predictions to ground-truth labels, (3) Perform the forward pass to compute layer activations and predictions, (4) Execute backpropagation via the chain rule to compute parameter gradients.

See Answers →

5.5 Inference Pipeline

Training transforms randomly initialized weights into parameters that encode useful patterns, but deployment executes those parameters under a different resource profile. During inference,23 the same mathematical operators face a different operating regime: online latency deadlines or offline throughput targets replace the training objective, gradients and optimizer state disappear from memory, and target execution environments range from milliwatt edge processors to multi-accelerator cloud servers. This transition reshapes how memory bandwidth, compute capacity, and pipeline stages govern system performance. Because ordinary inference never updates the weights, a deployed model adapts to a changing world only through monitored data collection, validation, and retraining, a loop that operations practice owns.

23 Inference: From Latin inferre (“to bring in, to conclude”), borrowed from logic where it means deriving conclusions from premises. The ML usage marks a systems boundary: training executes forward and backward passes and maintains optimizer state, while ordinary inference executes the forward graph with frozen parameters. Removing gradients, optimizer state, and most saved activations can reduce memory and computation substantially, but the ratio depends on architecture, batch size, precision, runtime workspace, and serving strategy.

The training memory estimate of section 5.4.5.5 counted four kinds of state. Inference keeps exactly one of them, the weights, and replaces the saved activations with a pair of short-lived buffers. Persistent weights plus rolling activations are the whole of inference memory for a feed-forward network. Batching then trades latency for reuse, and once the network itself is fast, the stages around it can dominate.

↪ When monitored drift should trigger retraining, and what each retraining cadence costs, is developed in Retraining decision framework.

5.5.1 Operational phase differences

The two phases differ first in what they execute and how long their state lives. Inference executes only the forward pass, evaluating inputs against static parameters with batch sizes dictated by incoming traffic. Training couples that forward pass with backpropagation for gradient computation and parameter updates, selecting batch sizes to maximize accelerator occupancy and gradient stability. Unlike inference, training must retain intermediate activations, gradients, and optimizer state simultaneously, multiplying working memory demands. The underlying network weights are identical, but the execution graph changes. Training-only regularizers such as dropout are stripped away, while adjacent matrix operations and activations can be fused or quantized into specialized execution kernels. In figure 20, training couples large-batch processing with a bidirectional loop in which output errors trigger a reverse gradient pass, whereas inference executes a strictly unidirectional forward pass over smaller, variable batch sizes without backward state retention.
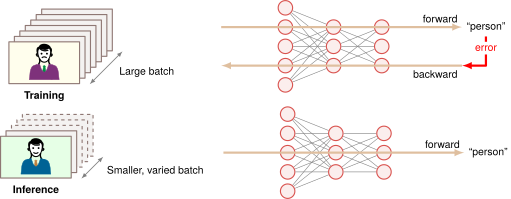
Figure 20: Inference vs. Training Flow: Both flows run the same fully connected network; the batch outlines (dashed and varied for inference, solid and uniform for training) mark the two operating regimes.

These differences determine which hardware each phase runs on and how it is deployed. Training clusters rely on high-bandwidth, high-memory accelerators backed by hundreds of watts per socket and dedicated data-center cooling.24 Inference deployments on constrained hardware prioritize bounded tail latency and energy efficiency across diverse platforms: mobile devices execute on low-power neural processing units (typically 2–4 W), edge servers employ dedicated inference accelerators,25 and cloud instances use reduced numerical precision to saturate dedicated matrix-multiply units (NVIDIA’s versions are called Tensor Cores). At scale, production serving introduces operational requirements that do not arise in isolated training runs, including dynamic request batching, load balancing, and failure isolation. At the memory level, training retains all forward activations until backward passes consume them, whereas inference discards or overwrites intermediate buffers as execution advances through the graph; table 10 summarizes this resource profile.

24 Training GPU power budget: The “high-memory” requirement is driven by the need to hold parameters, gradients, optimizer state, and activations simultaneously. The corresponding power draw dictates the “dedicated data-center cooling infrastructure,” as a single high-end training GPU consumes 400 W–700 W. Even compared with a 4 W mobile inference chip, that is at least 100× the power budget.

25 Edge inference accelerators: Google’s edge Tensor Processing Unit (TPU), the Edge TPU (Google Coral), operates in the mobile/embedded tier at about 2 W, delivering 4 TOPS through an INT8 datapath. Edge servers sit in a different tier: Jetson AGX Orin reaches 275 TOPS at 15 W–60 W, about 68.8× more throughput but with wired-power assumptions.

↪ Tensor Cores, which execute a small matrix multiply-accumulate per instruction and set the reduced-precision peak rates quoted for data center GPUs, are developed in Tensor Cores.

Table 10: Training vs. Inference Forward Pass: Both phases execute the same forward equations, but they manage state differently. Training must retain or recompute the values required by the backward pass and also carries gradients and optimizer state. Inference can reuse a rolling pair of layer buffers.
Characteristic Training Forward Pass Inference Forward Pass
Activation Storage Retains values required by the backward pass Retains the current input and output buffers
Memory Pattern Saves or recomputes selected intermediate states Reuses buffers as successive layers complete
Computational Flow Same matrix products; each layer input is kept Same matrix products; each input freed after use
Resource Profile Weights, gradients, optimizer state, saved inputs Weights plus the largest adjacent buffer pair

5.5.2 Memory and computational resources

Inference has two memory obligations. The first is persistent: the trained weights and biases must remain available for every request. The second is transient: in this sequential feed-forward graph, each layer produces an activation buffer that is needed only until the next layer consumes it. This distinction is the reason inference can be much leaner than training, even though the arithmetic in the forward pass is the same.

For the canonical MNIST network (784 → 128 → 64 → 10), the persistent parameter block contains 109,386 parameters, or about 438 KB at 32-bit floating point precision. The layer-level counts in table 5 show why inference is cheap to plan. Each fully connected layer performs one multiply-add for each weight, so parameter memory and arithmetic scale together.

The transient side is where inference saves the most. Under the retained-activation training scheme used here, activation tensors persist until backpropagation reaches their corresponding layers, producing cumulative memory consumption across the entire network depth (\(\sum_\LayerIndex \ActivationMemory^{(\LayerIndex)}\), where \(\ActivationMemory^{(\LayerIndex)}\) is the byte size of layer \(\LayerIndex\)’s activations). In a sequential feed-forward graph, inference needs a layer’s input buffer only until that layer has produced its output. Once layer \(\LayerIndex+1\) finishes execution, the activation buffer for layer \(\LayerIndex\) is dead and its storage can be overwritten, so peak transient activation memory falls from the cumulative total to the largest adjacent pair, \(\max_\LayerIndex \big(\ActivationMemory^{(\LayerIndex)} + \ActivationMemory^{(\LayerIndex+1)}\big)\). A skip connection or any other later consumer extends a buffer’s lifetime and must enter that plan; the static memory planners that serving runtimes build on this property are developed in Specialized inference engines.

For the running network at batch size 32, that rule produces the inference column of table 9. Inference holds the 438 KB parameter block plus a rolling activation pair of about 117 KB, roughly 554 KB in all. The training step of table 9 holds about 1.9 MB, 3.4× as much, for the same weights and the same forward arithmetic. The entire difference is state that training keeps and inference does not: saved activations, gradients, and optimizer buffers. Fixed parameters and short buffer lifetimes also make inference easier to optimize, and batching is the first lever.

5.5.3 Optimizing inference throughput and latency

Serving one request at a time (\(\BatchSize=1\)) turns every fully connected layer into a matrix-vector product that reads each weight from memory only to use it in a single multiply-accumulate (\(\NeuronPreactivation_j \leftarrow \NeuronPreactivation_j + \LayerInputComponent_i \WeightMatrixEntry\)), leaving arithmetic intensity at about 0.5 FLOP/byte (notebook 5.1). Because inference freezes parameters and eliminates backward state, runtime engines can plan batching, memory layout, operator scheduling, and numerical precision against the physical limits of the target processor.

Input batching trades per-request latency against hardware efficiency. Aggregating requests into a batch turns that matrix-vector product into a matrix-matrix product that reuses each loaded weight across all \(\BatchSize\) inputs, raising the MNIST network’s intensity to about 11.9 FLOP/byte at batch 32. Weight reuse matters most when parameters stream from off-chip memory and the workload sits below the machine’s ridge point; a model as small as MNIST can instead keep its weights in cache from one request to the next.

Batching also increases the activation values produced: the MNIST network produces 202 layer-output values per image (986 values including the input), or 6,464 layer-output values for a batch of 32. These are cumulative counts across layers; simultaneous storage follows the rolling-buffer rule of section 5.5.2. Production systems serving interactive traffic must also limit the wait to accumulate inputs according to their service-level latency budget.

↪ How serving systems batch incoming requests dynamically to amortize parameter transfers is developed in Static vs. dynamic batching.

The stages around the network have an entirely different computational profile from the forward pass. While neural network execution exploits massively parallel matrix units on accelerators, preprocessing (such as image decoding and normalization) and postprocessing (such as argmax reduction, threshold checking, and message serialization) often execute on the host CPU, although implementations can parallelize or accelerate them. Amdahl’s law, met in the introduction and developed for accelerated systems in Anatomy of an Accelerator, bounds end-to-end speedup by the fraction of time that is not accelerated, so as accelerator kernels drive forward-pass execution times toward zero, these unaccelerated CPU stages and their associated Peripheral Component Interconnect Express (PCIe) data transfers can come to dominate end-to-end request latency.

Three further mechanics complete the inference design space, and each has an owning chapter. Kernel fusion keeps a layer’s intermediate results in on-chip storage instead of writing them to off-chip memory between the matrix multiply, the bias addition, and the activation (The memory wall and kernel fusion). Quantization stores frozen weights in fewer bits, which inference tolerates better than training because no small gradient updates must survive (Post-training quantization). Autoregressive transformers add a key-value cache of intermediate results from earlier tokens that grows with every token generated (Autoregressive decoding).

The complete lifecycle of the running network, from architecture through training to inference, is now a set of operations with quantifiable costs. Those estimates were made in a controlled setting, with clean data, no deadline, and an unchallenged machine. A production deployment, where none of those conditions holds, is the real test of whether they are complete.

Checkpoint 5.5: Complete neural network system

Before turning to how these mechanics first performed in deployment, verify your understanding of the complete neural network lifecycle:

Use the MNIST classifier (784 → 128 → 64 → 10) as the running production system.

Recognizing a digit was not always a benchmark. Decades before large datasets and specialized accelerators, the same task ran in production, in the mail-sorting and check-reading systems where neural inference first met a physical deadline.

Self-Check: Question
  1. A real-time voice transcription service has a strict \(\text{p99}\) end-to-end latency budget of \(50\text{ ms}\). In configuring the serving infrastructure for the acoustic model, which batching strategy best aligns with this requirement?

    1. Choose the policy only from peak accelerator utilization: the largest stable batch is always best for a tight latency SLO.
    2. Fix batch size at \(64\) and avoid any explicit waiting bound, because a consistent large batch is the most reliable way to manage tail latency.
    3. Use measured arrival patterns, queueing behavior, batch-execution times, and other pipeline-stage latencies to choose a maximum batch size and an explicit waiting bound that fit within the end-to-end deadline, then validate the policy under representative traffic.
    4. Minimize average latency on an unloaded test host, then keep that batch size in production even if arrival patterns and queueing behavior change.
  2. Why can an inference serving runtime for a sequential feed-forward network achieve a significantly smaller memory footprint than a training runtime for the exact same model architecture, beyond the omission of optimizer states and gradients?

    1. Inference converts all parameter tensors into single-bit binary hash tables.
    2. Inference requires no backward pass, allowing intermediate activation buffers to be immediately recycled or overwritten once their single downstream consumer layer finishes execution.
    3. Inference executes all network layers simultaneously in parallel, eliminating the need for intermediate buffers.
    4. Inference executes exclusively within on-chip CPU registers, bypassing main memory completely.
  3. Why is reduced numerical precision (such as 8-bit integer quantization, INT8) generally much more practical to deploy during inference than during model training?

    1. Inference has no small iterative parameter updates or gradient accumulation to preserve, so reduced precision is often practical to test, but rounding can still propagate through forward layers and any INT8 speedup requires supported kernels or hardware plus calibration and quality validation.
    2. If the quantized weights fit in memory, that alone guarantees inference quality and latency comparable to higher precision.
    3. A single calibration set is sufficient to guarantee correct INT8 behavior for every slice of future production traffic.
    4. INT8 is universally faster whenever it reduces bytes moved, so if a model can run in INT8 it should replace FP32 or BF16 without further checks.
  4. A computer vision inference service has a target \(\text{p99}\) latency SLO of \(100\text{ ms}\). For one measured representative request, the non-overlapping stages are: image JPEG decoding \(45\text{ ms}\), resizing and normalization \(30\text{ ms}\), neural network inference \(15\text{ ms}\), and JSON response serialization \(25\text{ ms}\). If inference alone becomes \(2\times\) faster, what is the new computed request latency, and why does that result alone still not establish whether the service meets the \(\text{p99}\) SLO? What should be profiled next?

  5. True or False: Applying the softmax function \(\hat{y}_i = \frac{e^{z_i}}{\sum_j e^{z_j}}\) to raw neural network output logits alters the argmax classification decision, meaning the class with the highest raw logit is not guaranteed to have the highest predicted probability.

See Answers →

5.6 Handwritten Digit Recognition

In the late 1980s, LeCun and colleagues demonstrated backpropagation-based recognition of handwritten ZIP-code digits from USPS-supplied images (LeCun et al. 1989). Related convolutional document-recognition work later supported commercially deployed bank-check readers (LeCun et al. 1998). These were distinct systems, but they exposed the same engineering pattern: preprocessing normalized variable handwriting, neural inference produced candidate digits, rejection thresholds sent uncertain predictions to human review, and downstream logic converted accepted predictions into operational decisions. That shared pipeline is the chapter’s running digit task, deployed. It tests every cost estimate the chapter has built, because preprocessing, model structure, and rejection policy must interact under a physical throughput constraint, and its first obligation is to turn the network’s scores into decisions.

5.6.1 From scores to decisions

Neural network outputs become useful only after they are converted back into decisions a conventional system can act on. Preprocessing bridges real-world data into tensor form; postprocessing maps neural outputs into labels, decision thresholds, validation logic, error handling, and downstream messages. For the running network, raw logits are not enough. A digit-recognition system needs the most likely digit class, a confidence score whose calibration has been evaluated, and a fallback route that directs ambiguous or low-confidence predictions to human review or a secondary recognizer.

↪ Calibration, the agreement between a classifier’s confidence scores and its observed accuracy, is measured in Confidence calibration.

That fallback route is itself a design decision with a measurable trade. A confidence threshold on the top-class probability sends every prediction below it to a person. Raising the threshold reduces the accepted fraction and increases review workload. For a fixed set of scored inputs, it cannot increase the number of accepted mistakes, but the error rate among the remaining accepted predictions can rise or fall because both the error count and the accepted count change. Engineers therefore measure a risk-coverage curve, plotting error among accepted predictions against the fraction of inputs accepted, on held-out data that resembles deployment traffic. A usable operating point must meet the error budget while keeping rejected traffic within review capacity. Softmax probabilities need not be calibrated, and distribution shifts can change both counts, so the selected threshold and its review workload require monitoring.

Confidence thresholds determine the division of labor between automation and human review. An expected-cost rule (Chow 1970) chooses threshold \(\ResponseThreshold\) to minimize \(\ManualReviewFraction(\ResponseThreshold)\,\ManualReviewCost + \MisclassifiedFraction(\ResponseThreshold)\,\ErroneousPredictionCost\) subject to throughput and latency constraints, where \(\ManualReviewFraction(\ResponseThreshold)\) and \(\MisclassifiedFraction(\ResponseThreshold)\) are the fractions of all arriving items sent to manual review and accepted with a wrong automated classification, and \(\ManualReviewCost\) and \(\ErroneousPredictionCost\) are their per-item costs. Both fractions count against every arriving item, so an error rate reported only among accepted items must first be multiplied by the accepted fraction. The 1989 ZIP-code system reported one measured point on this curve, examined in section 5.6.4.

Chow, Chao-Kong. 1970. “On Optimum Recognition Error and Reject Tradeoff.” IEEE Transactions on Information Theory 16 (1): 41–46. https://doi.org/10.1109/TIT.1970.1054406.

5.6.2 The document-recognition challenge

In a physical postal sorter, envelopes move past optical scanners along mechanical belts at fixed speed, leaving only tens of milliseconds per item to capture the image, isolate the digits, evaluate the network, and trip the physical diverter gates. A misrouted envelope or misread check incurs costly manual re-handling or financial reconciliation, yet raw accuracy on uncontrolled handwriting cannot reach 100 percent, so the pipeline must pair automated inference with an explicit rejection rule that routes ambiguous digits to human operators. The sample grid in figure 21 shows this handwriting variation across real postal envelopes, where character segmentation and recognition must handle heavy cursive slant, uneven stroke widths, broken loops, and patterned envelope backgrounds across city names and five-digit ZIP codes.
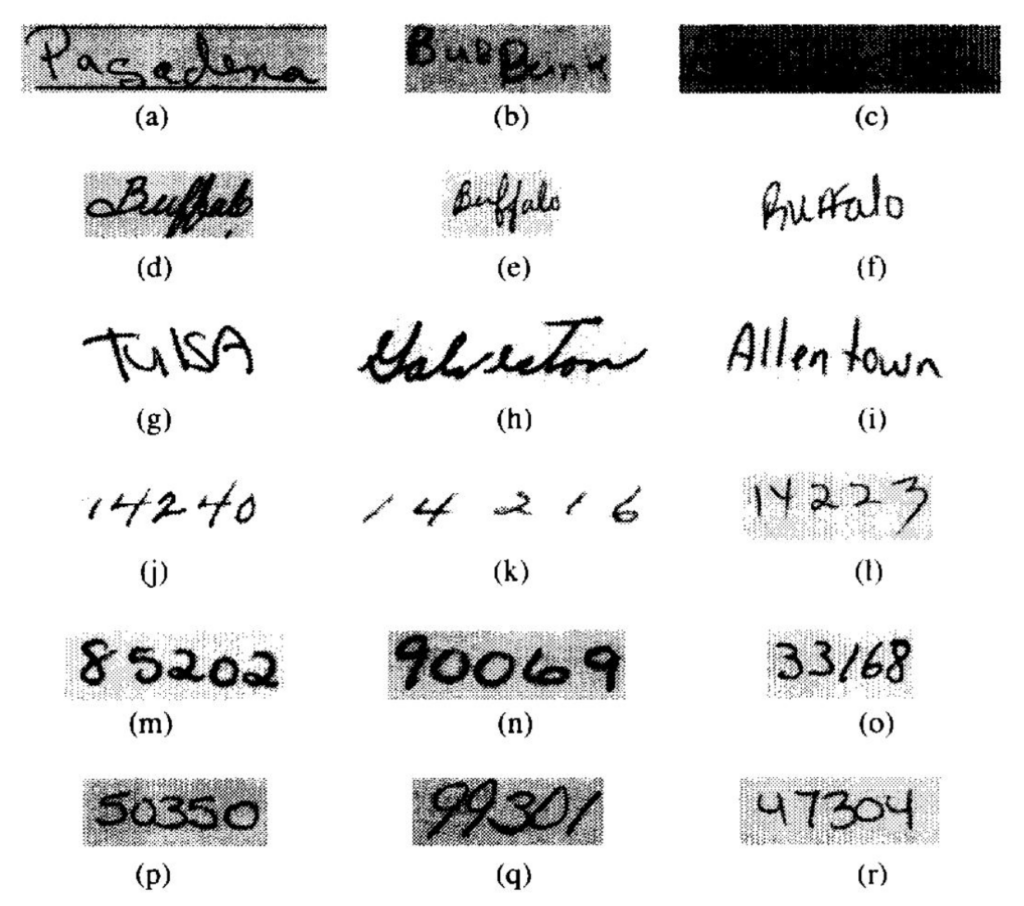
Figure 21: Handwritten Address Variability: Address and ZIP-code samples show wide variation in stroke width, slant, spacing, and character formation. A document-recognition pipeline must absorb this variation without confusing legitimate writing differences with changes in the intended characters. Source: CEDAR CD-ROM 1 USPS Office of Advanced Technology database.

No single stage can absorb all of that variation alone, and the dataset histories behind the task must also remain separate. Early ZIP-code research used postal digit images supplied for that task (LeCun et al. 1989), whereas MNIST was later constructed from National Institute of Standards and Technology (NIST) handwritten-digit databases and standardized into size-normalized benchmark images (LeCun et al. 1998), not collected from live envelopes under varying colors, textures, lighting, and orientations. Both histories nonetheless imposed the same engineering requirements. Preprocessing had to reduce irrelevant variation without erasing the stroke information needed for recognition, and training had to cover handwriting variation, with augmentation exposing the model to additional plausible variation, rather than optimize only for a curated test set.

LeCun, Yann, Léon Bottou, Yoshua Bengio, and Patrick Haffner. 1998. “Gradient-Based Learning Applied to Document Recognition.” Proceedings of the IEEE 86 (11): 2278–324. https://doi.org/10.1109/5.726791.

↩︎ Why evaluation on curated data must be validated against field conditions is established in Stage 4: Evaluation and Validation.

5.6.3 Shared pipeline architecture

Feeding raw envelope scans straight into a digit classifier fails because the network expects isolated, size-normalized characters rather than full addresses on textured paper, and its raw scores still need a rejection rule before they can trip a sorting gate. The composite six-stage pipeline in figure 22 separates the work shared by postal ZIP-code research and deployed bank-check readers (rather than reconstructing a single historical machine): upstream preprocessing segments and normalizes the scanned digits, the neural network scores each candidate digit, and downstream postprocessing compares those scores against confidence thresholds, passing accepted digits to the sorter while routing ambiguous ones to human review.

Figure 22: Document-Recognition Pipeline: A composite six-stage flow distilled from postal ZIP-code research and deployed check-reading systems. Image acquisition and conventional preprocessing prepare handwritten digits for neural inference, and raw scores then pass through postprocessing to the final application output.

The upstream boundary pairs image acquisition with conventional preprocessing. In postal research, the raw input was an image of a handwritten ZIP-code region, and deployed check readers similarly began with scanned document images; acquisition quality determines how much variation the downstream stages must absorb. Preprocessing then locates the relevant field, separates or identifies its characters, and normalizes the resulting images through conventional techniques such as thresholding, connected-component analysis, and size normalization. (The chapter uses standardized \(28{\times}28\) images for its MNIST calculations as a teaching convention, not a claim about every postal or check-reading deployment.)

Once the digits are normalized, the neural network scores each candidate image and hands those scores to postprocessing. The 1989 ZIP-code research system used an early LeNet variant (LeCun et al. 1989) with approximately 10,000 parameters, occupying approximately 40 KB in single precision, an order of magnitude smaller than the 109.4K in this chapter’s fully connected MNIST network. Downstream postprocessing then converts those digit scores into application decisions with the threshold rule of section 5.6.1: for a ZIP-code task, a single uncertain digit can route the entire code to further processing or human review. Because every stage from acquisition to that downstream action counts against the reader’s end-to-end timing constraint, throughput depends on the complete pipeline rather than neural-network latency alone.

5.6.4 Performance outcomes and operational impact

The 1989 ZIP-code study reported its model, recognition, throughput, and training measurements as one experimental system. Table 11 keeps those measurements together, revealing how rejection policy and preprocessing affect the meaning of raw classifier speed (LeCun et al. 1989).

Table 11: Early ZIP-Code Recognition Results: Measurements from the 1989 backpropagation system applied to USPS-supplied digit images. The rejection result shows why an operational error rate must be read together with the fraction of inputs withheld from automatic classification (LeCun et al. 1989).
LeCun, Yann, Bernhard Boser, John S. Denker, Donald Henderson, Richard E. Howard, Wayne Hubbard, and Lawrence D. Jackel. 1989. “Backpropagation Applied to Handwritten Zip Code Recognition.” Neural Computation 1 (4): 541–51. https://doi.org/10.1162/neco.1989.1.4.541.
Metric Reported Result
Error and rejection 1% classification error after rejecting 12.1% of test digits
Throughput 10–12 classifications/sec including acquisition; over 30/sec after normalization
Model parameters ~10,000
Training 23 passes; about 3 days on a Sun-4/260 workstation

These measurements highlight three systems trade-offs across the pipeline:

First, the measured rate depended on the measurement boundary. The system exceeded 30 classifications per second after normalization but processed 10 to 12 per second including acquisition. The reciprocal rates are completion intervals, not necessarily individual-digit latencies when stages overlap. The comparison exposes surrounding acquisition and preprocessing work, but does not allocate that work among mechanical handling, scanning, and segmentation. Stage timings are needed before choosing which part of the complete path to accelerate.

Second, operational reliability depended on an explicit rejection pathway. The experiment rejected 12.1 percent of test digits rather than forcing a classification for every input, and rejecting this tail of high-uncertainty predictions reduced the observed classification error on the remaining automated stream to 1 percent. That is one point on the risk-coverage curve of section 5.6.1, and the expected-cost rule there decides whether it is the right one; the 12.1 percent becomes a review workload that the rule must account for.

Third, training-time cost constrained the exploration of model sizes. Training 10,000 parameters required 23 passes across roughly three days on a Sun-4/260 workstation. That measurement shows the cost of the reported configuration; it does not establish a universal maximum model size for the era. Larger candidates would require a new compute, memory, and training-time budget.

Maintaining these systems in production introduces lifecycle requirements beyond model training. Changes in scanner optics, ink formulations, envelope textures, or regional writing styles cause input distributions to drift over time. Production monitoring must track input image statistics and rejection rates alongside raw classification latency, prompting investigation when rejection threatens review capacity. Whether the remedy is data collection, preprocessing repair, threshold adjustment, or retraining depends on the cause and on validated error costs.

↪ How production monitoring detects silent degradation from input drift while code and weights stay unchanged is developed in Production Monitoring.

5.6.5 Key engineering lessons and design principles

Across postal ZIP-code research and deployed check readers, neural computation succeeded only when the surrounding pipeline shared its operating constraint. Each of the chapter’s mechanisms reappears in that pipeline at system scale. The forward-pass operation count set the cost of inference, but the gap between more than 30 classifications per second after normalization and 10 to 12 per second including acquisition is the Amdahl effect of the boundary stages that the inference section predicted. The network’s output scores became decisions only through a threshold whose position traded automated volume against residual error. The convolutional reader’s parameter footprint, an order of magnitude below the fully connected network’s, shows that connectivity patterns, not layer depth alone, govern the state a model must store. A layer that slides one small set of weights across every image position stores far fewer parameters than one that gives every pixel its own weight, although fewer weights do not guarantee smaller activation tensors, and Network Architectures builds its architectures on that choice of connectivity.

Modern edge systems face different power, latency, and deployment budgets, but the same three obligations hold. Preprocessing must absorb the variability of the physical world before the network sees it, confidence thresholds must protect the downstream error budget, and end-to-end throughput, not model latency alone, governs how much model capacity the system can afford. The deployed reader worked because its data, network, and machine fit each other, and the running network’s own numbers show that alignment one axis at a time.

↩︎ The D·A·M taxonomy and its three diagnostic axes are established in Defining ML Systems.

Self-Check: Question
  1. Which interpretation of the reported 1989 handwritten-digit recognition results is justified by the chapter’s document-recognition case study?

    1. The low post-rejection error means the system’s neural classifier was already accurate enough that the rejection policy was mostly irrelevant to interpreting the result.
    2. Because throughput after normalization exceeded \(30\) classifications per second, individual classification latency must also have improved by the same factor even if other stages overlapped differently.
    3. The reported rates should be interpreted as measurements of only the neural classification stage, because acquisition and normalization are outside the learned model itself.
    4. The study reported \(1\%\) classification error after rejecting \(12.1\%\) of test digits, with 10–12 classifications per second including acquisition and over \(30\) per second after normalization, so the result must be read as a pipeline measurement with an explicit rejection policy rather than as error-free full automation.
  2. The chapter compares an early LeNet-class reader with the chapter’s modern MNIST multilayer perceptron. What conclusion is actually justified by that comparison?

    1. The earlier system must have had lower latency and energy because smaller historical models usually required less computation.
    2. The defensible comparison is structural continuity: both systems transform normalized pixels into digit scores inside a larger preprocessing-and-decision pipeline, but unmatched data, models, software, hardware, and operating targets mean latency or energy cannot be inferred from parameter count alone.
    3. Because modern models usually have more parameters, parameter count alone is enough to infer which system is faster and more energy efficient.
    4. Once two systems both classify handwritten digits, differences in preprocessing and deployment policy are no longer important to systems analysis.
  3. In the document-recognition pipeline, explain why forcing an automated prediction on \(100\%\) of inputs is not the sole objective when setting the rejection threshold.

  4. Describe how the chapter’s composite document-recognition architecture decomposes the task into a multi-stage pipeline, and explain why the neural classifier alone is not sufficient.

  5. In the composite document-recognition pipeline, the preprocessing step that isolates individual handwritten character images from a multi-digit region is called digit ____.

  6. Order the following stages of a composite document-recognition pipeline: (1) pass accepted results to the application or defer uncertain cases to review, (2) evaluate scores against validated acceptance thresholds, (3) capture image, (4) run inference on normalized digits, (5) locate, segment, and normalize digits.

See Answers →

5.7 D·A·M Reading of Neural Computation

In the D·A·M taxonomy, each axis fixes one of the running network’s headline numbers, and the data axis fixed the largest weight matrix before any design choice was made. A \(28{\times}28\) image flattens to 784 inputs, so the first layer holds 100,352 weights and performs 91.9 percent of the network’s arithmetic. The same digits scanned at \(56{\times}56\) would quadruple that matrix to 401,408 weights without changing the model’s depth or the task. Data also decides whether those weights are worth learning. USPS ZIP images, MNIST digits, and check images share digit semantics but come from different scanners, thresholds, and layouts, and no preprocessing step can synthesize handwriting styles that the training set never contained.

The algorithm axis set how that matrix meets the machine. Batch size is an algorithmic choice, and it moved the forward pass’s arithmetic intensity from about 0.5 FLOP/byte at batch 1 to about 11.9 FLOP/byte at batch 32, because one read of each weight now serves 32 images. The same choice multiplied the activations that training must keep, which is why training holds 3.4× the memory of inference at matched batch size.

The machine axis decided whether learning survives at all. A gradient smaller than its format’s smallest normal value, \(6.10 \times 10^{-5}\) in FP16 against \(1.18 \times 10^{-38}\) in FP32, loses precision or flushes to zero and stops updating its weight, and a value beyond the format’s maximum overflows to Inf. Narrower formats halve or quarter memory traffic and unlock faster matrix units, but only while gradients and activations still fit the format’s range.

No axis can be tuned alone. A larger input improves fidelity but grows the first weight matrix, a larger batch improves reuse but grows training memory, and a narrower format speeds the machine but endangers the gradients. Diagnosing an accuracy shortfall, a latency violation, or an out-of-memory fault therefore starts with a hypothesis on each axis and ends with a measurement of the quantity that binds, because an intervention on one axis routinely moves the binding constraint to another. Teams that skip that measurement tend to fall into a small set of recurring traps.

↪ Screening heuristics that narrow these competing hypotheses, each confirmed against profiler traces and hardware counters, are collected for reference in Screening rules of thumb.

Self-Check: Question
  1. Under the D·A·M (Data, Algorithm, Machine) taxonomy presented in the chapter, which statement correctly describes the primary responsibility of each axis and their systems interplay?

    1. Data determines GPU clock speed, Algorithm dictates physical memory capacity, and Machine formats training labels.
    2. Algorithm determines whether data is collected, Machine ensures 100% training accuracy, and Data operates independently of both.
    3. Data, Algorithm, and Machine can be optimized independently without cross-axis trade-offs.
    4. Algorithm defines computational transformations and capacity, Data determines whether the model can learn the task from representative evidence, and Machine determines whether those operations execute within latency, throughput, memory, and energy budgets.
  2. A computer vision model deployed in production exhibits high accuracy during offline benchmark evaluations but suffers severe error rates on live camera feeds, while hardware GPU utilization is only \(15\%\). Use the D·A·M taxonomy to outline a structured diagnostic sequence to isolate the root causes.

  3. According to the D·A·M taxonomy, if a deployed computer vision model suffers elevated error rates in production due to a distribution shift in ambient lighting and camera angles, why will scaling the Machine axis (allocating a larger cluster of faster GPUs) fail to resolve the operational failure?

    1. Hardware accelerators automatically reduce optimizer learning rates when cluster size increases.
    2. Faster GPU accelerators cannot process image tensors captured at non-standard aspect ratios.
    3. Machine scaling accelerates computational throughput but cannot supply the missing visual patterns or domain coverage required on the Data axis to learn the shifted distribution.
    4. The D·A·M framework requires all production deployments to execute on single-thread CPU cores.

See Answers →

5.8 Fallacies and Pitfalls

Statistical learning adds failure modes that line-by-line code inspection alone cannot reveal. Each of the recurring mistakes below treats a property of the data, the optimization, or the machine as if the model’s source code alone decided it.

Fallacy: Neural networks are entirely opaque and cannot be debugged.

Neural networks do not offer the line-by-line causal trace of traditional code, but they are not beyond diagnosis. Activation visualization can reveal learned patterns, gradient analysis measures local input sensitivity, and ablation studies estimate component contributions. These tools provide partial evidence rather than a complete explanation: gradient-based saliency maps (per-input sensitivity heat maps) can be unstable, correlated features complicate attribution, and an ablation may change the behavior it is meant to probe. For the MNIST classifier in section 5.3.2, first-layer weights can still provide a useful check on what patterns the model has learned. Debugging a statistical system therefore combines model-level probes with data slices, controlled interventions, and end-to-end evaluation.

Pitfall: Discarding domain expertise because a deep model is available.

Teams assume automatic feature learning removes the need for domain knowledge. Successful systems require domain expertise at every stage: architecture selection, training objective design, dataset curation, and output interpretation. The document-recognition history in section 5.6 shows why confidence thresholds must reflect operating economics and route uncertain cases to human operators. Without domain knowledge, teams can deploy networks that look strong on a test set but fail in production because their thresholds, fallback paths, or error costs are wrong.

Fallacy: Deeper networks are always more accurate than wider ones.

Engineers assume that stacking more layers is the primary path to higher accuracy, since depth enables hierarchical feature extraction. In practice, depth alone encounters diminishing returns. ResNet showed that very deep residual networks can train effectively, yet its 1,202-layer CIFAR-10 network tested worse than its 110-layer counterpart (He et al. 2016). EfficientNet, a family of image classifiers, later demonstrated that compound scaling of width, depth, and input resolution can outperform depth-only scaling at a given resource budget (Tan and Le 2019). Depth is not the problem. Teams should profile capacity utilization and scale the dimension that gives the best accuracy per FLOP, since depth adds sequential steps and saved activations while width adds arithmetic inside each step (equation 10).

Tan, Mingxing, and Quoc V Le. 2019. “EfficientNet: Rethinking Model Scaling for Convolutional Neural Networks.” International Conference on Machine Learning (ICML), 6105–14.

Fallacy: Training data distribution issues can be fixed after model design.

Teams treat training as mechanically feeding data through architectures. Networks on imbalanced datasets often perform poorly on the minority class: a fraud detector with 99:1 imbalance achieves 99 percent accuracy by always predicting “not fraud” while catching zero fraud cases. The unweighted batch average of equation 16 can underweight rare but critical classes unless sampling, weighting, loss design, and evaluation address the imbalance. Teams that skip exploratory data analysis may deploy models with strong aggregate metrics but unacceptable minority-class performance.

Pitfall: Deploying research models to production without addressing system constraints.

Production adds constraints absent from research: latency budgets (50–100 ms end-to-end), memory limits (2–4 GB for edge devices), and concurrent loads (100–1,000 requests per second (RPS)). The complete pipeline includes preprocessing, inference, and postprocessing (section 5.5). A model achieving 20 ms inference fails its 50 ms budget when preprocessing adds 25 ms and postprocessing adds 10 ms (55 ms total). Separating model development from system design therefore wastes effort on accuracy while ignoring deployment feasibility.

Fallacy: More compute automatically means faster training.

Teams purchase expensive GPUs expecting proportional speedups, but memory traffic or launch overhead may bind performance instead. Arithmetic intensity tests that hypothesis (figure 14). The MNIST forward pass in table 7 reaches only about 11.9 FLOP/byte at batch 32 (notebook 5.1) and less at batch 1, while the ridge point \(\PeakRate/\Bandwidth\), the intensity a workload needs before peak compute can bind, sits above it on both machines at FP32 and far higher at the reduced-precision peak rates of data-center accelerators. A faster chip therefore leaves this workload waiting on memory, or on kernels too small to fill the machine; the roofline model in Performance Bounds makes the condition precise, and measured speedup remains the final test.

Pitfall: Extrapolating accuracy improvements without considering diminishing returns.

Teams may extrapolate a 5-point gain from scaling 10K parameters to 100K into another 5-point gain at 1M. Empirical improvement instead diminishes with scale according to the task, metric, data quality, model family, and scaling regime. Published benchmark histories cannot settle the question either. ImageNet top-5 error fell from AlexNet’s 15.3 percent to 3.6 percent for a ResNet ensemble (Krizhevsky et al. 2012; He et al. 2016) while training compute rose by more than an order of magnitude (Amodei and Hernandez 2018), but those systems mix new architectures with more compute, so they do not isolate the return on scale alone. Teams must therefore measure marginal return within one model family in their own regime rather than extrapolate linearly.

He, Kaiming, Xiangyu Zhang, Shaoqing Ren, and Jian Sun. 2016. “Deep Residual Learning for Image Recognition.” 2016 IEEE Conference on Computer Vision and Pattern Recognition (CVPR), 770–78. https://doi.org/10.1109/cvpr.2016.90.
Amodei, Dario, and Danny Hernandez. 2018. “AI and Compute.” OpenAI Blog 2.

These fallacies and pitfalls share a common root: treating statistical behavior as if code behavior alone determined it. Recognizing them early directs attention toward the appropriate measurements and diagnostics.

Self-Check: Question
  1. An engineering team migrates a small multilayer perceptron inference workload with low arithmetic intensity from a CPU to a high-end GPU featuring \(10\times\) higher peak TFLOP/s, but observes less than a \(1.2\times\) end-to-end speedup. Which systems explanation correctly diagnoses this outcome?

    1. The workload may be limited by memory traffic, launch overhead, or underutilization rather than peak arithmetic throughput, so the next step is to measure bandwidth use, kernel timelines, achieved utilization, and end-to-end stage breakdowns.
    2. The model should be tuned only for the highest achieved TFLOP/s metric, because low arithmetic intensity means memory behavior is no longer informative.
    3. The small speedup proves the CPU implementation is already optimal, so further measurement of competing bottlenecks is unnecessary.
    4. Because GPU utilization is lower than peak TFLOP/s, the only meaningful next step is to increase parameter count until the accelerator saturates.
  2. On a fraud detection dataset where \(99.5\%\) of transactions are legitimate and \(0.5\%\) are fraudulent, a newly trained classifier achieves \(99.4\%\) aggregate accuracy on held-out test data. Why is this aggregate metric deceptive from an ML systems engineering standpoint?

    1. Cross-entropy loss is undefined when class proportions differ by more than \(10\times\).
    2. An accuracy of \(99.4\%\) exceeds the theoretical mathematical limit of floating-point representation.
    3. A naive baseline that blindly predicts ‘legitimate’ for every transaction achieves \(99.5\%\) accuracy; an aggregate \(99.4\%\) accuracy can conceal a near-\(100\%\) failure rate on detecting actual fraud cases.
    4. High accuracy on an imbalanced dataset causes immediate GPU out-of-memory errors during inference.
  3. A development team attempts to improve model accuracy by repeatedly stacking additional layers to a neural network (scaling depth alone) without modifying layer widths or input resolution. Why does this depth-only scaling strategy typically suffer from diminishing returns and training instability?

    1. Adding layers automatically reduces total parameter count by compressing intermediate representations.
    2. Increasing depth alone elongates the backpropagation chain-rule path, amplifying vanishing and exploding gradient risks while increasing sequential execution latency, without providing the balanced capacity gains of compound scaling across width, depth, and resolution.
    3. Modern GPU hardware architectures cannot allocate computational graphs with more than 10 layers.
    4. Deeper networks are legally restricted from using nonlinear activation functions.
  4. A colleague argues that ‘because neural networks contain millions of weights functioning as an uninterpretable black box, they cannot be systematically debugged when prediction errors occur.’ Refute this claim by describing three concrete systems diagnostic techniques used to debug neural models.

  5. During a model training run, an engineer observes that training loss continuously decreases across 50 epochs, but validation loss reaches a minimum at epoch 20 and increases steadily thereafter. Diagnose the model’s operational regime and describe a sensible next workflow.

See Answers →

5.9 Summary

Neural computation turns layer equations into physical work on a processor. Linear algebra and calculus determine operation cost under the iron law of ML systems (\(\Time = \frac{\DataVolume}{\Bandwidth} + \frac{\Operations}{\PeakRate \cdot \EfficiencyHw} + \Latency\)). Forward propagation establishes the computational work \(\Operations\), often dominated by matrix multiplications, while the complete training step adds backward computation and optimizer updates. Backpropagation needs saved or recomputed forward values and gradient storage; the optimizer may add persistent state. Architecture, batch size, precision, optimizer, and recomputation strategy determine the state footprint. Residency, reuse, and execution then determine the bytes transferred, \(\DataVolume\), which need not equal that footprint. These mechanics make memory footprints, arithmetic intensities, and latency limits estimable before deployment. Table 1, from the chapter’s opening, now reads as a summary of where each stage spends them, and every row has been derived for the running network.

Replacing hand-written decision rules with parameters learned from data turns feature engineering into matrix arithmetic. Layered compositions of weighted sums, nonlinear activations, and gradient updates form hierarchical representations that convert raw inputs into predictions. Training adjusts connection weights through iterative optimization, while inference applies fixed parameters to incoming data. The two phases make very different demands on the machine. In this chapter’s FP32 estimate, a batch-32 training step requires ~3.4× the memory of batch-32 inference because training retains saved activations and gradients alongside the optimizer’s additional buffers. In production, as the document-recognition case study demonstrated, these mathematical kernels do not run in isolation; preprocessing, neural inference, rejection, and postprocessing must jointly satisfy a single end-to-end latency and reliability budget.

Key Takeaways: The math behind the model
  • Each paradigm shift changes the systems cost of representation: In this \(28{\times}28\) digit example, the operation count rises from ~100 comparisons (rule-based) through ~8,000 operations (classical ML) to 109,184 MACs (deep learning), a 1,100× scenario increase that reshapes hardware requirements.
  • The loss is cheap but seeds every update: Cross-entropy costs a few operations per class score, yet its gradient, the predicted probability minus the target, is the error signal from which every gradient update descends. What the system must protect is the loss’s numerical range, which is why runtimes fuse softmax with cross-entropy.
  • Training and inference often emphasize different objectives: Training commonly favors efficient throughput across repeated updates, while online inference commonly favors per-request latency; offline inference may favor throughput instead. Batch size links utilization, memory, throughput, latency, and statistical behavior across these regimes.
  • Activations are math and hardware: ReLU is generally cheaper to implement than sigmoid or tanh, and its unit gradient for positive inputs avoids activation saturation on that branch. Its practical advantage combines implementation cost with optimization behavior.
  • Forward propagation often centers on matrix work: Dense matrix kernels exceed 99 percent of FLOPs in this chapter’s dense-network example and dominate many important neural workloads, which is why specialized matrix hardware can substantially outperform general-purpose execution for those operations.
  • Backpropagation needs the path: Solving credit assignment requires retaining or recomputing the values used by the backward pass, so memory cost often determines whether a model can be trained on a given device and motivates techniques that reduce, recompute, or partition training state.
  • The complete ML pipeline determines end-to-end performance: Preprocessing, neural computation, and postprocessing all contribute to latency and reliability. The document-recognition examples demonstrated that production success depends on the entire pipeline operating within real-world constraints, not on model accuracy on a test set alone.

The escalation from hand-written rules to learned features is the algorithm axis of the D·A·M taxonomy made concrete. Learning representations instead of writing them spends arithmetic and memory in place of human design effort, and every systems dimension in table 2 shifts as a result. The bitter lesson predicts that this exchange wins once computation is cheap enough to afford it, but making the exchange still requires a measured gain that justifies its cost on the intended machine.

The multilayer perceptrons analyzed in this chapter expose a direct resource law, in which dense connectivity forces both parameter storage and multiply-accumulate count to scale with the product of adjacent layer dimensions. That dense connectivity contains no explicit prior for spatial locality, so the model must learn from data which nearby and distant pixel relationships matter, while paying memory bandwidth and storage to evaluate every connection.

Reading the code reveals what a network is asked to do; reading the math reveals what it will cost to execute. That arithmetic is where the algorithm meets the machine: weights must be stored and transferred, dense layers map to matrix execution engines, and saved activations claim accelerator memory that determines whether training fits on device. Under the silicon contract (principle 4), the math commits in advance to operations the machine must execute. Auditing that contract allows systems engineers to calculate binding bottlenecks from first principles before profiling confirms where the execution stalls.

What’s Next: From universal to specialized
Real-world data is rarely structureless. Images have spatial locality, text contains sequential dependencies, and audio signals follow temporal patterns, yet a fully connected layer charges memory volume \(\DataVolume\) and compute work \(\Operations\) for every connection regardless. Network Architectures assembles the same weighted sums, activations, and gradients into architectures shaped like their data, from convolutional and recurrent networks to transformers and embedding-heavy recommenders, each encoding its structural assumption as an inductive bias. Tailoring network topology to data structure reduces redundant data movement and improves weight reuse, but introduces new trade-offs in activation storage, arithmetic intensity, and accelerator parallelization.

5.10 Self-Check Answers

Self-Check: Answer
  1. An engineer deploys the same neural network model on an accelerator with high GPU memory and on an older accelerator with smaller memory capacity. The model executes cleanly on the larger card but crashes mid-batch on the smaller card with a CUDA out-of-memory error on an intermediate activation tensor, without generating a Python traceback. Per the Silicon Contract perspective of neural computation, which diagnostic approach addresses the root cause of this failure?

    1. Audit the Python application code and framework version to identify an unhandled control-flow software exception.
    2. Increase logging verbosity to capture a Python traceback, assuming the crash stems from glue-code syntax errors.
    3. Downgrade the GPU driver and CUDA toolkit under the assumption that the newer driver introduced backward-incompatibility bugs.
    4. Calculate the intermediate activation and parameter memory requirements directly from layer tensor dimensions, because the mathematical operators—not the application code—determine the physical memory demands.

    Answer: The correct answer is D. The Silicon Contract states that mathematical operators determine the memory and compute workload of a model. The intermediate activation memory required by dense layers and attention mechanisms is dictated by tensor dimensions and batch size; when this requirement exceeds physical accelerator memory capacity, an out-of-memory error occurs regardless of code syntax. Auditing Python control flow or increasing logging treats an operator-level resource exhaustion as an application software bug. Downgrading drivers ignores the physical memory ceiling set by the model’s tensor dimensions.

    Learning Objective: Analyze a hardware-dependent neural network failure by reasoning from tensor operator dimensions rather than application code

  2. Recognizing one MNIST digit requires approximately \(109{,}000\) multiply-accumulate operations. Explain why a traditional control-flow debugger is insufficient when such a network fails, and describe how its failures differ from those of a rule-based program.

    Answer: A traditional debugger inspects branches and control flow, but the network contains no logical branches to inspect, only a fixed sequence of arithmetic. Such a program rarely fails logically. It fails numerically, as values grow or shrink until they stop carrying information, or it fails on resources when its tensors exceed the memory the machine provides. Diagnosing it therefore means checking numerical range and memory demand against the operators’ tensor dimensions rather than stepping through control flow.

    Learning Objective: Explain why neural workloads fail numerically or on memory rather than logically

  3. True or False: In the iron law of ML systems (\(T = \frac{D_{\text{vol}}}{\text{BW}} + \frac{O}{R_{\text{peak}} \cdot \eta_{\text{hw}}} + L_{\text{lat}}\)), the shift from rule-based logic to dense neural computation primarily increases the network latency term \(L_{\text{lat}}\) because matrix multiplications introduce distributed network round-trips.

    Answer: False. The shift from branching rules to dense neural computation primarily increases the operation term \(O\) and often the stored state that can later drive more realized memory traffic, while \(L_{\text{lat}}\) is the nonoverlapped latency term more broadly, not just network round-trips. Local matrix arithmetic does not intrinsically create distributed communication, though implementation, precision, and reuse still affect the realized bytes moved and time paid.

    Learning Objective: Analyze how the shift from rule-based logic to dense neural computation maps onto the iron law’s compute, data-movement, and latency terms

← Back to Questions

Self-Check: Answer
  1. A team replaces a hand-coded digit recognition system (\(\approx 100\) conditional comparisons, \(784\text{ bytes}\) of working state) with a \(784 \to 128 \to 64 \to 10\) MLP (\(\approx 109{,}184\text{ MACs}\), \(\approx 438\text{ KB}\) of weights) on the same MNIST input. Which systems consequence should they expect when deploying this new model on a commodity CPU?

    1. The workload becomes dominated by branch mispredictions because artificial neurons execute frequent if-then branching decisions.
    2. The workload transitions from branch-heavy scalar code to dense matrix arithmetic whose weight footprint exceeds L1 cache capacity, generating cache-level memory traffic absent in the rule-based system.
    3. Execution memory traffic drops to zero because the \(438\text{ KB}\) weight footprint fits entirely within standard CPU register files.
    4. The model executes without using arithmetic logic units (ALUs) because learned representations bypass hardware compute pipelines.

    Answer: The correct answer is B. Replacing rule-based logic with an MLP shifts the workload from branch-heavy scalar instructions to dense linear algebra (\(\approx 109{,}184\text{ MACs}\)). The \(\approx 438\text{ KB}\) parameter footprint exceeds typical CPU L1 data cache sizes (typically \(32\text{ KB}\) to \(48\text{ KB}\)), creating cache-level memory traffic to stream weights. Dense neural layers execute regular arithmetic without if-then branches, making branch prediction irrelevant. CPU register files hold at most a few kilobytes and cannot store hundreds of kilobytes of weights. Matrix arithmetic heavily utilizes ALU and SIMD execution units.

    Learning Objective: Apply the MNIST paradigm workload numbers to predict the primary hardware bottleneck when switching from rule-based to dense neural computation

  2. A hardware vendor claims that increasing single-threaded CPU clock frequencies by \(5\times\) will eliminate the necessity of specialized accelerators (such as GPUs or TPUs) for deep neural networks. Based on the computational profile of neural networks, what is the strongest technical refutation of this claim?

    1. Deep learning is dominated by massive parallel matrix multiplications bounded by arithmetic throughput and memory bandwidth, which benefit from thousands of parallel SIMD/tensor units rather than higher scalar clock speeds.
    2. Higher CPU clock frequencies force the loss function to become non-convex, destabilizing gradient descent.
    3. Modern neural networks require asynchronous analog circuits that cannot be simulated on digital CPU cores.
    4. Increasing CPU clock frequencies reduces the numerical precision of floating-point registers to 4-bit integers.

    Answer: The correct answer is A. Neural network forward and backward passes consist of large-scale, uniform matrix-matrix and matrix-vector multiplications. These workloads are bounded by parallel arithmetic throughput and off-chip memory bandwidth (the Memory Wall). Accelerators succeed by providing thousands of arithmetic execution units and high-bandwidth memory (HBM), whereas raising scalar clock speed provides only linear improvement to sequential execution without increasing memory bandwidth or SIMD parallel width. The geometry of the loss surface is an algorithmic property independent of processor frequency. Neural networks execute on digital floating-point hardware. Clock frequency scaling does not alter IEEE floating-point precision.

    Learning Objective: Evaluate why parallel matrix arithmetic maps to specialized accelerator architectures rather than higher-frequency scalar processors

  3. A computer vision team evaluates two approaches for a multi-class recognition task: (a) a handcrafted feature pipeline (e.g. HOG + SVM) and (b) an end-to-end convolutional neural network. Compare the systems engineering trade-offs between these two approaches when the product must scale from 2 initial categories to 50 diverse object categories.

    Answer: Handcrafted feature pipelines (HOG + SVM) offer low per-image inference compute but require extensive manual engineering to design and tune descriptors for new object classes, creating a human labor bottleneck and fragmented preprocessing code. End-to-end neural networks automate feature discovery by learning hierarchical representations directly from data using uniform tensor operations, replacing ongoing feature-engineering labor with increased training data collection, accelerator compute requirements, and memory bandwidth demands.

    Learning Objective: Compare the systems and maintenance trade-offs of handcrafted feature engineering against end-to-end learned representations

  4. Explain the systems-level concept of the ‘algorithm-hardware adoption lag’ using the historical trajectory of backpropagation (Werbos 1974 / Rumelhart et al. 1986) and modern deep learning. Which surrounding factors had to mature before the algorithm achieved widespread practical viability?

    Answer: An algorithm can exist long before the surrounding system makes it useful at scale, and backpropagation was known decades before modern deep learning became practical. Every increase in model size multiplies forward operations, saved activations, gradient computations, and parameter updates, so in this chapter’s account the gap reflects the maturation of hardware, data, initialization, nonlinearities, optimization, benchmarks, and software infrastructure. No single factor sufficed; together they turned an older learning rule into a practical workflow. The lesson does not run in reverse, since expense alone does not vindicate a computationally costly idea.

    Learning Objective: Explain how the maturation of hardware, data, training techniques, and software infrastructure resolved the adoption lag for backpropagation-based deep learning

  5. True or False: For a tabular dataset with 500 records and linear relationships between features and targets, deploying a deep neural network is generally superior to a linear regression model because deep networks inherently generalize better across all problem scales.

    Answer: False. On small tabular datasets (\(<1{,}000\) samples) with linear relationships, deep neural networks are prone to severe overfitting, require substantial hyperparameter tuning and compute resources, and introduce complex deployment and monitoring pipelines. A linear model is a sensible baseline for the stated relationships and can require less training and deployment effort. Small sample size does not guarantee generalization for either model; held-out evaluation must establish whether added neural-network complexity earns a useful gain.

    Learning Objective: Justify selecting simpler linear models over deep neural networks for small sample size tabular workloads

  6. Order the pattern-computing paradigms as the chapter presents their progression, from explicit logic to learned representations: (1) Deep learning with automatic hierarchical feature discovery on parallel accelerators, (2) Rule-based programming with explicit hand-authored logical branches, (3) Classical machine learning pairing hand-engineered feature extractors (e.g. HOG) with statistical classifiers.

    Answer: The correct order is: (2) Rule-based programming with explicit hand-authored logical branches, (3) Classical machine learning pairing hand-engineered feature extractors (e.g. HOG) with statistical classifiers, (1) Deep learning with automatic hierarchical feature discovery on parallel accelerators. Rule-based programs encode every decision as a hand-written branch and fail on coverage (2); classical ML learns the decision from data but still depends on expert-designed descriptors such as HOG (3); and deep learning learns the features themselves as hierarchical representations, at the cost of dense arithmetic suited to parallel accelerators (1).

    Learning Objective: Classify the historical progression of pattern computation paradigms from explicit logic to automatic deep representations

← Back to Questions

Self-Check: Answer
  1. In a fully connected multilayer perceptron with layer dimensions \(784 \to 128 \to 64 \to 10\), which layer represents the primary parameter storage and computational hotspot, and what is its weight parameter count?

    1. The \(64 \to 10\) output layer with \(640\) weights, because the softmax denominator forces quadratic parameter expansion.
    2. The \(128 \to 64\) hidden layer with \(8{,}192\) weights, because it bridges intermediate representations.
    3. The \(784 \to 128\) input layer with \(100{,}352\) weights (\(784 \times 128\)), accounting for over \(91\%\) of the network’s total weight parameters and forward MACs.
    4. All three layers have identical parameter counts because linear algebra kernels require static square matrix padding.

    Answer: The correct answer is C. The first dense layer connects 784 inputs to 128 hidden neurons, requiring \(784 \times 128 = 100{,}352\) weights. The second layer requires \(128 \times 64 = 8{,}192\) weights, and the output layer requires \(64 \times 10 = 640\) weights (totaling \(109{,}184\) weights). The first layer accounts for over \(91\%\) of the weights and forward multiply-accumulate operations. The output layer contains only 640 weights, and softmax normalization does not add weights. The second layer contains less than one-tenth the parameters of the first. Layer dimensions reflect actual weight matrices rather than mandatory square padding.

    Learning Objective: Calculate and identify the parameter and computational hotspots across layers of a fully connected neural network

  2. From a hardware and systems engineering perspective, why has the Rectified Linear Unit (\(\text{ReLU}(z) = \max(0, z)\)) largely replaced Sigmoid (\(\sigma(z) = \frac{1}{1 + e^{-z}}\)) in deep hidden layers?

    1. ReLU makes many activations exactly zero, which by itself guarantees dense end-to-end training speedups on standard hardware and prevents gradient decay through the whole network.
    2. ReLU uses a simple comparison/select operation instead of exponential-based computation, and its derivative is \(1\) on the positive branch, which avoids local saturation there even though full-network gradients still depend on weights and other layers.
    3. Sigmoid and ReLU have essentially the same execution cost on modern hardware, so the preference for ReLU comes mainly from its bounded output range \([0,1]\).
    4. Because ReLU has lower local compute cost than sigmoid, switching activations alone always reduces end-to-end training time regardless of the rest of the model or input pipeline.

    Answer: The correct answer is B. ReLU is cheaper to execute because it uses a comparison/select operation rather than exponential-based computation, and on positive activations its derivative is \(1\), so that branch does not locally saturate the learning signal the way sigmoid can. A claim that ReLU guarantees nonvanishing gradients for the whole network goes too far: the complete gradient still includes weights and other Jacobian factors. The “always reduces end-to-end training time” idea also overstates the effect, because overall training time still depends on the rest of the model, memory traffic, and the surrounding pipeline.

    Learning Objective: Compare ReLU and sigmoid in terms of hardware execution cost and their local effect on gradient flow in deep hidden layers

  3. Explain why stacking multiple linear layers without nonlinear activation functions (\(\mathbf{y} = \mathbf{x}\mathbf{W}_1\mathbf{W}_2\mathbf{W}_3\)) fails to increase the expressive capacity of a neural network, and describe what changes once nonlinear activation functions are inserted between the layers.

    Answer: Stacking linear transformations alone does not increase expressive capacity because their composition is still a single linear transformation with effective matrix \(\mathbf{W}_{\text{eff}} = \mathbf{W}_1\mathbf{W}_2\mathbf{W}_3\). For example, no matter how many purely linear layers are stacked, the network still cannot represent a nonlinear pattern such as XOR. Once nonlinear activation functions are inserted between layers, the network can form nonlinear decision boundaries, which is what gives depth additional representational power.

    Learning Objective: Explain why a stack of linear layers is representationally equivalent to a single linear transformation and why nonlinear activations are required for additional expressive power.

  4. True or False: For compositional target functions where complex patterns decompose hierarchically into reusable sub-patterns, deep networks can represent some functions much more parameter-efficiently than shallow networks, and in restricted function classes that advantage can be exponential.

    Answer: True. The chapter’s claim is restricted: for certain compositional function classes, depth can reuse intermediate features and represent the target far more compactly than a shallow alternative. That does not mean every shallow model must memorize all combinations or that depth has a universal exponential advantage on every task.

    Learning Objective: Distinguish the restricted theoretical depth advantage for compositional function classes from an overgeneralized claim about all tasks

  5. In hardware accelerators for neural networks, the illustrative silicon-area and energy penalty of implementing transcendental activations such as sigmoid or softmax rather than simple piecewise-linear activations is referred to as the transistor ____.

    Answer: tax. The transistor tax is the chapter’s name for the extra implementation cost of functions like exponentials and divisions relative to simpler operations such as \(\text{ReLU}(z)=\max(0,z)\). The exact ratio is illustrative and depends on precision and implementation, not a hardware constant.

    Learning Objective: Identify the chapter’s term for the hardware implementation penalty associated with transcendental activation functions

  6. Order the computational and memory staging steps required to execute the forward pass of a single dense hidden layer for a batch of input tokens: (1) Apply the element-wise nonlinear activation function (e.g. ReLU) to preactivations, (2) Load the input activation matrix \(\mathbf{X}\) and layer weight matrix \(\mathbf{W}\) into execution registers/caches, (3) Perform the dense matrix multiplication \(\mathbf{X}\mathbf{W}\), (4) Broadcast and add the bias vector \(\mathbf{b}\) to obtain layer preactivations \(\mathbf{Z}\).

    Answer: The correct order is: (2) Load the input activation matrix \(\mathbf{X}\) and layer weight matrix \(\mathbf{W}\) into execution registers/caches, (3) Perform the dense matrix multiplication \(\mathbf{X}\mathbf{W}\), (4) Broadcast and add the bias vector \(\mathbf{b}\) to obtain layer preactivations \(\mathbf{Z}\), (1) Apply the element-wise nonlinear activation function (e.g. ReLU) to preactivations. Operands must first be staged from memory into caches and processor registers (2); the compute cores then execute the matrix-matrix multiply-accumulate operations (3); the bias vector is broadcast and added to form preactivations \(\mathbf{Z} = \mathbf{X}\mathbf{W} + \mathbf{b}\) (4); and finally the nonlinear activation function is applied element-wise to generate the layer output activations \(\mathbf{A} = \sigma(\mathbf{Z})\) (1).

    Learning Objective: Analyze the execution sequence of computational and memory staging steps in a dense layer forward pass

← Back to Questions

Self-Check: Answer
  1. A classification model trained with softmax cross-entropy outputs a predicted probability \(\hat{y}_c = 0.99\) for the correct target class on Example 1, and outputs \(\hat{y}_c = 0.01\) for the correct class on Example 2. Based on the definition of cross-entropy loss (\(\mathcal{L} = -\log(\hat{y}_c)\)) and the combined softmax cross-entropy logit gradient (\(\frac{\partial \mathcal{L}}{\partial z_c} = \hat{y}_c - 1\)), what are the relative loss values and gradient magnitudes for these two examples?

    1. Example 1 produces loss \(\approx 4.61\) and logit gradient \(-0.99\), while Example 2 produces loss \(\approx 0.01\) and logit gradient \(-0.01\).
    2. Both examples generate identical gradient magnitudes because softmax normalization forces the sum of class gradients to equal zero.
    3. Example 2 produces negative loss because probabilities below \(0.5\) invert the sign of the cross-entropy objective.
    4. Example 2 produces high loss (\(-\log(0.01) \approx 4.61\)) and an error gradient of \(0.01 - 1 = -0.99\), while Example 1 produces near-zero loss (\(-\log(0.99) \approx 0.01\)) and an error gradient of \(0.99 - 1 = -0.01\), yielding an error signal roughly \(99\times\) stronger on the misclassified example.

    Answer: The correct answer is D. Cross-entropy loss is \(-\log(\hat{y}_c)\). For Example 2, \(-\log(0.01) \approx 4.61\) and its logit gradient is \(\hat{y}_c - 1 = 0.01 - 1 = -0.99\). For Example 1, \(-\log(0.99) \approx 0.010\) and its logit gradient is \(0.99 - 1 = -0.01\). The misclassified example generates a loss over \(400\times\) higher and an update gradient magnitude \(99\times\) stronger than the confident correct prediction. Reversing the loss values confuses high error with correct classification. Softmax probabilities sum to 1 across classes for an individual sample, but gradients on different samples depend on model confidence. Logarithmic cross-entropy on probabilities in \([0, 1]\) is strictly non-negative.

    Learning Objective: Calculate and interpret the loss values and gradient signals produced by softmax cross-entropy on confident versus misclassified examples

  2. What is the primary computational complexity advantage of reverse-mode automatic differentiation (backpropagation) over numerical differentiation (finite differences) when training a neural network with \(P\) parameters?

    1. Backpropagation computes exact gradients for all \(P\) parameters in a single reverse graph traversal costing on the order of the forward graph, often approximately \(2\times\) forward-pass FLOPs for dense layers when both weight and input gradients are required, whereas numerical differentiation requires \(P\) separate forward passes costing \(\mathcal{O}(P \times \text{graph})\).
    2. Numerical differentiation is unstable for integer parameters, while backpropagation converts all tensors to complex numbers.
    3. Backpropagation eliminates the requirement to store or cache intermediate activations from the forward pass.
    4. Reverse-mode automatic differentiation executes without using the mathematical chain rule.

    Answer: The correct answer is A. Reverse-mode automatic differentiation (backpropagation) applies the chain rule in a single backward sweep, computing gradients with respect to all \(P\) parameters simultaneously with a computational cost proportional to the graph size. The roughly \(2\times\) backward-to-forward dense-matrix ratio assumes both weight and input gradients are required; ordinary parameter training can omit the first layer’s raw-input gradient product when no earlier trainable computation needs it. Numerical differentiation requires perturbing each parameter individually and evaluating the entire network, scaling as \(\mathcal{O}(P \times \text{graph})\)—which is computationally intractable for networks with millions or billions of parameters. Differentiation applies to continuous parameters rather than complex-number conversions. Backpropagation requires the relevant forward values to evaluate derivatives during the reverse pass; implementations retain or recompute those values. Backpropagation fundamentally relies on the chain rule.

    Learning Objective: Compare reverse-mode automatic differentiation to numerical differentiation in terms of computational complexity and graph traversal

  3. Distinguish between backpropagation** and gradient descent (the optimizer) in terms of their computational roles and memory requirements during training.**

    Answer: Backpropagation is a gradient-computation algorithm that applies the chain rule across the computational graph in reverse; its memory requirement is determined by retaining (or recomputing) intermediate forward-pass activations (\(\mathcal{O}(B \sum n_\ell)\)). Gradient descent (and optimizers like Adam) is the parameter update algorithm that consumes those gradients; its memory requirement is determined by maintaining optimizer state tensors, such as Adam’s first- and second-moment estimates.

    Learning Objective: Compare backpropagation and gradient descent in terms of computational execution and memory footprint

  4. Explain why the peak memory footprint during model training significantly exceeds the memory footprint during inference for the same model architecture and batch size. Identify the three major tensor categories present during training that are absent during inference.

    Answer: Inference requires memory only for model parameters and a small rotating buffer for the current layer’s activations. Training requires substantially more memory because it must store: (1) intermediate forward-pass activation tensors across all layers to evaluate chain-rule derivatives during backpropagation, (2) gradient tensors matching the shape of all trainable parameters, and (3) optimizer state buffers (such as Adam’s first- and second-moment estimates, which add \(2\times\) the parameter footprint).

    Learning Objective: Analyze why training memory exceeds inference memory by decomposing the training memory estimate into activations, gradients, and optimizer state

  5. True or False: In deep neural networks, vanishing gradients can occur when the full product of layer-wise Jacobian factors during backpropagation shrinks with depth, causing early-layer gradients to become extremely small.

    Answer: True. Backpropagation multiplies together Jacobian factors across the network, so gradients reaching early layers can decay when that product contracts with depth. Saturated activation derivatives are one contributor, but they are not the whole gradient by themselves: weights and other Jacobian terms also matter. This is why using only an activation-derivative product is an incomplete explanation of vanishing gradients.

    Learning Objective: Explain vanishing gradients as shrinkage in the product of full layer-wise Jacobian factors across a depth-\(N_L\) network

  6. Order the computational phases executed within a single supervised mini-batch training step: (1) Update model weights using the optimizer update rule, (2) Evaluate the loss function by comparing predictions to ground-truth labels, (3) Perform the forward pass to compute layer activations and predictions, (4) Execute backpropagation via the chain rule to compute parameter gradients.

    Answer: The correct order is: (3) Perform the forward pass to compute layer activations and predictions, (2) Evaluate the loss function by comparing predictions to ground-truth labels, (4) Execute backpropagation via the chain rule to compute parameter gradients, (1) Update model weights using the optimizer update rule. The forward pass (3) must first compute output predictions and cache intermediate activations; the loss function (2) then compares these predictions against target labels to produce a scalar error; backpropagation (4) traverses the graph in reverse from the loss to compute gradients for all parameters; and finally the optimizer (1) applies the weight update rule using the newly computed gradients.

    Learning Objective: Analyze the four sequential phases of a supervised training iteration and justify their causal dependencies

← Back to Questions

Self-Check: Answer
  1. A real-time voice transcription service has a strict \(\text{p99}\) end-to-end latency budget of \(50\text{ ms}\). In configuring the serving infrastructure for the acoustic model, which batching strategy best aligns with this requirement?

    1. Choose the policy only from peak accelerator utilization: the largest stable batch is always best for a tight latency SLO.
    2. Fix batch size at \(64\) and avoid any explicit waiting bound, because a consistent large batch is the most reliable way to manage tail latency.
    3. Use measured arrival patterns, queueing behavior, batch-execution times, and other pipeline-stage latencies to choose a maximum batch size and an explicit waiting bound that fit within the end-to-end deadline, then validate the policy under representative traffic.
    4. Minimize average latency on an unloaded test host, then keep that batch size in production even if arrival patterns and queueing behavior change.

    Answer: The correct answer is C. A \(50\text{ ms}\) deadline by itself does not determine a single correct batch size. The right policy is to measure arrival behavior, queueing delay, execution time for candidate batch limits, and the rest of the request path, then choose a maximum batch size plus bounded waiting that fits the end-to-end budget and validate it under representative traffic. A utilization-only rule ignores the latency cost of waiting to form batches, while a fixed large-batch rule can easily violate the SLO if arrivals are sparse or bursty.

    Learning Objective: Evaluate an inference batching policy using measured queueing and execution behavior under a strict latency SLO

  2. Why can an inference serving runtime for a sequential feed-forward network achieve a significantly smaller memory footprint than a training runtime for the exact same model architecture, beyond the omission of optimizer states and gradients?

    1. Inference converts all parameter tensors into single-bit binary hash tables.
    2. Inference requires no backward pass, allowing intermediate activation buffers to be immediately recycled or overwritten once their single downstream consumer layer finishes execution.
    3. Inference executes all network layers simultaneously in parallel, eliminating the need for intermediate buffers.
    4. Inference executes exclusively within on-chip CPU registers, bypassing main memory completely.

    Answer: The correct answer is B. Under the retained-activation training scheme used here, intermediate values needed by the backward pass are saved during the forward pass; checkpointing can instead recompute selected values. During inference, because there is no backward pass, an activation tensor is no longer needed once its downstream consuming layer has computed its output. The serving engine can therefore recycle memory using a ping-pong buffer of just two activation tensors for a sequential graph. Model weights are stored in standard floating-point or quantized formats rather than single-bit hashes. Sequential layers have data dependencies and cannot execute concurrently without inputs. Intermediate buffers reside in device memory rather than fitting entirely in registers.

    Learning Objective: Explain how intermediate activation buffer recycling reduces peak memory consumption during inference

  3. Why is reduced numerical precision (such as 8-bit integer quantization, INT8) generally much more practical to deploy during inference than during model training?

    1. Inference has no small iterative parameter updates or gradient accumulation to preserve, so reduced precision is often practical to test, but rounding can still propagate through forward layers and any INT8 speedup requires supported kernels or hardware plus calibration and quality validation.
    2. If the quantized weights fit in memory, that alone guarantees inference quality and latency comparable to higher precision.
    3. A single calibration set is sufficient to guarantee correct INT8 behavior for every slice of future production traffic.
    4. INT8 is universally faster whenever it reduces bytes moved, so if a model can run in INT8 it should replace FP32 or BF16 without further checks.

    Answer: The correct answer is A. Inference avoids the small repeated parameter updates, gradients, and iterative optimizer behavior that make training especially sensitive to reduced precision, so lower precision is often a practical serving option. But it is not free: rounding still propagates through the forward computation and can change outputs, so the benefit depends on kernel and hardware support plus calibration and task-level validation. A claim that fitting weights in memory is sufficient ignores both execution support and quality effects, and a claim of universal INT8 speedup overstates the case because realized gains depend on the execution stack and workload shape.

    Learning Objective: Justify why reduced precision is often easier to deploy for inference than for training while identifying the conditions needed for safe INT8 deployment

  4. A computer vision inference service has a target \(\text{p99}\) latency SLO of \(100\text{ ms}\). For one measured representative request, the non-overlapping stages are: image JPEG decoding \(45\text{ ms}\), resizing and normalization \(30\text{ ms}\), neural network inference \(15\text{ ms}\), and JSON response serialization \(25\text{ ms}\). If inference alone becomes \(2\times\) faster, what is the new computed request latency, and why does that result alone still not establish whether the service meets the \(\text{p99}\) SLO? What should be profiled next?

    Answer: The measured request path is additive here: cutting neural inference from \(15\text{ ms}\) to \(7.5\text{ ms}\) changes total latency from \(115\text{ ms}\) to \(107.5\text{ ms}\), which still exceeds the \(100\text{ ms}\) target for this representative request. For example, the dominant remaining cost is the \(75\text{ ms}\) spent in decoding, resizing, and normalization before the model output is even serialized. But one post-speedup request does not determine \(\text{p99}\) compliance by itself; end-to-end percentiles require representative traffic, queueing, and request-mix data. The next step is to profile the dominant non-neural stages and then measure full end-to-end latency distributions under target traffic.

    Learning Objective: Analyze why end-to-end latency optimization must target the dominant request-path stages rather than only the neural inference kernel

  5. True or False: Applying the softmax function \(\hat{y}_i = \frac{e^{z_i}}{\sum_j e^{z_j}}\) to raw neural network output logits alters the argmax classification decision, meaning the class with the highest raw logit is not guaranteed to have the highest predicted probability.

    Answer: False. Because the exponential function \(e^z\) is strictly monotonically increasing, applying softmax preserves the exact relative ranking of all logits: \(\arg\max_i(z_i) = \arg\max_i(\hat{y}_i)\). Softmax scales logits into a normalized probability distribution summing to 1, but it never alters which class has the highest value or changes the top-1 prediction.

    Learning Objective: Explain the monotonicity property of the softmax function and its impact on classification decision-making

← Back to Questions

Self-Check: Answer
  1. Which interpretation of the reported 1989 handwritten-digit recognition results is justified by the chapter’s document-recognition case study?

    1. The low post-rejection error means the system’s neural classifier was already accurate enough that the rejection policy was mostly irrelevant to interpreting the result.
    2. Because throughput after normalization exceeded \(30\) classifications per second, individual classification latency must also have improved by the same factor even if other stages overlapped differently.
    3. The reported rates should be interpreted as measurements of only the neural classification stage, because acquisition and normalization are outside the learned model itself.
    4. The study reported \(1\%\) classification error after rejecting \(12.1\%\) of test digits, with 10–12 classifications per second including acquisition and over \(30\) per second after normalization, so the result must be read as a pipeline measurement with an explicit rejection policy rather than as error-free full automation.

    Answer: The correct answer is D. The chapter presents these numbers as research results on USPS-supplied digit images, not as a claim of error-free deployed postal sorting. The distinction between 10–12 per second including acquisition and over \(30\) per second after normalization shows that the measurement boundary matters, and the \(12.1\%\) rejection rate shows that low error depended on withholding uncertain cases rather than forcing every input through automatic classification. An interpretation based on the rejection policy being irrelevant misses exactly what made the reported error possible.

    Learning Objective: Interpret the reported error, rejection, and throughput figures from the 1989 digit-recognition study as a pipeline result rather than a claim of error-free deployment

  2. The chapter compares an early LeNet-class reader with the chapter’s modern MNIST multilayer perceptron. What conclusion is actually justified by that comparison?

    1. The earlier system must have had lower latency and energy because smaller historical models usually required less computation.
    2. The defensible comparison is structural continuity: both systems transform normalized pixels into digit scores inside a larger preprocessing-and-decision pipeline, but unmatched data, models, software, hardware, and operating targets mean latency or energy cannot be inferred from parameter count alone.
    3. Because modern models usually have more parameters, parameter count alone is enough to infer which system is faster and more energy efficient.
    4. Once two systems both classify handwritten digits, differences in preprocessing and deployment policy are no longer important to systems analysis.

    Answer: The correct answer is B. The comparison is not a controlled benchmark, since the datasets, architectures, software stacks, machines, and operating targets differ. What carries over is the structural pattern of normalized pixels flowing through learned parameters into a decision pipeline, not a direct latency or energy ranking. An answer based only on parameter count confuses model state with end-to-end execution behavior, which also depends on workload, runtime, precision, and hardware.

    Learning Objective: Distinguish a structural historical comparison from an invalid direct performance comparison across unmatched data, models, software, and hardware

  3. In the document-recognition pipeline, explain why forcing an automated prediction on \(100\%\) of inputs is not the sole objective when setting the rejection threshold.

    Answer: A rejection threshold trades automated coverage against downstream error cost, review cost, and review capacity rather than maximizing automation for its own sake. For example, if uncertain digits are forced through the classifier, the system may reduce manual review volume but increase costly misreads and rework; if too many are rejected, the review queue can become the new bottleneck. The right threshold therefore comes from comparing empirical error and manual-review rates with their operational costs and capacity limits, using the fraction of all arriving items accepted in error for the error-cost term. An error rate measured only among accepted items must first be multiplied by the accepted fraction. Neither zero rejection nor a historical rejection rate is universally optimal.

    Learning Objective: Analyze rejection-threshold setting as a cost-and-capacity trade-off rather than a goal of maximizing automation alone

  4. Describe how the chapter’s composite document-recognition architecture decomposes the task into a multi-stage pipeline, and explain why the neural classifier alone is not sufficient.

    Answer: The chapter’s teaching pipeline separates image acquisition, conventional preprocessing, neural inference, score interpretation, postprocessing, and the final application decision into distinct stages. For example, raw scanner input must first be prepared into usable digit representations before a model can score them, and the resulting scores still need thresholding and routing logic to decide whether to accept or defer a case. The neural classifier alone is therefore not sufficient because end-to-end success depends on the complete pipeline meeting the relevant latency, reliability, and downstream-handling constraints, not just on the classifier’s standalone accuracy.

    Learning Objective: Explain why document recognition is a complete pipeline problem rather than a standalone neural-classifier problem

  5. In the composite document-recognition pipeline, the preprocessing step that isolates individual handwritten character images from a multi-digit region is called digit ____.

    Answer: segmentation. Digit segmentation separates the multi-character region into individual character images so later normalization and neural inference can operate on the intended units rather than on an undivided block.

    Learning Objective: Identify digit segmentation as the preprocessing step that isolates character images for later normalization and inference

  6. Order the following stages of a composite document-recognition pipeline: (1) pass accepted results to the application or defer uncertain cases to review, (2) evaluate scores against validated acceptance thresholds, (3) capture image, (4) run inference on normalized digits, (5) locate, segment, and normalize digits.

    Answer: The correct order is: (3) capture image, (5) locate, segment, and normalize digits, (4) run inference on normalized digits, (2) evaluate scores against validated acceptance thresholds, (1) pass accepted results to the application or defer uncertain cases to review. Image capture must happen first because the later stages need an input document; localization and normalization must happen before inference because the model expects prepared digit inputs; threshold evaluation follows inference because it operates on the model’s scores; and only then can the system either accept the result or send an uncertain case to review. Swapping inference and normalization would feed the model the wrong representation, while acting before threshold evaluation would force a decision before confidence has been checked.

    Learning Objective: Sequence the stages of a composite document-recognition pipeline from image capture through acceptance or review

← Back to Questions

Self-Check: Answer
  1. Under the D·A·M (Data, Algorithm, Machine) taxonomy presented in the chapter, which statement correctly describes the primary responsibility of each axis and their systems interplay?

    1. Data determines GPU clock speed, Algorithm dictates physical memory capacity, and Machine formats training labels.
    2. Algorithm determines whether data is collected, Machine ensures 100% training accuracy, and Data operates independently of both.
    3. Data, Algorithm, and Machine can be optimized independently without cross-axis trade-offs.
    4. Algorithm defines computational transformations and capacity, Data determines whether the model can learn the task from representative evidence, and Machine determines whether those operations execute within latency, throughput, memory, and energy budgets.

    Answer: The correct answer is D. The D·A·M taxonomy assigns computational structure and hypothesis class to Algorithm, statistical evidence and learnability to Data, and execution efficiency, throughput, memory, and energy to Machine. Deep learning systems succeed only when all three axes align. Cross-assigning hardware constraints to data and algorithms misclassifies axis responsibilities. Asserting guaranteed 100% accuracy ignores statistical learning limitations. Claiming the axes can be optimized independently contradicts the core thesis that changes on one axis (such as increasing model width or batch size) directly impact the others.

    Learning Objective: Classify the distinct responsibilities of the Data, Algorithm, and Machine axes within the D·A·M taxonomy

  2. A computer vision model deployed in production exhibits high accuracy during offline benchmark evaluations but suffers severe error rates on live camera feeds, while hardware GPU utilization is only \(15\%\). Use the D·A·M taxonomy to outline a structured diagnostic sequence to isolate the root causes.

    Answer: First, investigate the Data axis by comparing live camera feeds against training data to identify distribution shift (lighting, blur, camera angles) or missing classes causing the accuracy drop. Second, investigate the Machine and Algorithm axes by profiling data ingestion pipelines, CPU-side image decoding, and batch sizes to determine why GPU compute units are starved of work (e.g. I/O bottlenecks or un-batched kernel launches). The D·A·M framework separates statistical data mismatches from computational execution bottlenecks.

    Learning Objective: Apply the D·A·M taxonomy to systematically diagnose accuracy drops and hardware underutilization in deployed ML systems

  3. According to the D·A·M taxonomy, if a deployed computer vision model suffers elevated error rates in production due to a distribution shift in ambient lighting and camera angles, why will scaling the Machine axis (allocating a larger cluster of faster GPUs) fail to resolve the operational failure?

    1. Hardware accelerators automatically reduce optimizer learning rates when cluster size increases.
    2. Faster GPU accelerators cannot process image tensors captured at non-standard aspect ratios.
    3. Machine scaling accelerates computational throughput but cannot supply the missing visual patterns or domain coverage required on the Data axis to learn the shifted distribution.
    4. The D·A·M framework requires all production deployments to execute on single-thread CPU cores.

    Answer: The correct answer is C. The failure stems from the Data axis (unrepresented deployment lighting conditions and covariate shift). Allocating additional compute hardware on the Machine axis merely executes the training of an unrepresentative model faster without correcting the underlying data deficiency. Hardware accelerators do not alter optimizer learning rates automatically. GPU kernels process arbitrary tensor shapes and aspect ratios. The D·A·M taxonomy provides an analysis framework and does not mandate specific hardware platforms.

    Learning Objective: Justify why hardware scaling alone cannot resolve data distribution or algorithmic modeling deficiencies

← Back to Questions

Self-Check: Answer
  1. An engineering team migrates a small multilayer perceptron inference workload with low arithmetic intensity from a CPU to a high-end GPU featuring \(10\times\) higher peak TFLOP/s, but observes less than a \(1.2\times\) end-to-end speedup. Which systems explanation correctly diagnoses this outcome?

    1. The workload may be limited by memory traffic, launch overhead, or underutilization rather than peak arithmetic throughput, so the next step is to measure bandwidth use, kernel timelines, achieved utilization, and end-to-end stage breakdowns.
    2. The model should be tuned only for the highest achieved TFLOP/s metric, because low arithmetic intensity means memory behavior is no longer informative.
    3. The small speedup proves the CPU implementation is already optimal, so further measurement of competing bottlenecks is unnecessary.
    4. Because GPU utilization is lower than peak TFLOP/s, the only meaningful next step is to increase parameter count until the accelerator saturates.

    Answer: The correct answer is A. Low arithmetic intensity and limited speedup suggest that higher peak TFLOP/s is not the binding resource, but they do not by themselves prove a pure bandwidth diagnosis. The right systems move is to discriminate among likely causes such as memory traffic, launch overhead, and poor occupancy by measuring bandwidth and cache behavior, achieved utilization, kernel timelines, and the full end-to-end path. A single-metric explanation based only on peak TFLOP/s or only on parameter count ignores the possibility that different bottlenecks are competing in the real execution pipeline.

    Learning Objective: Evaluate why a high-peak-compute accelerator may fail to speed up a small inference workload and identify the measurements needed to isolate the bottleneck

  2. On a fraud detection dataset where \(99.5\%\) of transactions are legitimate and \(0.5\%\) are fraudulent, a newly trained classifier achieves \(99.4\%\) aggregate accuracy on held-out test data. Why is this aggregate metric deceptive from an ML systems engineering standpoint?

    1. Cross-entropy loss is undefined when class proportions differ by more than \(10\times\).
    2. An accuracy of \(99.4\%\) exceeds the theoretical mathematical limit of floating-point representation.
    3. A naive baseline that blindly predicts ‘legitimate’ for every transaction achieves \(99.5\%\) accuracy; an aggregate \(99.4\%\) accuracy can conceal a near-\(100\%\) failure rate on detecting actual fraud cases.
    4. High accuracy on an imbalanced dataset causes immediate GPU out-of-memory errors during inference.

    Answer: The correct answer is C. On highly imbalanced datasets, aggregate accuracy is dominated by the majority class. A trivial constant predictor that always predicts the majority class achieves \(99.5\%\) accuracy without detecting a single fraudulent transaction; thus, \(99.4\%\) accuracy could represent a model that fails on almost every fraud instance. Systems engineers must evaluate class-specific metrics such as precision, recall, and confusion matrices. Cross-entropy is mathematically well-defined regardless of class proportions. A 99.4% accuracy is a standard statistical proportion well within floating-point ranges. Accuracy metrics do not cause GPU memory exhaustion.

    Learning Objective: Evaluate the failure of aggregate accuracy on imbalanced datasets and justify the requirement for class-specific metrics

  3. A development team attempts to improve model accuracy by repeatedly stacking additional layers to a neural network (scaling depth alone) without modifying layer widths or input resolution. Why does this depth-only scaling strategy typically suffer from diminishing returns and training instability?

    1. Adding layers automatically reduces total parameter count by compressing intermediate representations.
    2. Increasing depth alone elongates the backpropagation chain-rule path, amplifying vanishing and exploding gradient risks while increasing sequential execution latency, without providing the balanced capacity gains of compound scaling across width, depth, and resolution.
    3. Modern GPU hardware architectures cannot allocate computational graphs with more than 10 layers.
    4. Deeper networks are legally restricted from using nonlinear activation functions.

    Answer: The correct answer is B. Stacking layers increases the chain-rule path length during backpropagation, compounding vanishing/exploding gradients and making optimization increasingly difficult. Furthermore, depth increases sequential dependency chains during the forward pass, raising latency. EfficientNet demonstrated improved accuracy and efficiency trade-offs from compound scaling in its evaluated image-classification regime; the best balance still requires measurement for the intended workload. Adding layers increases parameter count and activation storage rather than reducing it. Modern accelerators routinely support networks with hundreds of layers. Activation functions are mathematical operators with no legal restrictions.

    Learning Objective: Explain the architectural and optimization limitations of scaling network depth in isolation

  4. A colleague argues that ‘because neural networks contain millions of weights functioning as an uninterpretable black box, they cannot be systematically debugged when prediction errors occur.’ Refute this claim by describing three concrete systems diagnostic techniques used to debug neural models.

    Answer: Neural networks can be systematically debugged using: (1) activation and gradient distribution histograms to detect vanishing gradients, activation saturation, or dead neurons across layers; (2) numerical assertion checks and tensor statistics to catch NaNs, Infs, and loss plateaus; and (3) ablation studies, feature attribution maps, and slice-based error analysis to verify whether the model relies on valid task features or spurious dataset correlations.

    Learning Objective: Evaluate neural network interpretability and justify systematic debugging techniques against the black-box fallacy

  5. During a model training run, an engineer observes that training loss continuously decreases across 50 epochs, but validation loss reaches a minimum at epoch 20 and increases steadily thereafter. Diagnose the model’s operational regime and describe a sensible next workflow.

    Answer: The curve suggests overfitting: the model keeps improving on the training sample after epoch 20, but that improvement is no longer transferring to held-out data. For example, epoch 20 is a sensible checkpoint candidate because it minimizes validation loss, but it should still go through the normal evaluation gates before any deployment decision. The next workflow is to restore that candidate checkpoint, validate it on the required metrics and slices, and then test interventions such as regularization, more representative data, or early stopping rather than assuming any single fix is guaranteed to work.

    Learning Objective: Analyze diverging training and validation loss curves to identify likely overfitting and select an evidence-driven checkpointing and mitigation workflow

← Back to Questions

Back to top