$$ \newcommand{\AbsoluteConicImageEntry}{B} \newcommand{\AbsoluteConicImageMatrix}{\mathbf{B}} \newcommand{\AbsoluteConicVector}{\mathbf{b}} \newcommand{\AcceleratedEpisodeTime}{T'} \newcommand{\AcceleratedFractionSpeedup}{G} \newcommand{\AccelerationNoiseDensityMatrix}{\mathbf{Q}_c} \newcommand{\AccelerationNoiseSpectralDensity}{q_c} \newcommand{\AccelerationWhiteNoise}{w} \newcommand{\AcceleratorBatchTime}{T_{\text{GPU}}} \newcommand{\AcceleratorConsumptionRate}{R_{\text{accel}}} \newcommand{\AcceleratorCount}{N_{\text{GPU}}} \newcommand{\AcceleratorDataConsumptionRate}{R_{\text{consumption}}} \newcommand{\AcceleratorGain}{G_{\text{accel}}} \newcommand{\AcceleratorHourlyPrice}{R_{\text{GPU/hr}}} \newcommand{\AcceleratorMemoryBandwidth}{\text{BW}_{\text{accelerator}}} \newcommand{\AcceleratorRailVoltage}{V_{\text{rail}}} \newcommand{\AcceleratorSecondsPerQuery}{S_{\text{GPU/query}}} \newcommand{\AcceleratorSupplyCurrent}{i} \newcommand{\AcceleratorTargetQueryRate}{R_{\text{GPU,target}}} \newcommand{\AcceleratorsPerNode}{G_{\text{node}}} \newcommand{\AccelerometerBias}{b_a} \newcommand{\AcceptanceFraction}{\alpha} \newcommand{\AcceptanceIntervalLowerLimit}{L} \newcommand{\AcceptanceIntervalUpperLimit}{U} \newcommand{\AcceptanceProbability}{p_{\text{acc}}} \newcommand{\AcceptedInfluences}{\text{Inf}} \newcommand{\AcceptedInputSet}{\mathcal{A}_{\tau}} \newcommand{\AcceptedLabelCount}{d} \newcommand{\AcceptedOutcomePayoff}{V} \newcommand{\AcceptedSampleCount}{X} \newcommand{\AcceptedTaskMeanCost}{C_{\text{succ}}} \newcommand{\AcceptedTasks}{N_{\text{acc}}} \newcommand{\AcceptingStateSet}{F} \newcommand{\AccessAttemptTime}{t} \newcommand{\AccountQueryDistribution}{p_{\text{user}}} \newcommand{\AccumulatedProcessNoiseCovariance}{\mathbf{Q}_d} \newcommand{\AccumulatedSyncTime}{T_{\text{sync}}} \newcommand{\AccumulatedUpdateTime}{T_{\text{effective}}} \newcommand{\AccumulationStepCount}{k} \newcommand{\AccuracyAfterDeployment}{\text{Accuracy}} \newcommand{\AccuracyDecayRate}{\gamma} \newcommand{\AccuracyPayoffPerQuery}{V} \newcommand{\AchievedBrakingDeceleration}{a} \newcommand{\AchievedKernelBandwidth}{\text{BW}_{\text{effective}}} \newcommand{\AcquisitionEpoch}{t_{\text{acq}}} \newcommand{\ActVariationalObjective}{\mathcal{L}_{\text{ACT}}} \newcommand{\ActionBinCount}{B} \newcommand{\ActionChunk}{\mathbf{A}} \newcommand{\ActionChunkHorizon}{H} \newcommand{\ActionChunkIndex}{k} \newcommand{\ActionDimension}{d_a} \newcommand{\ActionExecutionRate}{f_{\text{exec}}} \newcommand{\ActionFilterCutoffFrequency}{f_{\text{cutoff}}} \newcommand{\ActionLowerBound}{\mathbf{a}_{\min}} \newcommand{\ActionMagnitudeBound}{a_{\max}} \newcommand{\ActionRangeMaximum}{a_{\max}} \newcommand{\ActionRangeMinimum}{a_{\min}} \newcommand{\ActionRecoverableFraction}{\rho_{a}} \newcommand{\ActionResidualVector}{\mathbf{r}} \newcommand{\ActionSpace}{\mathcal{A}} \newcommand{\ActionTokenPrefix}{a_{<j}} \newcommand{\ActionUpperBound}{\mathbf{a}_{\max}} \newcommand{\ActivationCheckpointCount}{n_{\text{ckpt}}} \newcommand{\ActivationFunction}{f} \newcommand{\ActivationInput}{x} \newcommand{\ActivationLipschitzBound}{L_{\phi}} \newcommand{\ActivationMatrix}{\mathbf{A}} \newcommand{\ActivationMemory}{M_{\text{activations}}} \newcommand{\ActivationPayloadSize}{M_{\text{act}}} \newcommand{\ActivationStagingTime}{t_{\text{activate}}} \newcommand{\ActivationVector}{\mathbf{a}} \newcommand{\ActiveContactIndex}{k} \newcommand{\ActiveControlTorque}{\mathbf{u}_{\text{active}}} \newcommand{\ActiveInferencePower}{P_{\text{active}}} \newcommand{\ActiveLeaseCount}{N_{\text{active}}} \newcommand{\ActiveMotionDuration}{T_{\text{motion}}} \newcommand{\ActiveParameterCount}{P_{\text{model}}} \newcommand{\ActivePrefillRequestSet}{\mathcal{P}_{\text{active}}} \newcommand{\ActiveSchemaSet}{\mathcal{S}} \newcommand{\ActiveTargetTokenCount}{N_{\text{active}}} \newcommand{\ActorAccelerationBound}{a_{k,\max}} \newcommand{\ActorBodyRadius}{r} \newcommand{\ActorUpdateDelayCount}{d} \newcommand{\ActuatedJointAccelerations}{\ddot{\mathbf{q}}_j} \newcommand{\ActuatedJointBiasForces}{\mathbf{h}_j} \newcommand{\ActuatedJointCoordinates}{\mathbf{q}_j} \newcommand{\ActuationSelectionBaseBlock}{\mathbf{S}_b} \newcommand{\ActuationSelectionMatrix}{\mathbf{S}} \newcommand{\ActuatorAxisCount}{N_{\text{axes}}} \newcommand{\ActuatorBiasEffort}{u_{\text{bias}}} \newcommand{\ActuatorCyclePeriod}{t_{\text{cycle}}} \newcommand{\ActuatorDutyCycle}{D_{\text{cycle}}} \newcommand{\ActuatorEffort}{u} \newcommand{\ActuatorOffTime}{t_{\text{off}}} \newcommand{\ActuatorOnTime}{t_{\text{on}}} \newcommand{\ActuatorResponseTime}{T_{\text{act}}} \newcommand{\ActuatorTorqueLowerBound}{\mathbf{u}_{\min}} \newcommand{\ActuatorTorqueUpperBound}{\mathbf{u}_{\max}} \newcommand{\AdamFirstMoment}{m} \newcommand{\AdamMomentDecayRate}{\beta} \newcommand{\AdamSecondMoment}{v} \newcommand{\AdaptationEnergyAllowance}{E_{\text{slack}}} \newcommand{\AdaptationInvestmentCost}{C_{\text{invest}}} \newcommand{\AdaptationLatencyIncrease}{\Delta L_{\text{lat,fg}}^{\text{wc}}} \newcommand{\AdaptationModule}{g_{\psi}} \newcommand{\AdaptationPeakMemory}{M_{\text{peak}}} \newcommand{\AdaptationPowerIncrement}{P_{\text{update}}} \newcommand{\AdaptationWindowEnergy}{E_{\text{update}}} \newcommand{\AdaptedHiddenActivation}{\mathbf{h}'} \newcommand{\AdaptedTaskCost}{C_{\text{task, adapt}}} \newcommand{\AdaptedWeightMatrix}{\mathbf{W}_{\text{adapted}}} \newcommand{\AdapterActivationFunction}{\sigma} \newcommand{\AdapterAssignmentVector}{\mathbf{m}} \newcommand{\AdapterDownProjectionMatrix}{\mathbf{A}} \newcommand{\AdapterIndex}{k} \newcommand{\AdapterInitializationStandardDeviation}{\sigma} \newcommand{\AdapterRank}{r} \newcommand{\AdapterScalingFactor}{\gamma} \newcommand{\AdapterUpProjectionMatrix}{\mathbf{B}} \newcommand{\AdjacentNeighboringDataset}{X'} \newcommand{\AdjacentQueryResult}{v'} \newcommand{\AdminLeaseTime}{T_{\text{admin}}} \newcommand{\AdmissibleBacklogCount}{n} \newcommand{\AdmissibleControlSet}{\mathcal{U}_{\text{adm}}} \newcommand{\AdmissibleDisturbanceSet}{\mathcal{W}} \newcommand{\AdmissionCheckCount}{n_{\text{chk}}} \newcommand{\AdmissionCheckIndex}{i} \newcommand{\AdmissionDecisionEvent}{e_{\text{auth}}} \newcommand{\AdmissionInclusivePrebrakeDelay}{T_{\text{true}}} \newcommand{\AdmissionRouteYield}{Y} \newcommand{\AdmittedAttemptCap}{N} \newcommand{\AdmittedCommand}{u} \newcommand{\AdmittedContactForce}{F^*} \newcommand{\AdmittedControlCommand}{\mathbf{u}} \newcommand{\AdmittedSpeedCommand}{v^*} \newcommand{\AdmittedTargetPosition}{\hat{\mathbf{p}}_{\text{target}}} \newcommand{\AdmittedWorkUnitCount}{m} \newcommand{\AdvantageStabilizer}{\epsilon_{\text{stab}}} \newcommand{\AdversarialDisturbance}{\mathbf{d}} \newcommand{\AdversarialExample}{x_{\text{adv}}} \newcommand{\AdversarialInputLength}{n} \newcommand{\AdversarialPenaltyWeight}{\lambda_{\text{adv}}} \newcommand{\AdversarialPerturbation}{\boldsymbol{\delta}_{\text{adv}}} \newcommand{\AdversarialPerturbationBudget}{\epsilon_{\text{adv}}} \newcommand{\AdversaryLoss}{\mathcal{L}_{\text{adv}}} \newcommand{\AffordanceFrame}{\mathcal{F}_{\text{affordance}}} \newcommand{\AffordanceSuccessEstimate}{V_{\text{policy}}} \newcommand{\AgeBlindTravel}{\Delta x_{\text{blind}}} \newcommand{\AgeCheckInstant}{t_{\text{curr}}} \newcommand{\AggregateServerPower}{P_{\text{servers}}} \newcommand{\AggregateSlotWork}{W} \newcommand{\AggregatedRecoveryDataset}{\mathcal{D}} \newcommand{\AggregatedSurrogateLoss}{\epsilon_N} \newcommand{\AggregationLearnedPolicy}{\hat{\pi}} \newcommand{\AggregationLearnerStateDistribution}{d_{\hat{\pi}_i}} \newcommand{\AggregationRoundCount}{N} \newcommand{\AggregationRoundIndex}{i} \newcommand{\AggregationRoundTrajectorySet}{\mathcal{T}} \newcommand{\AiStandaloneSensitivity}{S_{\text{AI}}} \newcommand{\AisleTravelSpeed}{v_{\text{aisle}}} \newcommand{\AisleWidth}{w} \newcommand{\AlertCheckCount}{N_{\text{tests}}} \newcommand{\AlertFalsePositiveRate}{\alpha_{\text{fp}}} \newcommand{\AlgorithmTaxonomyAxis}{\mathsf{Algorithm}} \newcommand{\AliasedVibrationFrequency}{f_{\text{alias}}} \newcommand{\AliasingHarmonicIndex}{k} \newcommand{\AllGatherCompletionTime}{T_{\text{allgather}}} \newcommand{\AllOnesVector}{\mathbf{1}} \newcommand{\AllReduceCompletionTime}{T_{\text{allreduce}}} \newcommand{\AllReduceMinimumBandwidthTime}{T_{\text{bandwidth}}^{\text{min}}} \newcommand{\AllRunsPassEstimate}{\widehat{r}} \newcommand{\AllToAllCompletionTime}{T_{\text{alltoall}}} \newcommand{\AllToAllExchangeTime}{T} \newcommand{\AllocatedBlockCount}{N_{\text{blocks}}} \newcommand{\AllocatedHazardRate}{\lambda_{\text{alloc}}} \newcommand{\AllocatedWallTime}{T_{\text{wall}}} \newcommand{\AllowableCollisionEnergy}{E_{k, \text{allow}}} \newcommand{\AllowableRailDroop}{\Delta V_{\text{droop, max}}} \newcommand{\AllowableRailExcursion}{\Delta V_{\max}} \newcommand{\AllowableWindingTemperatureRise}{\Delta T_{\max}} \newcommand{\AllowedTokenSet}{\mathcal{V}_{\text{allow}}} \newcommand{\AllowedViolationFraction}{V^{\text{allow}}} \newcommand{\AlphabetByte}{b} \newcommand{\AlternateModelInput}{x'} \newcommand{\AmbientDimension}{D} \newcommand{\AmbientTemperature}{T_{\text{amb}}} \newcommand{\AmortizedTurnCost}{\bar{C}_{\text{turn}}} \newcommand{\AngularAcceleration}{\boldsymbol{\alpha}} \newcommand{\AngularClearance}{\theta_{\text{clear}}} \newcommand{\AngularClearanceRate}{\dot{\theta}_{\text{clear}}} \newcommand{\AngularFrequency}{\omega} \newcommand{\AngularSpeed}{\omega} \newcommand{\AngularVelocity}{\boldsymbol{\omega}} \newcommand{\AngularVelocityDerivative}{\dot{\boldsymbol{\omega}}} \newcommand{\AnnualQueryVolume}{Q_{\text{annual}}} \newcommand{\AnonymitySetSize}{k_{\text{anon}}} \newcommand{\AntiWindupTrackingTimeConstant}{T_t} \newcommand{\AntialiasingFilterVariance}{s} \newcommand{\ApiAccount}{u} \newcommand{\ApparentContrast}{C} \newcommand{\AppearanceRealityGap}{\Delta_{\text{vis}}} \newcommand{\AppliedForce}{F} \newcommand{\AppliedLoadCycleCount}{n} \newcommand{\ApproachChannelCount}{K_a} \newcommand{\ApproachDirection}{\hat{\mathbf{a}}_{\text{approach}}} \newcommand{\ApproachPosition}{x} \newcommand{\ApproachPredicate}{P_{\text{approach}}} \newcommand{\ApproachSpeed}{v_{\text{app}}} \newcommand{\ApprovalCatchFraction}{q} \newcommand{\ApprovalHeldTrajectories}{N_{\text{held}}} \newcommand{\ApproximatingDistribution}{q} \newcommand{\ArbitrationFieldBitCount}{B_{\text{arb},i}} \newcommand{\ArcObstacleDistance}{d_{\text{arc}}} \newcommand{\ArchitectureResourceCost}{C} \newcommand{\ArchitectureSearchSpace}{\mathcal{A}} \newcommand{\ArcsineEffectSize}{h} \newcommand{\ArgumentLegConfidence}{r} \newcommand{\ArgumentLegCount}{m} \newcommand{\ArithmeticIntensity}{I} \newcommand{\ArmStoppingDeceleration}{a_{\text{arm}}} \newcommand{\ArmSuccessProbability}{p} \newcommand{\ArmingSettleDuration}{t_{\text{settle}}} \newcommand{\ArrivalOffsetTravel}{\Delta x} \newcommand{\ArrivalRate}{\lambda_{\text{arr}}} \newcommand{\ArrivalStampOffset}{\Delta t_{\text{recv}}} \newcommand{\ArrivalTimestamp}{t_{\text{recv}}} \newcommand{\ArtifactVersion}{v} \newcommand{\AssessedContactForceLimit}{F_{\text{limit}}} \newcommand{\AssignedJobGpu}{g} \newcommand{\AssociationCostEntry}{c} \newcommand{\AssuranceClaim}{C} \newcommand{\AsymptoticTightBound}{\Theta} \newcommand{\AtmosphericExtinctionCoefficient}{\beta_{\text{atm}}} \newcommand{\AttackStepsPgd}{K_{\text{PGD}}} \newcommand{\AttackedTrialCount}{n} \newcommand{\AttainableComputeRate}{R_{\text{attain}}} \newcommand{\AttemptCleanupCost}{C_{\text{cleanup}}} \newcommand{\AttemptCost}{C_{\text{attempt}}} \newcommand{\AttemptCycleDuration}{t_{\text{cyc}}} \newcommand{\AttemptDuration}{t_{\text{att}}} \newcommand{\AttemptGenerationTime}{T_{\text{gen}}} \newcommand{\AttemptPassProbability}{p} \newcommand{\AttemptRuntimeOverheadCost}{C_{\text{runtime}}} \newcommand{\AttemptVerificationCost}{C_{\text{verify}}} \newcommand{\AttentionHeadCount}{N_{\text{heads}}} \newcommand{\AttentionHeadDimension}{d_{\text{head}}} \newcommand{\AttentionHeadIndex}{i} \newcommand{\AttentionHeadOutput}{\mathbf{O}} \newcommand{\AttentionKeyMatrix}{\mathbf{K}} \newcommand{\AttentionOutputMatrix}{\mathbf{O}} \newcommand{\AttentionOutputProjectionMatrix}{\mathbf{W}_{O}} \newcommand{\AttentionQueryMatrix}{\mathbf{Q}} \newcommand{\AttentionScoreEntry}{S_{ij}} \newcommand{\AttentionScoreMatrix}{\mathbf{S}} \newcommand{\AttentionScoreRow}{\mathbf{S}_{i, \cdot}} \newcommand{\AttentionScoreSummand}{S_{ik}} \newcommand{\AttentionScoreTile}{\mathbf{S}_{ij}} \newcommand{\AttentionValuesMatrix}{\mathbf{V}} \newcommand{\AttentionValuesProjectionMatrix}{\mathbf{W}_{V}} \newcommand{\AttentionValuesSourceMatrix}{\mathbf{X}_{V}} \newcommand{\AttentionValuesVector}{\mathbf{v}} \newcommand{\AttentionWeightEntry}{A_{ij}} \newcommand{\AttentionWeightMatrix}{\mathbf{A}} \newcommand{\AttentionWeightVector}{\mathbf{a}} \newcommand{\AttitudeError}{\theta_{\text{att}}} \newcommand{\AttributionFeatureCount}{n_{\text{feat}}} \newcommand{\AuditGroupRecordCount}{n_{\text{records}}} \newcommand{\AuthorityExposureLevel}{A} \newcommand{\AutocorrelationLagIndex}{k} \newcommand{\AutoencoderReconstructionError}{\mathcal{L}_{\text{rec}}} \newcommand{\AutomatedResetTime}{t_{\text{reset,auto}}} \newcommand{\AutomatonStateSet}{Q} \newcommand{\AutomatonTransitionFunction}{\delta} \newcommand{\AutonomousExecutionComputeCost}{C_{\text{compute}}} \newcommand{\AutoscalingDecisionTime}{T_{\text{decide}}} \newcommand{\AutoscalingDetectionTime}{T_{\text{detect}}} \newcommand{\AutoscalingResponseTime}{T_{\text{response}}} \newcommand{\AvailabilityObjective}{S_{\text{availability}}} \newcommand{\AvailableBrakingDistance}{D_{\text{avail}}} \newcommand{\AvailableDeceleration}{a} \newcommand{\AvailableObservations}{\mathcal{O}_{\text{avail}}} \newcommand{\AverageCopperLossPower}{\bar{P}_{\text{loss}}} \newcommand{\AverageOnlineRegret}{\gamma_N} \newcommand{\AveragePower}{P_{\text{avg}}} \newcommand{\AverageStateVisitationDistribution}{\bar{d}} \newcommand{\AxiBurstLength}{A_{\text{len}}} \newcommand{\AxisGridPointCount}{N} \newcommand{\AzimuthAngle}{\theta_{\text{az}}} \newcommand{\BackEmfVoltage}{e_{\text{bemf}}} \newcommand{\BacklashAngle}{\theta_{\text{backlash}}} \newcommand{\BackwardEulerEigenvalue}{\lambda_{\text{BE}}} \newcommand{\BackwardEulerTransitionMatrix}{\mathbf{A}_{\text{BE}}} \newcommand{\BackwardPassTime}{T_{\text{backward}}} \newcommand{\BackwardReachableTube}{\mathcal{R}} \newcommand{\BalanceDivergenceTime}{\tau_{\text{fall}}} \newcommand{\BallRadius}{r} \newcommand{\BallVolume}{V_D} \newcommand{\Bandwidth}{\text{BW}} \newcommand{\BankConflictPenalty}{\Delta t_{\text{conflict}}} \newcommand{\BarrierConstraintBound}{b_{\text{cbf}}} \newcommand{\BarrierConstraintCount}{K_b} \newcommand{\BarrierConstraintNormal}{\mathbf{a}_{\text{cbf}}} \newcommand{\BarrierFunction}{h} \newcommand{\BarrierFunctionRate}{\dot{h}} \newcommand{\BarrierHalfSpaceControlSet}{\mathcal{U}_{\text{safe}}} \newcommand{\BarrierMargin}{\delta} \newcommand{\BarrierNormalizationScale}{h_{\text{scale}}} \newcommand{\BarrierProjectionLagrangian}{L_{\text{Lag}}} \newcommand{\BarrierProjectionMultiplier}{\lambda} \newcommand{\BarrierRelativeDegree}{r} \newcommand{\BaseAbscissaVelocity}{\dot{x}} \newcommand{\BaseAccelerationCommand}{a} \newcommand{\BaseBatchSize}{B_{\text{base}}} \newcommand{\BaseCameraRotation}{\mathbf{R}_{\text{base}}^{\text{cam}}} \newcommand{\BaseCameraTransform}{\mathbf{T}_{\text{base}}^{\text{cam}}} \newcommand{\BaseCameraTranslation}{\mathbf{t}_{\text{base}}^{\text{cam}}} \newcommand{\BaseFlangeTransform}{\mathbf{T}_{\text{base}}^{\text{flange}}} \newcommand{\BaseForwardSpeed}{v} \newcommand{\BaseFramePoint}{\mathbf{p}_{\text{base}}} \newcommand{\BaseHeadingRate}{\dot{\theta}_{\text{head}}} \newcommand{\BaseJointInertiaCoupling}{\mathbf{M}_{bj}} \newcommand{\BaseLateralPosition}{y_{\text{base}}} \newcommand{\BaseLateralVelocity}{\dot{y}} \newcommand{\BaseLayerCount}{N_{L,0}} \newcommand{\BaseLearningRate}{\eta_{\text{base}}} \newcommand{\BaseLongitudinalPosition}{x_{\text{base}}} \newcommand{\BaseLongitudinalVelocity}{\dot{x}} \newcommand{\BaseOdometrySpeed}{v} \newcommand{\BaseOrdinateVelocity}{\dot{y}} \newcommand{\BasePosition}{\mathbf{p}_{\text{base}}} \newcommand{\BasePromptLength}{S_{\text{base}}} \newcommand{\BaseStoppingDistance}{d_{\text{base}}} \newcommand{\BaseToCameraTransform}{\mathbf{T}_{\text{cam} \leftarrow \text{base}}} \newcommand{\BaseTrainingComputeCost}{C_{\text{compute}}} \newcommand{\BaseTrajectoryTokenCount}{N_{\text{base}}} \newcommand{\BaseTravelDistance}{d} \newcommand{\BaseTravelSpeed}{v_{\text{base}}} \newcommand{\BaseWidthMultiplier}{w_{\text{mult},0}} \newcommand{\BaseWorkerCount}{N_{\text{base}}} \newcommand{\BaseWristTransform}{\mathbf{T}_{\text{base} \leftarrow \text{wrist}}} \newcommand{\BaseYawRateBias}{\omega_{\text{bias}}} \newcommand{\BaselineAcceptanceEstimate}{\hat{p}_{\text{base}}} \newcommand{\BaselineAnnualOperationsCost}{C_{\text{current}}} \newcommand{\BaselineControllerAction}{\mathbf{a}_t^{\text{base}}} \newcommand{\BaselineConversionRate}{p_0} \newcommand{\BaselineFeatureMean}{\mu_{\text{base}}} \newcommand{\BaselineFeatureStandardDeviation}{\sigma_{\text{base}}} \newcommand{\BaselineIntervalLowerLimit}{l_{\text{base}}} \newcommand{\BaselineIntervalUpperLimit}{u_{\text{base}}} \newcommand{\BaselineLowerLimitDistance}{\delta^-_{\text{base}}} \newcommand{\BaselineOnlyAcceptedTaskCount}{b} \newcommand{\BaselineOnlyCorrectCount}{n_{\text{base}}} \newcommand{\BaselinePolicyAcceptanceProbability}{p_{X}} \newcommand{\BaselinePolicyCost}{C_{X}} \newcommand{\BaselineStateDistribution}{d^{\pi_{\text{base}}}} \newcommand{\BaselineTaskCost}{C_{\text{task, base}}} \newcommand{\BaselineToolCallDistribution}{p_{b}} \newcommand{\BaselineTrackingError}{e_{\text{track}}} \newcommand{\BaselineTrainingDuration}{T_{\text{hours}}} \newcommand{\BaselineTrajectoryGoodput}{\mathcal{G}_{b}} \newcommand{\BaselineUpperLimitDistance}{\delta^+_{\text{base}}} \newcommand{\BatchArrivalRate}{\lambda_{\text{batch}}} \newcommand{\BatchAxisLabel}{b} \newcommand{\BatchBufferMemory}{M_{\text{batch}}} \newcommand{\BatchCostPerAcceptedTask}{C_{\text{eff,batch}}} \newcommand{\BatchDataVolume}{D_{\text{vol}}^{(\text{batch})}} \newcommand{\BatchExampleIndex}{n} \newcommand{\BatchFetchTime}{T_{\text{fetch}}} \newcommand{\BatchFillArrivalCount}{k} \newcommand{\BatchFixedOverheadTime}{T_{\text{fixed}}} \newcommand{\BatchFlushStartTime}{t_{\text{start}}} \newcommand{\BatchFormationDelay}{L_{\text{lat,form}}} \newcommand{\BatchIndex}{k} \newcommand{\BatchLabelComponent}{y_{ij}} \newcommand{\BatchLatencyEnvelope}{L_{\text{lat,envelope}}} \newcommand{\BatchLoss}{\mathcal{L}_{\text{batch}}} \newcommand{\BatchMaxOutputLength}{S_{\text{max}}} \newcommand{\BatchMaximumDeviationMultiple}{k} \newcommand{\BatchMeanOutputLength}{\bar{S}} \newcommand{\BatchNormMean}{\mu_{\mathcal{B}}} \newcommand{\BatchNormOutput}{y} \newcommand{\BatchNormRunningMean}{\boldsymbol{\mu}_{\mathcal{B}}} \newcommand{\BatchNormRunningStandardDeviation}{\boldsymbol{\sigma}_{\mathcal{B}}} \newcommand{\BatchNormStandardDeviation}{\sigma_{\mathcal{B}}} \newcommand{\BatchOperations}{O_{\text{batch}}} \newcommand{\BatchPredictedProbability}{\hat{y}_{ij}} \newcommand{\BatchProcessingTime}{T_{\text{process}}} \newcommand{\BatchRolloutCount}{N_{\text{batch}}} \newcommand{\BatchScalingFactor}{k} \newcommand{\BatchServiceTime}{T_{\text{svc}}} \newcommand{\BatchSize}{B} \newcommand{\BatchTransferTime}{T_{\text{transfer}}} \newcommand{\BatchedDecodeStepTime}{t_{\text{step}}} \newcommand{\BatchedEventIndex}{i} \newcommand{\BatchedRequestLatency}{L_{\text{lat,batch}}} \newcommand{\BatchingLatencyBudget}{L_{\text{lat,budget}}} \newcommand{\BatchingQueueWait}{L_{\text{lat,wait}}} \newcommand{\BatchingWindow}{T_{\text{window}}} \newcommand{\BatteryCellResistance}{R_{\text{cell}}} \newcommand{\BeamDivergenceAngle}{\delta\theta_{\text{div}}} \newcommand{\BeamWidth}{W} \newcommand{\BearingRay}{\mathbf{r}} \newcommand{\BeatFrequency}{f_b} \newcommand{\BehaviorCloningHorizon}{S} \newcommand{\BehaviorCloningLoss}{\mathcal{L}_{\text{BC}}} \newcommand{\BehaviorDistribution}{b} \newcommand{\BehaviorPolicyVersion}{\text{ver}_b} \newcommand{\BeliefErrorBound}{E} \newcommand{\BeliefInvalidationHorizon}{T_{\text{inv}}} \newcommand{\BeliefState}{b} \newcommand{\BellmanBackupTarget}{y} \newcommand{\BellmanErrorLoss}{\mathcal{L}_{\text{Bellman}}} \newcommand{\BelowThresholdIndicator}{\mathbf{1}_{\{|(\mathbf{W}_{\text{sparse}})_{ij}| \leq \delta_{\text{prune}}\}}} \newcommand{\BestEffortWireBitCount}{B_{\text{BE,wire}}} \newcommand{\BetterArmSuccessProbability}{p_{\text{high}}} \newcommand{\BetweenTaskStandardDeviation}{\sigma_{\text{task}}} \newcommand{\BevPillarFeature}{\mathbf{V}_{\text{BEV}}} \newcommand{\BevPillarXIndex}{X} \newcommand{\BevPillarYIndex}{Y} \newcommand{\BiasFeedbackFactor}{\alpha_{\text{fb}}} \newcommand{\BiasVector}{\mathbf{b}} \newcommand{\BilledAllocationTime}{T_{\text{total}}} \newcommand{\BinaryActivationVector}{\mathbf{a}} \newcommand{\BinaryClassifier}{h} \newcommand{\BinaryWeightVector}{\mathbf{w}} \newcommand{\BinomialSuccessCount}{X} \newcommand{\BipedTiltAcceleration}{\ddot{\theta}_{\text{tilt}}} \newcommand{\BisectionBandwidth}{\text{BW}_{\text{bisect}}} \newcommand{\BitFlippedFloatNumber}{x_{\text{corrupt}}} \newcommand{\BitTime}{T_{\text{bit}}} \newcommand{\BlackoutClockConversionError}{\Delta t_{\text{one-sigma scenario}}} \newcommand{\BlendDeadline}{t_{\text{blend}}} \newcommand{\BlendedCommandJerk}{j_{\text{cmd}}} \newcommand{\BlendedControlCommand}{\mathbf{u}_{\text{blend}}} \newcommand{\BlendedInputTokenPrice}{c_{\text{in}}} \newcommand{\BlendingTransitionWindow}{\tau_{\text{blend}}} \newcommand{\BlindTravelDistance}{d_{\text{blind}}} \newcommand{\BlockCheckTime}{T_{\text{ver}}} \newcommand{\BlockCoordinateX}{b_x} \newcommand{\BlockCoordinateY}{b_y} \newcommand{\BlockCoordinateZ}{b_z} \newcommand{\BlockEdgeVoxelCount}{n_{\text{blk}}} \newcommand{\BlockMaximum}{M} \newcommand{\BlockMaximumLevel}{z} \newcommand{\BlockMaximumLimitDistribution}{G} \newcommand{\BlockMaximumNormalizingScale}{a} \newcommand{\BlockMaximumNormalizingShift}{b} \newcommand{\BlockMetadataSize}{s_{\text{meta}}} \newcommand{\BlockQuantizationScale}{s_b} \newcommand{\BlockRangeMaximum}{x_{\max,i}} \newcommand{\BlockRangeMinimum}{x_{\min,i}} \newcommand{\BlockSampleCount}{n} \newcommand{\BlockedWorkerCount}{N_{\text{blocked}}} \newcommand{\BlockingCallTimeout}{T_{\text{out}}} \newcommand{\BlockingTaskIndex}{k} \newcommand{\BodyAcceleration}{\dot{v}} \newcommand{\BodyDisplacement}{x} \newcommand{\BodyEndEffectorTransform}{\mathbf{T}_{BE}} \newcommand{\BodyFramePoint}{\mathbf{p}_{\text{body}}} \newcommand{\BodyFramePointCovariance}{\boldsymbol{\Sigma}_{\text{body}}} \newcommand{\BodyLidarTransform}{\mathbf{T}_{bl}} \newcommand{\BodyReferenceFrame}{\mathcal{F}_B} \newcommand{\BodyRegionMass}{m_H} \newcommand{\BodySpeed}{v} \newcommand{\BoltzmannConstant}{k_B} \newcommand{\BoltzmannStateEnergy}{E} \newcommand{\BoltzmannTemperature}{T} \newcommand{\BootstrapQuantileFunction}{Q} \newcommand{\BootstrapReplicateCount}{B_{\text{boot}}} \newcommand{\BootstrapReplicateIndex}{r} \newcommand{\BottomedOutContactStiffness}{k_{\infty}} \newcommand{\BouligandContingentCone}{T_{\mathcal{C}}} \newcommand{\BoundaryConditionVector}{\mathbf{b}} \newcommand{\BoundaryLayerTime}{t_{\text{fast}}} \newcommand{\BoundedRegimeTimestamp}{t_{\text{bounded}}} \newcommand{\BoxMaximumHorizontalCoordinate}{x_{\text{max}}} \newcommand{\BoxMaximumVerticalCoordinate}{y_{\text{max}}} \newcommand{\BoxMinimumHorizontalCoordinate}{x_{\text{min}}} \newcommand{\BoxMinimumVerticalCoordinate}{y_{\text{min}}} \newcommand{\BrakeChopperResistance}{R_{\text{brake}}} \newcommand{\BrakeCommandForce}{F_{\text{cmd}}} \newcommand{\BrakeResistorPulseEnergy}{E_{\text{pulse}}} \newcommand{\BrakingDistance}{d_{\text{brake}}} \newcommand{\BrakingForce}{F_{\text{brake}}} \newcommand{\BrakingOnsetContactForce}{F_{\text{cmd}}} \newcommand{\BrakingWork}{W_{\text{brake}}} \newcommand{\BreadthCriticalPathLatency}{T^{\text{breadth}}} \newcommand{\BreadthPeakKvCacheMemory}{M_{\text{KV}}^{\text{breadth}}} \newcommand{\BreakEvenAcceptanceProbability}{p'} \newcommand{\BreakEvenBrakingDeceleration}{a} \newcommand{\BreakEvenParseFailureRate}{p_{\text{break}}} \newcommand{\BreakEvenTaskCount}{N^*} \newcommand{\BreakEvenUtilization}{u^*} \newcommand{\BreakerCooldownInterval}{T_{\text{cool}}} \newcommand{\BreakerFailureFraction}{r} \newcommand{\BreakerMinimumSampleCount}{n_{\min}} \newcommand{\BreakerOutcomeIndex}{i} \newcommand{\BreakerOutcomeWindow}{W} \newcommand{\BreakerTripThreshold}{r_{\text{trip}}} \newcommand{\BridgeTraceResistance}{R_{\text{trace}}} \newcommand{\BroadcastColumnElement}{A} \newcommand{\BroadcastColumnTensor}{\mathbf{A}} \newcommand{\BroadcastCompletionTime}{T_{\text{broadcast}}} \newcommand{\BroadcastRowElement}{b} \newcommand{\BroadcastRowTensor}{\mathbf{B}} \newcommand{\BroadcastTableSize}{s_{\text{table}}} \newcommand{\BspLearningRate}{\eta_{\text{BSP}}} \newcommand{\BsplineBasisFunction}{B} \newcommand{\BudgetEvaluationTime}{\tau} \newcommand{\BudgetFreeBalance}{F} \newcommand{\BudgetNodeIndex}{k} \newcommand{\BudgetReservedFunds}{R} \newcommand{\BudgetSettledCharges}{E} \newcommand{\BudgetedAcceptanceProbability}{q_{\pi}} \newcommand{\BufferDependencyEdgeSet}{E} \newcommand{\BufferDependencyGraph}{G} \newcommand{\BufferDependencyVertexSet}{V} \newcommand{\BufferIndex}{i} \newcommand{\BulkDecouplingCapacitance}{C_{\text{bulk}}} \newcommand{\BumplessTransferBlend}{\alpha} \newcommand{\BumplessTransferBlendAcceleration}{\ddot{\alpha}} \newcommand{\BumplessTransferBlendRate}{\dot{\alpha}} \newcommand{\BumplessTransferBlendSlope}{\alpha'} \newcommand{\BumplessTransferProgress}{\hat{t}} \newcommand{\BumplessTransferStartInstant}{t_{\text{start}}} \newcommand{\BurstArrivalCount}{N_{\text{burst}}} \newcommand{\BurstSurvivalTime}{t_{\text{limit}}} \newcommand{\BusBitRate}{R_{\text{bit}}} \newcommand{\BusCapacitorEnergy}{E_C} \newcommand{\BusCapacitorVoltage}{V_C} \newcommand{\BusSerializationTime}{t_{\text{bus}}} \newcommand{\ButterflyAllReduceTime}{T_{\text{butterfly}}} \newcommand{\ByteAlphabet}{\Sigma} \newcommand{\ByteString}{u} \newcommand{\ByzantineClientCount}{f} \newcommand{\ByzantineFaultCount}{f} \newcommand{\CableFlexCycleCount}{n_{\text{cable}}} \newcommand{\CableRatedFatigueLife}{L_{\text{cable}}} \newcommand{\CacheMissStallFraction}{f} \newcommand{\CachedInputTokenCount}{n_{\text{cache}}} \newcommand{\CachedInputTokenPrice}{c_{\text{cache}}} \newcommand{\CalibratedAcceptanceEstimate}{\hat{p}} \newcommand{\CalibrationBinCount}{N_{\text{bins}}} \newcommand{\CalibrationBinExampleSet}{B_m} \newcommand{\CalibrationBinIndex}{m} \newcommand{\CalibrationConstraintMatrix}{\mathbf{V}} \newcommand{\CalibrationDataDistribution}{p_{\text{cal}}} \newcommand{\CalibrationDataset}{\mathcal{C}_{\text{cal}}} \newcommand{\CalibrationExampleCount}{n_{\text{cal}}} \newcommand{\CalibrationModelPoint}{\mathbf{M}} \newcommand{\CalibrationPoseIndex}{k} \newcommand{\CalibrationRotationAxisCount}{N} \newcommand{\CalibrationSceneIndex}{j} \newcommand{\CalibrationTemperature}{T_{\text{cal}}} \newcommand{\CalibrationViewCount}{N} \newcommand{\CallLatency}{T_{\text{call}}} \newcommand{\CallPostprocessingTime}{T_{\text{post}}} \newcommand{\CallPreparationTime}{T_{\text{prep}}} \newcommand{\CallTailProbability}{p_{\text{tail}}} \newcommand{\CallUsefulWorkTime}{W} \newcommand{\CameraCenterArcPosition}{x_{\text{rot}}} \newcommand{\CameraExtrinsicRotation}{\mathbf{R}_{bc}} \newcommand{\CameraExtrinsicTransform}{\mathbf{T}_{bc}} \newcommand{\CameraExtrinsicTranslation}{\mathbf{p}_{bc}} \newcommand{\CameraFrameDepth}{Z_c} \newcommand{\CameraFrameHorizontalCoordinate}{X_c} \newcommand{\CameraFramePeriod}{T_{\text{sample}}} \newcommand{\CameraFramePoint}{\mathbf{p}_c} \newcommand{\CameraFramePointCovariance}{\boldsymbol{\Sigma}_c} \newcommand{\CameraFrameVerticalCoordinate}{Y_c} \newcommand{\CameraIdentifierEmbedding}{\mathbf{e}_{\text{cam}}} \newcommand{\CameraImage}{\mathbf{I}} \newcommand{\CameraImuTimeOffset}{\Delta t_{\text{imu}}} \newcommand{\CameraIntrinsicCalibrationMatrix}{\mathbf{K}} \newcommand{\CameraIntrinsicInverseTranspose}{\mathbf{K}^{-\top}} \newcommand{\CameraLateralStandardDeviation}{\sigma_{x_c}} \newcommand{\CameraMountTiltAngle}{\theta_{\text{ext}}} \newcommand{\CameraObjectTransform}{\mathbf{T}_{\text{camera}}^{\text{object}}} \newcommand{\CameraOpticalCenter}{\mathbf{o}} \newcommand{\CameraReferenceFrame}{\mathcal{F}_{\text{cam}}} \newcommand{\CameraRotationColumn}{\mathbf{r}} \newcommand{\CameraSampleTimestamp}{t_{\text{cam}}} \newcommand{\CameraSkewCoefficient}{\gamma} \newcommand{\CameraTargetTransform}{\mathbf{T}_{\text{cam}}^{\text{target}}} \newcommand{\CameraToWorldRotation}{\mathbf{R}_{WC}} \newcommand{\CameraToWorldTransform}{\mathbf{T}_{WC}} \newcommand{\CameraToWorldTranslation}{\mathbf{t}_{WC}} \newcommand{\CampaignActiveTime}{T_{\text{active}}} \newcommand{\CanHighLineVoltage}{V_{\text{CANH}}} \newcommand{\CanLowLineVoltage}{V_{\text{CANL}}} \newcommand{\CanaryAllocationFraction}{\rho} \newcommand{\CanaryInterventionRate}{\lambda_{\text{canary}}} \newcommand{\CanaryLabelDelay}{t_{\text{label}}} \newcommand{\CanarySpeedBound}{v_{\text{canary}}} \newcommand{\CanaryStageDuration}{T_{\text{stage}}} \newcommand{\CanaryTrafficFraction}{p_{\text{stage}}} \newcommand{\CandidateAcceptanceEstimate}{\hat{p}_{\text{cand}}} \newcommand{\CandidateActionVector}{\hat{\mathbf{a}}} \newcommand{\CandidateArchitecture}{a} \newcommand{\CandidateAvailabilityEstimate}{\widehat{q}} \newcommand{\CandidateAvailabilityProbability}{q} \newcommand{\CandidateCheckingCost}{v} \newcommand{\CandidateClientCount}{K_{\text{candidates}}} \newcommand{\CandidateControlCommand}{\mathbf{u}^{\text{cand}}} \newcommand{\CandidateControlCommandDerivative}{\dot{\mathbf{u}}^{\text{cand}}} \newcommand{\CandidateDefectRate}{\epsilon} \newcommand{\CandidateGenerationCost}{g} \newcommand{\CandidateIndex}{i} \newcommand{\CandidateIntervalLowerLimit}{l_{\text{cand}}} \newcommand{\CandidateIntervalUpperLimit}{u_{\text{cand}}} \newcommand{\CandidateLowerLimitDistance}{\delta^-_{\text{cand}}} \newcommand{\CandidateOnlyAcceptedTaskCount}{c} \newcommand{\CandidatePolicyAcceptanceProbability}{p_{Y}} \newcommand{\CandidatePolicyAction}{\mathbf{a}_t^{\text{cand}}} \newcommand{\CandidatePolicyCost}{C_{Y}} \newcommand{\CandidatePoolSize}{N} \newcommand{\CandidateProposal}{p} \newcommand{\CandidateRoutingPolicy}{Y} \newcommand{\CandidateScoreVector}{\mathbf{c}} \newcommand{\CandidateScoringCost}{c_{\text{infer}}} \newcommand{\CandidateScoringError}{\epsilon} \newcommand{\CandidateSkill}{a} \newcommand{\CandidateSpeedCommand}{v_{\text{cand}}} \newcommand{\CandidateTailCompletionTime}{\widehat{T}_{c,0.99}} \newcommand{\CandidateToolCallDistribution}{p_{c}} \newcommand{\CandidateTrackingErrorStandardDeviation}{\sigma_{\text{track}}} \newcommand{\CandidateTrajectoryGoodput}{\mathcal{G}_{c}} \newcommand{\CandidateUpperLimitDistance}{\delta^+_{\text{cand}}} \newcommand{\CandidateUtility}{U} \newcommand{\CandidateUtilityMean}{\mu} \newcommand{\CandidateUtilityStandardDeviation}{\sigma_{U}} \newcommand{\CandidateViolationCount}{V_{c}} \newcommand{\CandidateWinCount}{j} \newcommand{\CapabilityGrant}{\Gamma} \newcommand{\CaptureAgeEmbedding}{\mathbf{e}_{\Delta t}} \newcommand{\CaptureSampleIndex}{t_0} \newcommand{\CaptureSampleKalmanGain}{\mathbf{G}_{t_0}} \newcommand{\CaptureSampleMeasurementMatrix}{\mathbf{H}_{t_0}} \newcommand{\CaptureSamplePredictedCovariance}{\mathbf{P}_{t_0|t_0-1}} \newcommand{\CaptureSamplePredictedEstimate}{\hat{\mathbf{x}}_{t_0|t_0-1}} \newcommand{\CaptureSampleUpdatedCovariance}{\mathbf{P}_{t_0|t_0}} \newcommand{\CaptureSampleUpdatedEstimate}{\hat{\mathbf{x}}_{t_0|t_0}} \newcommand{\CaptureTimestamp}{t_{\text{capture}}} \newcommand{\CapturedSensorObservation}{\mathbf{z}_{t_0}} \newcommand{\CartesianAcceleration}{\ddot{\mathbf{p}}} \newcommand{\CartesianPosition}{\mathbf{p}} \newcommand{\CartesianXCoordinate}{x} \newcommand{\CartesianYCoordinate}{y} \newcommand{\CartesianZCoordinate}{z} \newcommand{\CascadeEscalationProbability}{p_{\text{escalate}}} \newcommand{\CascadeGateCost}{g} \newcommand{\CascadeGateDuration}{v} \newcommand{\CascadeInferenceEnergy}{E_{\text{cascade}}} \newcommand{\CascadeTaskCost}{C_{\text{cascade}}} \newcommand{\CascadeTaskDuration}{T_{\text{cascade}}} \newcommand{\CascadeTierCost}{c^{\text{tier}}} \newcommand{\CascadeTierDuration}{t} \newcommand{\CascadeTierIndex}{j} \newcommand{\CascadedBarrierCertificate}{\psi} \newcommand{\CascadedBarrierClassKFunction}{\alpha} \newcommand{\CascadedBarrierDerivative}{\dot{\psi}} \newcommand{\CaseAmbientThermalResistance}{R_{\text{th,case-amb}}} \newcommand{\CaseTemperature}{T_{\text{case}}} \newcommand{\CaseThermalCapacitance}{C_{\text{case}}} \newcommand{\CaseThermalTimeConstant}{\tau_{\text{th,case}}} \newcommand{\CatalogDefinitionTokens}{S_{\text{catalog}}} \newcommand{\CatalogStagingCallCount}{N} \newcommand{\CategoryRecordCount}{n} \newcommand{\CausalInterventionMask}{\mathcal{M}} \newcommand{\CausalMediator}{M} \newcommand{\CausalTokenPosition}{s} \newcommand{\CbsRuntimeBudget}{Q} \newcommand{\CellOccupancyProbability}{p} \newcommand{\CenterCount}{k} \newcommand{\CentralizedTrainingEnergy}{E_{\text{centralized}}} \newcommand{\CentroidalAngularMomentum}{\mathbf{h}_{\text{ang}}} \newcommand{\CentroidalAngularMomentumDerivative}{\dot{\mathbf{h}}_{\text{ang}}} \newcommand{\CentroidalLinearMomentum}{\mathbf{h}_{\text{lin}}} \newcommand{\CentroidalLinearMomentumDerivative}{\dot{\mathbf{h}}_{\text{lin}}} \newcommand{\CentroidalMomentum}{\mathbf{h}_G} \newcommand{\CentroidalMomentumMatrix}{\mathbf{A}_G} \newcommand{\CentroidalMomentumMatrixDerivative}{\dot{\mathbf{A}}_G} \newcommand{\CentroidalMomentumRate}{\dot{\mathbf{h}}_G} \newcommand{\CertifiedCommandWindow}{\mathbf{u}^*_{t:t+H-1}} \newcommand{\CertifiedControlAction}{\mathbf{u}^*} \newcommand{\CertifiedJointTorque}{u^*} \newcommand{\CertifiedRadius}{R} \newcommand{\ChainRuleInput}{x} \newcommand{\ChainRuleIntermediate}{u} \newcommand{\ChainRuleOutput}{v} \newcommand{\ChainedOperationCount}{n_{\text{ops}}} \newcommand{\ChanceAnnotatorAgreement}{p_e} \newcommand{\ChannelAuthorityState}{S} \newcommand{\ChannelCommand}{u} \newcommand{\ChannelStoredEnergy}{E_{\text{channel}}} \newcommand{\CharacteristicPolynomial}{p} \newcommand{\CharacteristicPolynomialCoefficient}{c} \newcommand{\ChassisThermalResistance}{R_{\text{th,chassis}}} \newcommand{\CheapConfigurationAttemptCost}{c_{\text{small}}} \newcommand{\CheapConfigurationPassProbability}{p_{\text{small}}} \newcommand{\CheckIntervalStepCount}{m} \newcommand{\CheckPassProbability}{p^{\text{chk}}} \newcommand{\CheckSlotTime}{T} \newcommand{\CheckWindowTurnCount}{w} \newcommand{\CheckedSignal}{x} \newcommand{\CheckedSignalLimit}{L_{\text{limit}}} \newcommand{\CheckpointAttemptDuration}{T_{\text{att}}} \newcommand{\CheckpointExtraPauseTime}{T_{\text{pause}}} \newcommand{\CheckpointInterval}{T_{\text{ckpt}}} \newcommand{\CheckpointLoadTime}{T_{\text{load}}} \newcommand{\CheckpointLogPosition}{j_{\text{ckpt}}} \newcommand{\CheckpointOrdinalIndex}{m} \newcommand{\CheckpointOverheadFraction}{f_{\text{ckpt}}} \newcommand{\CheckpointOverheadRatio}{w} \newcommand{\CheckpointRecoveryOverheadTime}{T_{\text{overhead}}} \newcommand{\CheckpointRestoreTime}{T_{\text{restore}}} \newcommand{\CheckpointStride}{k} \newcommand{\CheckpointSuffixReadTime}{T_{\text{read}}} \newcommand{\CheckpointWasteFraction}{W} \newcommand{\CheckpointWriteTime}{T_{\text{write}}} \newcommand{\ChildBatchSize}{n_{\text{batch}}} \newcommand{\ChildBudgetAllocation}{C_{\max,C}} \newcommand{\ChildCapabilityGrant}{\Gamma_{\text{child}}} \newcommand{\ChildFreeBalance}{F_{C}} \newcommand{\ChildPruningProbability}{p_{\text{prune}}} \newcommand{\ChildReservedFunds}{R_{C}} \newcommand{\ChildSettledCharges}{E_{C}} \newcommand{\ChinchillaIrreducibleLoss}{E} \newcommand{\ChirpDuration}{T_c} \newcommand{\ChirpSlope}{S} \newcommand{\ChopperClampVoltage}{V_{\text{clamp}}} \newcommand{\ChopperTurnOffVoltage}{V_{\text{clamp,off}}} \newcommand{\ChopperTurnOnVoltage}{V_{\text{clamp,on}}} \newcommand{\ChunkActionDimension}{d_{\text{chunk}}} \newcommand{\ChunkEnsemblingWeight}{w} \newcommand{\ChunkExecutionHorizon}{H_{\text{exec}}} \newcommand{\ChunkImitationLoss}{\mathcal{L}_{\text{chunk}}} \newcommand{\ChunkLease}{T_{\text{lease}}} \newcommand{\ChunkLeaseTime}{T_{\text{lease}}} \newcommand{\ChunkReactionLatency}{T_{\text{reaction}}} \newcommand{\ChunkRenewalPeriod}{T_{\text{chunk}}} \newcommand{\ChunkRenewalRate}{f_{\text{replan}}} \newcommand{\ChunkStepIndex}{i} \newcommand{\ClampedControlCommand}{\mathbf{u}_{\text{clip}}} \newcommand{\ClassCount}{K} \newcommand{\ClassIndex}{j} \newcommand{\ClassKFunction}{\kappa} \newcommand{\ClassKFunctionSet}{\mathcal{K}} \newcommand{\ClassProbabilityVector}{\mathbf{p}} \newcommand{\ClassificationThreshold}{\gamma_{\text{cls}}} \newcommand{\CleanLabelSampleCount}{D_{\text{clean}}} \newcommand{\CleanTrainingDataset}{\mathcal{S}} \newcommand{\CleanupGraphEdgeSet}{E} \newcommand{\CleanupGraphVertexSet}{V} \newcommand{\ClearDistance}{D_{\text{clear}}} \newcommand{\ClearanceAcceleration}{\ddot{D}_{\text{clear}}} \newcommand{\ClearanceAllowance}{C} \newcommand{\ClearanceExhaustionTime}{t_{\text{impact}}} \newcommand{\ClearanceInset}{C_{\text{inset}}} \newcommand{\ClearanceQueryTime}{t_{\text{query}}} \newcommand{\ClearanceRate}{\dot{D}_{\text{clear}}} \newcommand{\ClearanceSpeedClamp}{v_{\text{clamp}}} \newcommand{\ClearanceTimeBudget}{T_{\text{total}}} \newcommand{\ClfClassKFunction}{\alpha_V} \newcommand{\ClfDescentControlSet}{\mathcal{U}_{\text{CLF}}} \newcommand{\ClientGradientVector}{\mathbf{g}} \newcommand{\ClientIndex}{k} \newcommand{\ClientLocalDataset}{\mathcal{D}} \newcommand{\ClientLocalTrainingEnergy}{E_{\text{client}}} \newcommand{\ClientMaskVector}{\mathbf{r}} \newcommand{\ClientObjectiveWeight}{w} \newcommand{\ClientSampleCount}{n} \newcommand{\ClientUpdateUploadEnergy}{E_{\text{upload}}} \newcommand{\ClippedSurrogateObjective}{\mathcal{M}} \newcommand{\ClippingRangeLowerBound}{\alpha} \newcommand{\ClippingRangeUpperBound}{\beta} \newcommand{\ClockConversionBound}{\epsilon_{\text{sync}}} \newcommand{\ClockConversionIntercept}{b_{\text{clk}}} \newcommand{\ClockConversionSlope}{a} \newcommand{\ClockFrequency}{f} \newcommand{\ClockOffset}{\theta_{\text{offset}}} \newcommand{\ClockPeriod}{T_{\text{clk}}} \newcommand{\ClockSynchronizationSkew}{\delta_{\text{skew}}} \newcommand{\ClosedLoopTrajectoryDensity}{p_{\text{cl}}} \newcommand{\ClosingSpeedBound}{v_{\text{close}}} \newcommand{\CloudInferenceEnergy}{E_{\text{cloud}}} \newcommand{\CloudOffloadEnergy}{E_{\text{transmit}}} \newcommand{\CloudTrainingRunEnergy}{E_{\text{cloud,train}}} \newcommand{\ClusterAvailability}{A_{\text{cluster}}} \newcommand{\ClusterCount}{k} \newcommand{\ClusterHeadroom}{N} \newcommand{\ClusterNodeCount}{N_{\text{nodes}}} \newcommand{\ClusterPower}{P_{\text{cluster}}} \newcommand{\CoarseCellCount}{C} \newcommand{\CodecDecodeTime}{T_{\text{decode}}} \newcommand{\CodecEncodeTime}{T_{\text{encode}}} \newcommand{\CodecOverheadTime}{T_{\text{overhead}}} \newcommand{\CognitivePolicyAction}{\mathbf{a}} \newcommand{\CoherencyCoefficient}{\kappa_{\text{coh}}} \newcommand{\ColdCopperLossPower}{P_0} \newcommand{\ColdResetCycleTime}{T_{\text{cycle,cold}}} \newcommand{\CollaborativeContactForce}{F_{\text{contact}}} \newcommand{\CollectedPhotocharge}{Q} \newcommand{\CollectionCohortCost}{C_{\text{cohort}}} \newcommand{\CollectionStateVisitationDistribution}{p^{\pi_{\text{col}}}} \newcommand{\CollectiveCallStartupLatency}{\alpha_{\text{eff}}} \newcommand{\CollectiveInputTensor}{\mathbf{X}} \newcommand{\CollectivePayloadSize}{M} \newcommand{\CollectiveTensorSize}{M_{\text{coll}}} \newcommand{\CollisionHullCount}{N_{\text{hulls}}} \newcommand{\CollocationDefect}{\Delta} \newcommand{\ColumnAccessLatency}{t_{\text{CL}}} \newcommand{\ColumnModeComponentVector}{\mathbf{b}_s} \newcommand{\ColumnModeFactorMatrix}{\mathbf{B}} \newcommand{\ColumnModeFactorSlice}{\mathbf{b}} \newcommand{\ColumnParallelWeightMatrix}{\mathbf{A}} \newcommand{\CombinedBatch}{B_{\text{total}}} \newcommand{\CombinedPlanValidationAllowance}{t_{\text{validate}}} \newcommand{\CommandComponentCount}{N_c} \newcommand{\CommandRateCeiling}{r} \newcommand{\CommandTransportTime}{T_{\text{bus}}} \newcommand{\CommandedActuatorEffort}{u_{\text{cmd}}} \newcommand{\CommandedApproachAcceleration}{a_{\text{cmd}}} \newcommand{\CommandedJointConfiguration}{\mathbf{q}_{\text{cmd}}} \newcommand{\CommandedJointCount}{N_j} \newcommand{\CommandedJointTorque}{\tau} \newcommand{\CommandedJointTorqueSlew}{\dot{\tau}} \newcommand{\CommandedTrackedPosition}{r_{\text{cmd}}} \newcommand{\CommandedTractiveForce}{F_{\text{cmd}}} \newcommand{\CommitBatchRecordCount}{N_{\text{batch}}} \newcommand{\CommitmentInstant}{t_{\text{commit}}} \newcommand{\CommitmentPathPosition}{q_{c}} \newcommand{\CommonPositionShift}{\Delta} \newcommand{\CommunicationComputeRatio}{\rho} \newcommand{\CommunicationIntensity}{\text{CI}} \newcommand{\CommunicationSlowdownFactor}{r} \newcommand{\CommunicationTime}{T_{\text{comm}}} \newcommand{\CommunicationTimeFraction}{f} \newcommand{\CompactedContextLength}{S_{\text{comp}}} \newcommand{\CompactionBoundaryCount}{k} \newcommand{\CompactionBoundaryIndex}{i} \newcommand{\CompactionCycleTurnCount}{n_{\text{cycle}}} \newcommand{\CompactionCycleTurnIndex}{i} \newcommand{\CompactionLossProbability}{\rho} \newcommand{\CompactionPassCost}{C_{\text{comp}}} \newcommand{\CompactionPathCost}{C_{\text{compact}}} \newcommand{\CompactionPaybackCallCount}{N_{\min}} \newcommand{\CompactionPerCallSaving}{s} \newcommand{\CompactionTargetLength}{S_{\text{low}}} \newcommand{\CompactionTriggerLength}{S_{\text{high}}} \newcommand{\CompactionUpfrontCost}{U} \newcommand{\ComparedPeriodAccuracy}{a} \newcommand{\ComparisonArmTrialCount}{n_{\text{arm}}} \newcommand{\ComparisonContext}{c} \newcommand{\ComparisonSampleEmpiricalCdf}{G_{m}} \newcommand{\ComparisonSampleSize}{m} \newcommand{\ComparisonTrajectory}{z} \newcommand{\ComparisonTrajectoryDerivative}{\dot{z}} \newcommand{\CompensatedEnvironmentState}{\sigma_0'} \newcommand{\CompensationPostcondition}{\phi} \newcommand{\CompensationPostconditionSet}{\Phi} \newcommand{\CompetingKeyCount}{n} \newcommand{\CompetingKeyLogit}{z} \newcommand{\CompilationBreakevenCount}{N_{\text{breakeven}}} \newcommand{\CompilationTime}{T_{\text{compile}}} \newcommand{\CompiledExecutionTime}{T_{\text{compiled}}} \newcommand{\CompilerBackendCount}{N_{\text{backend}}} \newcommand{\CompilerFrontendCount}{M} \newcommand{\ComplementarityNormalForce}{\lambda_n} \newcommand{\CompletedRequestCount}{N} \newcommand{\CompletedRoundIndex}{r} \newcommand{\CompletionCriteria}{\mathcal{K}_{\text{comp}}} \newcommand{\CompletionDeadline}{T_{\text{deadline}}} \newcommand{\CompletionOffset}{c} \newcommand{\CompliantElementPreload}{F_{\text{preload}}} \newcommand{\CompliantElementStiffness}{k_{\text{spring}}} \newcommand{\ComponentAvailability}{A_{\text{component}}} \newcommand{\ComponentFailureRate}{\lambda} \newcommand{\ComponentHazardRate}{h} \newcommand{\ComponentMttf}{\text{MTTF}_{\text{component}}} \newcommand{\ComponentReliability}{R_{\text{single}}} \newcommand{\ComposedChainTransform}{\mathbf{T}_{AC}} \newcommand{\ComposedFunctionInput}{x} \newcommand{\ComposedFunctionOutput}{y} \newcommand{\ComposedMechanismCount}{k} \newcommand{\CompoundScalingCoefficient}{\phi} \newcommand{\CompressedCommunicationTime}{T_{\text{compressed}}} \newcommand{\CompressedGradientUpdate}{\mathbf{v}} \newcommand{\CompressedGradientUpdateElement}{v} \newcommand{\CompressedOnlyCorrectCount}{n_{\text{comp}}} \newcommand{\CompressionRatio}{r_{\text{comp}}} \newcommand{\ComputationalDimensionCount}{N_{\text{comp}}} \newcommand{\ComputationalGraph}{G} \newcommand{\ComputeBudgetConstraint}{g} \newcommand{\ComputeChipPower}{P_{\text{chip}}} \newcommand{\ComputeConstrainedLagrangian}{\mathcal{L}_{\text{Lagrange}}} \newcommand{\ComputeConstraintMultiplier}{\lambda} \newcommand{\ComputeDemandVolume}{Q} \newcommand{\ComputeLimitedSampleRate}{R_{\text{compute}}} \newcommand{\ComputeOptimalTokenCount}{D_{\text{opt}}} \newcommand{\ComputeUnitCost}{P} \newcommand{\ConcordantTaskCount}{n} \newcommand{\ConcurrentTrajectories}{N_{\text{traj}}} \newcommand{\ConditionalDamageProbability}{p} \newcommand{\ConditionalDistribution}{p(y \mid x)} \newcommand{\ConditionalFlowMap}{\psi} \newcommand{\ConditionalVelocityField}{v} \newcommand{\ConditioningTokenPrefix}{x} \newcommand{\ConductorCurrent}{I} \newcommand{\ConeLimitStepSize}{\tau} \newcommand{\ConfidenceCalibrationDataset}{\mathcal{D}_{\text{cal}}} \newcommand{\ConfidenceCriticalQuantile}{z_{\alpha/2}} \newcommand{\ConfidenceLevel}{C} \newcommand{\ConfidentialityLabel}{\kappa} \newcommand{\ConfigurationSpace}{\mathcal{C}} \newcommand{\ConfirmationHitCount}{M} \newcommand{\ConfirmationWindowCount}{N_{\text{conf}}} \newcommand{\ConfluentVandermondeMatrix}{\mathbf{M}} \newcommand{\ConformalMiscoverageRate}{\epsilon} \newcommand{\ConformalPredictionSet}{\mathcal{C}} \newcommand{\ConformalQuantileRank}{k_{\epsilon}} \newcommand{\ConformalScoreQuantile}{\widehat{q}_{1-\epsilon}} \newcommand{\ConservativePenaltyWeight}{\alpha_{\text{CQL}}} \newcommand{\ConservativeSamplingDistribution}{\mu} \newcommand{\ConsoleCommunicationTime}{T_{\text{comm}}} \newcommand{\ConsolidationOverheadTime}{T_{\text{overhead}}} \newcommand{\ConsolidationStride}{c} \newcommand{\ConstantDivisorGrpoObjective}{\widehat{\mathcal{J}}_{\text{const}}} \newcommand{\ConstantHazardRate}{\lambda} \newcommand{\ConstrainedCallLatency}{T_{\text{constrained}}} \newcommand{\ConstrainedDecodingAutomaton}{\mathcal{D}} \newcommand{\ConstrainedParameterVector}{\mathbf{w}} \newcommand{\ConstrainedTestEnvelope}{\mathcal{S}} \newcommand{\ConstraintLagrangeMultiplier}{\lambda} \newcommand{\ConstraintRetentionFraction}{\eta_{\mathcal{C}}} \newcommand{\ContactApproachSpeed}{v_{\text{approach}}} \newcommand{\ContactCount}{N_c} \newcommand{\ContactDeformationDuration}{\Delta t_{\text{def}}} \newcommand{\ContactDirectionSpeed}{v_c} \newcommand{\ContactDirectionVelocity}{\dot{x}} \newcommand{\ContactDriftAcceleration}{a_{\text{drift}}} \newcommand{\ContactForce}{F_{\text{contact}}} \newcommand{\ContactForceBarrierFunction}{h_{\text{force}}} \newcommand{\ContactForceCap}{F_{\text{cap}}} \newcommand{\ContactForceCeiling}{F_{\max}} \newcommand{\ContactForceLimit}{F_{\text{limit}}} \newcommand{\ContactForceMagnitude}{F} \newcommand{\ContactForceRegularizationWeight}{w_f} \newcommand{\ContactForceRiseTime}{t_{\text{rise}}} \newcommand{\ContactGapAcceleration}{\ddot{\phi}} \newcommand{\ContactGapFunction}{\phi} \newcommand{\ContactGapVelocity}{\dot{\phi}} \newcommand{\ContactImpulse}{I} \newcommand{\ContactJacobianBaseBlock}{\mathbf{J}_{k,b}} \newcommand{\ContactJacobianJointBlock}{\mathbf{J}_{k,j}} \newcommand{\ContactLoopResponseTime}{T_c} \newcommand{\ContactNaturalTimescale}{T_{\text{contact}}} \newcommand{\ContactNormal}{\hat{\mathbf{n}}} \newcommand{\ContactNormalDeflection}{x} \newcommand{\ContactNormalJacobian}{\mathbf{J}_n} \newcommand{\ContactNormalJacobianDerivative}{\dot{\mathbf{J}}_n} \newcommand{\ContactNormalPosition}{x} \newcommand{\ContactNormalVelocity}{v_n} \newcommand{\ContactPatchRegion}{\mathcal{A}} \newcommand{\ContactPointForce}{\mathbf{f}} \newcommand{\ContactPointIndex}{i} \newcommand{\ContactPointJacobian}{\mathbf{J}_{\text{c}}} \newcommand{\ContactPointJacobianDerivative}{\dot{\mathbf{J}}_{\text{c}}} \newcommand{\ContactPointOffset}{\mathbf{r}} \newcommand{\ContactPointPosition}{x} \newcommand{\ContactPointTorque}{\boldsymbol{\tau}} \newcommand{\ContactReactionForce}{F} \newcommand{\ContactResponseLatency}{t_{\text{resp}}} \newcommand{\ContactStiffness}{k_{\text{contact}}} \newcommand{\ContactTorqueCeiling}{\tau_{\max}} \newcommand{\ContactTripwireForce}{F_{\text{trip}}} \newcommand{\ContactWrench}{\mathbf{w}} \newcommand{\ContactWrenchCeiling}{\mathbf{w}_{\max}} \newcommand{\ContactWrenchEnvelope}{\mathbf{w}_{\text{contact}}} \newcommand{\ContactWrenchTransform}{\mathbf{X}_k^*} \newcommand{\ContactYieldDeadline}{t_{\text{yield}}} \newcommand{\ContainerInnerRadius}{R} \newcommand{\ContainmentForceCeiling}{F_{\max}} \newcommand{\ContendingApplicationCount}{N} \newcommand{\ContentionCoefficient}{\sigma_{\text{cont}}} \newcommand{\ContextChunkTokenCount}{n} \newcommand{\ContextHiddenRepresentation}{\mathbf{h}_{\text{context}}} \newcommand{\ContextParallelDegree}{c} \newcommand{\ContextParallelRankIndex}{i} \newcommand{\ContextSaveTime}{t_{\text{context\_save}}} \newcommand{\ContextWindow}{S_{\max}} \newcommand{\ContinuationCount}{K} \newcommand{\ContinuationIndex}{i} \newcommand{\ContinuationReturnStandardDeviation}{\sigma} \newcommand{\ContinuityCorrectedCrossProduct}{A} \newcommand{\ContinuousActionComponent}{a} \newcommand{\ContinuousActionSpace}{\mathcal{A}} \newcommand{\ContinuousActionVector}{\mathbf{a}} \newcommand{\ContinuousCurrent}{I_{\text{cont}}} \newcommand{\ContinuousFactorialFunction}{\Gamma} \newcommand{\ContinuousMeasurementNoiseIntensity}{\mathbf{R}_{\text{cont}}} \newcommand{\ContinuousMotionModel}{\mathbf{f}} \newcommand{\ContinuousOutcome}{\mathbf{x}} \newcommand{\ContinuousRandomVariable}{\mathbf{X}} \newcommand{\ContinuousStateTransitionMatrix}{\boldsymbol{\Phi}} \newcommand{\ContinuousTorque}{\tau_{\text{cont}}} \newcommand{\ContractedBarrierFunction}{h_{\text{contracted}}} \newcommand{\ControlAffineDriftField}{\mathbf{f}} \newcommand{\ControlAffineInputField}{\mathbf{g}} \newcommand{\ControlCommand}{\mathbf{u}} \newcommand{\ControlCommandDerivative}{\dot{\mathbf{u}}} \newcommand{\ControlCommandSpace}{\mathcal{U}} \newcommand{\ControlConversionRate}{\hat{p}_A} \newcommand{\ControlCycleIndex}{i} \newcommand{\ControlInput}{\mathbf{u}} \newcommand{\ControlInputDimension}{m} \newcommand{\ControlInputLowerLimit}{\mathbf{u}_{\min}} \newcommand{\ControlInputSet}{\mathcal{U}} \newcommand{\ControlInputUpperLimit}{\mathbf{u}_{\max}} \newcommand{\ControlInputWindow}{\mathbf{u}_{[t, t+\Delta t]}} \newcommand{\ControlSampleIndex}{k} \newcommand{\ControlSampleSize}{m_A} \newcommand{\ControlSetpointJerk}{\mathbf{j}} \newcommand{\ControlSetpointPeriod}{\Delta t_{\text{ctrl}}} \newcommand{\ControlStepIndex}{t} \newcommand{\ControlTaskIndex}{i} \newcommand{\ControllabilityMatrix}{\mathbf{C}_{\text{ctrb}}} \newcommand{\ControlledStopCommand}{\mathbf{u}_{\text{stop}}} \newcommand{\ControllerReactionDelay}{T_{\text{react}}} \newcommand{\ConversationTurnIndex}{i} \newcommand{\ConverterLockoutVoltage}{V_{\text{uvlo}}} \newcommand{\ConveyorSpeed}{v_{\text{conv}}} \newcommand{\ConveyorSpeedBound}{v_{\text{conv}}} \newcommand{\ConvolutionActivation}{H} \newcommand{\ConvolutionTimeInstant}{t'} \newcommand{\CookedTokenKeyVector}{\mathbf{k}_{\text{cooked}}} \newcommand{\CookedTokenQueryVector}{\mathbf{q}_{\text{cooked}}} \newcommand{\CoolantHeatLoad}{P_{\text{thermal}}} \newcommand{\CoolantMassFlowRate}{\dot{m}} \newcommand{\CoolantTemperature}{T} \newcommand{\CoolingEnergy}{E_{\text{cooling}}} \newcommand{\CoordinateFrameEmbedding}{\mathbf{e}_{\text{frame}}} \newcommand{\CoordinationLatency}{L_{\text{lat,coordination}}} \newcommand{\CoordinationOverhead}{h} \newcommand{\CopperIronThermalResistance}{R_{\text{th,cu-iron}}} \newcommand{\CopperReferenceTemperature}{T_0} \newcommand{\CopperTemperatureCoefficient}{\alpha_{\text{Cu}}} \newcommand{\CopperThermalCapacitance}{C_{\text{cu}}} \newcommand{\CopperThermalTimeConstant}{\tau_{\text{th,cu}}} \newcommand{\CoreAmbientThermalResistance}{R_{\text{th,ca}}} \newcommand{\CoreRailVoltageDroop}{\Delta V_{\text{droop}}} \newcommand{\CoreThermalCapacitance}{C_{\text{core}}} \newcommand{\CoresetBudget}{K} \newcommand{\CoriolisCentrifugalMatrix}{\mathbf{C}} \newcommand{\CorrectCandidateTrialPassProbability}{p_{g}} \newcommand{\CorrectClassIndex}{c} \newcommand{\CorrectClassLogit}{z_{c}} \newcommand{\CorrectClassProbability}{\hat{y}_{c}} \newcommand{\CorrectnessReward}{R_{\text{corr}}} \newcommand{\CorrelationCoefficient}{\rho} \newcommand{\CorruptedAttentionScoreMatrix}{\mathbf{S}_{\text{corrupt}}} \newcommand{\CorruptedModelWeight}{w'} \newcommand{\CostAnomalyScore}{Z} \newcommand{\CostBudgetUsedFraction}{\rho_C} \newcommand{\CostCeiling}{C_{\max}} \newcommand{\CostPerAcceptedTask}{C_{\text{eff}}} \newcommand{\CostPerEmittedArtifact}{C_{\text{emit}}} \newcommand{\CostToGo}{C} \newcommand{\CoulombFrictionCoefficient}{\mu} \newcommand{\CoulombFrictionForce}{F_{\text{friction}}} \newcommand{\CountedFailureIndicator}{e} \newcommand{\CovariateDriftBound}{\mathcal{O}(S^2 \epsilon)} \newcommand{\CoverageFactor}{k} \newcommand{\CpuEnergy}{E_{\text{CPU}}} \newcommand{\CredibleBrakingDeceleration}{a_{\text{brake}}} \newcommand{\CreditWindowCapacity}{N_{\text{win}}} \newcommand{\CriticActionReturnEstimate}{Q_{\phi}} \newcommand{\CriticApproximationError}{\epsilon} \newcommand{\CriticModel}{M_{\text{value}}} \newcommand{\CriticParameters}{\phi} \newcommand{\CriticReturnEstimate}{V_{\phi}} \newcommand{\CriticalBatchSize}{B^{*}} \newcommand{\CriticalConstraint}{c} \newcommand{\CriticalPathDuration}{T_{\text{crit}}} \newcommand{\CriticalSectionIndex}{s} \newcommand{\CriticalSectionWcet}{C^{\text{cs}}} \newcommand{\CriticalTrackingErrorBound}{\epsilon_{\text{crit}}} \newcommand{\CriticalTransitDistance}{d_{\text{crit}}} \newcommand{\CrossEntropyLevelThreshold}{\gamma} \newcommand{\CrossEntropyLoss}{\mathcal{L}_{\text{CE}}} \newcommand{\CrossoverFrequency}{\omega_c} \newcommand{\CruiseSpeed}{v_{c}} \newcommand{\CumulativeArrivals}{A} \newcommand{\CumulativeCompletions}{C} \newcommand{\CumulativeIncidentCount}{N} \newcommand{\CumulativeLogLikelihoodRatio}{\Lambda} \newcommand{\CumulativeScheduleStepIndex}{s} \newcommand{\CumulativeTransmittance}{T} \newcommand{\CumulativeWorkCost}{C} \newcommand{\CurrentBinProportion}{A} \newcommand{\CurrentDistribution}{P_t} \newcommand{\CurrentFeatureMean}{\mu_{\text{curr}}} \newcommand{\CurrentFeatureStandardDeviation}{\sigma_{\text{curr}}} \newcommand{\CurrentLayerWidth}{n_{\ell}} \newcommand{\CurrentModelParameters}{\theta_{\text{old}}} \newcommand{\CurrentMonotonicTime}{t_{\text{now,mono}}} \newcommand{\CurrentNodeIndex}{j} \newcommand{\CurrentPeriodCost}{C_{\text{current}}} \newcommand{\CurrentStateDigest}{h_{\text{state},t}} \newcommand{\CurrentStateEstimate}{\hat{\mathbf{x}}_{t_{\text{current}}}} \newcommand{\CurrentTime}{t_{\text{now}}} \newcommand{\CurrentWallClockTime}{t_{\text{current}}} \newcommand{\CutCrossingDataVolume}{V_{\text{cut}}} \newcommand{\CvaeEncoderParameters}{\phi} \newcommand{\CvaeRecognitionEncoder}{q_\phi} \newcommand{\CycleAveragePowerCeiling}{\bar{P}_{\max}} \newcommand{\CycleGuardTime}{t_{\text{guard}}} \newcommand{\CylinderForce}{F_{\text{cyl}}} \newcommand{\DailyAccountQueryCount}{q_{\text{daily}}} \newcommand{\DailyQueryVolume}{Q_{\text{day}}} \newcommand{\DamageEventCount}{N_{\text{damage}}} \newcommand{\DamageProbabilityTolerance}{\epsilon} \newcommand{\DamageProbabilityUpperBound}{p_U} \newcommand{\DamagingOutcomeIndicator}{Y} \newcommand{\DampedLeastSquaresPseudoinverse}{\mathbf{J}_{\lambda}^\dagger} \newcommand{\DampedStepConfiguration}{\mathbf{q}_\lambda} \newcommand{\DampingRatio}{\zeta} \newcommand{\DataAcquisitionCost}{C_{\text{acquire}}} \newcommand{\DataDebtGrowthRate}{r} \newcommand{\DataEgressCost}{C_{\text{egress}}} \newcommand{\DataFieldBitCount}{B_{\text{data},i}} \newcommand{\DataInformationContent}{\mathcal{I}} \newcommand{\DataLabelingCost}{C_{\text{label}}} \newcommand{\DataLoaderWorkerCount}{W} \newcommand{\DataMovementEnergyFraction}{q} \newcommand{\DataParallelDegree}{N_{\text{DP}}} \newcommand{\DataPhaseBitRate}{R_{\text{data}}} \newcommand{\DataPipelineProcessingCost}{C_{\text{process}}} \newcommand{\DataProcessingCost}{C_{\text{process}}} \newcommand{\DataScaleCoefficient}{B} \newcommand{\DataScalingExponent}{\beta} \newcommand{\DataScalingLossFactor}{D^{-\beta}} \newcommand{\DataStallFraction}{f_{\text{stall}}} \newcommand{\DataStorageCost}{C_{\text{store}}} \newcommand{\DataSupplyRate}{R_{\text{data}}} \newcommand{\DataTaxonomyAxis}{\mathsf{Data}} \newcommand{\DataVolume}{D_{\text{vol}}} \newcommand{\DatasetQuery}{f} \newcommand{\DatasetQueryResult}{v} \newcommand{\DatasetShardCount}{K_{\text{shards}}} \newcommand{\DatasetSize}{D} \newcommand{\DatasetTransferTime}{T} \newcommand{\DcBusBulkCapacitance}{C_{\text{bus}}} \newcommand{\DcBusOvervoltageThreshold}{V_{\text{max\_safe}}} \newcommand{\DcBusVoltage}{V_{\text{bus}}} \newcommand{\DcRailVoltage}{V_{\text{rail}}} \newcommand{\DeadTimeCycleCount}{N_{\text{dtg}}} \newcommand{\DeadTimeDqVoltageError}{\Delta V_{d,q}} \newcommand{\DeadTimeSafetyMargin}{t_{\text{margin}}} \newcommand{\DeadTimeTickPeriod}{T_{\text{dtg}}} \newcommand{\DeadTimeVoltageError}{\Delta V_{\text{phase}}} \newcommand{\DeadlineInstant}{t_{\text{deadline}}} \newcommand{\DebiasingTotalLoss}{\mathcal{L}_{\text{total}}} \newcommand{\DebounceFrameCount}{N} \newcommand{\DecisionProcessState}{s} \newcommand{\DecisionScore}{s_{\text{dec}}} \newcommand{\DecisionStepIndex}{k} \newcommand{\DecodeArithmeticIntensity}{I_{\text{decode}}} \newcommand{\DecodeBatchSize}{B_{\text{dec}}} \newcommand{\DecodeInterval}{T_{\text{decode}}} \newcommand{\DecodeRequestSet}{\mathcal{D}} \newcommand{\DecodeTokenTimeFloor}{T_{\text{token}}} \newcommand{\DecoderEvaluationCount}{N_{\text{eval}}} \newcommand{\DecoderPassTime}{t_{\text{pass}}} \newcommand{\DecodingConstraintState}{q} \newcommand{\DecomposedTensor}{\mathcal{Y}} \newcommand{\DecomposedTensorEntry}{y_{ijt}} \newcommand{\DecouplingCapacitance}{C} \newcommand{\DecouplingDriftVector}{\mathbf{b}} \newcommand{\DecouplingMatrix}{\mathbf{E}} \newcommand{\DecouplingMatrixElement}{E} \newcommand{\DedicatedHourlyFixedCost}{C_{\text{fixed}}} \newcommand{\DedicatedVariableTokenCost}{c_{\text{ded}}} \newcommand{\DefectiveActionProbability}{p_{\text{bad}}} \newcommand{\DefinitionSerializedSize}{S} \newcommand{\DeflectionComplianceAllowance}{\delta_{\text{deflect}}} \newcommand{\DegradedFrictionCoefficient}{\mu_{\text{fault}}} \newcommand{\DegradedStepTime}{T_{\text{slow}}} \newcommand{\DelassusOperator}{\mathbf{A}_{\text{Delassus}}} \newcommand{\DelayPhaseLag}{\Delta \phi} \newcommand{\DelayTravelDistance}{d_{\text{delay}}} \newcommand{\DelayWindowIntegrationTime}{\sigma} \newcommand{\DelayedObservation}{\mathbf{y}_{t_0}} \newcommand{\DelegatedAllocationAmount}{b} \newcommand{\DelegationTokenMultiple}{r} \newcommand{\DeliveredActuatorTorque}{\tau_{\text{act}}} \newcommand{\DeliveredCapacityFraction}{u} \newcommand{\DemandCap}{x_{\max}} \newcommand{\DemandPriceElasticity}{\epsilon_{\text{elast}}} \newcommand{\DemandThreshold}{x} \newcommand{\DemonstratedTargetA}{\mathbf{y}_A} \newcommand{\DemonstratedTargetB}{\mathbf{y}_B} \newcommand{\DemonstrationActionDistribution}{p} \newcommand{\DemonstrationActionLabel}{\mathbf{a}} \newcommand{\DemonstrationArchiveActionDistribution}{p_{\text{demo}}} \newcommand{\DemonstrationChunkDistribution}{p_{\text{data}}} \newcommand{\DemonstrationDataset}{\mathcal{D}_{\text{demo}}} \newcommand{\DemonstrationRetentionRate}{R} \newcommand{\DemonstratorAction}{\mathbf{a}^{*}} \newcommand{\DemonstratorActionComponent}{a} \newcommand{\DenseEvaluationEnergy}{E_{\text{eval}}} \newcommand{\DenseEvaluationRate}{f_{\text{eval}}} \newcommand{\DenseVoxelGridMemory}{M_{\text{dense}}} \newcommand{\DepartmentQuotaLimit}{Q_{\text{department}}} \newcommand{\DependencyGraphEdgeSet}{E} \newcommand{\DependencyGraphVertex}{v} \newcommand{\DependencyGraphVertexSet}{V} \newcommand{\DepletedBusVoltage}{V_{\text{low}}} \newcommand{\DeploymentAge}{t} \newcommand{\DeploymentDistribution}{p_{\text{deploy}}} \newcommand{\DeploymentDuration}{T_{\text{deployment}}} \newcommand{\DepthBinCount}{D} \newcommand{\DepthBinDistribution}{\boldsymbol{\alpha}_{u, v}} \newcommand{\DepthBinIndex}{k} \newcommand{\DepthBinLogits}{\mathbf{d}_{u, v}} \newcommand{\DepthBinProbability}{\alpha_{u, v}} \newcommand{\DepthCalibrationScale}{s} \newcommand{\DepthCalibrationShift}{t} \newcommand{\DepthCriticalPathLatency}{T^{\text{depth}}} \newcommand{\DepthFrameRate}{f_{\text{cam}}} \newcommand{\DepthHypothesis}{d} \newcommand{\DepthModeComponentVector}{\mathbf{c}_s} \newcommand{\DepthModeFactorMatrix}{\mathbf{C}} \newcommand{\DepthModeFactorSlice}{\mathbf{c}} \newcommand{\DepthRayCount}{N_{\text{rays}}} \newcommand{\DepthScalingRatio}{\alpha} \newcommand{\DepthStandardDeviation}{\sigma_z} \newcommand{\DerivativeControlEffort}{\mathbf{u}_{d}} \newcommand{\DerivativeFilterTimeConstant}{T_{f}} \newcommand{\DerivativeGainMatrix}{\mathbf{K}_{d}} \newcommand{\DerivativeOperator}{d} \newcommand{\DerivativeSplineControlPoint}{\mathbf{v}} \newcommand{\DerivedMemoryEntry}{c} \newcommand{\DerivedRecord}{y} \newcommand{\DesignLatencyQuantile}{Q_{1-\epsilon}} \newcommand{\DesiredContactPosition}{x_{\text{des}}} \newcommand{\DesiredContactVelocity}{\dot{x}_{\text{des}}} \newcommand{\DesiredTaskAcceleration}{\ddot{\mathbf{x}}_d} \newcommand{\DesiredTaskPosition}{\mathbf{x}_d} \newcommand{\DesiredTaskSpaceAcceleration}{\ddot{\mathbf{x}}^{\text{des}}} \newcommand{\DesiredTaskVelocity}{\dot{\mathbf{x}}_d} \newcommand{\DestinationRankIndex}{j} \newcommand{\DetectionCount}{n_{\text{det}}} \newcommand{\DetectionInterval}{t_{\text{detect}}} \newcommand{\DetectionMeasurementNoiseCovariance}{\boldsymbol{\Sigma}_{\text{meas},j}} \newcommand{\DetectionRangeShortfall}{\Delta d_{\text{detect}}} \newcommand{\DetectionTimestamp}{t_{\text{det}}} \newcommand{\DetectorMissProbability}{p_{\text{miss}}} \newcommand{\DeterministicPolicy}{\mu_{\theta}} \newcommand{\DevelopmentIterationCount}{N_{\text{dev}}} \newcommand{\DeviationDisadvantage}{u} \newcommand{\DeviceCount}{N} \newcommand{\DeviceEnergy}{E_{\text{device}}} \newcommand{\DeviceHardwareTime}{T_{\text{hw}}} \newcommand{\DeviceMemoryCapacity}{M_{\text{device}}} \newcommand{\DevicePower}{P_{\text{device}}} \newcommand{\DeviceRequestCapacity}{Q_{\text{req,max}}} \newcommand{\DeviceSilentCorruptionProbability}{p} \newcommand{\DiagnosticCoverage}{C_{\text{diag}}} \newcommand{\DictionaryCoefficientMatrix}{\mathbf{C}} \newcommand{\DifferentiabilityClass}{C} \newcommand{\DifferentialEntropy}{h} \newcommand{\DiffusionCumulativeSchedule}{\bar{\alpha}} \newcommand{\DiffusionGaussianNoise}{\boldsymbol{\epsilon}} \newcommand{\DiffusionMatchingLoss}{\mathcal{L}_{\text{diff}}} \newcommand{\DiffusionNoiseVariance}{\beta} \newcommand{\DiffusionStepCount}{N} \newcommand{\DiffusionStepIndex}{k} \newcommand{\DiffusionStepRetention}{\alpha} \newcommand{\DiffusionTimeCoordinate}{t_{\text{diff}}} \newcommand{\DirectAxisCurrent}{i_d} \newcommand{\DirectAxisInductance}{L_d} \newcommand{\DirectAxisVoltage}{v_d} \newcommand{\DirectionalCosineMatrix}{\mathbf{R}} \newcommand{\DirectionalDerivativeStep}{\epsilon} \newcommand{\DisadvantagedGroupClassificationThreshold}{\gamma_{\text{cls},g=\text{B}}} \newcommand{\DiscordantPairCount}{n_{\text{disc}}} \newcommand{\DiscordantPairFraction}{\psi} \newcommand{\DiscountFactor}{\gamma} \newcommand{\DiscountedReturn}{G} \newcommand{\DiscountedReturnStepOffset}{j} \newcommand{\DiscountedStateVisitationDistribution}{d} \newcommand{\DiscreteLqrFeedbackGain}{\mathbf{K}_{\text{lqr},d}} \newcommand{\DiscreteLqrQuadraticObjective}{J_d} \newcommand{\DiscreteOutcome}{x} \newcommand{\DiscretePlantDynamics}{f} \newcommand{\DiscreteRandomVariable}{X} \newcommand{\DiscreteSampleIndex}{k} \newcommand{\DiscreteStateSpaceInputMatrix}{\mathbf{B}_{d}} \newcommand{\DiscreteStateSpaceSystemMatrix}{\mathbf{A}_{d}} \newcommand{\DiscretizationBinCount}{n_{\text{bin}}} \newcommand{\DisengagedTakeoverResponseTime}{T_{\Sigma,2}} \newcommand{\DiskBandwidth}{\text{BW}_{\text{disk}}} \newcommand{\DisparityStandardDeviation}{\sigma_d} \newcommand{\DispatchAdmissionCeiling}{\Delta_{\text{da,max}}} \newcommand{\DispatchAdmissionInterval}{\Delta_{\text{da}}} \newcommand{\DispatchObservationAge}{t_{\text{age}}} \newcommand{\DispatchedOperationCount}{N_{\text{ops}}} \newcommand{\DisplayPipelineLatency}{t_{\text{disp}}} \newcommand{\DispreferredReferenceRelativeScore}{\Delta_l} \newcommand{\DispreferredTrajectory}{\tau_l} \newcommand{\DistanceEstimateStandardDeviation}{\sigma} \newcommand{\DistanceMeasurement}{z} \newcommand{\DistanceNormOrder}{p} \newcommand{\DistanceQueryPoint}{\mathbf{y}} \newcommand{\DistillationClassProbability}{p^{(T_{\text{distill}})}} \newcommand{\DistillationLoss}{\mathcal{L}_{\text{distill}}} \newcommand{\DistillationLossWeight}{\gamma_{\text{KD}}} \newcommand{\DistillationTemperature}{T_{\text{distill}}} \newcommand{\DistortedImageAbscissa}{x_d} \newcommand{\DistortedImageOrdinate}{y_d} \newcommand{\DistributedStepTime}{T_{\text{step}}} \newcommand{\DisturbanceAccelerationBound}{a_{\text{dist}}} \newcommand{\DisturbanceBasisCoefficient}{\psi} \newcommand{\DisturbanceBasisCount}{K} \newcommand{\DisturbanceBasisFunction}{B} \newcommand{\DisturbanceBudget}{\Delta_{w}} \newcommand{\DisturbanceDimension}{p} \newcommand{\DisturbanceForceBound}{d_{\max}} \newcommand{\DisturbanceParameterSet}{\Psi} \newcommand{\DisturbanceParameterVector}{\boldsymbol{\psi}} \newcommand{\DisturbanceTrajectory}{w_{\text{dist}}} \newcommand{\DivergenceInstant}{t_{\text{div}}} \newcommand{\DivergenceMeasure}{\mathcal{D}} \newcommand{\DivergenceTolerance}{\delta_{\text{tol}}} \newcommand{\DmaBurstPeriod}{T_{\text{dma}}} \newcommand{\DmaBurstStallTime}{C_{\text{dma}}} \newcommand{\DmaQueueTime}{t_{\text{DMA}}} \newcommand{\DocumentPayloadFraction}{q} \newcommand{\DomainRandomizationDistribution}{\mathcal{D}_{\text{DR}}} \newcommand{\DomainRandomizationObjective}{J_{\text{DR}}} \newcommand{\DominantComponentEnergy}{E_{\text{dominant}}} \newcommand{\DominantShare}{d} \newcommand{\DoorOpenReward}{r_{\text{open}}} \newcommand{\DoubleIntegratorPosition}{p} \newcommand{\DoubleIntegratorPositionDerivative}{\dot{p}} \newcommand{\DoubleIntegratorVelocity}{v} \newcommand{\DoubleIntegratorVelocityDerivative}{\dot{v}} \newcommand{\DoubleTreeAllReduceTime}{T_{\text{double-tree}}} \newcommand{\DownstreamStageLatency}{Y} \newcommand{\DpoLoss}{\mathcal{L}_{\text{DPO}}} \newcommand{\DraftAcceptanceRate}{\alpha} \newcommand{\DraftCandidateToken}{\tilde{x}} \newcommand{\DraftModelDistribution}{q_{\phi}} \newcommand{\DraftPositionAcceptanceProbability}{\alpha_{\text{spec}, j}} \newcommand{\DraftPositionIndex}{i} \newcommand{\DraftSamplingDistribution}{q} \newcommand{\DraftTokenAcceptanceProbability}{\alpha_{\text{acc}}} \newcommand{\DraftTokenCostRatio}{\beta} \newcommand{\DraftTokenCount}{\gamma} \newcommand{\DraftedToken}{T} \newcommand{\DragonflyGlobalChannelCount}{h} \newcommand{\DragonflyGroupRouterCount}{a} \newcommand{\DragonflyTerminalPortCount}{p} \newcommand{\DrainSourceVoltage}{V_{\text{ds}}} \newcommand{\DriftElapsedTime}{t_{\text{drift}}} \newcommand{\DriftImpactTime}{t_{\text{impact}}} \newcommand{\DriftLieDerivativeOperator}{L_{\mathbf{f}}} \newcommand{\DriftSpeedBound}{v_{\text{drift}}} \newcommand{\DriftTestSampleSize}{n} \newcommand{\DriftVelocityBound}{v_{\text{drift}}} \newcommand{\DriveBrakingForceCeiling}{F} \newcommand{\DriveBrakingTorqueCeiling}{\tau} \newcommand{\DrivenWheelLoadFraction}{\phi_{\text{drive}}} \newcommand{\DriverInterruptLatency}{t_{\text{driver\_irq}}} \newcommand{\DrivetrainAntiresonanceFrequency}{f_{\text{anti}}} \newcommand{\DrivetrainResonanceFrequency}{f_{\text{res}}} \newcommand{\DroopedSupplyVoltage}{V_{\text{droop}}} \newcommand{\DropletDiameter}{d_{\text{droplet}}} \newcommand{\DropoutProbability}{p_{\text{drop}}} \newcommand{\DualNumberInfinitesimal}{\epsilon} \newcommand{\DuplicateEffectProbability}{p_{\text{dup}}} \newcommand{\DurableAcknowledgmentTime}{t_{\text{ack}}} \newcommand{\DurableStoreWriteBandwidth}{\text{BW}_{\text{store}}} \newcommand{\DutyCyclePeriod}{T_{\text{period}}} \newcommand{\DynamicPower}{P_{\text{dynamic}}} \newcommand{\DynamicReachableSet}{\mathcal{R}} \newcommand{\DynamicsRealityGap}{\Delta_{\text{dyn}}} \newcommand{\EagerExecutionTime}{T_{\text{eager}}} \newcommand{\EarlierBaseFlangeTransform}{\mathbf{T}_{\text{base}, k}^{\text{flange}}} \newcommand{\EarlierCameraTargetTransform}{\mathbf{T}_{\text{cam}, k}^{\text{target}}} \newcommand{\EarlierControlStepIndex}{t'} \newcommand{\EarlierWorkerCount}{k} \newcommand{\EarliestConflictTime}{t_{\text{conflict}}} \newcommand{\EarthReferenceFrame}{\mathcal{F}_{\text{earth}}} \newcommand{\EchoFactor}{e} \newcommand{\EchoRoundTripTime}{t_{\text{rt}}} \newcommand{\EditGrantRights}{\mathcal{R}_{\Gamma_{\text{edit}}}} \newcommand{\EditPhaseCapabilityGrant}{\Gamma_{\text{edit}}} \newcommand{\EffectiveAdmissionCeiling}{Q_{\text{effective}}} \newcommand{\EffectiveApiOutputTokenPrice}{c_{\text{API}}} \newcommand{\EffectiveBrakingDelay}{T_{\text{eff}}} \newcommand{\EffectiveBranchingFactor}{b_{\text{eff}}} \newcommand{\EffectiveConfidentialityLabel}{\kappa_{\text{eff}}} \newcommand{\EffectiveFleetThroughput}{R_{\text{eff}}} \newcommand{\EffectiveImpactMass}{m_{\text{eff}}} \newcommand{\EffectiveIntegrityProvenance}{\iota_{\text{eff}}} \newcommand{\EffectiveJointInertia}{J_{\text{eff}}} \newcommand{\EffectiveLossResistance}{R_{\text{eff}}} \newcommand{\EffectiveSampleSize}{N_{\text{eff}}} \newcommand{\EffectiveSeriesStiffness}{k_{\text{eff}}} \newcommand{\EffectiveServiceRate}{\mu_{\text{eff}}} \newcommand{\EffectiveSpotTrainingCost}{C_{\text{effective}}} \newcommand{\EffectiveStorageThroughput}{R_{\text{storage,eff}}} \newcommand{\EffectiveWasteFraction}{W_{\text{effective}}} \newcommand{\EfficiencyHw}{\eta_{\text{hw}}} \newcommand{\EgressArrivalRate}{\lambda_{\text{arr}}} \newcommand{\EgressBufferCapacity}{Q_{\text{max}}} \newcommand{\EgressPortUtilization}{\rho_{\text{egress}}} \newcommand{\EgressPrice}{R_{\text{egress/GB}}} \newcommand{\EgressQueueOccupancy}{Q} \newcommand{\EgressServiceRate}{\mu} \newcommand{\ElapsedPlanningPeriods}{n} \newcommand{\ElasticJointTorque}{\mathbf{z}} \newcommand{\ElasticMaximumWorkerCount}{N_{\text{max}}} \newcommand{\ElasticMinimumWorkerCount}{N_{\text{min}}} \newcommand{\ElasticModalFrequencyMatrix}{\boldsymbol{\Omega}} \newcommand{\ElasticPotentialEnergy}{E} \newcommand{\ElasticStrainEnergy}{U_{\text{elastic}}} \newcommand{\ElasticTorqueSecondDerivative}{\ddot{\mathbf{z}}} \newcommand{\ElbowSwivelAngle}{\psi} \newcommand{\ElectricalAngularSpeed}{\omega_e} \newcommand{\ElectricalResistance}{R} \newcommand{\ElectricalRotorAngle}{\theta_e} \newcommand{\ElectricalTimeConstant}{\tau_e} \newcommand{\ElectricityPrice}{R_{\$/\text{kWh}}} \newcommand{\ElementStorageSize}{s_{\text{elem}}} \newcommand{\ElementaryCharge}{q} \newcommand{\ElementaryOperationCount}{W} \newcommand{\ElevationAngle}{\phi} \newcommand{\EligibleCachedPrefixLength}{S_{\text{hit}}} \newcommand{\EligibleTargetPositionSet}{\mathcal{P}_{\text{elig}}} \newcommand{\EligibleVectorCount}{N} \newcommand{\EliteSampleFraction}{\beta} \newcommand{\EmbeddingDimension}{d} \newcommand{\EmbeddingShardCount}{N_{\text{shards}}} \newcommand{\EmergencyStopContact}{S} \newcommand{\EmergencyStopCount}{n_{\text{estop}}} \newcommand{\EmittedArtifactCount}{N_{\text{emit}}} \newcommand{\EmittedTokenCount}{S_{\text{out}}} \newcommand{\EmpiricalBellmanOperator}{\mathcal{B}} \newcommand{\EmpiricalExceedanceFraction}{\hat{\zeta}_{u}} \newcommand{\EmpiricalTimestepAverage}{\hat{\mathbb{E}}} \newcommand{\EmpiricalTransferDiscrepancy}{\hat{\epsilon}_{\text{gap}}} \newcommand{\EmptyByteString}{\epsilon} \newcommand{\EncodedLatentState}{\hat{\mathbf{z}}} \newcommand{\EncoderAngle}{\theta_{\text{enc}}} \newcommand{\EncoderBitCount}{n} \newcommand{\EncoderLatentRepresentation}{\mathbf{z}} \newcommand{\EncoderVelocityEstimate}{\dot{\theta}_{\text{enc}}} \newcommand{\EncoderVelocityNoise}{\sigma_{\dot{\theta}_{\text{enc}}}} \newcommand{\EndEffectorCameraTransform}{\mathbf{T}_{EC}} \newcommand{\EndEffectorFirstAxisPosition}{x} \newcommand{\EndEffectorPitchAngle}{\phi_{\text{pitch}}} \newcommand{\EndEffectorPose}{\mathbf{T}_{WE}} \newcommand{\EndEffectorRollAngle}{\phi_{\text{roll}}} \newcommand{\EndEffectorSecondAxisPosition}{y} \newcommand{\EndEffectorTaskAcceleration}{\ddot{\mathbf{x}}} \newcommand{\EndEffectorTaskPosition}{\mathbf{x}} \newcommand{\EndEffectorTaskVelocity}{\dot{\mathbf{x}}} \newcommand{\EndEffectorThirdAxisPosition}{z} \newcommand{\EndEffectorTwist}{\mathbf{V}_E} \newcommand{\EndEffectorVelocity}{\mathbf{v}_e} \newcommand{\EndEffectorYawAngle}{\phi_{\text{yaw}}} \newcommand{\EndToEndRequestLatency}{L_{\text{lat,total}}} \newcommand{\EnergyCrossoverIntensity}{I_{\text{crossover}}} \newcommand{\EnergyLimitedContactForce}{F_E} \newcommand{\EnergyPerByteMoved}{E_{\text{move}}} \newcommand{\EnergyPerOperation}{E_{\text{compute}}} \newcommand{\EnergyTankBarrierFunction}{h_{\text{energy}}} \newcommand{\EnergyTankLevel}{E_{\text{tank}}} \newcommand{\EnergyTankPower}{\dot{E}_{\text{tank}}} \newcommand{\EnergyTankReserve}{E_{\text{min}}} \newcommand{\EnforcedCommandLabel}{\mathbf{a}_{\text{enf}, t}} \newcommand{\EnforcedCommandTap}{a_{\text{enf}}} \newcommand{\EnforcerComputeTime}{T_{\text{comp}}} \newcommand{\EnforcerDeadline}{T_{\text{deadline,enf}}} \newcommand{\EngineerHourlyCost}{C_{\text{engineer}}} \newcommand{\EngineeringTeamSize}{n} \newcommand{\EngineeringTemperatureCeiling}{T_{\text{ceil}}} \newcommand{\EnsembleSpreadThreshold}{\sigma_{\text{thresh}}} \newcommand{\EnsemblingDecayRate}{m} \newcommand{\EnsemblingWindowLength}{K} \newcommand{\EntityCount}{N_{\text{entities}}} \newcommand{\EntityEmbedding}{\mathbf{e}} \newcommand{\EntityIndex}{j} \newcommand{\EntropyTemperature}{\alpha} \newcommand{\EnvelopeCallCount}{N} \newcommand{\EnvelopeSetupTime}{T_{\text{setup}}} \newcommand{\EnvironmentCycleTime}{T_{\text{cycle}}} \newcommand{\EnvironmentFixture}{f} \newcommand{\EnvironmentLatentDimension}{d_z} \newcommand{\EnvironmentLatentVector}{\mathbf{z}} \newcommand{\EnvironmentParameters}{e} \newcommand{\EnvironmentResetTime}{T_{r}} \newcommand{\EnvironmentResponseFunction}{g} \newcommand{\EnvironmentRolloutStepCount}{h} \newcommand{\EnvironmentTransitionDistribution}{p} \newcommand{\EpipolarLine}{\mathbf{l}} \newcommand{\EpochCount}{N_{\text{epochs}}} \newcommand{\EpochIndex}{n_{\text{epoch}}} \newcommand{\EquilibriumWindingTemperature}{T_\infty} \newcommand{\EquivalentSeriesStiffness}{k_{\text{eq}}} \newcommand{\ErasureDataFragmentCount}{d} \newcommand{\ErasureParityFragmentCount}{m} \newcommand{\ErroneousPredictionCost}{C_{\text{error}}} \newcommand{\ErrorBudgetConsumption}{B} \newcommand{\ErrorCovarianceDerivative}{\dot{\mathbf{P}}} \newcommand{\ErrorFeedbackResidual}{\mathbf{e}} \newcommand{\ErrorFeedbackResidualElement}{e} \newcommand{\ErrorGrowthRate}{r} \newcommand{\ErrorRecoveryCost}{C_{\text{recovery}}} \newcommand{\EscalationDecision}{d} \newcommand{\EscalationLossMatrix}{\mathbf{L}} \newcommand{\EscalationThresholdProbability}{p_{\text{threshold}}} \newcommand{\EssentialMatrix}{\mathbf{E}} \newcommand{\EstimateEpoch}{t_{\text{est}}} \newcommand{\EstimatedAcceptanceProbability}{\hat{p}} \newcommand{\EstimatedAccuracy}{\hat{p}} \newcommand{\EstimatedCandidateUtility}{\hat{U}} \newcommand{\EstimatedCleanActionChunk}{\hat{\mathbf{A}}} \newcommand{\EstimatedCoriolisMatrix}{\hat{\mathbf{C}}} \newcommand{\EstimatedDamageProbability}{\hat{p}} \newcommand{\EstimatedDivergenceInstant}{\hat{t}_{\text{div}}} \newcommand{\EstimatedForceSensorBias}{\hat{b}} \newcommand{\EstimatedGravitationalTorque}{\hat{\mathbf{g}}} \newcommand{\EstimatedGripContactForce}{\hat{x}} \newcommand{\EstimatedHistoryAdvantage}{\hat{A}} \newcommand{\EstimatedInertiaMatrix}{\hat{\mathbf{M}}} \newcommand{\EstimatedPairedAcceptanceDifference}{\hat{\Delta}} \newcommand{\EstimatedPlantState}{\hat{\mathbf{x}}} \newcommand{\EstimatedPosition}{\hat{\mathbf{p}}} \newcommand{\EstimatedRemainingReturn}{\hat{V}} \newcommand{\EstimatedUtilityStandardDeviation}{s} \newcommand{\EstimatedVelocity}{\hat{\mathbf{v}}} \newcommand{\EstimatedWindingTemperature}{\hat{T}_{\text{wind}}} \newcommand{\EstimationErrorCovariance}{\mathbf{P}} \newcommand{\EstimatorDrawCount}{N} \newcommand{\EstimatorDrawStandardDeviation}{\sigma} \newcommand{\EstimatorState}{\mathbf{x}} \newcommand{\EstimatorStateVector}{\mathbf{x}} \newcommand{\EstimatorStepIndex}{k} \newcommand{\EulerIntegralFirstShape}{a} \newcommand{\EulerIntegralSecondShape}{b} \newcommand{\EulerIntegralVariable}{t} \newcommand{\EvaluatedExceedance}{y} \newcommand{\EvaluationPredicate}{\phi} \newcommand{\EvaluationSampleCount}{N} \newcommand{\EvaluationTrialCount}{N} \newcommand{\EvaluationTrialIndex}{i} \newcommand{\EventContrastThreshold}{C_{\text{th}}} \newcommand{\EventDetectionPower}{P_{\text{detect}}} \newcommand{\EventIndicator}{\mathbf{1}} \newcommand{\EventPacket}{e} \newcommand{\EventPolarity}{p} \newcommand{\EventProcessingEnergy}{E_{\text{event}}} \newcommand{\EvidenceCaptureInstant}{t_{\text{capture}}} \newcommand{\EvidenceEpoch}{t_0} \newcommand{\EvidenceHorizon}{\tau_{\text{ev}}} \newcommand{\EvidenceLowerBound}{\mathcal{L}_{\text{ELBO}}} \newcommand{\EvidenceRecordEvent}{e_{\text{obs}}} \newcommand{\ExactFailureLowerLimit}{p_{L}} \newcommand{\ExactFailureUpperLimit}{p_{U}} \newcommand{\ExampleAveragedBatchLoss}{\mathcal{L}_{\text{example}}} \newcommand{\ExampleIndex}{i} \newcommand{\ExampleLabel}{y} \newcommand{\ExceedanceReturnLevel}{z_\epsilon} \newcommand{\ExceedanceSampleSet}{\mathcal{Y}_u} \newcommand{\ExceedanceThreshold}{u} \newcommand{\ExcessDistributionFunction}{F_{u}} \newcommand{\ExcessForcePenaltyWeight}{\lambda_f} \newcommand{\ExcessSupportUpperEndpoint}{y_{\max}} \newcommand{\ExecutedActionStepCount}{T_a} \newcommand{\ExecutedToolCall}{a} \newcommand{\ExecutedTrialCount}{N_{\text{trial}}} \newcommand{\ExecutionHorizon}{H_{\text{exec}}} \newcommand{\ExecutionNondeterminism}{\xi} \newcommand{\ExecutionSwitchTime}{T_{\text{switch}}} \newcommand{\ExogenousDataDistribution}{\mathcal{D}} \newcommand{\ExpectedCategoryFrequency}{n_i^{\text{exp}}} \newcommand{\ExpectedCheckingTime}{T_{\text{check}}} \newcommand{\ExpectedCostLimit}{\delta} \newcommand{\ExpectedDecisionRisk}{\mathcal{R}} \newcommand{\ExpectedHistoryActionReturn}{Q} \newcommand{\ExpectedIrreversibleLoss}{L_A} \newcommand{\ExpectedNormalMaximum}{m_{N}} \newcommand{\ExpectedQueryDistribution}{p_{\text{expected}}} \newcommand{\ExpectedRemainingReturn}{V} \newcommand{\ExpectedReturnObjective}{J} \newcommand{\ExpectedRunCompletionTime}{T} \newcommand{\ExpectedTaskCostSum}{J} \newcommand{\ExperienceReplayBuffer}{\mathcal{D}} \newcommand{\ExperimentCount}{N_{\text{exp}}} \newcommand{\ExperimentUserIndex}{i} \newcommand{\ExpertCapacityFactor}{C_{\text{cap}}} \newcommand{\ExpertCount}{N_{\text{experts}}} \newcommand{\ExpertDiscountedStateVisitationDistribution}{d^{\pi^*}} \newcommand{\ExpertIndex}{e} \newcommand{\ExpertSelectionProbability}{p_e} \newcommand{\ExpertStateVisitationDistribution}{p^{\pi^*}} \newcommand{\ExpertTokenCount}{B_e} \newcommand{\ExploitCandidateFraction}{p_{\text{exp}}} \newcommand{\ExploitTrajectory}{\tau_{\text{hack}}} \newcommand{\ExploratoryStateVisitationDistribution}{p^{\pi_{\text{expl}}}} \newcommand{\ExponentBitIndex}{k} \newcommand{\ExponentialSeriesArgument}{u} \newcommand{\ExponentialStabilityConstant}{k} \newcommand{\ExposedCommunicationTime}{T_{\text{comm,exposed}}} \newcommand{\ExposedUnitCount}{E_{\text{exposure}}} \newcommand{\ExposureDuration}{t_{\text{exp}}} \newcommand{\ExposureMidpointTime}{t_{\text{mid}}} \newcommand{\ExposureMotionDisplacement}{\Delta x_{\text{motion}}} \newcommand{\ExposureStartTime}{t_{\text{start}}} \newcommand{\ExposureTravelDistance}{\Delta x} \newcommand{\ExtendedClassKInfinityFamily}{\mathcal{K}_\infty} \newcommand{\ExtendedDepthLength}{K_{\text{ext}}} \newcommand{\ExternalContactTorque}{\boldsymbol{\tau}_{\text{ext}}} \newcommand{\ExternalDispatchAction}{a_{\text{ext}}} \newcommand{\ExternalDisturbanceForce}{d} \newcommand{\ExternalDisturbanceLoad}{\mathbf{d}_{\text{ext}}} \newcommand{\ExternalJointTorque}{\tau_{\text{ext}}} \newcommand{\ExternalObjectWrench}{\mathbf{w}_{\text{ext}}} \newcommand{\ExternalWait}{T_{\text{wait}}} \newcommand{\ExternalWrench}{\mathbf{F}_{\text{ext}}} \newcommand{\ExtractionAnomalyClassifier}{f_{\theta}} \newcommand{\ExtractionQueryCount}{n_{\text{queries}}} \newcommand{\ExtrinsicCalibrationCovariance}{\boldsymbol{\Sigma}_{\text{ext}}} \newcommand{\ExtrinsicCovarianceJacobian}{\mathbf{J}_{\text{ext}}} \newcommand{\ExtrinsicLateralError}{\Delta y} \newcommand{\ExtrinsicMisalignmentAngle}{\theta_{\text{ext}}} \newcommand{\EyeInHandCameraMotion}{\mathbf{B}} \newcommand{\EyeInHandFlangeMotion}{\mathbf{A}} \newcommand{\EyeInHandUnknownTransform}{\mathbf{X}} \newcommand{\EyeToHandCameraPose}{\mathbf{B}'} \newcommand{\EyeToHandFlangePose}{\mathbf{A}'} \newcommand{\EyeToHandTargetTransform}{\mathbf{Z}} \newcommand{\EyeToHandUnknownTransform}{\mathbf{X}'} \newcommand{\FacilityEnergy}{E_{\text{facility}}} \newcommand{\FacilityHeatRemovalCapacity}{\dot{Q}_{\text{remove,max}}} \newcommand{\FacilityPower}{P_{\text{facility}}} \newcommand{\FacilityWaterConsumption}{W_{\text{water}}} \newcommand{\FactoredIntermediateActivation}{\mathbf{z}} \newcommand{\FactorizationRank}{k} \newcommand{\FailureDetectionTime}{T_{\text{detect}}} \newcommand{\FailureEventCost}{C_{\text{per-failure}}} \newcommand{\FailureFlagLatency}{\delta_{\text{flag}}} \newcommand{\FailureMarginFunction}{l} \newcommand{\FailureModeOccurrenceCount}{n_{f}} \newcommand{\FailureObservationInterval}{T} \newcommand{\FailureOverheadFraction}{F_{\text{fail}}} \newcommand{\FailureRecoveryTime}{T_{\text{recovery}}} \newcommand{\FailureRegion}{F} \newcommand{\FailureSet}{\mathcal{F}_{\text{fail}}} \newcommand{\FailureUpperConfidenceLimit}{p_{\text{fail, upper}}} \newcommand{\FairShareStabilizingConstant}{\epsilon_{\text{stab}}} \newcommand{\FairnessGapTolerance}{\epsilon_{\text{fair}}} \newcommand{\FakeQuantizedOutput}{x_{\text{fake}}} \newcommand{\FallbackCost}{C_{\text{fallback}}} \newcommand{\FallbackDeadline}{T_{\text{deadline,fallback}}} \newcommand{\FallbackHold}{T_{\text{hold}}} \newcommand{\FalseAcceptHarmCost}{C_{\text{harm}}} \newcommand{\FalseApprovalCount}{N_{\text{fa}}} \newcommand{\FalseApprovalOutcomeCount}{k} \newcommand{\FalseApprovalPropensity}{Q} \newcommand{\FalseApprovalPropensityLevel}{q} \newcommand{\FalseDiscoveryRateTarget}{q} \newcommand{\FalsificationInitialStateSet}{\mathcal{X}_0} \newcommand{\FanoutBackendCount}{m} \newcommand{\FarthestCandidateDistance}{D_{\max}} \newcommand{\FatTreeHostCount}{N_{\text{hosts}}} \newcommand{\FatigueLifeCycleCount}{N} \newcommand{\FaultContainmentLatency}{\Delta t_{\text{bounded}}} \newcommand{\FaultDetectionLatency}{\Delta t_{\text{det}}} \newcommand{\FaultDomainIsolation}{\mathcal{F}} \newcommand{\FaultInjectionDuration}{\Delta t_{\text{duration}}} \newcommand{\FaultStartTimestamp}{t_{\text{fault\_start}}} \newcommand{\FaultTakeoverLatency}{\Delta t_{\text{takeover}}} \newcommand{\FaultTakeoverTimestamp}{t_{\text{takeover}}} \newcommand{\FaultToleranceCost}{C_{\text{ft}}} \newcommand{\FaultToleranceInvestment}{x} \newcommand{\FeasibleOutputTokenRate}{\mu_{\text{out}}} \newcommand{\FeasibleTrajectoryProjection}{\Pi_{\mathcal{K}}} \newcommand{\FeasibleTrajectorySet}{\mathcal{K}} \newcommand{\FeatureCategoryCount}{k} \newcommand{\FeatureCategoryIndex}{i} \newcommand{\FeatureCellVector}{\mathbf{f}_{u, v}} \newcommand{\FeatureChannelCount}{C} \newcommand{\FeatureCount}{N_{\text{features}}} \newcommand{\FeatureFreshnessLatency}{T_{\text{freshness}}} \newcommand{\FeatureMapColumnCoordinate}{x} \newcommand{\FeatureMapGrowthRate}{g} \newcommand{\FeatureMapHeight}{H_{\text{img}}} \newcommand{\FeatureMapRowCoordinate}{y} \newcommand{\FeatureMapWidth}{W_{\text{img}}} \newcommand{\FeatureRecordTime}{t} \newcommand{\FeatureRetentionWindow}{T_{\text{retention}}} \newcommand{\FeatureUpdateInterval}{T_{\text{update}}} \newcommand{\FeatureUpdateLag}{T_{\text{staleness}}} \newcommand{\FeatureUpdateTimestamp}{t_{\text{feat}}} \newcommand{\FeatureViewingDistance}{r} \newcommand{\FederatedRoundCount}{R} \newcommand{\FederatedRoundIndex}{t} \newcommand{\FederatedTrainingEnergy}{E_{\text{federated}}} \newcommand{\FeedForwardOperations}{O_{\text{FFN}}} \newcommand{\FeedForwardWidth}{d_{\text{ff}}} \newcommand{\FeedbackCheckDuration}{t_{\text{check}}} \newcommand{\FeedbackCriticalPathLatency}{T^{\text{feedback}}} \newcommand{\FeedbackIntervalCount}{k} \newcommand{\FeedbackStepIndex}{t} \newcommand{\FeedforwardJointTorque}{\boldsymbol{\tau}_{\text{ff}}} \newcommand{\FeedthroughMatrix}{\mathbf{D}} \newcommand{\FewShotStepCount}{n_{\text{steps}}} \newcommand{\FewShotSupportSet}{\mathcal{D}_{\text{shot}}} \newcommand{\FiberPropagationSpeed}{c_{\text{fiber}}} \newcommand{\FieldbusCycleTime}{T_{\text{cycle}}} \newcommand{\FilmEncounterRate}{\lambda_{\text{film}}} \newcommand{\FilterSolveBudget}{T_{\text{budget}}} \newcommand{\FilterSolveTime}{T_{\text{solve}}} \newcommand{\FilterTapCount}{N} \newcommand{\FilterWeight}{w} \newcommand{\FilteredScreenSpaceCovariance}{\boldsymbol{\Sigma}_{2D}'} \newcommand{\FinalBusVoltage}{V_{\text{final}}} \newcommand{\FinalGeneratorLatentVector}{\mathbf{z}_{m}} \newcommand{\FinalLayerFunction}{f_{N_L}} \newcommand{\FinalLayerWidth}{n_{N_L}} \newcommand{\FinalMiniBatchActivation}{a_{B}} \newcommand{\FinalRecurrentHiddenState}{\mathbf{h}_{S}} \newcommand{\FinalWatchdogToken}{T_{\text{final}}} \newcommand{\FingerNormalForce}{f_n} \newcommand{\FingerTangentialForce}{\mathbf{f}_t} \newcommand{\FinishedWorkerCount}{j} \newcommand{\FiniteChange}{\Delta} \newcommand{\FiniteSampleGeneralizationBound}{\delta_N} \newcommand{\FiniteTimeHorizon}{T} \newcommand{\FirstAdjacentCheckIndex}{a} \newcommand{\FirstAdjacentCheckPassProbability}{p_{a}} \newcommand{\FirstAdjacentCheckSlotTime}{T_{a}} \newcommand{\FirstAtomicGradientUpdate}{A} \newcommand{\FirstCatalogDefinitionCount}{n_{\text{def},A}} \newcommand{\FirstCatalogDefinitionSize}{S_{A}} \newcommand{\FirstClassCoverageFloor}{a} \newcommand{\FirstClientMaskedUpdate}{\mathbf{y}_A} \newcommand{\FirstClientModelParameters}{\theta_A} \newcommand{\FirstComparedGroupLabel}{a} \newcommand{\FirstComparedItem}{i} \newcommand{\FirstDiscardedSingularNumber}{\sigma_{r+1}} \newcommand{\FirstErrorStepIndex}{k} \newcommand{\FirstFloatingPointAddend}{a} \newcommand{\FirstGroupClassificationThreshold}{\tau_{\text{thr},a}} \newcommand{\FirstGroupQualifiedFraction}{q_a} \newcommand{\FirstGroupSampleApprovalRate}{\hat{p}_a} \newcommand{\FirstGroupSampleSize}{n_a} \newcommand{\FirstGroupThresholdClassifier}{h_a} \newcommand{\FirstIncidentTime}{t_1} \newcommand{\FirstInputNodePrimal}{v_{1-N}} \newcommand{\FirstJaccardSet}{\mathcal{A}} \newcommand{\FirstMistakeEvent}{\mathcal{E}} \newcommand{\FirstRankComputeTime}{T_{\text{rank}_0}} \newcommand{\FirstRaterCategoryFraction}{p_{y,1}} \newcommand{\FirstRingTraceElement}{a} \newcommand{\FirstSummandStandardDeviation}{\sigma_a} \newcommand{\FirstTwinCriticReturnEstimate}{Q_{\phi_1}} \newcommand{\FittedSensitivity}{\lambda} \newcommand{\FixedClearanceAllowance}{\delta} \newcommand{\FlangeCameraTransform}{\mathbf{T}_{\text{flange}}^{\text{cam}}} \newcommand{\FlangePose}{\mathbf{T}_{\text{flange}}} \newcommand{\FlangeReferenceFrame}{\mathcal{F}_{\text{flange}}} \newcommand{\FlangeTargetTransform}{\mathbf{T}_{\text{flange}}^{\text{target}}} \newcommand{\FlattenedFilterWeights}{\mathbf{w}_{\text{col}}} \newcommand{\FleetAcceleratorCount}{N_{\text{fleet}}} \newcommand{\FleetCommunicationTaxonomyAxis}{C_2} \newcommand{\FleetComputeTaxonomyAxis}{C_1} \newcommand{\FleetCoordinationTaxonomyAxis}{C_3} \newcommand{\FleetEnergyProductivity}{\rho_{\text{energy}}} \newcommand{\FleetManufacturingDistribution}{\mathcal{M}} \newcommand{\FleetResourceCapacity}{C_{r}} \newcommand{\FleetRobotCount}{N_{\text{fleet}}} \newcommand{\FlippedFloatExponentField}{e'} \newcommand{\FloatEncodedNumber}{x} \newcommand{\FloatExponentField}{e} \newcommand{\FloatMantissaField}{m} \newcommand{\FloatSignBit}{s} \newcommand{\FloatingBaseAccelerations}{\ddot{\mathbf{q}}_b} \newcommand{\FloatingBaseBiasForces}{\mathbf{h}_b} \newcommand{\FloatingBaseInertiaBlock}{\mathbf{M}_{bb}} \newcommand{\FloatingBasePose}{\mathbf{q}_b} \newcommand{\FlopPrice}{c_{\text{FLOP}}} \newcommand{\FlowMatchingLoss}{\mathcal{L}_{\text{FM}}} \newcommand{\FlowProbabilityPath}{\rho} \newcommand{\FlowSampleVector}{\mathbf{y}} \newcommand{\FlowTimeCoordinate}{t} \newcommand{\FocalLength}{f} \newcommand{\FollowerForwardWave}{\mathbf{u}_s} \newcommand{\FollowerJointPositions}{\mathbf{q}_{\text{follower}}} \newcommand{\FollowerMechanicalLatency}{t_{\text{mech}}} \newcommand{\FollowerReturnWave}{\mathbf{w}_s} \newcommand{\ForceGuidedRelay}{K} \newcommand{\ForceReadingInnovation}{\nu} \newcommand{\ForceSensorBias}{b} \newcommand{\ForceSensorReading}{y} \newcommand{\ForegroundLatency}{L_{\text{lat,fg}}} \newcommand{\ForgetDataset}{D_{\text{forget}}} \newcommand{\ForkBoundarySet}{\mathcal{B}_{\text{fork}}} \newcommand{\ForkedTrajectoryTokenCount}{N_{\text{total}}} \newcommand{\FormatComplianceScore}{\Phi} \newcommand{\FormatEfficiency}{\eta_{\text{format}}} \newcommand{\FormatRewardWeight}{\lambda_{\text{fmt}}} \newcommand{\ForwardDiffusionDistribution}{q} \newcommand{\ForwardEulerEigenvalue}{\lambda_{\text{FE}}} \newcommand{\ForwardEulerTransitionMatrix}{\mathbf{A}_{\text{FE}}} \newcommand{\ForwardInvariantSafeSet}{\mathcal{C}} \newcommand{\ForwardKinematicsMap}{\mathbf{FK}} \newcommand{\ForwardOccupancySet}{\mathcal{R}} \newcommand{\ForwardPassTokenCount}{n} \newcommand{\ForwardPosteriorMean}{\tilde{\boldsymbol{\mu}}} \newcommand{\ForwardPosteriorVariance}{\tilde{\beta}} \newcommand{\FourthRingTraceElement}{d} \newcommand{\FrameBitCount}{B_{\text{frame}}} \newcommand{\FrameBlockingTime}{B} \newcommand{\FrameExposureStartTime}{t_{\text{start}}} \newcommand{\FrameIndex}{i} \newcommand{\FramePayloadSize}{B_{\text{payload}}} \newcommand{\FramePeriod}{T} \newcommand{\FrameReadoutTime}{t_{\text{readout}}} \newcommand{\FrameReleaseJitter}{J} \newcommand{\FrameResponseTime}{R} \newcommand{\FrameSerializationTime}{t_{\text{frame},i}} \newcommand{\FrameTransmissionTime}{C} \newcommand{\FrameWireBitCount}{B_{\text{wire},i}} \newcommand{\FreeConfigurationSpace}{\mathcal{C}_{\text{free}}} \newcommand{\FreeCreditCount}{N_{\text{free}}} \newcommand{\FreeSpaceDepth}{d_{\text{free}}} \newcommand{\FreeSpaceLogOddsIncrement}{L_{\text{free}}} \newcommand{\FreeSurfaceTiltAngle}{\theta_{\text{tilt}}} \newcommand{\FreeboardHeight}{h_{f}} \newcommand{\FreshEvidenceTime}{t_{\text{fresh}}} \newcommand{\FreshInputTokenCount}{S_{\text{fresh}}} \newcommand{\FreshnessObjective}{S_{\text{freshness}}} \newcommand{\FrictionCoefficientFloor}{\mu_{\min}} \newcommand{\FrictionPyramidMatrix}{\mathbf{F}} \newcommand{\FrobeniusNorm}{F} \newcommand{\FrozenBackboneFunction}{f} \newcommand{\FrozenFeatureEncoder}{f} \newcommand{\FrozenWeightMatrix}{\mathbf{W}_{\text{frozen}}} \newcommand{\FrustumFeature}{\mathbf{c}_{u, v, k}} \newcommand{\FullBatchLoss}{\mathcal{L}_B} \newcommand{\FullDatasetSize}{D_{\text{total}}} \newcommand{\FullPrecisionWeight}{w} \newcommand{\FullSnapshotWriteVolume}{D_{\text{vol,full}}} \newcommand{\FullSpeedTravelTime}{b} \newcommand{\FunctionInputAdjoint}{\bar{x}} \newcommand{\FunctionInputDimension}{N} \newcommand{\FunctionInputElement}{x} \newcommand{\FunctionInputTangent}{\dot{x}} \newcommand{\FunctionInputVariable}{x} \newcommand{\FunctionInputVector}{\mathbf{x}} \newcommand{\FunctionJacobian}{\mathbf{J}} \newcommand{\FunctionOutputDimension}{M} \newcommand{\FunctionOutputElement}{y} \newcommand{\FunctionOutputVariable}{z} \newcommand{\FunctionOutputVector}{\mathbf{y}} \newcommand{\FunctionSecondInputVariable}{y} \newcommand{\FundamentalMatrix}{\mathbf{F}} \newcommand{\FusedConvolutionBias}{\mathbf{b}_{\text{fused}}} \newcommand{\FusedConvolutionWeight}{\mathbf{W}_{\text{fused}}} \newcommand{\FusedTokenCount}{N_{\text{total}}} \newcommand{\FusionCandidate}{x_{\text{cand}}} \newcommand{\FusionInputList}{\mathcal{L}} \newcommand{\FusionInputRank}{r} \newcommand{\FusionInputTensor}{\mathbf{X}} \newcommand{\FusionIntermediateTensor}{\mathbf{Z}} \newcommand{\FusionOutputTensor}{\mathbf{Y}} \newcommand{\FutureControlTrajectory}{\mathbf{u}_{[t, \infty)}} \newcommand{\FutureTimeInstant}{t'} \newcommand{\GaeAdvantageEstimate}{\widehat{A}^{\text{GAE}}} \newcommand{\GateCurrent}{I_g} \newcommand{\GateDriverSkew}{t_{\text{prop, skew}}} \newcommand{\GatePropagationDelay}{t_{\text{prop}}} \newcommand{\GateSourceCapacitance}{C_{\text{gs}}} \newcommand{\GateSourceCharge}{Q_{\text{gs}}} \newcommand{\GateSourceVoltage}{V_{\text{gs}}} \newcommand{\GaussianCovarianceMatrix}{\boldsymbol{\Sigma}} \newcommand{\GaussianDistribution}{\mathcal{N}} \newcommand{\GaussianFirstAxisScale}{s_{x}} \newcommand{\GaussianMeanVector}{\boldsymbol{\mu}} \newcommand{\GaussianMechanismNoiseVector}{\mathbf{z}} \newcommand{\GaussianMechanismStandardDeviation}{\sigma_{\text{mech}}} \newcommand{\GaussianOpacityLogit}{o} \newcommand{\GaussianPrimitiveCovariance}{\boldsymbol{\Sigma}} \newcommand{\GaussianPrimitiveDensity}{G} \newcommand{\GaussianPrimitiveIndex}{i} \newcommand{\GaussianPrimitiveMean}{\boldsymbol{\mu}} \newcommand{\GaussianPrimitiveOpacity}{\alpha} \newcommand{\GaussianPrimitiveScaleMatrix}{\mathbf{S}} \newcommand{\GaussianSecondAxisScale}{s_{y}} \newcommand{\GaussianStandardDeviation}{\sigma} \newcommand{\GaussianThirdAxisScale}{s_{z}} \newcommand{\GaussianViewDependentColor}{c} \newcommand{\GearFaceWidth}{b} \newcommand{\GearModule}{m} \newcommand{\GearRatedFatigueLife}{L_{\text{gear}}} \newcommand{\GearReductionRatio}{N_{\text{gear}}} \newcommand{\GearTangentialLoad}{W_t} \newcommand{\GearToothBendingStress}{\sigma_b} \newcommand{\GearTorqueReversalCount}{n_{\text{gear}}} \newcommand{\GearboxTransmissionEfficiency}{\eta_{\text{gear}}} \newcommand{\GemmAccumulatorScale}{\beta} \newcommand{\GemmColumnDimension}{N} \newcommand{\GemmInnerDimension}{K} \newcommand{\GemmLeftOperand}{\mathbf{A}} \newcommand{\GemmLeftOperandElement}{A} \newcommand{\GemmLeftOperandEntry}{A_{ik}} \newcommand{\GemmOutputElement}{C} \newcommand{\GemmOutputEntry}{C_{ij}} \newcommand{\GemmOutputMatrix}{\mathbf{C}} \newcommand{\GemmProductScale}{\alpha} \newcommand{\GemmReductionIndex}{k} \newcommand{\GemmRightOperand}{\mathbf{B}} \newcommand{\GemmRightOperandElement}{B} \newcommand{\GemmRightOperandEntry}{B_{kj}} \newcommand{\GemmRowDimension}{M} \newcommand{\GemmTileColumnDimension}{N_{\text{tile}}} \newcommand{\GemmTileInnerDimension}{K_{\text{tile}}} \newcommand{\GemmTileRowDimension}{M_{\text{tile}}} \newcommand{\GemvArithmeticIntensity}{I_{\text{GEMV}}} \newcommand{\GeneralPurposeEnergyProductivity}{\rho_{\text{energy,general}}} \newcommand{\GeneralizedAccelerationLowerBound}{\ddot{\mathbf{q}}_{\min}} \newcommand{\GeneralizedAccelerationUpperBound}{\ddot{\mathbf{q}}_{\max}} \newcommand{\GeneralizedAccelerations}{\ddot{\mathbf{q}}} \newcommand{\GeneralizedBiasForces}{\mathbf{h}} \newcommand{\GeneralizedCoordinateCount}{n} \newcommand{\GeneralizedCoordinates}{\mathbf{q}} \newcommand{\GeneralizedInertiaMatrix}{\mathbf{M}} \newcommand{\GeneralizedParetoDistribution}{H} \newcommand{\GeneralizedParetoLikelihood}{L} \newcommand{\GeneralizedVelocities}{\dot{\mathbf{q}}} \newcommand{\GeneratedResponse}{y} \newcommand{\GeneratedSampleCount}{n} \newcommand{\GeneratedTokenCap}{N_{\text{cap}}} \newcommand{\GenerationStepErrorRate}{\lambda_{\text{error}}} \newcommand{\GenerativeActionModelDistribution}{p_\theta} \newcommand{\GeneratorLatentVector}{\mathbf{z}} \newcommand{\GenericRandomVariable}{X} \newcommand{\GeometricStateRepresentation}{\mathbf{Z}_{\text{geom}}} \newcommand{\GevLocationParameter}{\mu} \newcommand{\GevScaleParameter}{\sigma} \newcommand{\GlobalBatchGradient}{\mathbf{g}_{\text{global}}} \newcommand{\GlobalBatchSize}{B_{\text{global}}} \newcommand{\GlobalDeviationPenalty}{\mathcal{R}} \newcommand{\GlobalModelParameters}{\theta_{\text{global}}} \newcommand{\GoalConfiguration}{\mathbf{q}_{\text{goal}}} \newcommand{\GoalSet}{\mathcal{G}_{\text{goal}}} \newcommand{\GoodputRelativeTolerance}{\epsilon_{\mathcal{G}}} \newcommand{\GpdCumulativeDistribution}{F_{\text{GPD}}} \newcommand{\GpdScaleParameter}{\tilde{\sigma}} \newcommand{\GpuAvailability}{A_{\text{GPU}}} \newcommand{\GpuEnergy}{E_{\text{GPU}}} \newcommand{\GpuFailureRate}{\lambda_{\text{GPU}}} \newcommand{\GpuMttf}{\text{MTTF}_{\text{GPU}}} \newcommand{\GpuTopologicalDistance}{d} \newcommand{\GradientClippingNorm}{C} \newcommand{\GradientCovarianceMatrix}{\Sigma} \newcommand{\GradientElementCount}{d_{\text{grad}}} \newcommand{\GradientMemory}{M_{\text{gradients}}} \newcommand{\GradientPayload}{M_{\text{grad}}} \newcommand{\GradientStaleness}{\tau_{\text{stale}}} \newcommand{\GrantAllowedAccesses}{\mathcal{A}} \newcommand{\GrantCondition}{\phi_{\Gamma}} \newcommand{\GrantExpiryTime}{t_{\text{exp}}} \newcommand{\GrantIssueTime}{T} \newcommand{\GrantRights}{\mathcal{R}_{\Gamma}} \newcommand{\GraphEdgeSet}{E} \newcommand{\GraphNodeIndex}{i} \newcommand{\GraphNodeSet}{V} \newcommand{\GraspContactDisplacement}{\mathbf{d}} \newcommand{\GraspForceCeiling}{f_{\max}} \newcommand{\GraspForceFloor}{f_{\min}} \newcommand{\GraspMap}{\mathbf{G}} \newcommand{\GraspOrientation}{\mathbf{R}_{\text{grasp}}} \newcommand{\GraspPose}{\mathbf{T}_{\text{grasp}}} \newcommand{\GraspPosition}{\mathbf{p}_{\text{grasp}}} \newcommand{\GraspVerticalAcceleration}{a_z} \newcommand{\GravitationalTorqueVector}{\mathbf{g}} \newcommand{\Gravity}{g} \newcommand{\GravityCenterHeight}{h_{\text{cg}}} \newcommand{\GravityVector}{\mathbf{g}_0} \newcommand{\GridFeedCapacity}{P_{\text{grid}}} \newcommand{\GridSideCellCount}{N} \newcommand{\GripContactForce}{x} \newcommand{\GripperContactAngle}{\theta_{\text{contact}}} \newcommand{\GripperOpeningCommand}{a_{\text{gripper}}} \newcommand{\GroundPlaneAbscissa}{x} \newcommand{\GroundPlaneOrdinate}{y} \newcommand{\GroupCommitWaitTime}{L_{\text{lat}, i}} \newcommand{\GroupContrastProbability}{p_{\text{contrast}}} \newcommand{\GroupDisparity}{\Delta_g} \newcommand{\GroupMeanReward}{\mu_{R}} \newcommand{\GroupRelativeAdvantage}{\hat{A}} \newcommand{\GroupRewardStandardDeviation}{\sigma_{R}} \newcommand{\GroupRolloutIndex}{i} \newcommand{\GroupSize}{G} \newcommand{\GrpoSampledObjective}{\widehat{\mathcal{J}}_{\text{GRPO}}} \newcommand{\GuardBandDuration}{t_{\text{guard}}} \newcommand{\GuardedContactPredicate}{P_{\text{contact}}} \newcommand{\GuestImageMemory}{M_{\text{guest}}} \newcommand{\GuestKernelBootTime}{T_{\text{kernel}}} \newcommand{\HadamardRotationMatrix}{\mathbf{H}} \newcommand{\HalfPrecisionGemvIntensity}{I_{\text{GEMV, 16-bit}}} \newcommand{\HammingDataBitCount}{n} \newcommand{\HandForceCriterion}{F_h} \newcommand{\HandleAffordanceFrame}{\mathcal{F}_{\text{handle}}} \newcommand{\HandoffExceedanceProbability}{\epsilon} \newcommand{\HandoverTimeout}{T_{\text{timeout}}} \newcommand{\HandoverTimeoutCeiling}{T_{\text{config}}} \newcommand{\HandshakeProtocolLatency}{T_{\text{handshake}}} \newcommand{\HardwareCommonCauseRate}{\lambda_{\text{other}}} \newcommand{\HardwareParameterVector}{\boldsymbol{\xi}_{\text{real}}} \newcommand{\HardwareServiceLife}{T_{\text{lifetime}}} \newcommand{\HarmInclusiveTaskCost}{C_{\text{with\ harm}}} \newcommand{\HarmInstant}{t_{\text{harm}}} \newcommand{\HarmLeadTime}{t_{\text{harm}}} \newcommand{\HarmonicDriveTorsionalStiffness}{k_c} \newcommand{\HarmonicPeriodMultiple}{m} \newcommand{\HarnessConnectorResistance}{R_{\text{harness}}} \newcommand{\HashBucketCount}{N_{\text{buckets}}} \newcommand{\HashEntrySize}{s_{\text{entry}}} \newcommand{\HashRingServer}{s} \newcommand{\HashRingServerCount}{N} \newcommand{\HashRingServerSet}{\mathcal{S}_{\text{srv}}} \newcommand{\HashedGridMemory}{M_{\text{hashed}}} \newcommand{\HazardClassIndex}{h} \newcommand{\HazardOnset}{t_{\text{onset}}} \newcommand{\HazardOnsetBound}{t_{\text{bound}}} \newcommand{\HazardousProposalRate}{\lambda_{\text{proposal}, h}} \newcommand{\HazardousWorldState}{s_B} \newcommand{\HeadAxisLabel}{h} \newcommand{\HeadByteAllocation}{M_{\text{head}}} \newcommand{\HeadComponentIndex}{m} \newcommand{\HeadDimensionAxisLabel}{d} \newcommand{\HeadKeyProjectionMatrix}{\mathbf{W}_{K,i}} \newcommand{\HeadQueryProjectionMatrix}{\mathbf{W}_{Q,i}} \newcommand{\HeadSamplingProbability}{\theta} \newcommand{\HeadValuesProjectionMatrix}{\mathbf{W}_{V,i}} \newcommand{\HeadingAngle}{\theta_{\text{head}}} \newcommand{\HeadingCurvature}{\kappa} \newcommand{\HealthyStepTime}{T_{\text{healthy}}} \newcommand{\HeartbeatAge}{\Delta t_{\text{heartbeat}}} \newcommand{\HeartbeatInterval}{H} \newcommand{\HeartbeatReceiptTime}{t_{\text{local}}} \newcommand{\HeartbeatSequenceCounter}{k} \newcommand{\HeartbeatTimestamp}{t^{\text{hb}}} \newcommand{\HeatDissipationPower}{P_{\text{heat}}} \newcommand{\HermiteBasisFunction}{h} \newcommand{\HermiteInterpolationFraction}{\lambda} \newcommand{\HermiteSegmentProgress}{s} \newcommand{\HertzianContactCoefficient}{k_{c}} \newcommand{\HertzianContactStiffness}{k_H} \newcommand{\HiddenActivation}{\mathbf{h}} \newcommand{\HiddenActivationMatrix}{\mathbf{H}} \newcommand{\HiddenDimension}{d} \newcommand{\HiddenUnitOutput}{h} \newcommand{\HighOccupancyBinCount}{m} \newcommand{\HigherPriorityFrames}{hp} \newcommand{\HigherPriorityTasks}{hp} \newcommand{\HighestSignalFrequency}{f_{\max}} \newcommand{\HnswLayerIndex}{L} \newcommand{\HnswLevelDraw}{U} \newcommand{\HnswLevelNormalization}{m_\ell} \newcommand{\HnswMaximumConnectionCount}{M} \newcommand{\HnswSearchBeamWidth}{ef_{\text{search}}} \newcommand{\HoldingTorque}{\tau_{\text{hold}}} \newcommand{\HomogeneousCameraFramePoint}{\tilde{\mathbf{p}}_C} \newcommand{\HomogeneousPixelCoordinates}{\tilde{\mathbf{m}}} \newcommand{\HomogeneousPointCoordinates}{\tilde{\mathbf{p}}} \newcommand{\HomogeneousTransform}{\mathbf{T}_{AB}} \newcommand{\HomogeneousWorldFramePoint}{\tilde{\mathbf{p}}_W} \newcommand{\HomographyColumn}{\mathbf{h}} \newcommand{\HomographyColumnEntry}{h} \newcommand{\HomographyConstraintVector}{\mathbf{v}} \newcommand{\HomographyScaleFactor}{\lambda} \newcommand{\HomomorphicCiphertext}{c} \newcommand{\HomomorphicFunction}{f} \newcommand{\HomomorphicPublicKey}{pk} \newcommand{\HomomorphicSecretKey}{sk} \newcommand{\HorizonStepIndex}{k} \newcommand{\HorizontalFocalLength}{f_x} \newcommand{\HostArrivalTimestamp}{t_{\text{host}}} \newcommand{\HostHeartbeatRate}{f_{\text{heartbeat}}} \newcommand{\HostLinkBandwidth}{\text{BW}_{\text{link}}} \newcommand{\HostPower}{P_{\text{host}}} \newcommand{\HostPreparationTime}{T_{\text{prep}}} \newcommand{\HostRuntimeCount}{N_{\text{host}}} \newcommand{\HostSoftwareTime}{T_{\text{sw}}} \newcommand{\HostTransferBandwidth}{\text{BW}_{\text{host}}} \newcommand{\HotTierHitProbability}{h} \newcommand{\HotTierServiceTime}{T_{\text{hot}}} \newcommand{\HourlyAccountQueryCount}{q_{\text{hourly}}} \newcommand{\HourlyComponentFailureRate}{\lambda_{\text{hour}}} \newcommand{\HuberLossThreshold}{\delta} \newcommand{\HullQueryTime}{t_{\text{query}}} \newcommand{\HullSphereRadius}{r_{\text{hull}}} \newcommand{\HumanCommandRate}{\dot{\mathbf{u}}_{\text{human}}} \newcommand{\HumanControlCommand}{\mathbf{u}_{\text{human}}} \newcommand{\HumanFallbackCost}{C_{h}} \newcommand{\HumanReactionTime}{T_{\text{human}}} \newcommand{\HumanResolutionProbability}{h} \newcommand{\HumanReviewCost}{C_{\text{human}}} \newcommand{\HumanStandaloneSensitivity}{S_{\text{human}}} \newcommand{\HumanWalkingSpeedBound}{v_h} \newcommand{\HybridIterationTime}{T_{\text{step}}} \newcommand{\HydraulicSupplyPressure}{p} \newcommand{\HypothesisIndex}{h} \newcommand{\HypothesisTestFalseNegativeRate}{\beta_{\text{stat}}} \newcommand{\HypothesisTestSignificanceLevel}{\alpha_{\text{sig}}} \newcommand{\HypothesizedAcceptanceProbability}{p} \newcommand{\HypothesizedTrialFailureProbability}{p} \newcommand{\IdealAcceleratorTime}{T_{\text{ideal}}} \newcommand{\IdealMemoryQueueDelay}{t_{\text{queue,ideal}}} \newcommand{\IdempotentAlgebraElement}{x} \newcommand{\IdentityMatrix}{\mathbf{I}} \newcommand{\IllustrativeFunction}{f} \newcommand{\ImageChannelCount}{C} \newcommand{\ImageChannelIndex}{c} \newcommand{\ImageColumnIndex}{w} \newcommand{\ImageEpipole}{\mathbf{e}} \newcommand{\ImageHeight}{H} \newcommand{\ImagePlanePixelCoordinates}{\mathbf{u}_{\text{px}}} \newcommand{\ImageRowIndex}{h} \newcommand{\ImageTensorElement}{X} \newcommand{\ImageWidth}{W} \newcommand{\ImaginaryUnit}{j} \newcommand{\ImitationLearnedPolicy}{\hat{\pi}} \newcommand{\ImitationTargetCommand}{\mathbf{u}_{\text{target}}} \newcommand{\ImmediateTaskCostScore}{C} \newcommand{\ImpactInstant}{T} \newcommand{\ImpactRiseTime}{t_{\text{rise}}} \newcommand{\ImpactSpeed}{v_{\text{impact}}} \newcommand{\ImpedanceControlledPosition}{x} \newcommand{\ImpedanceControlledVelocity}{\dot{x}} \newcommand{\ImpedanceEquilibriumPosition}{x_{\text{des}}} \newcommand{\ImpedanceEquilibriumVelocity}{\dot{x}_{\text{des}}} \newcommand{\ImpedanceRestoringForce}{F} \newcommand{\ImplicitPolicyEnergyFunction}{E_\theta} \newcommand{\ImportanceProposalDistribution}{q} \newcommand{\ImportanceSampledFailureProbability}{\hat{p}_F} \newcommand{\ImuSampleTime}{t_{\text{IMU}}} \newcommand{\InContactViableSet}{\mathcal{C}_{\text{contact}}} \newcommand{\IncidenceAngle}{\theta_{\text{inc}}} \newcommand{\IncidentOpticalPower}{P_{\text{opt}}} \newcommand{\IncomingChannelCommand}{u_{\text{new}}} \newcommand{\IncomingCommandDerivative}{\dot{u}_{\text{new}}} \newcommand{\IncorrectCandidateTrialPassProbability}{p_{b}} \newcommand{\IncrementalSnapshotWriteVolume}{D_{\text{vol,delta}}} \newcommand{\IncumbentControlCommand}{\mathbf{u}^{\text{incumbent}}} \newcommand{\IncumbentInterventionRate}{\lambda_{\text{incumbent}}} \newcommand{\IncumbentTrackingErrorStandardDeviation}{\sigma_{\text{incumbent}}} \newcommand{\IndependentAttemptCount}{k} \newcommand{\IndependentEventProbability}{p} \newcommand{\IndependentSampleRate}{f} \newcommand{\IndexGraphNodeSet}{V} \newcommand{\IndexedDocumentCount}{N} \newcommand{\IndicatorFunction}{\mathbb{I}} \newcommand{\InducedGateVoltage}{V_{\text{gs,induced}}} \newcommand{\InductiveVoltage}{v} \newcommand{\InequalityConstraintFunction}{g} \newcommand{\InertiaMatchingRatio}{N^*} \newcommand{\InertiaMatrixDerivative}{\dot{\mathbf{M}}} \newcommand{\InertialIntegrationTime}{T} \newcommand{\InferenceActiveTime}{t_{\text{inference}}} \newcommand{\InferenceCost}{C_{\text{infer}}} \newcommand{\InferenceDutyCycle}{\alpha_{\text{duty}}} \newcommand{\InferenceEnergy}{E_{\text{inf}}} \newcommand{\InferenceLatency}{L_{\text{lat,infer}}} \newcommand{\InferenceLoadSocPower}{P_{\text{load}}} \newcommand{\InflatedHullRadius}{r_{\text{inflated}}} \newcommand{\InflightRolloutReservation}{M_{\text{inflight}}} \newcommand{\InfluenceFunction}{I} \newcommand{\InformationTechnologyEnergy}{E_{\text{IT}}} \newcommand{\InformationTechnologyHeatLoad}{\dot{Q}_{\text{IT}}} \newcommand{\InformationTechnologyPower}{P_{\text{IT}}} \newcommand{\InformativeTaskFraction}{p_{\text{inform}}} \newcommand{\IngestionPricePerSample}{C_{\text{ingest/sample}}} \newcommand{\InitialAccuracy}{\text{Accuracy}_0} \newcommand{\InitialBusVoltage}{V_{\text{initial}}} \newcommand{\InitialPositionStandardDeviation}{\sigma_{p,0}} \newcommand{\InitialPositionVelocityCovariance}{\sigma_{pv,0}} \newcommand{\InitialProposalDistribution}{q_{\boldsymbol{\psi}_0}} \newcommand{\InitialStateDistribution}{\rho_0} \newcommand{\InitialTrackingError}{e_0} \newcommand{\InitialVelocityStandardDeviation}{\sigma_{v,0}} \newcommand{\InitiatedTasks}{N} \newcommand{\InjectionBandwidth}{\text{BW}_{\text{inject}}} \newcommand{\InjectionTriggerEpoch}{t_{\text{inject}}} \newcommand{\InnerChainTransform}{\mathbf{T}_{BC}} \newcommand{\InnerLayerFunction}{g} \newcommand{\InnerProductLeftComponent}{a} \newcommand{\InnerProductLeftVector}{\mathbf{a}} \newcommand{\InnerProductRightComponent}{v} \newcommand{\InnerProductRightVector}{\mathbf{b}} \newcommand{\InnovationBias}{b} \newcommand{\InnovationCovariance}{\mathbf{S}} \newcommand{\InnovationVariance}{S} \newcommand{\InputCaptureTime}{T_{\text{capture}}} \newcommand{\InputChannelCount}{C_{\text{in}}} \newcommand{\InputChannelIndex}{c} \newcommand{\InputColumnLieDerivativeOperator}{L_{\mathbf{g}_j}} \newcommand{\InputConsumerAcceleratorCount}{N_{\text{GPU}}} \newcommand{\InputCoordinateCount}{d} \newcommand{\InputDistribution}{p(x)} \newcommand{\InputEventRate}{r_{\text{event}}} \newcommand{\InputFeatureIndex}{i} \newcommand{\InputFeatureVector}{\mathbf{x}} \newcommand{\InputLieDerivativeOperator}{L_{\mathbf{g}}} \newcommand{\InputNodePrimal}{v_{i-N}} \newcommand{\InputPipelineRate}{R_{\text{pipeline}}} \newcommand{\InputPipelineRatio}{r_{\text{pipe}}} \newcommand{\InputPipelineServiceRate}{r_{\text{pipeline}}} \newcommand{\InputPipelineStageIndex}{j} \newcommand{\InputQuantizationScale}{s_X} \newcommand{\InputResolution}{r} \newcommand{\InputStageServiceRate}{r} \newcommand{\InputTokenPrice}{c_{\text{in}}} \newcommand{\InputTokenSequence}{x_{1:S}} \newcommand{\InputVariableIndex}{m} \newcommand{\InsetAvailableBrakingDistance}{D_{\text{avail}}} \newcommand{\InstanceReplenishTime}{T_{\text{init}}} \newcommand{\InstantaneousPhaseCurrent}{i_{\text{phase}}} \newcommand{\InstantaneousRequestOccupancy}{Q} \newcommand{\IntegerWeightCode}{q} \newcommand{\IntegralControlEffort}{\mathbf{u}_{\text{int}}} \newcommand{\IntegralGainMatrix}{\mathbf{K}_{i}} \newcommand{\IntegratedPixelResponse}{I_{\text{pixel}}} \newcommand{\IntegrationCandidateCommitHash}{h_{\text{candidate}}} \newcommand{\IntegrationDummyTime}{t'} \newcommand{\IntegrationHeadCommitHash}{h_{\text{head}}} \newcommand{\IntegrationPoint}{\mathbf{y}} \newcommand{\IntegrationPointCoordinate}{y} \newcommand{\IntegrationTimeInstant}{s} \newcommand{\IntegratorState}{\mathbf{z}} \newcommand{\IntegratorStateRate}{\dot{\mathbf{z}}} \newcommand{\IntegratorUnwindDelay}{T_{\text{unwind}}} \newcommand{\IntegrityProvenance}{\iota} \newcommand{\IntegrityTrustLabel}{\iota} \newcommand{\IntentAcknowledgmentEvent}{e_{\text{flush}}} \newcommand{\IntentAdministrativeLease}{T_{\text{admin}}} \newcommand{\IntentDemonstrationDataset}{\mathcal{D}_{\text{intent}}} \newcommand{\IntentLease}{\mathcal{I}_{\text{intent}}} \newcommand{\IntentLeaseExpiry}{t_{\text{intent\_exp}}} \newcommand{\IntentProposalPeriod}{T_{\text{period}}} \newcommand{\InterAnnotatorAgreement}{\kappa} \newcommand{\InterFeedInterval}{T_{\text{feed}}} \newcommand{\InterGroupColumnDelay}{t_{\text{CCD\_S}}} \newcommand{\InterKernelGapTime}{T_{\text{gap}}} \newcommand{\InterNodeContextParallelDegree}{c_{\text{inter}}} \newcommand{\InterQueryIntervalDeviation}{\sigma_{\text{inter-query}}} \newcommand{\InterSensorClockSkew}{\Delta t_{\text{skew}}} \newcommand{\InteractionHistory}{h} \newcommand{\InteractionPortForce}{F} \newcommand{\InteractionPortVelocity}{v} \newcommand{\InterarrivalVariationCoefficient}{c_{a}} \newcommand{\InterfaceMaterialThermalResistance}{R_{\text{th,TIM}}} \newcommand{\InterferenceSlowdownFactor}{r_{\text{slow}}} \newcommand{\InterframeSpacingTime}{t_{\text{interframe},i}} \newcommand{\InterleavedPipelineBubbleFraction}{b_{\text{interleaved}}} \newcommand{\IntermediateTensorSize}{M_{\text{tensor}}} \newcommand{\InternalDissipationPower}{g} \newcommand{\IntervalCompletionTime}{T_{\text{total}}} \newcommand{\IntervalMean}{\bar{T}} \newcommand{\IntervalMeanOccupancy}{\bar{Q}} \newcommand{\IntervalNormalQuantile}{z} \newcommand{\IntervalStandardDeviation}{\sigma} \newcommand{\IntervalTransitionMatrix}{\boldsymbol{\Phi}} \newcommand{\IntervalVariationCoefficient}{c} \newcommand{\InterventionDensity}{D_{\text{int}}} \newcommand{\InterventionRate}{\lambda_{\text{int}}} \newcommand{\InterventionWindowDuration}{W} \newcommand{\IntraClusterCorrelation}{\rho_{\text{ICC}}} \newcommand{\IntraGroupColumnDelay}{t_{\text{CCD\_L}}} \newcommand{\IntraNodeContextParallelDegree}{c_{\text{intra}}} \newcommand{\IntrusionDistance}{C} \newcommand{\IntrusionDistanceAllowance}{C} \newcommand{\InvalidatedArtifactNode}{v} \newcommand{\InverseDepth}{\rho} \newcommand{\InverseDepthLandmarkParameters}{\mathbf{y}} \newcommand{\InverseKinematicsDamping}{\lambda} \newcommand{\InverseSensorLogOdds}{L_{\text{sensor}}} \newcommand{\InverterCurrentLimit}{I_{\max}} \newcommand{\InverterDeadTime}{t_{\text{dead}}} \newcommand{\IoTransferTime}{T_{\text{IO}}} \newcommand{\IronCaseThermalResistance}{R_{\text{th,iron-case}}} \newcommand{\IronLawComputeTime}{T_{\text{compute}}} \newcommand{\IronLawMemoryTime}{T_{\text{memory}}} \newcommand{\IronLossPower}{P_{\text{iron}}} \newcommand{\IronThermalCapacitance}{C_{\text{iron}}} \newcommand{\IrreducibleLoss}{C_{\mathcal{L}}} \newcommand{\IsolatedEnforcerExecutionTime}{t_{\text{iso}}} \newcommand{\IsolatedJobRunTime}{T} \newcommand{\IspProcessingTime}{t_{\text{ISP}}} \newcommand{\IsrExecutionTime}{t_{\text{ISR}}} \newcommand{\IterationCost}{C_{\text{iter}}} \newcommand{\IterationTokenBudget}{N_{\text{budget}}} \newcommand{\JaccardSimilarity}{J} \newcommand{\JacobianLeftSingularMatrix}{\mathbf{U}} \newcommand{\JacobianLeftSingularVector}{\mathbf{u}} \newcommand{\JacobianPseudoinverse}{\mathbf{J}^\dagger} \newcommand{\JacobianRightSingularMatrix}{\mathbf{V}} \newcommand{\JacobianRightSingularVector}{\mathbf{v}} \newcommand{\JacobianSingularNumber}{\sigma} \newcommand{\JacobianSingularNumberMatrix}{\boldsymbol{\Sigma}} \newcommand{\JawAperture}{w_{\text{aperture}}} \newcommand{\JensenShannonDivergence}{\mathcal{D}_{\text{JS}}} \newcommand{\JensenShannonMixtureDistribution}{\bar{P}} \newcommand{\JerkLimit}{j_{\max}} \newcommand{\JerkWeightMatrix}{\mathbf{W}_j} \newcommand{\JitterBufferPlayoutDelay}{T_{\text{buf}}} \newcommand{\JobAbsoluteDeadline}{d} \newcommand{\JobAvailability}{A_{\text{all}}} \newcommand{\JobDuration}{T_{\text{job}}} \newcommand{\JobIndex}{j} \newcommand{\JobQueueWaitTime}{W} \newcommand{\JobReleaseTime}{r} \newcommand{\JobRestartTime}{T_{\text{restart}}} \newcommand{\JobSlowdown}{S} \newcommand{\JobStartupTime}{T_{\text{startup}}} \newcommand{\JointAcceleration}{\ddot{q}} \newcommand{\JointAngle}{\theta_{\text{joint}}} \newcommand{\JointAngleLowerLimit}{q_{\min}} \newcommand{\JointAngleUpperLimit}{q_{\max}} \newcommand{\JointAngularAcceleration}{\dot{\omega}} \newcommand{\JointAngularRate}{\omega} \newcommand{\JointAngularSpeed}{\omega} \newcommand{\JointBaseInertiaCoupling}{\mathbf{M}_{jb}} \newcommand{\JointBiasTorque}{\tau_{\text{bias}}} \newcommand{\JointCoordinate}{q} \newcommand{\JointCount}{n} \newcommand{\JointFrictionTorque}{\tau_{\text{fric}}} \newcommand{\JointIndex}{i} \newcommand{\JointJerk}{j_{\text{joint}}} \newcommand{\JointLoadTorque}{\tau_{\text{load}}} \newcommand{\JointOutputImpedance}{Z_{\text{out}}} \newcommand{\JointOutputTorque}{\tau_{\text{out}}} \newcommand{\JointPathCurvature}{\mathbf{q}''} \newcommand{\JointPathTangent}{\mathbf{q}'} \newcommand{\JointPosition}{q} \newcommand{\JointPositionLowerLimit}{\mathbf{q}_{\min}} \newcommand{\JointPositionSetpoint}{\mathbf{q}^*} \newcommand{\JointPositionTarget}{q_{\text{des}}} \newcommand{\JointPositionUpperLimit}{\mathbf{q}_{\max}} \newcommand{\JointReflectedRotorInertia}{J_{m}} \newcommand{\JointSampleTimestamp}{t_{\text{joint}}} \newcommand{\JointTorque}{\boldsymbol{\tau}} \newcommand{\JointTorqueConstant}{K_t} \newcommand{\JointTorqueLimit}{\tau_{\max}} \newcommand{\JointTorqueLimits}{\boldsymbol{\tau}_{\max}} \newcommand{\JointTorqueLowerLimit}{\boldsymbol{\tau}_{\min}} \newcommand{\JointTorqueSlew}{\dot{\boldsymbol{\tau}}} \newcommand{\JointTorqueSlewLimit}{\dot{\boldsymbol{\tau}}_{\max}} \newcommand{\JointTorqueTarget}{\tau_{\text{des}}} \newcommand{\JointTorqueUpperLimit}{\boldsymbol{\tau}_{\max}} \newcommand{\JointTorsionalStiffnessMatrix}{\mathbf{K}} \newcommand{\JointTrackingError}{\mathbf{e}} \newcommand{\JointVelocity}{\dot{q}} \newcommand{\JointVelocityCeiling}{\dot{q}_{\max}} \newcommand{\JointVelocityLimit}{\dot{\mathbf{q}}_{\max}} \newcommand{\JointVelocitySetpoint}{\dot{\mathbf{q}}^*} \newcommand{\JointVelocityTarget}{\dot{q}_{\text{des}}} \newcommand{\JouleanTemperatureRise}{\Delta T} \newcommand{\JunctionAmbientThermalResistance}{R_{\text{th,JA}}} \newcommand{\JunctionCaseThermalResistance}{R_{\text{th,JC}}} \newcommand{\JunctionTemperature}{T_{\text{j}}} \newcommand{\KalmanBucyObserverGain}{\mathbf{L}} \newcommand{\KalmanGain}{\mathbf{G}} \newcommand{\KeepContextPathCost}{C_{\text{keep}}} \newcommand{\KendallMarkovianCode}{M} \newcommand{\KernelActiveTime}{T_{\text{compute}}} \newcommand{\KernelColumnOffset}{n} \newcommand{\KernelExecutionTime}{T_{\text{kernel}}} \newcommand{\KernelHeight}{K_h} \newcommand{\KernelHorizontalLoopOffset}{k_{x}} \newcommand{\KernelRowOffset}{m} \newcommand{\KernelSize}{K} \newcommand{\KernelVerticalLoopOffset}{k_{y}} \newcommand{\KernelWeight}{W} \newcommand{\KernelWidth}{K_w} \newcommand{\KeyAxisLabel}{j} \newcommand{\KeyBufferPosition}{j} \newcommand{\KeyComponent}{k_{jm}} \newcommand{\KeyLeftSingularMatrix}{\mathbf{U}} \newcommand{\KeyLeftSingularVector}{\mathbf{u}} \newcommand{\KeyProjectionMatrix}{\mathbf{W}_{K}} \newcommand{\KeyRightSingularMatrix}{\mathbf{V}} \newcommand{\KeyRightSingularVector}{\mathbf{v}} \newcommand{\KeySingularNumber}{\sigma} \newcommand{\KeySingularSpectrumMatrix}{\mathbf{\Sigma}} \newcommand{\KeySourceMatrix}{\mathbf{X}_{K}} \newcommand{\KeySpectrumLength}{q} \newcommand{\KeyVector}{\mathbf{k}} \newcommand{\KineticEnergy}{E_k} \newcommand{\KineticEnergyCeiling}{E_{\max}} \newcommand{\KineticInsetBarrierFunction}{h_{\text{kinetic}}} \newcommand{\KineticInsetBarrierRate}{\dot{h}_{\text{kinetic}}} \newcommand{\KlDivergence}{\mathcal{D}_{\text{KL}}} \newcommand{\KlPenaltyCoefficient}{\beta_{\text{KL}}} \newcommand{\KlSampleStatistic}{d} \newcommand{\KnownComponentStopDistance}{d_{\text{budget}}} \newcommand{\KolmogorovSmirnovCriticalThreshold}{c_{\text{crit}}} \newcommand{\KolmogorovSmirnovStatistic}{\mathcal{D}_{\text{KS}}} \newcommand{\KroneckerIndicator}{\delta} \newcommand{\KrumClientCount}{n} \newcommand{\KrylovSubspace}{\mathcal{K}} \newcommand{\KsCriticalCoefficient}{c} \newcommand{\KvBlockSize}{S_{\text{blk}}} \newcommand{\KvBlockTailWaste}{\Delta_{\text{tail}}} \newcommand{\KvCacheBytesPerToken}{m_{\text{token}}} \newcommand{\KvCacheHandoffTime}{T_{\text{handoff}}} \newcommand{\KvCacheMemory}{M_{\text{KV}}} \newcommand{\KvElementStorageSize}{s_{\text{elem,KV}}} \newcommand{\KvHeadCount}{H_{\text{KV}}} \newcommand{\KvPoolHeadroomFraction}{f_{\text{head}}} \newcommand{\KvPoolMemory}{M_{\text{pool}}} \newcommand{\KvRecomputeTime}{T_{\text{recompute}}} \newcommand{\KvReloadTime}{T_{\text{reload}}} \newcommand{\KvTileCount}{T_c} \newcommand{\KvTileIndex}{j} \newcommand{\KvTileSize}{B_c} \newcommand{\LaSalleInvariantSet}{\Omega} \newcommand{\LabelCategoryIndex}{i} \newcommand{\LabelVector}{\mathbf{y}} \newcommand{\LabeledRecord}{x} \newcommand{\LabeledSampleCount}{D_{\text{labeled}}} \newcommand{\LabelingRoundIndex}{k} \newcommand{\LaggedModelInput}{x_{t-\Delta}} \newcommand{\LaggedStateDigest}{h_{\text{state},t-k}} \newcommand{\LandmarkDepth}{d} \newcommand{\LanguageInstruction}{c_{\text{instr}}} \newcommand{\LanguageSkillPrior}{p_{\text{LLM}}} \newcommand{\LaplaceLikelihoodScale}{b} \newcommand{\LaplaceNoiseSample}{x} \newcommand{\LaplaceNoiseScale}{b} \newcommand{\LaplaceVariable}{s} \newcommand{\LargestDrivenWheelLoadShare}{\varphi} \newcommand{\LargestEigenvalue}{\lambda_{\max}} \newcommand{\LargestInvariantSet}{\mathcal{M}} \newcommand{\LargestSingularNumber}{\sigma_{\max}} \newcommand{\LarsGlobalLearningRate}{\eta_{\text{global}}} \newcommand{\LastCandidateEmbeddingVector}{\mathbf{x}_N} \newcommand{\LastFunctionInputComponent}{x_N} \newcommand{\LastMeasurementTime}{t_{\text{last}}} \newcommand{\LastRankComputeTime}{T_{\text{rank}_{N-1}}} \newcommand{\LatchApproachSpeed}{v_{\text{latch}}} \newcommand{\LatchClearance}{c} \newcommand{\LatchContactForce}{f} \newcommand{\LatchForceLimit}{F_{\text{lim}}} \newcommand{\LatchPlateStiffness}{k_{\text{latch}}} \newcommand{\LatchStallForce}{F} \newcommand{\LatchStrengthFloor}{F_{\text{floor}}} \newcommand{\LateHandoffProbability}{p} \newcommand{\Latency}{L_{\text{lat}}} \newcommand{\LatencyBandwidthCrossoverSize}{n^*} \newcommand{\LatencyBoundedBatchSize}{B_{\text{SLO}}} \newcommand{\LatencyObjective}{S_{\text{latency}}} \newcommand{\LatencyQuantileFunction}{Q_p} \newcommand{\LatencyRewardExponent}{\beta_{\text{lat}}} \newcommand{\LatencySlo}{L_{\text{lat,SLO}}} \newcommand{\LatentActionComponent}{u} \newcommand{\LatentComponentMean}{\mu_{\phi, j}} \newcommand{\LatentComponentStandardDeviation}{\sigma_{\phi, j}} \newcommand{\LatentDimension}{d_z} \newcommand{\LatentGaussianPolicyDensity}{\mu} \newcommand{\LatentKlWeight}{\beta} \newcommand{\LatentPosteriorDistribution}{q} \newcommand{\LatentPosteriorMean}{\boldsymbol{\mu}_\phi} \newcommand{\LatentPosteriorStandardDeviation}{\boldsymbol{\sigma}_\phi} \newcommand{\LatentStateEncoder}{q_\phi} \newcommand{\LatentStyleVariable}{\mathbf{z}} \newcommand{\LatentVariableSpace}{\mathcal{Z}} \newcommand{\LaterBaseFlangeTransform}{\mathbf{T}_{\text{base}, k+1}^{\text{flange}}} \newcommand{\LaterCameraTargetTransform}{\mathbf{T}_{\text{cam}, k+1}^{\text{target}}} \newcommand{\LaterRolloutTurnIndex}{j} \newcommand{\LaterStepIndex}{j} \newcommand{\LateralClearance}{W_{\text{clear}}} \newcommand{\LatestSequentialObservation}{X_m} \newcommand{\LayerAllReduceTime}{T_{\text{layer comm}}} \newcommand{\LayerBackwardTime}{T_{\text{layer backward}}} \newcommand{\LayerCount}{N_L} \newcommand{\LayerExposedCommunicationTime}{T_{\text{exposed}}} \newcommand{\LayerFunction}{f} \newcommand{\LayerIndex}{\ell} \newcommand{\LayerInputComponent}{x} \newcommand{\LayerInputMatrix}{\mathbf{X}} \newcommand{\LayerInputVector}{\mathbf{x}} \newcommand{\LayerInputWidth}{d_{\text{in}}} \newcommand{\LayerIntermediateStateMemory}{s_{\ell}} \newcommand{\LayerNonlinearity}{\phi} \newcommand{\LayerNormMean}{\mu_{\text{LN}}} \newcommand{\LayerNormStandardDeviation}{\sigma_{\text{LN}}} \newcommand{\LayerOutputMatrix}{\mathbf{Y}} \newcommand{\LayerOutputVector}{\mathbf{y}} \newcommand{\LayerOutputWidth}{d_{\text{out}}} \newcommand{\LayerParameterPayload}{M_{\text{layer}}} \newcommand{\LayerSavedTensorCount}{n_{\text{saved}}} \newcommand{\LayerSelectionIndex}{i} \newcommand{\LayerWeightEntry}{W} \newcommand{\LayerWeights}{\mathbf{w}} \newcommand{\LayerWidth}{n} \newcommand{\LcResonantFrequency}{f_0} \newcommand{\LeaderForwardWave}{\mathbf{u}_m} \newcommand{\LeaderJointPositions}{\mathbf{q}_{\text{leader}}} \newcommand{\LeaderPortEffort}{\mathbf{F}_m} \newcommand{\LeaderPortFlow}{\dot{\mathbf{x}}_m} \newcommand{\LeaderPortPower}{P_m} \newcommand{\LeaderReturnWave}{\mathbf{w}_m} \newcommand{\LeaderWristRollAngle}{\theta_{\text{roll}}} \newcommand{\LeadingSupportDistance}{d_{\text{lead}}} \newcommand{\LeakageCurrent}{I_{\text{leak}}} \newcommand{\LeakagePower}{P_{\text{leakage}}} \newcommand{\LearnedActionProposal}{\hat{\mathbf{a}}_{\text{learned}}} \newcommand{\LearnedNominalTrajectory}{\hat{\mathbf{q}}_{\text{learned}}} \newcommand{\LearnedRemainingReturnEstimate}{\widehat{V}} \newcommand{\LearnedVelocityField}{v_\theta} \newcommand{\LearnerStateDisagreementRate}{\epsilon_\pi} \newcommand{\LearnerStateVisitationDistribution}{p^{\pi}} \newcommand{\LearningCurveSampleCount}{n} \newcommand{\LearningRate}{\eta} \newcommand{\LeaseAdmissionInstant}{t_{\text{adm}}} \newcommand{\LeaseDirtyMemory}{M_{\text{dirty}}} \newcommand{\LeaseExpiryDelaySubtotal}{\tau_{\text{delay,sub}}} \newcommand{\LeaseHoldTime}{T_{\text{hold}}} \newcommand{\LeasePathTravel}{d_{\text{lease}}} \newcommand{\LeaseRefreshInstant}{t_{\text{refresh}}} \newcommand{\LeftEvasionAction}{\mathbf{a}_{\text{left}}} \newcommand{\LeftSingularVectorMatrix}{\mathbf{P}} \newcommand{\LengthPenaltyWeight}{\lambda_{\text{len}}} \newcommand{\LeverArmLength}{r_{\text{arm}}} \newcommand{\LeverArmSweepError}{e_{\text{rot}}} \newcommand{\LewisFormFactor}{Y} \newcommand{\LexicalDocument}{x} \newcommand{\LexicalFrequencySaturation}{k_1} \newcommand{\LexicalLengthNormalization}{b} \newcommand{\LexicalQuery}{Q} \newcommand{\LidarAzimuthAngle}{\theta_{\text{az}}} \newcommand{\LidarBeamDirection}{\mathbf{d}} \newcommand{\LidarElevationAngle}{\phi} \newcommand{\LidarFramePoint}{\mathbf{p}_{\text{lidar}}} \newcommand{\LidarReferenceFrame}{\mathcal{F}_{\text{lidar}}} \newcommand{\LidarScanRate}{f_{\text{scan}}} \newcommand{\LidarSweepPeriod}{T_{\text{sweep}}} \newcommand{\LidarSweepStartTime}{t_{\text{sweep}}} \newcommand{\LieDerivativeAlongControl}{L_{\mathbf{g}} h} \newcommand{\LieDerivativeAlongDrift}{L_{\mathbf{f}} h} \newcommand{\LieDerivativeOrder}{k} \newcommand{\LikelihoodRatioWeight}{w} \newcommand{\LimitMarginFunction}{M} \newcommand{\LinearAcceleration}{\mathbf{a}} \newcommand{\LinearBarrierDecayRate}{\gamma_{\text{cbf}}} \newcommand{\LinearMomentum}{p} \newcommand{\LinearizedVirtualInput}{\mathbf{v}} \newcommand{\LinkAngularAcceleration}{\ddot{\theta}_{\text{link}}} \newcommand{\LinkBandwidth}{\beta} \newcommand{\LinkBitRate}{R_{\text{link}}} \newcommand{\LinkLength}{l} \newcommand{\LinkOutputPosition}{q_{\text{out}}} \newcommand{\LintFalseAcceptFraction}{\phi} \newcommand{\LipschitzConstant}{K} \newcommand{\LiveAutomatonStateSet}{Q_{\text{live}}} \newcommand{\LoadCurrent}{I_{\text{load}}} \newcommand{\LoadInertia}{J_{\text{load}}} \newcommand{\LoadStepCurrentDeficit}{\Delta I_{\text{step}}} \newcommand{\LoadStepDeficitDuration}{\Delta t_{\text{step}}} \newcommand{\LoadedEnforcerExecutionTime}{t_{\text{enf}}} \newcommand{\LoadedJunctionTemperature}{T_{\text{load}}} \newcommand{\LocalBatchSize}{B_{\text{local}}} \newcommand{\LocalEpochCount}{E} \newcommand{\LocalGradient}{\mathbf{g}} \newcommand{\LocalInferenceEnergy}{E_{\text{local}}} \newcommand{\LocalPathTime}{T_{\text{local}}} \newcommand{\LocalRankIndex}{i} \newcommand{\LocalTokenCount}{B_{\text{tok}}} \newcommand{\LocalUpdateCount}{H_{\text{local}}} \newcommand{\LocalityPenaltyFunction}{w} \newcommand{\LocalizationBound}{\delta_{\text{loc}}} \newcommand{\LogFailureRatio}{s_{\text{fail}}} \newcommand{\LogOddsLowerClamp}{L_{\min}} \newcommand{\LogOddsUpperClamp}{L_{\max}} \newcommand{\LogPositionIndex}{j} \newcommand{\LoggedEvent}{e} \newcommand{\LoggedEventPrefix}{\mathbf{e}_{1:j}} \newcommand{\LoggpLongMessageTime}{T_{\text{long}}} \newcommand{\LogisticProbability}{p_{\text{sig}}} \newcommand{\LogitMask}{\mathbf{M}} \newcommand{\LogitMaskEntry}{M} \newcommand{\LogitStorageSize}{s_{\text{logit}}} \newcommand{\LogitVector}{\mathbf{z}} \newcommand{\LogpNetworkLatency}{L_{\text{LogGP}}} \newcommand{\LonePassAdvantage}{\hat{A}_{\text{pass}}} \newcommand{\LongMessageGapPerByte}{G} \newcommand{\LongestInterruptMaskTime}{t_{\text{irq\_disabled,max}}} \newcommand{\LongitudinalFrictionCoefficient}{\mu_x} \newcommand{\LongitudinalSlipRatio}{\lambda} \newcommand{\LongitudinalTractionStiffness}{C_x} \newcommand{\LongitudinalVehicleSpeed}{v_x} \newcommand{\LookaheadStepIndex}{l} \newcommand{\LoopAcceptanceProbability}{p_{\text{loop}}} \newcommand{\LoopGainScalingFactor}{\kappa} \newcommand{\LoopNestDepth}{n_{\text{loops}}} \newcommand{\LoopOrderCount}{N_{\text{order}}} \newcommand{\LoopParallelizationChoiceCount}{\mathcal{P}_{\text{parallel}}} \newcommand{\LoopTurnCost}{C} \newcommand{\Loss}{L} \newcommand{\LossAdjointSeed}{\bar{\mathcal{L}}} \newcommand{\LossFunction}{\mathcal{L}} \newcommand{\LossGradient}{g} \newcommand{\LossGradientVector}{\mathbf{g}} \newcommand{\LossHessian}{\mathbf{H}} \newcommand{\LossLowerBound}{\mathcal{L}_{\inf}} \newcommand{\LossScaleFactor}{s_{\text{loss}}} \newcommand{\LossTimeDerivative}{\dot{\mathcal{L}}} \newcommand{\LostMotionDeflection}{\delta_{\text{lost}}} \newcommand{\LostSuffixTurnCount}{H_{\text{suffix},i}} \newcommand{\LostWorkReplayTime}{T_{\text{replay}}} \newcommand{\LotSamplingProbability}{q} \newcommand{\LowRankLeftFactor}{\mathbf{U}} \newcommand{\LowRankRightFactor}{\mathbf{V}} \newcommand{\LowerPriorityFrames}{lp} \newcommand{\LowerPriorityTasks}{lp} \newcommand{\LowerRatioClippingWidth}{\epsilon_{\text{low}}} \newcommand{\LqrControlWeightMatrix}{\mathbf{R}_u} \newcommand{\LqrCostToGoMatrix}{\mathbf{P}} \newcommand{\LqrFeedbackGain}{\mathbf{K}_{\text{lqr}}} \newcommand{\LqrQuadraticObjective}{J} \newcommand{\LqrStateWeightMatrix}{\mathbf{Q}_x} \newcommand{\LshBandCount}{L} \newcommand{\LshCandidateProbability}{p_{\text{candidate}}} \newcommand{\LshRowsPerBand}{r} \newcommand{\LyapunovAnalysisDomain}{\mathcal{D}} \newcommand{\LyapunovFunction}{V} \newcommand{\LyapunovFunctionDerivative}{\dot{V}} \newcommand{\LyapunovPositivityMargin}{\epsilon_{\text{pos}}} \newcommand{\LyapunovSublevelSet}{\Omega_c} \newcommand{\MacAccumulator}{\text{acc}} \newcommand{\MachineTaxonomyAxis}{\mathsf{Machine}} \newcommand{\MahalanobisDistance}{d_M} \newcommand{\ManifestTrackIndex}{k} \newcommand{\ManipulatorBaseFrame}{\mathcal{F}_{\text{base}}} \newcommand{\ManipulatorJacobian}{\mathbf{J}} \newcommand{\ManualLease}{T_{\text{lease,man}}} \newcommand{\ManualResetTime}{t_{\text{reset,manual}}} \newcommand{\ManualReviewCost}{C_{\text{manual}}} \newcommand{\ManualReviewFraction}{r_{\text{manual}}} \newcommand{\MapCovarianceJacobian}{\mathbf{J}_{\text{map}}} \newcommand{\MapOdometryTransform}{\mathbf{T}_{\text{map}}^{\text{odom}}} \newcommand{\MapParameterEstimate}{\theta_{\text{MAP}}} \newcommand{\MapPoseCovariance}{\boldsymbol{\Sigma}_{\text{map}}} \newcommand{\MapReferenceFrame}{\mathcal{F}_{\text{map}}} \newcommand{\MappedCommandTap}{a_{\text{cmd}}} \newcommand{\MappingSearchSpaceSize}{\mathcal{S}_{\text{mapping}}} \newcommand{\MarginalFalseApprovalProbability}{p} \newcommand{\MarginalRequestServiceTime}{t_{\text{req}}} \newcommand{\MarginalStoppingThreshold}{\epsilon_{\text{stop}}} \newcommand{\MarginalVelocityField}{u} \newcommand{\MarginalizedModelParameters}{\theta'} \newcommand{\MarkovDecisionProcess}{\mathcal{M}} \newcommand{\MaskTokenIndex}{i} \newcommand{\MaskedClientUpdate}{\mathbf{y}} \newcommand{\MaskedFinetuningLoss}{\mathcal{L}_{\text{SFT}}} \newcommand{\MaskedImitationDataset}{\mathcal{D}_{\text{train}}} \newcommand{\MaskedImitationLoss}{\mathcal{L}_{\text{imitation}}} \newcommand{\MaskedLogitVector}{\mathbf{z}'} \newcommand{\MaskedTokenLogit}{z'} \newcommand{\Mass}{m} \newcommand{\MassCenterAcceleration}{\ddot{\mathbf{c}}} \newcommand{\MassCenterHeight}{z_c} \newcommand{\MassCenterPosition}{\mathbf{c}} \newcommand{\MasterProcessingTime}{t_{\text{master}}} \newcommand{\MatchingRowCount}{K} \newcommand{\MatrixColumnIndex}{j} \newcommand{\MatrixEigenvalue}{\lambda} \newcommand{\MatrixMultiplyDestination}{\mathbf{D}} \newcommand{\MatrixRowIndex}{i} \newcommand{\MaxBatchSize}{B_{\text{max}}} \newcommand{\MaxBatchingWindow}{T_{\text{max}}} \newcommand{\MaxReceivedTokenCount}{B_{\text{max}}} \newcommand{\MaxResidentContextCount}{B_{\max}} \newcommand{\MaximumActuatorEffort}{u_{\max}} \newcommand{\MaximumBreakerCooldownInterval}{T_{\text{cool}}^{\max}} \newcommand{\MaximumCompletionOffset}{c_{\max}} \newcommand{\MaximumDepthHypothesis}{d_{\max}} \newcommand{\MaximumEntropyObjective}{J} \newcommand{\MaximumLoadCurrentStep}{\Delta I_{\max}} \newcommand{\MaximumLogit}{z_{\max}} \newcommand{\MaximumObservationAge}{t_{\text{age},\max}} \newcommand{\MaximumPlateIndentation}{x_{\max}} \newcommand{\MaximumRetryBackoffInterval}{b_{\max}} \newcommand{\MaximumTurnOffDelay}{t_{\text{off, max}}} \newcommand{\McnemarTestStatistic}{\chi^2} \newcommand{\McuCaptureTime}{t_{\text{MCU,capture}}} \newcommand{\McuDispatchTime}{t_{\text{MCU,dispatch}}} \newcommand{\MealTokenKeyVector}{\mathbf{k}_{\text{meal}}} \newcommand{\MealTokenQueryVector}{\mathbf{q}_{\text{meal}}} \newcommand{\MeanAcceptedDraftLength}{\bar{m}} \newcommand{\MeanAttemptCost}{c} \newcommand{\MeanClusterSize}{m} \newcommand{\MeanContextLength}{\bar{S}} \newcommand{\MeanDeliveryPayloadLength}{L} \newcommand{\MeanDocumentLength}{\overline{|x|}} \newcommand{\MeanHoldTime}{\bar{T}_{\text{hold}}} \newcommand{\MeanLatchContactForce}{\bar{F}} \newcommand{\MeanMessageQueueDelay}{\bar{T}_q} \newcommand{\MeanNeesStatistic}{\bar{\epsilon}} \newcommand{\MeanQueryDistance}{\mu_D} \newcommand{\MeanRolloutLength}{\bar{N}} \newcommand{\MeanSlotOccupancy}{\bar{N}_{\text{slot}}} \newcommand{\MeanSquaredErrorCloningLoss}{\mathcal{L}_{\text{MSE}}} \newcommand{\MeanStoredTokensPerRecord}{\bar{S}} \newcommand{\MeanTargetTokensPerRecord}{\bar{w}} \newcommand{\MeanTimeBetweenFailures}{\text{MTBF}} \newcommand{\MeanTimeToFailure}{\text{MTTF}} \newcommand{\MeanTimeToRepair}{\text{MTTR}} \newcommand{\MeanVerifierServiceTime}{\bar{T}_{\text{svc}}} \newcommand{\MeasuredAxisPosition}{x_{\text{meas}}} \newcommand{\MeasuredContactForce}{\mathbf{F}_{\text{contact}}} \newcommand{\MeasuredJointVelocities}{\dot{\mathbf{q}}_{\text{meas}}} \newcommand{\MeasuredPixelDepth}{Z_{\text{meas}}} \newcommand{\MeasuredResponseTap}{a_{\text{meas}}} \newcommand{\MeasuredSeamAccelerations}{\ddot{\mathbf{q}}_{\text{meas}}} \newcommand{\MeasuredSeamConfiguration}{\mathbf{q}_{\text{meas}}} \newcommand{\MeasuredSeamVelocities}{\dot{\mathbf{q}}_{\text{meas}}} \newcommand{\MeasuredTrackedPosition}{\mathbf{p}_{\text{meas}}} \newcommand{\MeasurementCovariance}{\boldsymbol{\Sigma}_z} \newcommand{\MeasurementDimension}{m} \newcommand{\MeasurementErrorStandardDeviation}{\sigma} \newcommand{\MeasurementFunction}{h} \newcommand{\MeasurementHistory}{\mathbf{y}_{1:k}} \newcommand{\MeasurementInnovation}{\boldsymbol{\nu}} \newcommand{\MeasurementMatrix}{\mathbf{H}} \newcommand{\MeasurementNoiseCovariance}{\boldsymbol{\Sigma}_{\text{meas}}} \newcommand{\MeasurementNoiseVector}{\mathbf{v}_{\text{meas}}} \newcommand{\MeasurementVector}{\mathbf{y}} \newcommand{\MeasurementVectorDerivative}{\dot{\mathbf{y}}} \newcommand{\MeasurementWindowEnd}{t_{\text{end}}} \newcommand{\MechanicalEnergy}{E} \newcommand{\MechanicalEnergyDerivative}{\dot{E}} \newcommand{\MechanicalImpedanceMap}{Z} \newcommand{\MechanicalPlantState}{\mathbf{x}} \newcommand{\MechanicalWork}{W} \newcommand{\MechanismAcceptanceProbability}{p'_{\text{acc}}} \newcommand{\MechanismAttemptCost}{C'_{\text{attempt}}} \newcommand{\MechanismLogMoment}{\alpha_{\mathcal{M}}} \newcommand{\MechanismOutcome}{o} \newcommand{\MechanismOutputSet}{\mathcal{S}} \newcommand{\MechanismOutputVector}{\mathbf{y}} \newcommand{\MechanismRenyiPrivacyBudget}{\epsilon_{\text{R},i}} \newcommand{\MemoryBusQueueDelay}{t_{\text{queue}}} \newcommand{\MemoryEntryBirthGeneration}{g_{\text{birth}}} \newcommand{\MemoryEntryDeathGeneration}{g_{\text{death}}} \newcommand{\MemoryHierarchyLevelCount}{N_{\text{mem}}} \newcommand{\MemoryHoldDuringWait}{O_{\text{mem}}} \newcommand{\MemoryPlacementCount}{\mathcal{M}_{\text{placement}}} \newcommand{\MemorySubsystemEnergy}{E_{\text{memory}}} \newcommand{\MergedAttentionOutput}{\mathbf{O}^{\text{new}}} \newcommand{\MergedSoftmaxMaximum}{m^{\text{new}}} \newcommand{\MergedSoftmaxNormalizer}{z^{\text{new}}} \newcommand{\MergedWeightMatrix}{\mathbf{W}_{\text{final}}} \newcommand{\MessageInjectionGap}{g} \newcommand{\MessageQueueDelay}{T_q} \newcommand{\MessageStartupLatency}{\alpha} \newcommand{\MessageTimestamp}{t_{\text{msg}}} \newcommand{\MetricDepth}{z_{\text{metric}}} \newcommand{\MicroUnitPrefix}{\text{µ}} \newcommand{\MicrobatchCount}{m} \newcommand{\MicrobatchGradient}{\mathbf{g}} \newcommand{\MicrobatchIndex}{j} \newcommand{\MicrobatchPassTime}{T_{\text{micro},j}} \newcommand{\MicrobatchSize}{B_{\text{micro}}} \newcommand{\MicrocontrollerClockTime}{t_{\text{MCU}}} \newcommand{\MillerCapacitance}{C_{\text{gd}}} \newcommand{\MillerCharge}{Q_{\text{gd}}} \newcommand{\MillerDisplacementCurrent}{I_{\text{miller}}} \newcommand{\MillerPlateauDuration}{t_{\text{plateau}}} \newcommand{\MillerPlateauVoltage}{V_{\text{plateau}}} \newcommand{\MinHashPermutation}{\sigma} \newcommand{\MinHashPermutationCount}{n_{\sigma}} \newcommand{\MinHashSketchSize}{s} \newcommand{\MiniBatchActivation}{a} \newcommand{\MiniBatchSet}{\mathcal{B}} \newcommand{\MinibatchGradient}{\mathbf{g}} \newcommand{\MinimumActuatorEffort}{u_{\min}} \newcommand{\MinimumCellSupportCount}{N_{\min}} \newcommand{\MinimumChunkSetpointCount}{h_{\min}} \newcommand{\MinimumCompletionOffset}{c_{\min}} \newcommand{\MinimumDepthHypothesis}{d_{\min}} \newcommand{\MinimumDetectableEffect}{\delta_{\text{MDE}}} \newcommand{\MinimumPrefetchBufferCount}{Q_{\text{prefetch,min}}} \newcommand{\MinimumRailVoltage}{V_{\text{rail,min}}} \newcommand{\MinimumRoundTripLatency}{L_{\text{lat,min}}} \newcommand{\MinimumStableBatchSize}{B_{\text{min}}} \newcommand{\MinimumTransitTime}{t_{\min}} \newcommand{\MinimumTurnOnDelay}{t_{\text{on, min}}} \newcommand{\MisclassifiedFraction}{r_{\text{error}}} \newcommand{\MisroutedQueryFraction}{m} \newcommand{\MissAcceptanceProbability}{\alpha} \newcommand{\MissPathServiceTime}{T_{\text{cold}}} \newcommand{\MissionDuration}{T_{\text{mission}}} \newcommand{\MissionEnergy}{E_{\text{mission}}} \newcommand{\MissionExceedanceBudget}{\epsilon_{\text{mission}}} \newcommand{\MissionHandoffCount}{K} \newcommand{\MixtureComponentCount}{M} \newcommand{\MixtureComponentCovariance}{\boldsymbol{\Sigma}_m} \newcommand{\MixtureComponentIndex}{m} \newcommand{\MixtureComponentMean}{\boldsymbol{\mu}_m} \newcommand{\MixtureComponentWeight}{w_m} \newcommand{\MixupSample}{\tilde{x}} \newcommand{\MixupWeight}{\lambda_{\text{mix}}} \newcommand{\MlProductivityGoodput}{\text{MPG}} \newcommand{\MlpWeightArithmeticIntensity}{I_{\text{MLP}}} \newcommand{\MobileBaseBarrierFunction}{h_{\text{base}}} \newcommand{\MobilenetWidthMultiplier}{\alpha_{\text{width}}} \newcommand{\ModelBandwidthUtilization}{\text{MBU}} \newcommand{\ModelCallIndex}{i} \newcommand{\ModelCallRequest}{\mathcal{R}} \newcommand{\ModelDownloadEnergy}{E_{\text{download}}} \newcommand{\ModelFlopsUtilization}{\text{MFU}} \newcommand{\ModelGenerationIndex}{n} \newcommand{\ModelInput}{x} \newcommand{\ModelLifetimeCost}{C_{\text{total}}} \newcommand{\ModelParameters}{\theta} \newcommand{\ModelPointAbscissa}{X} \newcommand{\ModelPointHeight}{Z} \newcommand{\ModelPointOrdinate}{Y} \newcommand{\ModelPrediction}{\hat{y}} \newcommand{\ModelPredictor}{f} \newcommand{\ModelScore}{s} \newcommand{\ModelStepOperations}{O_{\text{model}}} \newcommand{\ModelTime}{T_{\text{model}}} \newcommand{\ModelTimeFraction}{f} \newcommand{\ModelWeight}{w} \newcommand{\MomentOrder}{\lambda_{\text{mom}}} \newcommand{\MonitorStartupTime}{T_{\text{vmm}}} \newcommand{\MonitoredFairnessMetricCount}{m} \newcommand{\MonitoredFeatureLevel}{x_{\text{feat}}} \newcommand{\MonitoredGroupCount}{k} \newcommand{\MonitoredMetric}{X} \newcommand{\MonitoredMetricMean}{\mu} \newcommand{\MonitoredMetricStandardDeviation}{\sigma} \newcommand{\MonitoringAlertCost}{C_{\text{alert}}} \newcommand{\MonitoringComputeCost}{C_{\text{compute}}} \newcommand{\MonitoringCostComponent}{C_*} \newcommand{\MonitoringIngestionCost}{C_{\text{ingest}}} \newcommand{\MonitoringStorageCost}{C_{\text{storage}}} \newcommand{\MonotonicClockInstant}{t} \newcommand{\MonthlyOptimizationSavings}{C_{\text{save,monthly}}} \newcommand{\MotionBlurLength}{L} \newcommand{\MotionCyclePeriod}{T_{\text{cycle}}} \newcommand{\MotionModelInput}{\mathbf{u}} \newcommand{\MotorBackEmfConstant}{K_e} \newcommand{\MotorConstant}{K_m} \newcommand{\MotorPhaseRmsCurrent}{I_{\text{phase}}} \newcommand{\MotorRotorAccelerations}{\ddot{\boldsymbol{\theta}}_{\text{motor}}} \newcommand{\MotorRotorCoordinates}{\boldsymbol{\theta}_{\text{motor}}} \newcommand{\MotorRotorVelocities}{\dot{\boldsymbol{\theta}}_{\text{motor}}} \newcommand{\MotorShaftDamping}{D_{\text{motor}}} \newcommand{\MotorShaftPosition}{q_{\text{motor}}} \newcommand{\MotorTorque}{\tau_{\text{motor}}} \newcommand{\MotorTorqueConstant}{K_t} \newcommand{\MotorViscousDamping}{B_{m}} \newcommand{\MotorViscousDampingMatrix}{\mathbf{B}_m} \newcommand{\MpcControlSequence}{\mathbf{u}_{0:N_{\text{mpc}}-1}} \newcommand{\MpcControlSequenceTail}{\mathbf{u}_{1:N_{\text{mpc}}-1}} \newcommand{\MpcHorizonObjective}{J} \newcommand{\MpcPredictionHorizon}{N_{\text{mpc}}} \newcommand{\MpcTerminalCost}{\ell_f} \newcommand{\MpcTerminalCostMatrix}{\mathbf{P}_{N_{\text{mpc}}}} \newcommand{\MultiAgentAcceptanceProbability}{p_{\text{multi}}} \newcommand{\MultiDeviceRunTime}{T_N} \newcommand{\MultimodalFusedTokenStream}{\mathbf{Z}} \newcommand{\MultimodalObservation}{\mathbf{o}} \newcommand{\MutatingToolAction}{a} \newcommand{\MutualInformation}{I} \newcommand{\NaturalLogarithmBase}{e} \newcommand{\NearestCandidateDistance}{D_{\min}} \newcommand{\NeesStatistic}{\epsilon} \newcommand{\NegativeGateSupplyVoltage}{V_{\text{ee}}} \newcommand{\NeighborCount}{k} \newcommand{\NeighborUserIndex}{j} \newcommand{\NeighboringDataset}{X} \newcommand{\NetAngularBrakingDeceleration}{\alpha_{\text{net}}} \newcommand{\NetBrakingDeceleration}{a_{\text{net}}} \newcommand{\NetworkBandwidth}{\text{BW}_{\text{network}}} \newcommand{\NetworkDelayStandardDeviation}{\sigma_d} \newcommand{\NetworkEnergy}{E_{\text{network}}} \newcommand{\NetworkEquipmentPower}{P_{\text{network}}} \newcommand{\NetworkFunction}{f_{\text{net}}} \newcommand{\NetworkLatency}{L_{\text{lat,network}}} \newcommand{\NetworkOutput}{y} \newcommand{\NetworkTrafficVolume}{M} \newcommand{\NeuralLyapunovFactor}{\mathbf{L}_{\phi}} \newcommand{\NeuronActivation}{a} \newcommand{\NeuronBias}{b} \newcommand{\NeuronConnectionWeight}{w_{ij}} \newcommand{\NeuronIndex}{j} \newcommand{\NeuronPreactivation}{z} \newcommand{\NewSoftmaxRunningMaximum}{m_{\text{new}}} \newcommand{\NextDecisionProcessState}{s'} \newcommand{\NextFailureTime}{F} \newcommand{\NextLayerActivationMemory}{M_{\text{activations}}^{(\ell+1)}} \newcommand{\NextProprioceptiveObservation}{\mathbf{o}_{\text{proprio}, t+1}} \newcommand{\NextRobotAction}{\mathbf{a}'} \newcommand{\NextTokenDistribution}{p} \newcommand{\NextTokenEntropy}{\mathcal{H}} \newcommand{\NextTokenLogitFunction}{\mathbf{f}_\theta} \newcommand{\NgramLength}{n} \newcommand{\NicMttf}{\text{MTTF}_{\text{nic}}} \newcommand{\NicsPerNode}{n_{\text{nic}}} \newcommand{\NodeAcceleratorCount}{n_{\text{acc}}} \newcommand{\NodeHbmCapacity}{M_{\text{HBM}}} \newcommand{\NodeMtbf}{\text{MTBF}_{\text{node}}} \newcommand{\NodeStragglerProbability}{p_{\text{straggle}}} \newcommand{\NoisePredictionNetwork}{\boldsymbol{\epsilon}_\theta} \newcommand{\NoisedActionChunk}{\mathbf{A}^k} \newcommand{\NoisyClassProbability}{\tilde{p}} \newcommand{\NoisyClassProbabilityVector}{\tilde{\mathbf{p}}} \newcommand{\NoisyLabelSampleCount}{D_{\text{noisy}}} \newcommand{\NominalBitRate}{R_{\text{nom}}} \newcommand{\NominalBitTime}{T_{\text{bit,nom}}} \newcommand{\NominalBrakingDeceleration}{a_{\text{nominal}}} \newcommand{\NominalClearance}{C_{\text{nominal}}} \newcommand{\NominalClockFrequency}{f_{\text{nom}}} \newcommand{\NominalCommandWindow}{\mathbf{u}_{\text{nom}, t:t+H-1}} \newcommand{\NominalContactForces}{\mathbf{f}_{\text{nom}}} \newcommand{\NominalControlCommand}{\mathbf{u}_{\text{nom}}} \newcommand{\NominalFrameInterval}{T_{\text{nominal}}} \newcommand{\NominalFrictionCoefficient}{\mu_{\text{nom}}} \newcommand{\NominalOscillatorFrequency}{f_{\text{nom}}} \newcommand{\NominalPlanExpiry}{t_{\text{plan\_exp}}} \newcommand{\NominalRatedSpeed}{v_{\text{nominal}}} \newcommand{\NominalReferenceClearance}{c} \newcommand{\NominalSupplyVoltage}{V_{\text{nom}}} \newcommand{\NominalTickPeriod}{T_{\text{period}}} \newcommand{\NominalTrackingTolerance}{\epsilon_{\text{nom}}} \newcommand{\NonconformityScore}{s} \newcommand{\NoninferiorityRatioMargin}{\delta} \newcommand{\NoninferiorityTolerance}{\delta_{\text{tol}}} \newcommand{\NonlinearBiasTorque}{\mathbf{h}} \newcommand{\NonlinearObservationSpace}{\mathbf{O}_{\text{NL}}} \newcommand{\NonlinearOutputFunction}{\mathbf{h}} \newcommand{\NonzeroCount}{n_{\text{nz}}} \newcommand{\NonzeroParameterBudget}{k_{\text{nz}}} \newcommand{\NormWeightMatrix}{\mathbf{W}} \newcommand{\NormalContactForce}{f_{k, \perp}} \newcommand{\NormalContactImpulse}{P_n} \newcommand{\NormalizationScale}{\gamma} \newcommand{\NormalizationScaleVector}{\boldsymbol{\gamma}} \newcommand{\NormalizationShift}{\beta} \newcommand{\NormalizationShiftVector}{\boldsymbol{\beta}} \newcommand{\NormalizedActionCommand}{\tilde{a}} \newcommand{\NormalizedActionResidual}{e} \newcommand{\NormalizedActivation}{\hat{a}} \newcommand{\NormalizedCandidateScore}{c} \newcommand{\NormalizedElapsedTimeRatio}{D} \newcommand{\NormalizedGearRatio}{\tilde{N}} \newcommand{\NormalizedImageAbscissa}{x_n} \newcommand{\NormalizedImageOrdinate}{y_n} \newcommand{\NormalizedMetricBaseline}{v} \newcommand{\NormalizedPredicateMargin}{\bar{f}} \newcommand{\NormalizedRadialDistance}{r} \newcommand{\NormalizedStatusEnvelope}{\mathcal{N}} \newcommand{\NormalizerTokenIndex}{w} \newcommand{\NormalizingClassIndex}{k} \newcommand{\NormalizingKeyIndex}{m} \newcommand{\NormalizingNextState}{\tilde{s}} \newcommand{\NoticeByteAllocation}{M_{\text{notice}}} \newcommand{\NucleusProbabilityMass}{p} \newcommand{\NullSpaceProjector}{\mathbf{N}} \newcommand{\NullSpaceVelocityBias}{\dot{\mathbf{q}}_0} \newcommand{\NumericBitWidth}{b} \newcommand{\NumericalStabilityConstant}{\epsilon} \newcommand{\ObjectHandle}{h} \newcommand{\ObjectWrench}{\mathbf{w}_{\text{obj}}} \newcommand{\ObservabilityMatrix}{\mathbf{O}_{\text{obs}}} \newcommand{\ObservableModelOutput}{O} \newcommand{\ObservationAge}{t_{\text{age}}} \newcommand{\ObservationAgeBudget}{t_{\text{age},\max}} \newcommand{\ObservationAgeDisplacement}{\Delta \mathbf{p}} \newcommand{\ObservationBinding}{\lambda} \newcommand{\ObservationByteBudget}{M_{\text{obs},\max}} \newcommand{\ObservationCount}{N} \newcommand{\ObservationDataset}{\mathcal{D}} \newcommand{\ObservationEncodingTime}{t_{\text{enc}}} \newcommand{\ObservationFunction}{h} \newcommand{\ObservationHistory}{\mathbf{O}} \newcommand{\ObservationHistoryLength}{H_{\text{hist}}} \newcommand{\ObservationHistorySequence}{\mathbf{o}_{0:t}} \newcommand{\ObservationHistoryWindow}{\mathbf{o}_{t-H_{\text{hist}}:t}} \newcommand{\ObservationIntervalEnd}{t_{b}} \newcommand{\ObservationIntervalLength}{T_{\text{obs}}} \newcommand{\ObservationIntervalStart}{t_{a}} \newcommand{\ObservationPairingLag}{\Delta t_{\text{lag}}} \newcommand{\ObservationPayload}{\mathbf{T}_{\text{payload}}} \newcommand{\ObservationResponseLatency}{T_{\text{total}}} \newcommand{\ObservationTimestamp}{t_{\text{obs}}} \newcommand{\ObservationTokenCount}{S_{\text{obs}}} \newcommand{\ObservationTokenSequence}{\mathbf{z}_{\text{token}}} \newcommand{\ObservedAnnotatorAgreement}{p_o} \newcommand{\ObservedCategoryCount}{n_i^{\text{obs}}} \newcommand{\ObservedCycleCount}{N} \newcommand{\ObservedDataPoint}{\mathbf{x}} \newcommand{\ObservedFailureCount}{k} \newcommand{\ObservedFailureFraction}{\hat{p}} \newcommand{\ObservedFreeSpace}{\mathcal{M}_{\text{free}}} \newcommand{\ObservedLabelCount}{n} \newcommand{\ObservedOccupiedSpace}{\mathcal{M}_{\text{occ}}} \newcommand{\ObservedPixelCoordinates}{\tilde{\mathbf{m}}_{\text{observed}}} \newcommand{\ObservedPlantState}{\mathbf{x}_{\text{obs}}} \newcommand{\ObservedPointRange}{r} \newcommand{\ObservedRelativeSpeed}{v_{\text{rel}}} \newcommand{\ObservedSignificanceLevel}{p_{\text{val}}} \newcommand{\ObservedSuccessFraction}{\hat{p}} \newcommand{\ObservedTrialFailureCount}{k} \newcommand{\ObservedViolationFraction}{V} \newcommand{\ObservedVolume}{V_{\text{obs}}} \newcommand{\ObstacleConfigurationSet}{\mathcal{C}_{\text{obs}}} \newcommand{\ObstacleCostWeight}{\lambda_{\text{obs}}} \newcommand{\ObstaclePoint}{\mathbf{o}} \newcommand{\ObstaclePosition}{x_{\text{obstacle}}} \newcommand{\ObstacleProximityCost}{c_{\text{obs}}} \newcommand{\ObstacleRiskRadius}{r_{\text{risk}}} \newcommand{\ObstacleSeparationDistance}{d} \newcommand{\ObstacleStateSet}{\mathcal{X}_{\text{obs}}} \newcommand{\ObstacleSurfaceArea}{A_{\text{surface}}} \newcommand{\OccupancyCoverageMultiplier}{k_\sigma} \newcommand{\OccupancyLogOdds}{L} \newcommand{\OccupancyThreshold}{k} \newcommand{\OccupiedLogOddsIncrement}{L_{\text{occ}}} \newcommand{\OccupiedScenarioCellCount}{N_{\text{supported}}} \newcommand{\OdometryBaseTransform}{\mathbf{T}_{\text{odom}}^{\text{base}}} \newcommand{\OdometryCovarianceJacobian}{\mathbf{J}_{\text{odom}}} \newcommand{\OdometryNoiseStandardDeviation}{\sigma_{w}} \newcommand{\OdometryPoseCovariance}{\boldsymbol{\Sigma}_{\text{odom}}} \newcommand{\OdometryReferenceFrame}{\mathcal{F}_{\text{odom}}} \newcommand{\OfflineTransitionDataset}{\mathcal{D}_{\text{offline}}} \newcommand{\OffloadTailNetworkTime}{t_{\text{net}}^{\text{tail}}} \newcommand{\OffloadTailProcessingTime}{t_{\text{proc}}^{\text{tail}}} \newcommand{\OffloadTransactionWindow}{W} \newcommand{\OhmUnit}{\Omega} \newcommand{\OilBulkModulus}{\beta} \newcommand{\OldSoftmaxRunningMaximum}{m_{\text{old}}} \newcommand{\OnDieDecouplingCapacitance}{C_{\text{die}}} \newcommand{\OnlineSoftmaxKeyTile}{\mathbf{K}_{\text{tile}}} \newcommand{\OnlineSoftmaxQueryBlock}{\mathbf{Q}_{\text{block}}} \newcommand{\OnlineSoftmaxScoreBlock}{\mathbf{A}_{\text{block}}} \newcommand{\OpenLoopTransferFunction}{L} \newcommand{\OpenLoopTransferMatrix}{\mathbf{L}} \newcommand{\OperationChargeBound}{\bar{c}} \newcommand{\OperationDispatchOverhead}{t_{\text{dispatch}}} \newcommand{\OperationRecipient}{r} \newcommand{\OperationReconciliationTime}{T_{\text{rec}}} \newcommand{\OperationalFailureProbability}{p_F} \newcommand{\OperationalOverheadFraction}{f_{\text{overhead}}} \newcommand{\OperationalScenarioDistribution}{p} \newcommand{\OperationalTaxonomyDimension}{C} \newcommand{\OperationalTestDistribution}{\mathcal{D}} \newcommand{\Operations}{O} \newcommand{\OperationsPerSample}{O_{\text{sample}}} \newcommand{\OperatorCognitiveTime}{T_{\text{cognitive}}} \newcommand{\OperatorMotorTime}{T_{\text{motor}}} \newcommand{\OperatorResponseLatency}{t_{\text{hum}}} \newcommand{\OperatorSensoryTime}{T_{\text{sensory}}} \newcommand{\OperatorStabilizationInstant}{t_{\text{stabilize}}} \newcommand{\OperatorWindowTime}{t'} \newcommand{\OperatorWorkspaceMemory}{M_{\text{workspace}}} \newcommand{\OpticalFrequency}{\nu} \newcommand{\OpticalWavelength}{\lambda_{\text{wl}}} \newcommand{\OptimalCheckpointInterval}{T^\ast_{\text{ckpt}}} \newcommand{\OptimalCostToGoDerivative}{\dot{V}} \newcommand{\OptimalCostToGoFunction}{V} \newcommand{\OptimalModelParameters}{\theta^*} \newcommand{\OptimalStateReturn}{V_{\text{RL}}} \newcommand{\OptimizationBreakevenTime}{T_{\text{breakeven}}} \newcommand{\OptimizationImplementationCost}{C_{\text{optimization}}} \newcommand{\OptimizationIterate}{x} \newcommand{\OptimizerStateMemory}{M_{\text{optimizer}}} \newcommand{\OptimizerStepIndex}{t} \newcommand{\OptimizerStepTime}{T_{\text{update}}} \newcommand{\OptimizerUpdateCount}{T} \newcommand{\OptimumMissFactor}{x} \newcommand{\OrderedTestRank}{r} \newcommand{\OrientationTolerance}{\theta_{\text{tol}}} \newcommand{\OrphanSweepInterval}{T} \newcommand{\OscillationPriorStateDigest}{h_{\text{state},t-2}} \newcommand{\OscillatorAcceleration}{\ddot{q}} \newcommand{\OscillatorNaturalFrequency}{\omega} \newcommand{\OscillatorPosition}{q} \newcommand{\OscillatorStepVelocity}{v} \newcommand{\OscillatorVelocity}{\dot{q}} \newcommand{\OutcomeAlphabet}{\mathcal{X}} \newcommand{\OutcomeCheckPassProbability}{p_{\text{out}}} \newcommand{\OutcomeCheckSlotTime}{T_{\text{out}}} \newcommand{\OutcomePairPrivacyLoss}{\mathcal{L}_{\text{priv},(X,X')}^{(o)}} \newcommand{\OutcomeStandardDeviation}{\sigma} \newcommand{\OutgoingChannelCommand}{u_{\text{prior}}} \newcommand{\OutgoingCommandDerivative}{\dot{u}_{\text{prior}}} \newcommand{\OutputBearingDamping}{D_{\text{joint}}} \newcommand{\OutputChannel}{y} \newcommand{\OutputChannelCount}{C_{\text{out}}} \newcommand{\OutputChannelIndex}{k} \newcommand{\OutputComponentFunction}{h} \newcommand{\OutputDimension}{p} \newcommand{\OutputFeatureMapHeight}{H_{\text{out}}} \newcommand{\OutputFeatureMapWidth}{W_{\text{out}}} \newcommand{\OutputIndex}{\ell} \newcommand{\OutputLayerBiasVector}{\mathbf{b}_{\text{out}}} \newcommand{\OutputLayerWeightMatrix}{\mathbf{W}_{\text{out}}} \newcommand{\OutputLength}{K} \newcommand{\OutputLengthStandardDeviation}{\sigma} \newcommand{\OutputLimit}{K_{\max}} \newcommand{\OutputLogit}{z} \newcommand{\OutputNodeAdjoint}{\bar{v}_W} \newcommand{\OutputNodePrimal}{v_W} \newcommand{\OutputProjectionOperations}{O_{\text{out}}} \newcommand{\OutputQuantizationScale}{s_Y} \newcommand{\OutputRelativeDegree}{r} \newcommand{\OutputToken}{y} \newcommand{\OutputTokenPrefix}{y_{<t}} \newcommand{\OutputTokenPrice}{c_{\text{out}}} \newcommand{\OutputTokenSequence}{y_{1:K}} \newcommand{\OutputTorqueCeiling}{\tau_{\text{out,max}}} \newcommand{\OutstandingItemCount}{N_{\text{out}}} \newcommand{\OverheadCameraEmbedding}{\mathbf{e}_{\text{overhead}}} \newcommand{\OverlappedBackwardCommunicationTime}{T_{\text{pipelined}}} \newcommand{\OverlappedTime}{T_{\text{overlap}}} \newcommand{\OverlappingGaussianSet}{\mathcal{N}} \newcommand{\OversubscriptionRatio}{R} \newcommand{\OwnershipAcquisitionTime}{T_{\text{own}}} \newcommand{\PackageDecouplingCapacitance}{C_{\text{pkg}}} \newcommand{\PackageInductance}{L_{\text{pkg}}} \newcommand{\PackageResistance}{R_{\text{pkg}}} \newcommand{\PackageThermalCapacitance}{C_{\text{th}}} \newcommand{\PackageThermalTimeConstant}{\tau_{\text{th}}} \newcommand{\PackedExampleIndex}{k} \newcommand{\PackedExampleLength}{s} \newcommand{\PackedExampleOffset}{b} \newcommand{\PacketBuffer}{b} \newcommand{\PaddingWasteFraction}{W} \newcommand{\PageRankDampingFactor}{d} \newcommand{\PageRankScoreVector}{\mathbf{r}} \newcommand{\PairedAcceptanceDifference}{\Delta} \newcommand{\PairedDifferenceLowerLimit}{L_{\Delta}} \newcommand{\PairedDifferenceUpperLimit}{U_{\Delta}} \newcommand{\PairedOutcomeCellCount}{n} \newcommand{\PairedRandomVariable}{Y} \newcommand{\PairedTaskIndex}{j} \newcommand{\PairedTimeInstant}{s} \newcommand{\PairedVerdictCorrelation}{\hat{\phi}} \newcommand{\PairingLagCeiling}{\Delta t_{\text{lag,max}}} \newcommand{\PairwiseCoordinationCoefficient}{\beta_{\text{pair}}} \newcommand{\PairwiseMaskSecret}{\mathbf{s}} \newcommand{\ParallelEnvironmentCount}{n_{\text{env}}} \newcommand{\ParallelFraction}{f_{\text{parallel}}} \newcommand{\ParallelLoopCount}{k_{\text{parallel}}} \newcommand{\ParallelRigCount}{N_{\text{rig}}} \newcommand{\ParameterPayload}{M_{\text{param}}} \newcommand{\ParameterRandomizationRanges}{\mathcal{P}} \newcommand{\ParameterScaleCoefficient}{A} \newcommand{\ParameterScalingExponent}{\alpha} \newcommand{\ParameterServerCount}{K_{\text{srv}}} \newcommand{\ParameterSpace}{\Theta} \newcommand{\ParameterSpaceDirection}{u} \newcommand{\ParameterStreamingTime}{t_{\text{stream}}} \newcommand{\ParameterVelocity}{\dot{\theta}} \newcommand{\ParameterizedPredictor}{f_{\theta}} \newcommand{\Parameters}{P} \newcommand{\ParametricProposalDistribution}{q_{\boldsymbol{\psi}}} \newcommand{\ParasiticLoopInductance}{L_{\text{parasitic}}} \newcommand{\ParentCapabilityGrant}{\Gamma_{\text{parent}}} \newcommand{\ParentFreeBalance}{F_{P}} \newcommand{\ParentNodeIndex}{k} \newcommand{\ParentReservedFunds}{R_{P}} \newcommand{\ParentSettledCharges}{E_{P}} \newcommand{\ParetoMinimumDemand}{x_{\min}} \newcommand{\ParetoTailExponent}{\alpha_{\text{tail}}} \newcommand{\ParetoTaskDemand}{X} \newcommand{\ParticipatingClientCount}{N_{\text{clients}}} \newcommand{\PartnerBitIndex}{k} \newcommand{\PassAtKEstimate}{\widehat{\operatorname{pass@}k}} \newcommand{\PassedTrialCount}{N_{\text{pass}}} \newcommand{\PassingRunCount}{s} \newcommand{\PassingSampleCount}{c} \newcommand{\PassiveModelPrediction}{\hat{Y}} \newcommand{\PastSynchronizationStepIndex}{j} \newcommand{\PatchColumnIndex}{w} \newcommand{\PatchRowIndex}{h} \newcommand{\PatchTokenCount}{N} \newcommand{\PathAcceleration}{\ddot{s}} \newcommand{\PathAccelerationInput}{u} \newcommand{\PathAccelerationLowerBound}{\ddot{s}_{\min}} \newcommand{\PathAccelerationTorqueCoefficient}{\mathbf{a}_{\tau}} \newcommand{\PathAccelerationUpperBound}{\ddot{s}_{\max}} \newcommand{\PathCoordinate}{s} \newcommand{\PathDelayAsymmetry}{\Delta t_{\text{asym}}} \newcommand{\PathGridPointCount}{N_{\text{grid}}} \newcommand{\PathVelocity}{\dot{s}} \newcommand{\PathVelocityField}{v} \newcommand{\PathVelocitySquaredTorqueCoefficient}{\mathbf{b}_{\tau}} \newcommand{\PayloadGravityTorque}{\tau_{g}} \newcommand{\PayloadLeverArm}{r} \newcommand{\PcieLinkFailureRate}{\lambda_{\text{PCIe}}} \newcommand{\PdnBranchCurrent}{I_{\text{branch}}} \newcommand{\PdnBranchResistance}{R_{\text{PDN}}} \newcommand{\PdnTargetImpedance}{Z_{\text{target}}} \newcommand{\PeakBridgeJerk}{j_{\text{peak}}} \newcommand{\PeakContactForce}{F_{\text{peak}}} \newcommand{\PeakCopperLossPower}{P_{\text{peak}}} \newcommand{\PeakCurrent}{I_{\text{peak}}} \newcommand{\PeakMemoryBandwidth}{\text{BW}_{\text{peak}}} \newcommand{\PeakPenetrationDepth}{\delta_{\max}} \newcommand{\PeakRate}{R_{\text{peak}}} \newcommand{\PeakRegenerativePower}{P_{\text{regen, peak}}} \newcommand{\PeakRotorAngularSpeed}{\omega_{\max}} \newcommand{\PeakSlipRatio}{\lambda_{\text{peak}}} \newcommand{\PeakStopDeceleration}{a_{\text{peak}}} \newcommand{\PeakTorque}{\tau_{\text{peak}}} \newcommand{\PeakTractionCoefficient}{\mu_{\text{peak}}} \newcommand{\PearsonFitStatistic}{\chi^2} \newcommand{\PeerReviewerIndex}{i} \newcommand{\PeerToolCallIndex}{j} \newcommand{\PenaltyContactDamping}{c} \newcommand{\PenaltyContactStiffness}{k_{\text{pen}}} \newcommand{\PenaltyPenetrationDepth}{\delta_{\text{pen}}} \newcommand{\PenaltyRestitutionDuration}{\Delta t_{\text{res}}} \newcommand{\PendulumNaturalFrequency}{\omega_0} \newcommand{\PenetrationDepth}{\delta} \newcommand{\PenetrationRate}{\dot{\delta}} \newcommand{\PenultimateLayerWidth}{n_{N_L-1}} \newcommand{\PerDeviceComputeTime}{T_{\text{compute,local}}} \newcommand{\PerDeviceWeightReadTime}{T_{\text{read}}} \newcommand{\PerExperimentComputeCost}{C_{\text{compute,per-exp}}} \newcommand{\PerExperimentEngineeringCost}{C_{\text{engineer,per-exp}}} \newcommand{\PerFrameDetectionProbability}{p_{\text{frame}}} \newcommand{\PerGpuNetworkFailureRate}{\lambda_{\text{network/GPU}}} \newcommand{\PerGpuPowerFailureRate}{\lambda_{\text{power/GPU}}} \newcommand{\PerGpuTotalFailureRate}{\lambda_{\text{total/GPU}}} \newcommand{\PerStepCostBound}{C_{\max}} \newcommand{\PerStepErrorRate}{\epsilon} \newcommand{\PerStreamTokenRate}{R} \newcommand{\PerTaskRunCount}{R} \newcommand{\PerTestSignificanceLevel}{\alpha_{\text{sig}}'} \newcommand{\PerTokenDecodeTime}{t_{\text{decode}}} \newcommand{\PerTokenKlEstimate}{\hat{\mathcal{D}}} \newcommand{\PerTokenMaskingTime}{t_{\text{mask}}} \newcommand{\PerTokenPrefillTime}{t_{\text{prefill}}} \newcommand{\PerWorkerBatchSize}{B_{\text{per-worker}}} \newcommand{\PerceptionDepthCovariance}{\boldsymbol{\Sigma}_{\text{depth}}} \newcommand{\PerceptionDispatchTime}{t_{\text{IPC}}} \newcommand{\PerceptionErrorScale}{\epsilon_{\text{scale}}} \newcommand{\PeriodicPeakWindingTemperature}{T_{\text{peak}}} \newcommand{\PeriodicTaskCount}{n} \newcommand{\PermanentMagnetFluxLinkage}{\lambda_{\text{pm}}} \newcommand{\PermissionLoopPeriod}{T_{\text{tick}}} \newcommand{\PermissionPathKernel}{G_\kappa} \newcommand{\PermissionPathParameters}{\kappa} \newcommand{\PermissionTickWaitTime}{t_{\text{wait}}} \newcommand{\PermissionTickWcet}{T_{\text{wcet}}} \newcommand{\PermittedActions}{\mathcal{A}_{\text{perm}}} \newcommand{\PermittedUsePassProbability}{p_{\text{use}}} \newcommand{\PersonApproachTravel}{S_h} \newcommand{\PersonPositionUncertainty}{Z_d} \newcommand{\PersonalizationPenaltyWeight}{\lambda_{\text{reg}}} \newcommand{\PersonalizationVector}{\mathbf{p}} \newcommand{\PerturbationNoiseStandardDeviation}{\sigma} \newcommand{\PerturbationNormOrder}{p} \newcommand{\PerturbedPose}{\mathbf{T}'} \newcommand{\PerturbedSignalDimension}{D} \newcommand{\PerturbedSignalVector}{\mathbf{x}} \newcommand{\PfcWatchdogTimeout}{T_{\text{watchdog}}} \newcommand{\PhaseInductance}{L_{\text{phase}}} \newcommand{\PhaseJoulePower}{P_{\text{phase}}} \newcommand{\PhaseMargin}{\Phi_m} \newcommand{\PhaseResistance}{R_{\text{phase}}} \newcommand{\PhotodiodeQuantumEfficiency}{\eta_{\text{QE}}} \newcommand{\PhysicalPlantDynamics}{f_{\text{real}}} \newcommand{\PhysicalRestoreTime}{t_{\text{physical\_restore}}} \newcommand{\PhysicalReturnLevel}{z_{T, \text{real}}} \newcommand{\PhysicalStateTrajectory}{s_{\text{real}}} \newcommand{\PhysicalStlRobustness}{\rho_{\text{real}}} \newcommand{\PhysicalTrajectorySet}{\mathcal{S}_{\text{real}}} \newcommand{\PhysicalWorldState}{s} \newcommand{\PidDerivativeGain}{K_d} \newcommand{\PidIntegralGain}{K_i} \newcommand{\PidProportionalGain}{K_p} \newcommand{\PidProportionalGainMatrix}{\mathbf{K}_p} \newcommand{\PipelineBubbleFraction}{b_{\text{pipe}}} \newcommand{\PipelineBufferMemory}{M_{\text{required}}} \newcommand{\PipelineClockSkew}{t_{\text{skew}}} \newcommand{\PipelineFlushDelay}{t_{\text{hw\_pipe}}} \newcommand{\PipelineIterationTime}{T_{\text{iteration}}} \newcommand{\PipelineParallelDegree}{N_{\text{PP}}} \newcommand{\PipelineTimeSlot}{t} \newcommand{\PipelinedExecutionTime}{T_{\text{pipelined}}} \newcommand{\PistonArea}{A} \newcommand{\PixelColumnCoordinate}{u} \newcommand{\PixelLastEventTime}{t_{\text{last}}} \newcommand{\PixelOpacityContribution}{\alpha'} \newcommand{\PixelRowCoordinate}{v} \newcommand{\PixelRowStandardDeviation}{\sigma_v} \newcommand{\PixelStandardDeviation}{\sigma_u} \newcommand{\PlacementChoiceCount}{n} \newcommand{\PlaintextInput}{m} \newcommand{\PlanAction}{a} \newcommand{\PlanarHomographyMatrix}{\mathbf{H}} \newcommand{\PlanarPositionEmbedding}{\mathbf{E}_{\text{pos}}^{2D}} \newcommand{\PlanarSpecialEuclideanGroup}{SE(2)} \newcommand{\PlanckConstant}{h} \newcommand{\PlanningOperator}{o} \newcommand{\PlanningStageLatency}{T_{\text{plan}}} \newcommand{\PlanningStartInstant}{t_{\text{plan}}} \newcommand{\PlantDynamicsFunction}{\mathbf{f}} \newcommand{\PlantDynamicsParameters}{\theta_{\text{plant}}} \newcommand{\PlantOutcomeFunction}{g} \newcommand{\PlantParameters}{m} \newcommand{\PlantStateAcceleration}{\ddot{\mathbf{x}}} \newcommand{\PlantStateComponentCount}{N_s} \newcommand{\PlantStateDimension}{n} \newcommand{\PlantStateRate}{\dot{\mathbf{x}}} \newcommand{\PlantStateSpace}{\mathcal{X}} \newcommand{\PlantTransitionDensity}{p_m} \newcommand{\PlantTransitionKernel}{\mathcal{T}} \newcommand{\PlatformAnnualOperationsCost}{C_{\text{after}}} \newcommand{\PlatformResourceCapacity}{\text{Cap}} \newcommand{\PlatformResourceIndex}{i} \newcommand{\PlatformTotalCost}{C_{\text{platform}}} \newcommand{\PlatformUtilization}{U_{\text{platform}}} \newcommand{\PointClearanceMargin}{d_{\text{margin}}} \newcommand{\PointToPointMessageSize}{n} \newcommand{\PointToPointTransferTime}{T} \newcommand{\PoisonedModel}{f_{\mathcal{S} \cup \mathcal{S}_{\text{poison}}}} \newcommand{\PoisoningDataset}{\mathcal{S}_{\text{poison}}} \newcommand{\PoisoningTargetDataset}{\mathcal{S}_{\text{test}}} \newcommand{\PoissonSubintervalCount}{n} \newcommand{\Policy}{\pi_\theta} \newcommand{\PolicyAction}{a} \newcommand{\PolicyActionStandardDeviation}{\sigma^{\pi}} \newcommand{\PolicyActionWindow}{\mathbf{A}_{t:t+H-1}} \newcommand{\PolicyCheckpoint}{v} \newcommand{\PolicyEnsembleCovariance}{\boldsymbol{\Sigma}_{\pi}} \newcommand{\PolicyEntropy}{\mathcal{H}} \newcommand{\PolicyGaussianMean}{\boldsymbol{\mu}_{\theta}} \newcommand{\PolicyGaussianMeanComponent}{\mu^{\pi}} \newcommand{\PolicyGaussianStandardDeviation}{\boldsymbol{\sigma}_{\theta}} \newcommand{\PolicyGradientBaseline}{b} \newcommand{\PolicyGradientEstimate}{\widehat{g}} \newcommand{\PolicyHistoryActionReturn}{Q^{\pi}} \newcommand{\PolicyHistoryAdvantage}{A^{\pi}} \newcommand{\PolicyImitationLoss}{\mathcal{L}_{\text{policy}}} \newcommand{\PolicyLipschitzBound}{L_{\text{lip}}} \newcommand{\PolicyObservedState}{s} \newcommand{\PolicyPassRate}{f} \newcommand{\PolicyProbabilityRatio}{\rho} \newcommand{\PolicyRemainingReturn}{V^{\pi}} \newcommand{\PolicyRequestLength}{S_{\pi}} \newcommand{\PolicyStateActionDistribution}{\rho_{\pi_\theta}} \newcommand{\PolicyTrajectoryDistribution}{p_\theta} \newcommand{\PolicyTti}{T_{\text{TTI}}} \newcommand{\PolicyUpdateStepTime}{T_{\text{step}}} \newcommand{\PolyakAveragingCoefficient}{\tau} \newcommand{\PolynomialCoefficientVector}{\mathbf{a}} \newcommand{\PolynomialTrajectoryCoefficient}{a} \newcommand{\PomdpActionSet}{\mathsf{A}} \newcommand{\PomdpObservationFunction}{\mathsf{O}} \newcommand{\PomdpObservationSet}{\Omega} \newcommand{\PomdpRewardFunction}{\mathsf{R}} \newcommand{\PomdpStateSpace}{\mathsf{S}} \newcommand{\PomdpTransitionFunction}{\mathsf{T}} \newcommand{\PoolResidentMemory}{M_{\text{pool}}} \newcommand{\PooledAcceptanceProbability}{\bar{p}} \newcommand{\PooledConversionRate}{\hat{p}} \newcommand{\PooledSampleApprovalRate}{\hat{p}} \newcommand{\PopulationStabilityBinCount}{n_{\text{bins}}} \newcommand{\PopulationStabilitySmoothingConstant}{\epsilon_{\text{smooth}}} \newcommand{\PortCycleNetEnergy}{\Delta E} \newcommand{\PortEffort}{\mathbf{F}} \newcommand{\PortFlow}{\dot{\mathbf{x}}} \newcommand{\PortInput}{\mathbf{u}} \newcommand{\PortOutput}{\mathbf{y}} \newcommand{\PortStoredEnergy}{E} \newcommand{\PortVelocity}{v} \newcommand{\Pose}{\mathbf{T}} \newcommand{\PoseTwistPerturbation}{\boldsymbol{\epsilon}} \newcommand{\PoseTwistPerturbationMatrix}{\hat{\boldsymbol{\epsilon}}} \newcommand{\PositionComponent}{p} \newcommand{\PositionConfidenceEllipsoidRadius}{\chi_{3,0.95}} \newcommand{\PositionErrorBound}{E} \newcommand{\PositionErrorCeiling}{e_{\max}} \newcommand{\PositionErrorCovariance}{\mathbf{P}_{pp}} \newcommand{\PositionErrorEnvelope}{e} \newcommand{\PositionLossMask}{m} \newcommand{\PositionUncertaintyRadius}{r} \newcommand{\PositionalTaskTolerance}{r_{\text{tol}}} \newcommand{\PositiveClassInput}{x_{+}} \newcommand{\PositiveIntegerExponent}{n} \newcommand{\PostContactDrivenStroke}{\Delta x_{\text{driven}}} \newcommand{\PostImpactNormalVelocity}{v_n^+} \newcommand{\PostRevocationDelay}{\tau_{\text{rev}}} \newcommand{\PosteriorCovarianceMatrix}{\boldsymbol{\Sigma}_{\text{post}}} \newcommand{\PosteriorDifferentialEntropy}{h_{\text{post}}} \newcommand{\PostprocessingLatency}{L_{\text{lat,post}}} \newcommand{\PotentialOutcome}{Y^{\text{pot}}} \newcommand{\PowerCriticalQuantile}{z_{\beta}} \newcommand{\PowerLimitBase}{a} \newcommand{\PowerRailInductance}{L_{\text{bus}}} \newcommand{\PowerRailResistance}{R_{\text{bus}}} \newcommand{\PoweredHoldCommand}{\mathbf{u}_{\text{hold}}} \newcommand{\PoweredHoldState}{\mathbf{x}_{\text{hold}}} \newcommand{\PoweredServerCount}{N} \newcommand{\PpoClippedSurrogateObjective}{\mathcal{L}^{\text{CLIP}}} \newcommand{\PqApproximateDistance}{\tilde{d}} \newcommand{\PqCentroidCode}{c^{\text{pq}}} \newcommand{\PqSubspaceIndex}{j} \newcommand{\PqSubvectorCount}{m} \newcommand{\PreForwardEnvironmentState}{\sigma_0} \newcommand{\PreImpactNormalVelocity}{v_n^-} \newcommand{\PreImpactSeparationDistance}{d_{\text{sep}}} \newcommand{\PrePivotCatchRate}{v} \newcommand{\PreTriggerWindowDuration}{T_{\text{pre}}} \newcommand{\PreactivationMatrix}{\mathbf{Z}} \newcommand{\PreactivationVector}{\mathbf{z}} \newcommand{\PrebrakeDelay}{\tau_{\text{delay}}} \newcommand{\PrebrakeDelayCeiling}{\tau_{\text{delay},\max}} \newcommand{\PredecessorGraphVertex}{u} \newcommand{\PredicateLipschitzConstant}{L_{\phi}} \newcommand{\PredicateNormalizationScale}{c} \newcommand{\PredictedActionComponent}{\hat{a}} \newcommand{\PredictedClassProbability}{p} \newcommand{\PredictedConfidence}{\hat{p}} \newcommand{\PredictedDecision}{\hat{Y}} \newcommand{\PredictedEnvironmentLatent}{\hat{\mathbf{z}}} \newcommand{\PredictedErrorCovariance}{\mathbf{P}_{k|k-1}} \newcommand{\PredictedForceReading}{\hat{y}} \newcommand{\PredictedOutput}{\hat{\mathbf{y}}} \newcommand{\PredictedOutputComponent}{\hat{y}} \newcommand{\PredictedPolicyAction}{\hat{\mathbf{a}}} \newcommand{\PredictedProtectedAttribute}{\hat{a}} \newcommand{\PredictedRelativeDepth}{z_{\text{pred}}} \newcommand{\PredictedStateEmbedding}{\mathbf{e}_{\text{state}}} \newcommand{\PredictedStateEstimate}{\hat{\mathbf{x}}_{k|k-1}} \newcommand{\PredictionHeadFunction}{g} \newcommand{\PredictionStepIndex}{i} \newcommand{\PredictiveEntropy}{H_{\text{pred}}} \newcommand{\PreemptionFanoutCount}{k} \newcommand{\PreemptionRate}{\lambda_{\text{preempt}}} \newcommand{\PreemptionTaxTime}{T_{\text{preempt}}} \newcommand{\PreferenceMargin}{z} \newcommand{\PreferencePairDataset}{\mathcal{D}} \newcommand{\PreferenceScale}{\beta} \newcommand{\PreferenceScoredPositionSet}{\mathcal{A}} \newcommand{\PreferredReferenceRelativeScore}{\Delta_w} \newcommand{\PreferredTrajectory}{\tau_w} \newcommand{\PrefetchBufferCount}{N_{\text{prefetch}}} \newcommand{\PrefillAllocatedTokenCount}{C} \newcommand{\PrefillArithmeticIntensity}{I_{\text{prefill}}} \newcommand{\PrefillChunkSize}{C_{\text{chunk}}} \newcommand{\PrefillOperations}{O_{\text{prefill}}} \newcommand{\PrefillRequestIndex}{i} \newcommand{\PrefillTime}{T_{\text{prefill}}} \newcommand{\PrefixHitRate}{\rho_{\text{prefix}}} \newcommand{\PregraspPosition}{\mathbf{p}_{\text{pre}}} \newcommand{\PreprocessingLatency}{L_{\text{lat,pre}}} \newcommand{\PreprocessingServiceTime}{T_{\text{preprocessing}}} \newcommand{\PreprocessingThroughput}{R_{\text{preprocessing}}} \newcommand{\PresaturationTorqueCommand}{\boldsymbol{\tau}_{\text{cmd}}} \newcommand{\PreviousLayerWidth}{n_{\ell-1}} \newcommand{\PreviousPeriodCost}{C_{\text{previous}}} \newcommand{\PreviousRangeObservationHistory}{z_{1:t-1}} \newcommand{\PreviousUpdatedErrorCovariance}{\mathbf{P}_{k-1|k-1}} \newcommand{\PreviousUpdatedStateEstimate}{\hat{\mathbf{x}}_{k-1|k-1}} \newcommand{\PrimitiveOperation}{\phi} \newcommand{\PrincipalPointColumn}{c_x} \newcommand{\PrincipalPointRow}{c_y} \newcommand{\PriorCovarianceMatrix}{\boldsymbol{\Sigma}_{\text{prior}}} \newcommand{\PriorDifferentialEntropy}{h_{\text{prior}}} \newcommand{\PriorStandardDeviation}{\sigma_0} \newcommand{\PriorTurnCount}{j} \newcommand{\PrivacyAdditiveSlack}{\delta} \newcommand{\PrivacyBudget}{\epsilon} \newcommand{\PrivacyLossVariable}{\mathcal{L}_{\text{priv}}} \newcommand{\PrivacyNoiseMultiplier}{\sigma} \newcommand{\PrivatizedQuery}{\tilde{f}} \newcommand{\PrivilegeTrapTime}{T_{\text{trap}}} \newcommand{\PrivilegedSimulatorState}{s_{\text{priv}}} \newcommand{\PrivilegedStateDimension}{d_{\text{priv}}} \newcommand{\PrivilegedStateEncoder}{E} \newcommand{\ProbabilityFunction}{p} \newcommand{\ProbabilitySimplex}{\Delta} \newcommand{\ProbedCellCount}{n_{\text{probe}}} \newcommand{\ProcessConditionCheckTime}{T_{\text{proc}}} \newcommand{\ProcessConditionPassProbability}{p_{\text{proc}}} \newcommand{\ProcessNoiseCovariance}{\mathbf{Q}} \newcommand{\ProcessNoiseIntensity}{\mathbf{Q}} \newcommand{\ProcessNoiseVector}{\mathbf{w}} \newcommand{\ProcessedDataVolume}{D_{\text{vol,processed}}} \newcommand{\ProcessedKeyTileIndex}{t} \newcommand{\ProcessedSampleCount}{N_{\text{samples}}} \newcommand{\ProcessingBufferCount}{N_{\text{processing}}} \newcommand{\ProcessingPrice}{R_{\text{process/GB}}} \newcommand{\ProductFactorIndex}{j} \newcommand{\ProductionExecutionCount}{N_{\text{prod}}} \newcommand{\ProductionModelCount}{N_{\text{models}}} \newcommand{\ProductionOnlyFailureCount}{n_{\text{prod}}} \newcommand{\ProfileAccelerationBound}{a_{\max}} \newcommand{\ProfileJerk}{\dot{a}} \newcommand{\ProgramGoodput}{\eta_{\text{program}}} \newcommand{\ProgramInvariantPredicate}{P} \newcommand{\ProgramState}{s} \newcommand{\ProgramStateSpace}{\Sigma} \newcommand{\ProjectedSeamState}{\hat{\mathbf{x}}_{\text{seam}}} \newcommand{\ProjectedTrajectoryRecord}{R} \newcommand{\ProjectedTurnGradientContribution}{Z} \newcommand{\ProjectionBallRadius}{\epsilon} \newcommand{\ProjectionConstraintSet}{\mathcal{C}} \newcommand{\ProjectiveDistanceSample}{s} \newcommand{\ProjectiveRayScale}{\lambda} \newcommand{\ProjectiveScaleFactor}{s} \newcommand{\PromotedFusionInputRank}{r'} \newcommand{\PromptLength}{S_{\text{prompt}}} \newcommand{\PromptToken}{x} \newcommand{\PromptTokensSent}{S_{\text{sent}}} \newcommand{\PropagatedPositionStandardDeviation}{\sigma_p} \newcommand{\PropensityPriorApprovalShape}{a} \newcommand{\PropensityPriorRejectionShape}{b} \newcommand{\ProportionTestStatistic}{z} \newcommand{\ProportionalGainMatrix}{\mathbf{K}_{p}} \newcommand{\ProportionalPotentialEnergy}{\mathcal{L}_{\text{pos}}} \newcommand{\ProposalDeserializationTime}{t_{\text{deser}}} \newcommand{\ProposalExpiryInstant}{t_{\text{valid}}} \newcommand{\ProposalFirstWaypoint}{\mathbf{a}_0} \newcommand{\ProposalLinkTransportTime}{t_{\text{link}}} \newcommand{\ProposalParameterVector}{\boldsymbol{\psi}} \newcommand{\ProposalPayload}{\mathcal{P}} \newcommand{\ProposedAccess}{r} \newcommand{\ProposedContactForce}{F_{\text{nom}}} \newcommand{\ProposedEndEffectorPoseSequence}{\mathbf{X}_{1:H}} \newcommand{\ProposedGripperCommandSequence}{\mathbf{g}_{1:H}} \newcommand{\ProposedJointPositionSequence}{\mathbf{Q}_{1:H}} \newcommand{\ProposedJointVelocitySequence}{\dot{\mathbf{Q}}_{1:H}} \newcommand{\ProposedOperation}{o} \newcommand{\ProposerConfidenceScore}{\hat{p}} \newcommand{\ProposerEvaluationRate}{f} \newcommand{\ProposerInferenceTime}{t_{\text{infer}}} \newcommand{\ProprioceptiveInputSpace}{\mathcal{X}} \newcommand{\ProprioceptiveInputVector}{\mathbf{x}} \newcommand{\ProprioceptiveTokenEmbeddings}{\mathbf{z}_{\text{proprio}}} \newcommand{\ProtectedAttribute}{a} \newcommand{\ProtectedGroupMembership}{G} \newcommand{\ProtectedTrainingRecord}{R} \newcommand{\ProtectionSwitchResistance}{R_{\text{switch}}} \newcommand{\ProtectiveClearanceMargin}{\delta_{\text{margin}}} \newcommand{\ProtectiveSeparationDistance}{S_p} \newcommand{\ProtectiveSpringStiffness}{k_{\text{spring}}} \newcommand{\ProtectiveSpringTravel}{\delta} \newcommand{\ProxyTrajectoryReward}{\hat{R}} \newcommand{\PrunedWeightMatrix}{\hat{\mathbf{W}}} \newcommand{\PruningMask}{\mathbf{M}} \newcommand{\PruningMaskEntry}{M_{i,j}} \newcommand{\PruningThreshold}{\delta_{\text{prune}}} \newcommand{\PsuMttf}{\text{MTTF}_{\text{psu}}} \newcommand{\PtpExchangeTimestamp}{t} \newcommand{\PtpForwardPathDelay}{T_{\text{prop}, M \to S}} \newcommand{\PtpHardwareTimestamp}{t_{\text{PTP}}} \newcommand{\PtpPropagationDelay}{T_{\text{prop}}} \newcommand{\PtpReversePathDelay}{T_{\text{prop}, S \to M}} \newcommand{\PublicationEpoch}{t_{\text{pub}}} \newcommand{\PufChallenge}{C} \newcommand{\PufResponse}{R} \newcommand{\PufResponseBit}{r} \newcommand{\PulseRoundTripTime}{\Delta t} \newcommand{\PureNoiseActionChunk}{\mathbf{A}^N} \newcommand{\PureTransportDelay}{T_d} \newcommand{\PwmPeriod}{T_{\text{pwm}}} \newcommand{\QuadratureAxisInductance}{L_q} \newcommand{\QuadratureAxisVoltage}{v_q} \newcommand{\QualifiedAdmissionRate}{r} \newcommand{\QualityObjective}{S_{\text{quality}}} \newcommand{\QuantileLevel}{u} \newcommand{\QuantileProbabilityLevel}{q} \newcommand{\QuantileThresholdCandidate}{x} \newcommand{\QuantizationBitWidth}{b} \newcommand{\QuantizationBlockSize}{b_{\text{block}}} \newcommand{\QuantizationScale}{s} \newcommand{\QuantizationStep}{\delta} \newcommand{\QuantizationZeroPoint}{z} \newcommand{\QuantizedGradient}{\mathbf{g}_{\text{int8}}} \newcommand{\QuantizedIntegerCode}{x_q} \newcommand{\QuantizedWeightEntry}{W_{ik}} \newcommand{\QuantizerInput}{x} \newcommand{\QuarterCycleCompressionTime}{t_{\text{peak}}} \newcommand{\QueryAxisLabel}{i} \newcommand{\QueryBlockCount}{T_r} \newcommand{\QueryBlockIndex}{i} \newcommand{\QueryBlockSize}{B_r} \newcommand{\QueryBoundaryCount}{S_{\text{eff}}} \newcommand{\QueryBufferPosition}{i} \newcommand{\QueryComponent}{q_{im}} \newcommand{\QueryPrice}{p_{\text{query}}} \newcommand{\QueryProjectionMatrix}{\mathbf{W}_{Q}} \newcommand{\QuerySensitivity}{\Delta} \newcommand{\QuerySourceMatrix}{\mathbf{X}_{Q}} \newcommand{\QueryVector}{\mathbf{q}} \newcommand{\QueryWord}{q} \newcommand{\QueryWordDocumentFrequency}{n} \newcommand{\QueryWordFrequency}{f} \newcommand{\QueryWorkspaceGeneration}{g_q} \newcommand{\QueueArrivalTime}{t_{\text{arr}, i}} \newcommand{\QueueServerCount}{c} \newcommand{\QueueServiceVariationCoefficient}{c_{s}} \newcommand{\QueueSystemCapacity}{K} \newcommand{\QueueWaitTime}{W_{q}} \newcommand{\QueuedJobCount}{N_{\text{queue}}} \newcommand{\QueuedTransactionBytes}{D_{\text{vol}}} \newcommand{\QueuedTransactionCount}{K} \newcommand{\QueuedTransactionSet}{\mathcal{Q}} \newcommand{\QueueingLatency}{L_{\text{lat,queue}}} \newcommand{\QuiescentJunctionTemperature}{T_{\text{j},\text{target}}} \newcommand{\QuiescentSocPower}{P_{\text{base}}} \newcommand{\QuinticBlendCoefficient}{\mathbf{a}} \newcommand{\QuotaReductionSensitivity}{\gamma_{\text{rate}}} \newcommand{\RadarRangeResolution}{\Delta R} \newcommand{\RadialBasisKernelCoefficient}{\gamma} \newcommand{\RadialDistortionCoefficient}{k} \newcommand{\RadialRange}{R} \newcommand{\RadialRangeStandardDeviation}{\sigma_R} \newcommand{\RadiationWavelength}{\lambda} \newcommand{\RailVoltageTolerance}{\delta_{\text{tol}}} \newcommand{\RandomEnvironmentState}{S} \newcommand{\RandomRetainedElementCount}{K_{\text{rand}}} \newcommand{\RandomSampleCollectionSize}{D_{\text{eval,total}}} \newcommand{\RandomVectorDimension}{d} \newcommand{\RandomizationClusterCount}{K} \newcommand{\RandomizedMechanism}{\mathcal{M}} \newcommand{\RandomizedSmoothingNoise}{\boldsymbol{\delta}} \newcommand{\RangeObservation}{z} \newcommand{\RangeObservationHistory}{z_{1:t}} \newcommand{\RankComponentIndex}{s} \newcommand{\RankConstrainedMatrix}{\mathbf{A}} \newcommand{\RankContribution}{x} \newcommand{\RankCountBinaryExponent}{m} \newcommand{\RankFusionSmoothingConstant}{k_{\text{rrf}}} \newcommand{\RankIndex}{i} \newcommand{\RankReductionResult}{y} \newcommand{\RankingFunction}{V} \newcommand{\RatedActuatorTorque}{\tau_{\text{rated}}} \newcommand{\RatedCurrentEquilibriumTemperature}{T_{\text{eq}}} \newcommand{\RatedFatigueLife}{L_{10}} \newcommand{\RatedJointTorque}{\boldsymbol{\tau}_{\text{rated}}} \newcommand{\RatingCategory}{y} \newcommand{\RatioClippingWidth}{\epsilon_{\text{clip}}} \newcommand{\RationaleTokens}{z} \newcommand{\RawClearanceBarrierFunction}{h_{\text{raw}}} \newcommand{\RawDataUploadEnergy}{E_{\text{raw}}} \newcommand{\RawHardwareFaultRate}{\lambda_{\text{raw}}} \newcommand{\RawPipelineInput}{x} \newcommand{\RawRecordCount}{N} \newcommand{\RawSensoryData}{\mathbf{S}} \newcommand{\RayReturnRange}{r_{\text{hit}}} \newcommand{\RayStepCount}{N_{\text{steps}}} \newcommand{\RayTraversalLength}{d_{\text{ray}}} \newcommand{\RayVoxelRange}{r_{\text{voxel}}} \newcommand{\RayleighDissipationFunction}{\mathcal{D}} \newcommand{\ReachabilityCostate}{\mathbf{p}} \newcommand{\ReachabilityHamiltonian}{\mathcal{H}} \newcommand{\ReachabilityHorizonInstant}{t'} \newcommand{\ReachabilityLevelFunction}{V} \newcommand{\ReachabilityTerminalTime}{T} \newcommand{\ReachableArtifactNode}{u} \newcommand{\ReachableDistance}{d_{\text{reach}}} \newcommand{\ReachableWorkspace}{\mathcal{W}} \newcommand{\ReadEndSequenceCount}{c_{\text{end}}} \newcommand{\ReadStartSequenceCount}{c_{\text{start}}} \newcommand{\ReadTimeCeiling}{R} \newcommand{\RealDataset}{\mathcal{S}_{\text{real}}} \newcommand{\RealTimeTaskIndex}{i} \newcommand{\RealityGapVector}{\boldsymbol{\Delta}_{\text{sim2real}}} \newcommand{\RealizedActuatorEffort}{u_{\text{act}}} \newcommand{\RealizedArrivalCount}{n} \newcommand{\RealizedDamageOutcome}{y} \newcommand{\RealizedDampingPower}{P_d} \newcommand{\RealizedDeviceComputeRate}{R} \newcommand{\RealizedFalseAlarmProbability}{\alpha_{*}} \newcommand{\RealizedMissedDegradationProbability}{\beta_{*}} \newcommand{\RealizedServiceTime}{s} \newcommand{\ReceiptSampleIndex}{t_{\text{recv}}} \newcommand{\ReceiveBandwidth}{\text{BW}_{\text{rx}}} \newcommand{\ReceiverOverhead}{o_{\text{recv}}} \newcommand{\ReceiverTimingJitter}{\sigma_{\Delta t}} \newcommand{\RecentUsageShare}{F_{\text{actual}}} \newcommand{\RecommenderItemCount}{N_{\text{items}}} \newcommand{\RecommenderUserCount}{N_{\text{users}}} \newcommand{\ReconcilableToolInterface}{\mathbb{T}_{a}} \newcommand{\ReconstructedGradient}{\hat{\mathbf{g}}} \newcommand{\ReconstructedWeight}{\hat{w}} \newcommand{\RecordAdequacyPassProbability}{p_{\text{record}}} \newcommand{\RecordSizeCeiling}{s_{\max}} \newcommand{\RecordedAuthorityState}{S_{\text{auth}}} \newcommand{\RecoveryCompletionInstant}{t_{\text{rec}}} \newcommand{\RecoveryPoseTolerance}{\epsilon_{\text{sync}}} \newcommand{\RecoveryTargetLogPosition}{j_{\text{target}}} \newcommand{\RecoveryWarmupTime}{T_{\text{warmup}}} \newcommand{\RecurrentHiddenBias}{\mathbf{b}_{\text{h}}} \newcommand{\RecurrentHiddenState}{\mathbf{h}} \newcommand{\RecurrentInputWeights}{\mathbf{W}_{\text{hx}}} \newcommand{\RecurrentOutputWeights}{\mathbf{W}_{\text{yh}}} \newcommand{\RecurrentStateWeights}{\mathbf{W}_{\text{hh}}} \newcommand{\ReduceScatterCompletionTime}{T_{\text{reducescatter}}} \newcommand{\ReducedBoundaryConditionVector}{\mathbf{b}_{\text{red}}} \newcommand{\ReducedImpactMass}{m_{\text{red}}} \newcommand{\ReducibleLoss}{\hat{\mathcal{L}}} \newcommand{\ReductionInputCount}{n} \newcommand{\RedundantComponentCount}{N_{\text{red}}} \newcommand{\RedundantReplicaCount}{k} \newcommand{\RedundantServiceAvailability}{A_{\text{system}}} \newcommand{\ReferenceActionDisadvantage}{A_t^{\pi^*}} \newcommand{\ReferenceAssessedFailure}{F} \newcommand{\ReferenceBinIndex}{b} \newcommand{\ReferenceBinProportion}{E} \newcommand{\ReferenceCostToGo}{Q_t^{\pi^*}} \newcommand{\ReferenceDisagreementProbability}{\mathcal{L}} \newcommand{\ReferenceDistribution}{p} \newcommand{\ReferenceJointAccelerations}{\ddot{\mathbf{q}}^{\text{ref}}} \newcommand{\ReferenceJointPosition}{q_{\text{reference}}} \newcommand{\ReferenceJointPositions}{\mathbf{q}^{\text{ref}}} \newcommand{\ReferenceJointVelocities}{\dot{\mathbf{q}}^{\text{ref}}} \newcommand{\ReferenceLogProbabilitySum}{\Delta_{\text{ref}}} \newcommand{\ReferenceMixingProbability}{\lambda} \newcommand{\ReferenceNextTokenDistribution}{q} \newcommand{\ReferencePosition}{\mathbf{r}} \newcommand{\ReferenceProbabilityRatio}{z} \newcommand{\ReferenceRelativeScore}{\Delta_\theta} \newcommand{\ReferenceRequestLength}{S_{\text{ref}}} \newcommand{\ReferenceSampleEmpiricalCdf}{F} \newcommand{\ReferenceStateDisagreementRate}{\epsilon_E} \newcommand{\ReferenceStateDistribution}{d_{\pi^*}} \newcommand{\ReferenceStepDisagreementRate}{\epsilon} \newcommand{\ReferenceWindingResistance}{R_0} \newcommand{\ReflectedContactForce}{F_{\text{contact}}} \newcommand{\ReflectedRotorInertia}{J_{\text{ref}}} \newcommand{\ReflectedRotorInertiaMatrix}{\mathbf{J}_m} \newcommand{\ReflectedTransmissionInputInertia}{J_{\text{ref,in}}} \newcommand{\ReflectionAngle}{\theta_{\text{refl}}} \newcommand{\ReflexCollisionBudget}{T_{\text{reflex\_budget}}} \newcommand{\RegeneratedBrakingEnergy}{E_{\text{regen}}} \newcommand{\RegenerativeBrakingTorque}{\tau_{\text{brake}}} \newcommand{\RegenerativeRecoveryEfficiency}{\eta_{\text{regen}}} \newcommand{\RegisterSetupTime}{t_{\text{setup}}} \newcommand{\RegisteredDescriptorCount}{n_{\text{reg}}} \newcommand{\RegularizedEulerIntegral}{I} \newcommand{\RejectionDecodeStep}{t_{\text{cut}}} \newcommand{\RelationalSelection}{\sigma} \newcommand{\RelativeContrastTolerance}{\epsilon_{\text{contrast}}} \newcommand{\RelativeDeviationBound}{\delta} \newcommand{\RelativeImprovementFraction}{\delta} \newcommand{\RelativeStandardError}{r} \newcommand{\RelevantRecordSet}{\mathcal{D}^*} \newcommand{\ReliabilityTargetIndex}{i} \newcommand{\ReliableDetectionFrameCount}{N_{\text{frames}}} \newcommand{\RemainingCallCount}{N_{\text{rem}}} \newcommand{\RemainingDistanceEstimate}{\hat{s}} \newcommand{\RemainingExecutionLease}{T_{\text{lease,rem}}} \newcommand{\RemainingHarmDistance}{d_{\text{rem}}} \newcommand{\RemainingIntentTime}{T_{\text{rem}}} \newcommand{\RemainingReturn}{R_{\geq k}} \newcommand{\RemainingUprightDistance}{s} \newcommand{\RemoteHardwareEfficiency}{\eta_{\text{hw,remote}}} \newcommand{\RemotePathTime}{T_{\text{remote}}} \newcommand{\RemotePeakRate}{R_{\text{peak,remote}}} \newcommand{\RenderedPixelColor}{C} \newcommand{\RenewalJitterAllowance}{T_{\text{jitter}}} \newcommand{\RenyiDivergence}{\mathcal{D}_{\alpha_{\text{R}}}} \newcommand{\RenyiOrder}{\alpha_{\text{R}}} \newcommand{\RenyiPrivacyBudget}{\epsilon_{\text{R}}} \newcommand{\RepairAttemptCost}{C_{\text{repair}}} \newcommand{\RepairCap}{K_{\text{repair}}} \newcommand{\RepairCapabilityGrant}{\Gamma_{\text{repair}}} \newcommand{\RepairFirstCost}{C_{\text{repair\ first}}} \newcommand{\RepairPatchArtifact}{P} \newcommand{\RepairSuccessProbability}{p} \newcommand{\RepairTurnLatency}{T_{\text{repair}}} \newcommand{\ReparameterizationNoise}{\boldsymbol{\epsilon}} \newcommand{\RepeatedRunCount}{k} \newcommand{\RepeatedRunMean}{\mu_{\text{run}}} \newcommand{\RepeatedRunStandardDeviation}{\sigma_{\text{run}}} \newcommand{\ReplacementLatency}{L} \newcommand{\ReplacementTimingReserve}{T_{\text{reserve}}} \newcommand{\ReplanRequestOffset}{T_{\text{request}}} \newcommand{\ReplayBuffer}{\mathcal{M}} \newcommand{\ReplayBufferTransitionCount}{n_{\text{replay}}} \newcommand{\ReplayedErrorCovariance}{\mathbf{P}_{t_{\text{recv}}}} \newcommand{\ReplayedStateEstimate}{\hat{\mathbf{x}}_{t_{\text{recv}}}} \newcommand{\ReplicaAvailability}{A_{\text{single}}} \newcommand{\ReplicaColdStartTime}{T_{\text{cold-start}}} \newcommand{\ReplicaCount}{R} \newcommand{\ReplicaModelLoadTime}{T_{\text{load}}} \newcommand{\ReplicaProvisioningTime}{T_{\text{provision}}} \newcommand{\ReplicaWarmupTime}{T_{\text{warmup}}} \newcommand{\ReplyLossProbability}{q_{\text{rep}}} \newcommand{\RepositoryEdgeSourceIndex}{i} \newcommand{\RepositoryEdgeTargetIndex}{j} \newcommand{\RepositoryEdgeWeight}{A} \newcommand{\RepositoryEdgeWeightMatrix}{\mathbf{A}} \newcommand{\RepositoryFileCount}{n} \newcommand{\RepositoryGraphEdgeSet}{E} \newcommand{\RepositoryGraphVertexSet}{V} \newcommand{\RepositoryTransitionMatrix}{\mathbf{P}_{\text{graph}}} \newcommand{\ReprojectionResidual}{\epsilon_{\text{reproj}}} \newcommand{\RepublicationIndex}{k} \newcommand{\RepublicationPeriod}{T_{\text{rep}}} \newcommand{\RequantizationScale}{s_{\text{eff}}} \newcommand{\RequestCompressionRatio}{\gamma_{\text{req}}} \newcommand{\RequestConcurrency}{Q_{\text{req}}} \newcommand{\RequestLossProbability}{q_{\text{req}}} \newcommand{\RequestOutputLength}{S} \newcommand{\RequestPromptTokens}{\mathbf{x}} \newcommand{\RequestQueueTime}{T_{\text{queue}}} \newcommand{\RequestResidenceTime}{W} \newcommand{\RequestResponseTime}{t} \newcommand{\RequestSeenBatchSize}{B_{\text{req}}} \newcommand{\RequestServiceTime}{T_{\text{svc}}} \newcommand{\RequestTimeInSystem}{T_{\text{lat}}} \newcommand{\RequestedActionTap}{a_{\text{req}}} \newcommand{\RequiredClearance}{C_{\text{safe}}} \newcommand{\RequiredComponentCount}{N} \newcommand{\RequiredDetectionRange}{d_{\text{detect}}} \newcommand{\RequiredInputBandwidth}{\text{BW}_{\text{required}}} \newcommand{\RequiredMemoryBandwidth}{\text{BW}_{\text{req}}} \newcommand{\RequiredPremiseClaim}{P} \newcommand{\RequiredPremiseConfidence}{p} \newcommand{\RequiredPremiseCount}{n} \newcommand{\RequiredResultCount}{k} \newcommand{\RequiredScenarioCellCount}{N_{\text{req}}} \newcommand{\RequiredScenarioSet}{\mathcal{S}_{\text{req}}} \newcommand{\RequiredServiceRate}{\mu_{\text{required}}} \newcommand{\RequiredTaskPairCount}{N'} \newcommand{\RequiredUsersPerVariant}{n} \newcommand{\ResampledReplacementToken}{T_4'} \newcommand{\ReservedDeviceMemory}{M_{\text{reserve}}} \newcommand{\ResetCalibrationTime}{t_{\text{calibration}}} \newcommand{\ResetDuration}{t_{\text{rst}}} \newcommand{\ResetLatency}{T_{\text{reset}}} \newcommand{\ResidentStopDistance}{d_{\text{suffix}}} \newcommand{\ResidentWeightMemory}{M_{\text{weights,resident}}} \newcommand{\ResidualAdapterFunction}{A} \newcommand{\ResidualBlockOutput}{\mathbf{y}} \newcommand{\ResidualCorrectionCeiling}{\Delta_{\max}} \newcommand{\ResidualDynamicsPerturbation}{\Delta \mathbf{f}} \newcommand{\ResidualFrequencyError}{\Delta f_{\text{res}}} \newcommand{\ResidualFunction}{\mathcal{F}} \newcommand{\ResidualGate}{g} \newcommand{\ResidualPolicyTorque}{\boldsymbol{\tau}_{\text{res},\theta}} \newcommand{\ResidualSamplingDistribution}{p_{\text{res}}} \newcommand{\ResizedWorkerCount}{N_{\text{new}}} \newcommand{\ResolutionScalingRatio}{\gamma} \newcommand{\ResourceChangeRate}{r_{\text{chg}}} \newcommand{\ResourceCostBudget}{C_{\text{max}}} \newcommand{\ResourceTypeIndex}{r} \newcommand{\ResourceUtilization}{U} \newcommand{\ResponseActionTokens}{a} \newcommand{\ResponseMetadata}{\mathbf{m}} \newcommand{\ResponsePayload}{\mathbf{y}} \newcommand{\ResponseReward}{r} \newcommand{\ResponseThreshold}{\tau} \newcommand{\ResponseTimeDistributionFunction}{F} \newcommand{\ResponseTimeIterationIndex}{\ell} \newcommand{\ResponseTimeStandardDeviation}{\sigma_t} \newcommand{\RestConfiguration}{\mathbf{q}_{\text{rest}}} \newcommand{\RestitutionCoefficient}{e} \newcommand{\RestoreWorkerCount}{w} \newcommand{\RestrictedAccelerationBound}{a_{\text{restricted}}} \newcommand{\RestrictedSpeedBound}{v_{\text{restricted}}} \newcommand{\ResultActionTime}{T_{\text{action}}} \newcommand{\ResumeTime}{T_{\text{resume}}} \newcommand{\RetainedDigestCount}{m} \newcommand{\RetainedGradientElementCount}{K_{\text{top}}} \newcommand{\RetainedProductiveTime}{T_{\text{productive}}} \newcommand{\RetainedSpectralEnergyFraction}{\eta_r} \newcommand{\RetainingCallCount}{H_{\text{rem}}} \newcommand{\RetiringChunkJointVelocity}{\dot{q}_A} \newcommand{\RetiringChunkReferenceState}{\mathbf{x}_A} \newcommand{\RetrainingComputeCost}{C_{\text{compute}}} \newcommand{\RetrainingDeploymentCost}{C_{\text{deployment}}} \newcommand{\RetrainingInterval}{T} \newcommand{\RetrainingRiskCost}{C_{\text{risk}}} \newcommand{\RetrainingRunCost}{C} \newcommand{\RetrainingValidationCost}{C_{\text{validation}}} \newcommand{\RetrievalCollectionSize}{N} \newcommand{\RetrievalCutoffCount}{k} \newcommand{\RetrievalMethodIndex}{i} \newcommand{\RetrievedRecordSet}{\mathcal{R}} \newcommand{\RetryAttemptIndex}{j} \newcommand{\RetryBackoffInterval}{b} \newcommand{\RetryJitterDelay}{d} \newcommand{\ReturnLevel}{z} \newcommand{\ReturnPeriodTrialCount}{T} \newcommand{\ReturnStepOffset}{k} \newcommand{\ReturnedClassLabel}{c} \newcommand{\ReusedPrefixLength}{S_{\text{match}}} \newcommand{\ReverseModeWorkConstant}{C} \newcommand{\ReverseTransitionCovariance}{\boldsymbol{\Sigma}} \newcommand{\ReverseTransitionMean}{\boldsymbol{\mu}_\theta} \newcommand{\RevertFidelity}{\rho_{\text{revert}}} \newcommand{\ReviewerFalseApprovalIndicator}{X} \newcommand{\ReviewerIndex}{j} \newcommand{\RevisionPassProbability}{p_{\text{rev}}} \newcommand{\Reward}{r} \newcommand{\RewardFunction}{r} \newcommand{\RewardModel}{r} \newcommand{\RightEvasionAction}{\mathbf{a}_{\text{right}}} \newcommand{\RightSingularVectorMatrix}{\mathbf{Q}} \newcommand{\RigidGangJob}{J} \newcommand{\RigidImpactInstant}{t_{\text{impact}}} \newcommand{\RigidTransformTranslation}{\mathbf{t}} \newcommand{\RingAllReduceBandwidthTime}{T_{\text{bandwidth}}} \newcommand{\RingAllReduceCompletionTime}{T_{\text{ring}}} \newcommand{\RingAllReduceStartupTime}{T_{\text{latency}}} \newcommand{\RingBufferHorizon}{T_{\text{buffer}}} \newcommand{\RingBufferSlotCount}{N_{\text{buffer}}} \newcommand{\RingStepIndex}{s} \newcommand{\RingTreeCrossoverPayload}{M_{\text{crossover}}} \newcommand{\RmsMotorTorque}{\tau_{\text{rms}}} \newcommand{\RmspropSquaredGradientAverage}{s} \newcommand{\RobotAction}{\mathbf{a}} \newcommand{\RobotApproachSpeed}{v_r} \newcommand{\RobotApproachVelocity}{v_{\text{robot}}} \newcommand{\RobotObservation}{\mathbf{o}} \newcommand{\RobotPosition}{x_{\text{robot}}} \newcommand{\RobotPositionUncertainty}{Z_r} \newcommand{\RobotReactionTime}{T_r} \newcommand{\RobotReactionTravel}{S_r} \newcommand{\RobotStoppingTravel}{S_s} \newcommand{\RobotStructuralStiffness}{k_{\text{robot}}} \newcommand{\RobotTransitVolume}{\mathcal{T}_{\text{robot}}} \newcommand{\RollingShutterDistortion}{\Delta \mathbf{x}} \newcommand{\RollingShutterFrameSkew}{\Delta t_{\text{skew}}} \newcommand{\RollingShutterRowReadout}{t_{\text{row}}} \newcommand{\RolloutAction}{a} \newcommand{\RolloutActionSequence}{\mathbf{a}_{0:T}} \newcommand{\RolloutAdmissionAge}{\Delta T_{\text{rollout}}} \newcommand{\RolloutAssessmentTime}{T_{v}} \newcommand{\RolloutDuration}{T_{\text{rollout}}} \newcommand{\RolloutEnvironmentState}{s} \newcommand{\RolloutHorizon}{T} \newcommand{\RolloutLoss}{\mathcal{L}} \newcommand{\RolloutPolicyParameters}{\theta_{\text{old}}} \newcommand{\RolloutPolicyTokenCount}{N} \newcommand{\RolloutStateSequence}{s_{0:T}} \newcommand{\RolloutStepCount}{N} \newcommand{\RolloutStepIndex}{k} \newcommand{\RolloutSurrogateObjective}{\mathcal{L}} \newcommand{\RolloutTurnIndex}{k} \newcommand{\RooflineRidgePoint}{I_{\text{ridge}}} \newcommand{\RotaryRotationMatrix}{\mathbf{R}} \newcommand{\RotatedActivationMatrix}{\mathbf{X}'} \newcommand{\RotatedWeightMatrix}{\mathbf{W}'} \newcommand{\RotatingBodyAngularSpeed}{\omega} \newcommand{\RotatingBodyInertia}{J} \newcommand{\RotationOriginAcceleration}{\mathbf{a}_O} \newcommand{\RotationOriginVelocity}{\mathbf{v}_O} \newcommand{\RotationalKineticEnergy}{E_{k,\text{rot}}} \newcommand{\RotationalSpringStiffness}{K} \newcommand{\RotorAngularSpeed}{\omega_m} \newcommand{\RotorInertia}{J_{\text{rotor}}} \newcommand{\RotorPolePairCount}{N_{\text{poles}}} \newcommand{\RoundCommunicationVolume}{M_r} \newcommand{\RoundDownloadVolume}{M_{\text{download},r}} \newcommand{\RoundDuration}{t_r} \newcommand{\RoundEmittedTokenCount}{N_{\text{emit}}} \newcommand{\RoundProtocolVolume}{M_{\text{protocol},r}} \newcommand{\RoundRetryVolume}{M_{\text{retry},r}} \newcommand{\RoundSampleCount}{n_{\text{round}}} \newcommand{\RoundUploadVolume}{M_{\text{upload},r}} \newcommand{\RoundedClassProbability}{p^{\text{rnd}}} \newcommand{\RoundingDecimalCount}{d_{\text{dec}}} \newcommand{\RoutedExpertCount}{k_{\text{experts}}} \newcommand{\RouterGateProbability}{p_{\text{gate}}} \newcommand{\RowActivationDelay}{t_{\text{RCD}}} \newcommand{\RowActiveTime}{t_{\text{RAS}}} \newcommand{\RowAttitudeIncrement}{\Delta \boldsymbol{\theta}_{\text{att}}} \newcommand{\RowConflictCount}{N_{\text{conflict}}} \newcommand{\RowCycleTime}{t_{\text{RC}}} \newcommand{\RowExposureStartTime}{t_{\text{scan}}} \newcommand{\RowModeComponentVector}{\mathbf{a}_s} \newcommand{\RowModeFactorMatrix}{\mathbf{A}} \newcommand{\RowModeFactorSlice}{\mathbf{a}} \newcommand{\RowParallelOutputMatrix}{\mathbf{Z}} \newcommand{\RowParallelWeightMatrix}{\mathbf{B}} \newcommand{\RowPrechargeTime}{t_{\text{RP}}} \newcommand{\RunIndexSubset}{J} \newcommand{\RuntimeGoodput}{\eta_{\text{runtime}}} \newcommand{\RuntimeReserveMemory}{M_{\text{runtime}}} \newcommand{\SCurveAccelerationPhaseTime}{T_{\text{acc}}} \newcommand{\SafeApproachSpeedEnvelope}{v_{\text{safe}}} \newcommand{\SafeControlSet}{\mathcal{U}_{\text{safe}}} \newcommand{\SafeOverrideCommand}{\mathbf{u}_{\text{safe}}} \newcommand{\SafeSeparationDistance}{d_{\text{safe}}} \newcommand{\SafeSetProjection}{\mathcal{P}_{\mathcal{C}}} \newcommand{\SafeStateConstraintSet}{\mathcal{X}_{\text{safe}}} \newcommand{\SafeStateSet}{\mathcal{X}_{\text{safe}}} \newcommand{\SafeWorldState}{s_A} \newcommand{\SafeguardSeparationDistance}{S} \newcommand{\SafeguardStoppingTime}{T} \newcommand{\SafetyBoundaryManifold}{\partial \mathcal{C}} \newcommand{\SagaCompensatingStep}{C} \newcommand{\SagaFailedForwardStep}{F_k^{\text{fail}}} \newcommand{\SagaForwardStep}{F} \newcommand{\SagaStepIndex}{k} \newcommand{\SampleAcquisitionPrice}{c_{\text{sample}}} \newcommand{\SampleGradientStandardDeviation}{\sigma} \newcommand{\SampleLabelingPrice}{c_{\text{label}}} \newcommand{\SampleStatistic}{\widehat{\theta}} \newcommand{\SampleStorageSize}{s_{\text{sample}}} \newcommand{\SampledPolicyToken}{w} \newcommand{\SampledSimulationParameterVector}{\tilde{\boldsymbol{\xi}}} \newcommand{\SampledUnit}{y} \newcommand{\SampledUnitCount}{m} \newcommand{\SamplingParameters}{\mathbf{\Theta}_{\text{sample}}} \newcommand{\SamplingPeriod}{T_s} \newcommand{\SamplingRate}{f_s} \newcommand{\SamplingTemperature}{\tau_{\text{temp}}} \newcommand{\SandboxColdBootTime}{T_{\text{cold}}} \newcommand{\SaturatedJointTorque}{\boldsymbol{\tau}_{\text{act}}} \newcommand{\SavedEngineeringTime}{T_{\text{saved}}} \newcommand{\ScalarFieldSize}{k} \newcommand{\ScalarGraphFunction}{f} \newcommand{\ScalarKalmanGain}{g} \newcommand{\ScalarTrackingError}{e} \newcommand{\ScalarTrackingErrorAcceleration}{\ddot{e}} \newcommand{\ScalarTrackingErrorRate}{\dot{e}} \newcommand{\ScaleCoefficient}{A_{\mathcal{L}}} \newcommand{\ScaledBatchSize}{B_{\text{new}}} \newcommand{\ScaledJointStiffnessMatrix}{\tilde{\mathbf{K}}} \newcommand{\ScaledLearningRate}{\eta_{\text{new}}} \newcommand{\ScaledResource}{X} \newcommand{\ScaledSerialFraction}{s} \newcommand{\ScalingCurveWorkerCount}{k} \newcommand{\ScalingEfficiency}{\eta_{\text{scaling}}} \newcommand{\ScalingExponent}{\alpha_{\text{scale}}} \newcommand{\ScalingLawLoss}{\mathcal{L}} \newcommand{\ScanCapabilityGrant}{\Gamma_{\text{scan}}} \newcommand{\ScatteringCrossSection}{\sigma_s} \newcommand{\ScenarioCellRecordCount}{N_{\text{cell}}} \newcommand{\SceneRadiance}{I} \newcommand{\ScheduleFinishTime}{T_{\text{finish}}} \newcommand{\ScheduledSessionDuration}{T_{\text{sched}}} \newcommand{\SchedulingClassWeight}{w} \newcommand{\SchedulingGoodput}{\eta_{\text{scheduling}}} \newcommand{\SchedulingIntervalLength}{t} \newcommand{\ScoreNoiseStandardDeviation}{\sigma} \newcommand{\ScoreNoiseVector}{\mathbf{z}} \newcommand{\ScoreRefreshInterval}{k_{\text{refresh}}} \newcommand{\ScoredPrefixLength}{S_{\text{step}}} \newcommand{\ScoredStepCount}{J} \newcommand{\ScoredStepIndex}{j} \newcommand{\ScoredToolCall}{a} \newcommand{\ScoredToolCallCount}{N} \newcommand{\ScoringErrorStandardDeviation}{\sigma} \newcommand{\ScreenSpaceCovariance}{\boldsymbol{\Sigma}_{2D}} \newcommand{\ScreenedFeature}{x} \newcommand{\ScreenedFeatureSet}{X} \newcommand{\ScreeningMissRate}{m} \newcommand{\SeamActualAccelerations}{\ddot{\mathbf{q}}_{\text{actual}}} \newcommand{\SeamActualConfiguration}{\mathbf{q}_{\text{actual}}} \newcommand{\SeamActualVelocities}{\dot{\mathbf{q}}_{\text{actual}}} \newcommand{\SeamBlendReference}{\mathbf{s}} \newcommand{\SeamBridgeDuration}{T_{\text{blend}}} \newcommand{\SeamBridgePosition}{q_{\text{blend}}} \newcommand{\SeamInstant}{t_{\text{seam}}} \newcommand{\SeamStepTorque}{\tau_{\text{request}}} \newcommand{\SearchBranchingFactor}{b} \newcommand{\SearchDepth}{d_{\max}} \newcommand{\SearchDepthIndex}{d} \newcommand{\SearchQueryEmbedding}{\mathbf{q}} \newcommand{\SecondAdjacentCheckIndex}{b} \newcommand{\SecondAdjacentCheckPassProbability}{p_{b}} \newcommand{\SecondAdjacentCheckSlotTime}{T_{b}} \newcommand{\SecondAtomicGradientUpdate}{B} \newcommand{\SecondCatalogDefinitionCount}{n_{\text{def},B}} \newcommand{\SecondCatalogDefinitionSize}{S_{B}} \newcommand{\SecondClassCoverageFloor}{b} \newcommand{\SecondClientMaskedUpdate}{\mathbf{y}_B} \newcommand{\SecondClientModelParameters}{\theta_B} \newcommand{\SecondComparedGroupLabel}{b} \newcommand{\SecondComparedItem}{j} \newcommand{\SecondFloatingPointAddend}{b} \newcommand{\SecondGroupClassificationThreshold}{\tau_{\text{thr},b}} \newcommand{\SecondGroupQualifiedFraction}{q_b} \newcommand{\SecondGroupSampleApprovalRate}{\hat{p}_b} \newcommand{\SecondGroupSampleSize}{n_b} \newcommand{\SecondJaccardSet}{\mathcal{B}} \newcommand{\SecondRankComputeTime}{T_{\text{rank}_1}} \newcommand{\SecondRaterCategoryFraction}{p_{y,2}} \newcommand{\SecondRingTraceElement}{b} \newcommand{\SecondSummandStandardDeviation}{\sigma_b} \newcommand{\SecondTwinCriticReturnEstimate}{Q_{\phi_2}} \newcommand{\SecurityLabelLattice}{\mathbb{L}} \newcommand{\SecurityLabelSet}{\mathcal{S}_{\text{lab}}} \newcommand{\SelectedActuationCommand}{\mathbf{u}_{\text{act}}} \newcommand{\SelectedDescriptorCount}{n_{\text{sel}}} \newcommand{\SelectedLayerSet}{\mathcal{S}} \newcommand{\SelectionOverheadSize}{S_{\text{sel}}} \newcommand{\SelectionScoreFunction}{f} \newcommand{\SelectionTime}{T_{\text{selection}}} \newcommand{\SelectiveAcceptanceScore}{\kappa} \newcommand{\SelfConsistencySampleCount}{k} \newcommand{\SelfWatchdogTimeout}{T_{\text{self}}} \newcommand{\SenderOverhead}{o_{\text{send}}} \newcommand{\SensingRealityGap}{\Delta_{\text{sens}}} \newcommand{\SensingStageLatency}{T_{\text{sense}}} \newcommand{\SensorErrorBound}{\epsilon} \newcommand{\SensorFeatureTokens}{\mathbf{z}_{\text{sensor}}} \newcommand{\SensorLeverArm}{\mathbf{r}_{P/O}} \newcommand{\SensorLeverArmLength}{r} \newcommand{\SensorLinkTransportTime}{t_{\text{transport}}} \newcommand{\SensorNoiseBound}{\epsilon} \newcommand{\SensorNoiseDensity}{N_{\text{IMU}}} \newcommand{\SensorNoiseStandardDeviation}{\sigma} \newcommand{\SensorObservationFunction}{g} \newcommand{\SensorPatternDictionary}{\mathbf{\Phi}_{\text{dict}}} \newcommand{\SensorPitchAngle}{\theta_{\text{pitch}}} \newcommand{\SensorPointAcceleration}{\mathbf{a}_P} \newcommand{\SensorPointVelocity}{\mathbf{v}_P} \newcommand{\SensorReadoutTime}{t_{\text{readout}}} \newcommand{\SensorReferenceFrame}{\mathcal{F}_{\text{sensor}}} \newcommand{\SensorRowIndex}{y} \newcommand{\SensorTraceMatrix}{\mathbf{X}} \newcommand{\SequenceCounterReading}{S} \newcommand{\SequenceIterationOperations}{c_{\text{decode}}} \newcommand{\SequenceLength}{S} \newcommand{\SequenceToken}{x} \newcommand{\SequentialAttemptIndex}{j} \newcommand{\SequentialBackwardCommunicationTime}{T_{\text{sequential}}} \newcommand{\SequentialCandidateCount}{M} \newcommand{\SequentialCostPerAcceptedTask}{C_{\text{eff,seq}}} \newcommand{\SequentialExecutionTime}{T_{\text{sequential}}} \newcommand{\SequentialLikelihoodRatio}{\Lambda_m} \newcommand{\SequentialLogLikelihoodRatio}{\Lambda_m} \newcommand{\SequentialTestObservation}{X} \newcommand{\SequentialTrialCount}{m} \newcommand{\SerialAutocorrelation}{\rho} \newcommand{\SerialCallCount}{n} \newcommand{\SerialFraction}{r} \newcommand{\SerialLinkClockFrequency}{f_{\text{link}}} \newcommand{\SerialReferenceTime}{T_{\text{serial}}} \newcommand{\SerializationLatency}{L_{\text{lat,serialization}}} \newcommand{\SerializedChunkVolume}{D_{\text{vol,chunk}}} \newcommand{\SerializedTrainingExample}{X} \newcommand{\SeriesComponentCount}{N_{\text{series}}} \newcommand{\SeriesElasticStiffness}{k} \newcommand{\SeriesPsuCount}{n_{\text{psu}}} \newcommand{\ServerAggregationEnergy}{E_{\text{aggregation}}} \newcommand{\ServerIndex}{i} \newcommand{\ServerPower}{P_{\text{server}}} \newcommand{\ServerRoutingWeight}{w} \newcommand{\ServiceRate}{\mu} \newcommand{\ServiceTimeStandardDeviation}{\sigma} \newcommand{\ServiceTimeVariationCoefficient}{c_{s}} \newcommand{\ServingCostPerQuery}{C_{\text{serving}}} \newcommand{\ServingEmpiricalCdf}{F_{P_t}} \newcommand{\ServingPathPredictor}{f_{\text{serve}}} \newcommand{\ServingTransformFunction}{f_{\text{serve}}} \newcommand{\ServingUtilization}{\rho_{\text{serv}}} \newcommand{\ServoFrequencyCorrection}{\Delta f} \newcommand{\SessionAttemptCount}{N_{\text{att}}} \newcommand{\SessionRequestCount}{N_{\text{session}}} \newcommand{\SetMemberPoint}{\mathbf{z}} \newcommand{\SetpointSampleIndex}{k} \newcommand{\SetpointStepInterval}{\Delta t_{\text{step}}} \newcommand{\SettledOperationCharge}{c} \newcommand{\SettledTrajectoryCost}{C} \newcommand{\SetupShareCap}{\phi} \newcommand{\ShadowOnlyFailureCount}{n_{\text{shadow}}} \newcommand{\ShannonEntropy}{H} \newcommand{\ShapedObservationSize}{S_{\text{shaped}}} \newcommand{\ShapedTotalReward}{r_{\text{total}}} \newcommand{\ShapingPotential}{\Phi} \newcommand{\ShardIndex}{s} \newcommand{\ShardReaderCount}{n_{\text{workers}}} \newcommand{\SharedBusBandwidth}{\text{BW}_{\text{bus}}} \newcommand{\SharedHardwareInterferenceDelay}{T_{\text{interf,shared}}} \newcommand{\SharedPoolWorkerCount}{N_{\text{pool}}} \newcommand{\SharedPrefixFraction}{f} \newcommand{\SharedPrefixLength}{S_{\text{prefix}}} \newcommand{\SharedPrefixRequestCount}{n_{\text{req}}} \newcommand{\ShellRelativeThickness}{\epsilon} \newcommand{\ShieldInterceptionCoverage}{c_h} \newcommand{\ShiftedMpcControlSequence}{\tilde{\mathbf{u}}_{0:N_{\text{mpc}}-1}} \newcommand{\ShiftedTestDistribution}{\mathcal{D}'} \newcommand{\ShingleLength}{w} \newcommand{\ShipDecision}{\mathbf{1}_{\text{ship}}} \newcommand{\ShootThroughCurrent}{I_{\text{shoot-through}}} \newcommand{\SiblingPolicyAction}{a'} \newcommand{\SiblingTeamAllocation}{U_{\text{allocated}}} \newcommand{\SightlineRange}{d} \newcommand{\SigmoidFunction}{\sigma} \newcommand{\SignalDimension}{n} \newcommand{\SignalHandoff}{\mathcal{H}} \newcommand{\SignalPropagationDelay}{t_{\text{prop}}} \newcommand{\SignalTrajectory}{s} \newcommand{\SignatureBandCount}{b} \newcommand{\SignificanceCriticalQuantile}{z_{1-\alpha_{\text{sig}}/2}} \newcommand{\SignificanceLevel}{\alpha} \newcommand{\SiliconThermalTimeConstant}{\tau_{\text{th,silicon}}} \newcommand{\SimplexProjection}{\Pi_{\Delta^{K-1}}} \newcommand{\SimulatedPlantDynamics}{f_{\text{sim}}} \newcommand{\SimulatedReturnLevel}{z_{T, \text{sim}}} \newcommand{\SimulatedStateTrajectory}{s_{\text{sim}}} \newcommand{\SimulatedStlRobustness}{\rho_{\text{sim}}} \newcommand{\SimulatedTrajectorySet}{\mathcal{S}_{\text{sim}}} \newcommand{\SimulatedTransportDelay}{T_{d,\text{sim}}} \newcommand{\SimulatedUnbrakedImpactForce}{F_{\text{unbraked,sim}}} \newcommand{\SimulationParameterSet}{\Xi} \newcommand{\SimulationParameterVector}{\boldsymbol{\xi}} \newcommand{\SimulatorStepFunction}{\mathbf{F}} \newcommand{\SingleAgentAcceptanceProbability}{p_{\text{single}}} \newcommand{\SingleDeviceContextLength}{S_{\text{single}}} \newcommand{\SingleDeviceRunTime}{T_1} \newcommand{\SingleJointAccelerationLimit}{\ddot{q}_{i,\max}} \newcommand{\SingleJointInertia}{M} \newcommand{\SingleJointVelocityLimit}{\dot{q}_{i,\max}} \newcommand{\SingleLinkBandwidth}{\text{BW}_{\text{link}}} \newcommand{\SinglePrecisionGemvIntensity}{I_{\text{GEMV, 32-bit}}} \newcommand{\SingleStepImitationError}{\epsilon} \newcommand{\SingularSpectrumMatrix}{\mathbf{\Sigma}} \newcommand{\SisaShardCount}{K} \newcommand{\SisaTrainingShard}{S} \newcommand{\SixthHarmonicTorqueRipple}{\tau_{\text{ripple}}} \newcommand{\SkewDisplacementEnvelope}{d_{\text{skew}}} \newcommand{\SkillSelectionDistribution}{p} \newcommand{\SlaveDriveCount}{S} \newcommand{\SlaveDriveIndex}{s} \newcommand{\SlaveForwardingDelay}{t_{\text{slave},s}} \newcommand{\SlipAccelerationBound}{a_{\text{slip}}} \newcommand{\SlipRegularizationSpeed}{\epsilon_{\text{reg}}} \newcommand{\SloVector}{\mathbf{S}} \newcommand{\SlowdownPersistenceUpdateCount}{K} \newcommand{\SmallChange}{\delta} \newcommand{\SmallPerturbation}{\delta} \newcommand{\SmallestJacobianSingularNumber}{\sigma_{\min}} \newcommand{\SmallestKeySingularNumber}{\sigma_{\min(S, d_{\text{head}})}} \newcommand{\SmoothedClassifier}{g} \newcommand{\SmoothedRunnerUpProbability}{p_{B}} \newcommand{\SmoothedTargetAction}{\tilde{\mathbf{a}}'} \newcommand{\SmoothedTopClassProbability}{p_{A}} \newcommand{\SmoothingNoiseClipBound}{c} \newcommand{\SmoothingNoiseStandardDeviation}{\sigma} \newcommand{\SmoothnessConstant}{L_s} \newcommand{\SnapshotReadTime}{t_{\text{own}}} \newcommand{\SnapshotResetCycleTime}{T_{\text{cycle,snap}}} \newcommand{\SnapshotStepIndex}{s} \newcommand{\SoftExpectedActionReturn}{Q} \newcommand{\SoftExpectedRemainingReturn}{V} \newcommand{\SoftenedStudentProbabilityVector}{\mathbf{p}_{\text{student}}^{(T_{\text{distill}})}} \newcommand{\SoftenedTeacherProbabilityVector}{\mathbf{p}_{\text{teacher}}^{(T_{\text{distill}})}} \newcommand{\SoftmaxFunction}{\sigma} \newcommand{\SoftmaxInputScore}{x} \newcommand{\SoftmaxInputVector}{\mathbf{x}} \newcommand{\SoftmaxNormalizer}{z} \newcommand{\SoftmaxOutputProbability}{p} \newcommand{\SoftmaxRowMaximum}{m} \newcommand{\SoftmaxRowScore}{s} \newcommand{\SoftmaxRunningMaximum}{m} \newcommand{\SoftmaxVectorLength}{n} \newcommand{\SontagStabilizingControl}{\mathbf{u}_{\text{Sontag}}} \newcommand{\SourceCurrent}{I_{\text{source}}} \newcommand{\SourceEventTime}{T_{\text{event}}} \newcommand{\SourceFramePoint}{\mathbf{p}_B} \newcommand{\SourceSinkPathSet}{\Pi} \newcommand{\SourceVoltage}{V_{\text{source}}} \newcommand{\SourceWriteShardGrant}{\Gamma_{c}} \newcommand{\SpareStoppingClearance}{d_{\text{spare}}} \newcommand{\SparseMatrixEntryCount}{n_{\text{elem}}} \newcommand{\SparseMatrixRowCount}{n_{\text{rows}}} \newcommand{\SparseProductInputComponent}{v} \newcommand{\SparseWeightMatrix}{\mathbf{W}_{\text{sparse}}} \newcommand{\SparsityPenaltyWeight}{\lambda_{\text{L1}}} \newcommand{\SparsityRatio}{\rho_{\text{sparse}}} \newcommand{\SpatialClearancePredicate}{P_{\text{clear}}} \newcommand{\SpatialColumnIndex}{j} \newcommand{\SpatialCovarianceEmbedding}{\mathbf{e}_{\Sigma}} \newcommand{\SpatialErrorVector}{\boldsymbol{\epsilon}_{\text{spatial}}} \newcommand{\SpatialHashFunction}{h} \newcommand{\SpatialMemoryMap}{\mathcal{M}} \newcommand{\SpatialPositionCount}{N_{\text{pix}}} \newcommand{\SpatialRowIndex}{i} \newcommand{\SpatialTransformation}{\mathcal{T}} \newcommand{\SpecialEuclideanAlgebra}{\mathfrak{se}(3)} \newcommand{\SpecialEuclideanGroup}{SE(3)} \newcommand{\SpecialOrthogonalGroup}{SO(3)} \newcommand{\SpecializedEnergyProductivity}{\rho_{\text{energy,specific}}} \newcommand{\SpecificHeatCapacity}{c_p} \newcommand{\SpectrallyNormalizedWeightMatrix}{\overline{\mathbf{W}}} \newcommand{\SpeculativeDecodingSpeedup}{S_{\text{spec}}} \newcommand{\SpeculativeDraftLength}{K} \newcommand{\SpeculativeDraftTokenCount}{k} \newcommand{\SpeedAtDetection}{v} \newcommand{\SpeedBound}{v_{\max}} \newcommand{\SpendingWindowDuration}{T_{\text{win}}} \newcommand{\SphereSurfaceArea}{S_{D-1}} \newcommand{\SplineControlPoint}{\mathbf{p}} \newcommand{\SplineDegree}{p} \newcommand{\SplineFinalControlIndex}{L} \newcommand{\SplineKnotTime}{\xi} \newcommand{\SplitAssignmentMap}{s} \newcommand{\SplitMessageCount}{N_{\text{msg}}} \newcommand{\SpotHourlyPrice}{C_{\text{spot}}} \newcommand{\SpringBrakeEngagementTime}{t_{\text{engage}}} \newcommand{\SpringCompressionForce}{F} \newcommand{\SprtExpectedLogIncrement}{m} \newcommand{\SprtLowerBoundary}{\Lambda_{\text{lo}}} \newcommand{\SprtLowerLogBoundary}{b_{\text{low}}} \newcommand{\SprtStoppingSampleCount}{N_{\text{stop}}} \newcommand{\SprtUpperBoundary}{\Lambda_{\text{up}}} \newcommand{\SprtUpperLogBoundary}{u} \newcommand{\SquareGemmDimension}{N} \newcommand{\SquaredGaussianSumQuantile}{\chi} \newcommand{\SquaredPathVelocity}{x} \newcommand{\SquaredRadiusSubstitution}{u} \newcommand{\SquashedActionComponent}{a} \newcommand{\SramCapacity}{M_{\text{SRAM}}} \newcommand{\StabilizationErrorThreshold}{\epsilon_{\text{stable}}} \newcommand{\StabilizationSlewCeiling}{j_{\text{stable}}} \newcommand{\StackedContactForces}{\mathbf{f}_{\text{c}}} \newcommand{\StageConditionalAcceptanceProbability}{q} \newcommand{\StageEpisodeCount}{N_{\text{episodes}}} \newcommand{\StageReachProbability}{r} \newcommand{\StagedDefinitionCount}{n_{\text{def}}} \newcommand{\StagingExhaustionTime}{T_{\text{exhaust}}} \newcommand{\StagingStoreCapacity}{M_{\text{stage}}} \newcommand{\StaleSupportRate}{\epsilon_{\text{stale}}} \newcommand{\StalenessAdjustedLearningRate}{\eta'} \newcommand{\StalenessBound}{s} \newcommand{\StallCounterTorque}{\tau_{\text{stall}}} \newcommand{\StallTravelBound}{d_{\text{F1}}} \newcommand{\StandardDeviationMultiple}{k} \newcommand{\StandardNormalCumulativeDistribution}{\Phi} \newcommand{\StandardNormalQuantile}{z_q} \newcommand{\StandbyInstanceMemory}{M_{\text{standby}}} \newcommand{\StandbyPower}{P_{\text{idle}}} \newcommand{\StandbyReserveCount}{N_{\text{reserve}}} \newcommand{\StandstillSpeedThreshold}{\epsilon_{\text{vel}}} \newcommand{\StateConstraintMatrix}{\mathbf{H}_x} \newcommand{\StateConstraintVector}{\mathbf{b}_x} \newcommand{\StateCotangentSpace}{T_{\mathbf{x}}^*} \newcommand{\StateDimension}{n} \newcommand{\StateDistribution}{d_\pi} \newcommand{\StateEstimate}{\hat{\mathbf{x}}} \newcommand{\StateEstimateDerivative}{\dot{\hat{\mathbf{x}}}} \newcommand{\StateEstimationError}{\mathbf{e}} \newcommand{\StateExposureLevel}{S} \newcommand{\StateNormWeighting}{W} \newcommand{\StateOperation}{f} \newcommand{\StateParameterSensitivity}{\mathbf{S}} \newcommand{\StateRecurrencePeriod}{\ell} \newcommand{\StateScalarFunction}{\phi} \newcommand{\StateSpaceDimension}{d_s} \newcommand{\StateSpaceInputMatrix}{\mathbf{B}} \newcommand{\StateSpaceSystemMatrix}{\mathbf{A}_{\text{sys}}} \newcommand{\StateTokenCount}{K_s} \newcommand{\StateTrackingWeightMatrix}{\mathbf{W}_q} \newcommand{\StateTransitionMatrix}{\mathbf{F}} \newcommand{\StatelessCursorPayload}{d} \newcommand{\StaticBatchingOperations}{O_{\text{traditional}}} \newcommand{\StaticChassisPower}{P_{\text{chassis\_static}}} \newcommand{\StaticDataDistribution}{p_{\text{data}}} \newcommand{\StationaryConditionPolynomial}{P} \newcommand{\StatisticalDivergence}{\mathcal{D}(P_t \| P_0)} \newcommand{\StatisticalFalseNegativeRate}{\beta} \newcommand{\StatisticalHypothesis}{H} \newcommand{\StatisticalPowerQuantile}{z_{1-\beta}} \newcommand{\StatisticalSignificanceLevel}{\alpha_{\text{sig}}} \newcommand{\StatorCoreTemperature}{T_{\text{core}}} \newcommand{\StatorIronTemperature}{T_{\text{iron}}} \newcommand{\StatorThermalCapacitance}{C_{\text{th}}} \newcommand{\StatusPollCount}{N_{\text{poll}}} \newcommand{\SteadyDeceleration}{a} \newcommand{\SteadyStateAvailability}{A} \newcommand{\SteadyStateCurrent}{I_{\text{final}}} \newcommand{\SteadyStateErrorCovariance}{\mathbf{P}_{\text{est}}} \newcommand{\SteadyStateIntegratorState}{\mathbf{z}_{\text{ss}}} \newcommand{\SteadyStateTemperatureRise}{\Delta T_{\max}} \newcommand{\SteadyStateTrackingError}{\mathbf{e}_{\text{ss}}} \newcommand{\SteeringTransferTime}{T} \newcommand{\StepFailureHazard}{a} \newcommand{\StepGenerationCost}{C_{\text{gen}}} \newcommand{\StepGenerationTime}{T_{\text{step}}} \newcommand{\StepIoTime}{T_{\text{IO}}} \newcommand{\StepResponsePhaseLag}{\Delta \phi} \newcommand{\StepSettlingTime}{t_{\text{settle}}} \newcommand{\StepSuccessProbability}{p} \newcommand{\StepTestVoltage}{V_{\text{step}}} \newcommand{\StepTimePenalty}{c_{\text{time}}} \newcommand{\StepTokenLogit}{z_{t,v}} \newcommand{\StereoBaseline}{b} \newcommand{\StereoDisparity}{d} \newcommand{\StlEventuallyDeadline}{\tau} \newcommand{\StlFormula}{\phi} \newcommand{\StlIntervalEnd}{b} \newcommand{\StlIntervalStart}{a} \newcommand{\StlPredicateFunction}{f} \newcommand{\StlRobustness}{\rho} \newcommand{\StlUntilOperator}{\mathcal{U}_{[a, b]}} \newcommand{\StockoutNormalQuantile}{z_{1-\epsilon}} \newcommand{\StockoutProbabilityTarget}{\epsilon} \newcommand{\StopAxisAcceleration}{\ddot{q}_{\text{stop}}} \newcommand{\StopAxisPosition}{q_{\text{stop}}} \newcommand{\StopCompletionInstant}{t_{\text{stop\_end}}} \newcommand{\StopDecisionComputeBound}{T_{\text{compute}}} \newcommand{\StopProgress}{u} \newcommand{\StopSequenceSet}{\mathcal{S}_{\text{stop}}} \newcommand{\StoppingBoundaryClearance}{z} \newcommand{\StoppingCrossoverSpeed}{v^{*}} \newcommand{\StoppingDeadline}{t_{\text{deadline,stop}}} \newcommand{\StoppingDistance}{d_{\text{stop}}} \newcommand{\StoppingDistanceBudget}{d_{\text{budget}}} \newcommand{\StoppingDuration}{T_{\text{stop}}} \newcommand{\StorageAccessFactor}{F_{\text{access}}} \newcommand{\StorageBandwidth}{\text{BW}_{\text{storage}}} \newcommand{\StorageCapacityPrice}{C_{\text{storage/byte-time}}} \newcommand{\StorageEquipmentPower}{P_{\text{storage}}} \newcommand{\StorageFunction}{V} \newcommand{\StorageFunctionDerivative}{\dot{V}} \newcommand{\StorageIngestBandwidth}{\text{BW}_{\text{ingest}}} \newcommand{\StoragePrice}{c_{\text{storage}}} \newcommand{\StorageReadTime}{T_{\text{read}}} \newcommand{\StorageRetentionTime}{T_{\text{months}}} \newcommand{\StorageThroughput}{R_{\text{storage}}} \newcommand{\StoredDataVolume}{D_{\text{vol,store}}} \newcommand{\StoredEmbedding}{\mathbf{z}} \newcommand{\StoredIndexVector}{\mathbf{x}} \newcommand{\StoredSystemState}{s} \newcommand{\StoredTokenVolume}{V} \newcommand{\StragglerStepTime}{T_{\text{step,straggler}}} \newcommand{\StreamAcceptanceProbability}{p} \newcommand{\StreamingEndToEndLatency}{T_{\text{streaming}}} \newcommand{\StrideCheckpointCount}{N} \newcommand{\StrongConfigurationAttemptCost}{c_{\text{big}}} \newcommand{\StrongConfigurationPassProbability}{p_{\text{big}}} \newcommand{\StruckObjectMass}{m_{\text{obj}}} \newcommand{\StructuredSparsityGroupSize}{m_{\text{group}}} \newcommand{\StructuredSparsityNonzeroCount}{n_{\text{keep}}} \newcommand{\StudentProbabilityVector}{\mathbf{p}_{\text{student}}} \newcommand{\StuffBitTime}{t_{\text{stuff},i}} \newcommand{\SubgroupIndex}{g} \newcommand{\SubgroupSampleSize}{n} \newcommand{\SubintervalFailureProbability}{p} \newcommand{\SublevelSetThreshold}{c} \newcommand{\SubsequentArrivalTime}{\tau} \newcommand{\SubsetAllPassIndicator}{I_J^{\text{all}}} \newcommand{\SubsetAnyPassIndicator}{I_J} \newcommand{\SubsetDatasetSize}{D_{\text{subset}}} \newcommand{\SuccessCountIndex}{j} \newcommand{\SuccessLowerConfidenceLimit}{p_{\text{lower}}} \newcommand{\SuccessfulTrialCount}{k} \newcommand{\SuccessorActionVector}{\mathbf{a}'} \newcommand{\SuccessorPlanningState}{s'} \newcommand{\SuffixFoldTime}{T_{\text{fold}}} \newcommand{\SummaryOutputLength}{K_{\text{sum}}} \newcommand{\SummaryTokenEmbedding}{\mathbf{x}_{\text{class}}} \newcommand{\SupervisoryMtbi}{T_{\text{MTBI}}} \newcommand{\SupervisoryTakeoverLatency}{T_{\Sigma}} \newcommand{\SupplyVoltage}{V} \newcommand{\SupportPolygon}{\mathcal{P}_{\text{support}}} \newcommand{\SupportSetSize}{n_{\text{shot}}} \newcommand{\SustainableAttemptRate}{R_{\text{attempt}}} \newcommand{\SustainableCopperLossPower}{P_{\text{loss,ss}}} \newcommand{\SustainableHoldingTorque}{\tau_{\text{hold,max}}} \newcommand{\SustainedComputeRate}{R_{\text{sustained}}} \newcommand{\SustainedDropoutFrameCount}{N_{\text{drop}}} \newcommand{\SustainedMemoryBandwidth}{\text{BW}_{\text{mem}}} \newcommand{\SweepCandidateCostFraction}{f} \newcommand{\SweepCandidateCount}{k} \newcommand{\SwitchBreakdownVoltage}{V_{\text{breakdown}}} \newcommand{\SwitchInputCapacitance}{C_{\text{iss}}} \newcommand{\SwitchOnResistance}{R_{\text{ds(on)}}} \newcommand{\SwitchRadix}{k} \newcommand{\SwitchedCapacitance}{C} \newcommand{\SwitchingActivityFactor}{\alpha} \newcommand{\SwitchingEnergy}{E} \newcommand{\SwitchingTransitionTime}{t_{\text{sw}}} \newcommand{\SymbolicPlanningState}{s} \newcommand{\SymmetricClippingThreshold}{\alpha_{\text{sym}}} \newcommand{\SymmetricMessageOverhead}{o} \newcommand{\SymplecticEulerTransitionMatrix}{\mathbf{A}_{\text{symp}}} \newcommand{\SyncMessageInterval}{\Delta t_{\text{interval}}} \newcommand{\SyncPairingDisplacement}{\Delta \mathbf{x}_{\text{sync}}} \newcommand{\SynchronizationBlackout}{T_{\text{blackout}}} \newcommand{\SynchronizationClearanceMargin}{d_{\text{sync}}} \newcommand{\SynchronizationErrorBound}{\epsilon_{\text{sync}}} \newcommand{\SynchronizationStepIndex}{k} \newcommand{\SynchronizationTime}{T_{\text{sync}}} \newcommand{\SyntheticDataGenerator}{G_{\theta}} \newcommand{\SyntheticDataset}{\mathcal{S}_{\text{synthetic}}} \newcommand{\SystemCallFilterTime}{T_{\text{filter}}} \newcommand{\SystemCallOverheadTime}{T_{\text{syscall}}} \newcommand{\SystemFailureRate}{\lambda_{\text{system}}} \newcommand{\SystemHazardRate}{\lambda_{\text{system}, h}} \newcommand{\SystemInstructionTokenCount}{S_{\text{system}}} \newcommand{\SystemMatrixPowerIndex}{k} \newcommand{\SystemMemoryBandwidth}{\text{BW}_{\text{system}}} \newcommand{\SystemMtbf}{\text{MTBF}_{\text{system}}} \newcommand{\SystemReliability}{R_{\text{system}}} \newcommand{\TableRowCount}{N} \newcommand{\TailByteAllocation}{M_{\text{tail}}} \newcommand{\TailMomentOrder}{k} \newcommand{\TailPerformanceMetric}{X} \newcommand{\TailRequestLatency}{T_{\text{lat},\text{p99}}} \newcommand{\TailRequestSeenBatchSize}{B_{\text{req,p99}}} \newcommand{\TailRiskDistributionFunction}{F} \newcommand{\TailRiskObservation}{X} \newcommand{\TailRiskObservationLevel}{x} \newcommand{\TailShapeParameter}{\xi} \newcommand{\TailStepIoTime}{T_{\text{IO,p99}}} \newcommand{\TailSupportUpperEndpoint}{x_F} \newcommand{\TakeoverInstant}{t_{\text{takeover}}} \newcommand{\TakeoverResponseTime}{T_{\Sigma, 1}} \newcommand{\TakeoverStateVisitationDistribution}{p^{\text{takeover}}} \newcommand{\TakeoverTrackingError}{\mathbf{e}_{\text{track}}} \newcommand{\TangentDirection}{\mathbf{v}} \newcommand{\TangentSeedVector}{\dot{\mathbf{x}}} \newcommand{\TangentialContactShear}{\mathbf{f}_{k, \parallel}} \newcommand{\TangentialSpeed}{v_{\text{tangential}}} \newcommand{\TapeIntermediateResult}{y_{\text{tape}}} \newcommand{\TargetAcceptanceDifference}{\Delta} \newcommand{\TargetActionReturnEstimate}{\hat{Q}} \newcommand{\TargetActorParameters}{\theta'} \newcommand{\TargetBatchSize}{B_{\text{target}}} \newcommand{\TargetCompletionQuantile}{q} \newcommand{\TargetComputeRate}{R_{\text{ops}}} \newcommand{\TargetComputeTimeFraction}{\eta_{\text{target}}} \newcommand{\TargetCriticParameters}{\phi'} \newcommand{\TargetCriticReturnEstimate}{Q_{\phi'}} \newcommand{\TargetDeterministicPolicy}{\mu_{\theta'}} \newcommand{\TargetError}{\epsilon} \newcommand{\TargetExceedanceProbability}{\epsilon} \newcommand{\TargetFairShare}{F_{\text{target}}} \newcommand{\TargetFramePoint}{\mathbf{p}_A} \newcommand{\TargetHazardRate}{\lambda_{\text{target}}} \newcommand{\TargetImpedanceDampingMatrix}{\mathbf{D}_d} \newcommand{\TargetImpedanceInertiaMatrix}{\mathbf{M}_d} \newcommand{\TargetImpedanceStiffnessMatrix}{\mathbf{K}_d} \newcommand{\TargetInferenceLatency}{L_{\text{lat,target}}} \newcommand{\TargetKeyAttentionWeight}{\alpha_{\text{target}}} \newcommand{\TargetKeyLogit}{z_{\text{target}}} \newcommand{\TargetModelDistribution}{p_{\theta}} \newcommand{\TargetOrientation}{\mathbf{R}_{\text{target}}} \newcommand{\TargetPlantState}{\mathbf{x}_{f}} \newcommand{\TargetPolicyEntropy}{\overline{\mathcal{H}}} \newcommand{\TargetPose}{\mathbf{T}_{\text{target}}} \newcommand{\TargetPosition}{\mathbf{p}_{\text{target}}} \newcommand{\TargetPositionComponent}{p_{\text{target},i}} \newcommand{\TargetRange}{z} \newcommand{\TargetRepeatedRunConsistency}{p_{\text{target}}} \newcommand{\TargetSamplingDistribution}{p} \newcommand{\TargetServingUtilization}{\rho_{\text{target}}} \newcommand{\TargetSmoothingNoise}{\boldsymbol{\epsilon}} \newcommand{\TargetSmoothingNoiseStandardDeviation}{\sigma} \newcommand{\TargetTokenVolume}{W} \newcommand{\TargetTravelDistance}{d} \newcommand{\TargetTrialFailureProbability}{p_{*}} \newcommand{\TargetTrialSuccessProbability}{p_{\text{target}}} \newcommand{\TargetTwinCriticReturnEstimate}{Q_{\phi'_i}} \newcommand{\TargetUnitQuaternion}{\mathbf{q}_{\text{quat,target}}} \newcommand{\TargetUpdateCount}{K_{\text{target}}} \newcommand{\TargetUtilizationBatchSize}{B_{\text{util}}} \newcommand{\TargetXPosition}{x} \newcommand{\TargetYPosition}{p_y} \newcommand{\TargetZPosition}{z} \newcommand{\TaskAcceptanceLabel}{x} \newcommand{\TaskBlockingTime}{B} \newcommand{\TaskContract}{\mathcal{C}} \newcommand{\TaskContractGoal}{G} \newcommand{\TaskCost}{C_{\text{task}}} \newcommand{\TaskCount}{K} \newcommand{\TaskCoverageProbability}{Q} \newcommand{\TaskCriticalSections}{cs} \newcommand{\TaskDerivativeGain}{\mathbf{K}_{d,i}} \newcommand{\TaskDistance}{d_{\text{task}}} \newcommand{\TaskEnvironment}{\mathcal{E}_{\text{env}}} \newcommand{\TaskErrorTolerance}{\tau_{\text{tol}}} \newcommand{\TaskGroupMap}{g} \newcommand{\TaskIndex}{i} \newcommand{\TaskInterferenceTime}{I} \newcommand{\TaskJacobian}{\mathbf{J}} \newcommand{\TaskJacobianDerivative}{\dot{\mathbf{J}}} \newcommand{\TaskJacobianPseudoinverse}{\mathbf{J}^\dagger} \newcommand{\TaskKinematicMap}{f} \newcommand{\TaskLoss}{\mathcal{L}_{\text{task}}} \newcommand{\TaskLossGradient}{\nabla \mathcal{L}} \newcommand{\TaskPeriod}{T} \newcommand{\TaskProportionalGain}{\mathbf{K}_{p,i}} \newcommand{\TaskReadCount}{n_{\text{read}}} \newcommand{\TaskRelativeDeadline}{D} \newcommand{\TaskRelevantOutcome}{\mathbf{Y}_{\text{task}}} \newcommand{\TaskReward}{r_{\text{task}}} \newcommand{\TaskSetUtilization}{U} \newcommand{\TaskSpaceAcceleration}{\ddot{\mathbf{x}}} \newcommand{\TaskSpaceCoordinates}{\mathbf{x}} \newcommand{\TaskSpaceDimension}{m} \newcommand{\TaskSpaceReference}{\mathbf{x}_i^{\text{ref}}} \newcommand{\TaskSpaceReferenceAcceleration}{\ddot{\mathbf{x}}^{\text{ref}}} \newcommand{\TaskSpaceReferenceVelocity}{\dot{\mathbf{x}}^{\text{ref}}} \newcommand{\TaskSpaceVelocity}{\dot{\mathbf{x}}} \newcommand{\TaskSpecificLoss}{\mathcal{L}} \newcommand{\TaskStateTokenCount}{S_{\text{state}}} \newcommand{\TaskToleranceSemiAxes}{\mathbf{r}} \newcommand{\TaskToleranceSemiAxis}{r} \newcommand{\TaskTurnCost}{C_{\text{call}}} \newcommand{\TaskWeight}{w} \newcommand{\TasksPerComparisonArm}{N_{\text{arm}}} \newcommand{\TeacherProbabilityVector}{\mathbf{p}_{\text{teacher}}} \newcommand{\TeamQuotaCap}{Q_{\text{team}}} \newcommand{\TelemetryFlushTime}{t_{\text{telemetry\_flush}}} \newcommand{\TelemetryFreshnessBound}{\Delta t_{\text{fresh}}} \newcommand{\TelemetryRetentionDuration}{T_{\text{retention}}} \newcommand{\TelemetrySamplingFrequency}{f_{\text{sample}}} \newcommand{\TelemetrySeriesCount}{N_{\text{series}}} \newcommand{\TelemetryTickInterval}{\Delta t_s} \newcommand{\TeleoperationCommandLatency}{t_{\text{cmd}}} \newcommand{\TeleoperationDownlinkTime}{T_{\text{downlink}}} \newcommand{\TeleoperationRoundTripLatency}{t_{\text{loop}}} \newcommand{\TeleoperationRoundTripTime}{T_{\text{RTT}}} \newcommand{\TeleoperationStateVisitationDistribution}{p^{\pi_{\text{teleop}}}} \newcommand{\TeleoperationUplinkTime}{T_{\text{uplink}}} \newcommand{\TeleoperationVideoLatency}{T_{\text{video}}} \newcommand{\TemperatureDualObjective}{\mathcal{L}} \newcommand{\TemperatureStepSize}{\lambda_{\alpha}} \newcommand{\TemplateSharedMemory}{M_{\text{template}}} \newcommand{\TemporalDifferenceResidual}{\delta} \newcommand{\TemporalEnsemblingWeight}{w_i} \newcommand{\TenantIndex}{i} \newcommand{\TenantResourceAllocation}{a_{i,r}} \newcommand{\TensorAxisCount}{n} \newcommand{\TensorColumnModeSize}{J} \newcommand{\TensorCoreAccumulatorMatrix}{\mathbf{C}_{\text{acc}}} \newcommand{\TensorCoreLeftInput}{\mathbf{A}_{\text{tc}}} \newcommand{\TensorCoreOutputMatrix}{\mathbf{D}_{\text{tc}}} \newcommand{\TensorCoreRightInput}{\mathbf{B}_{\text{tc}}} \newcommand{\TensorDepthModeSize}{T} \newcommand{\TensorElementCount}{N} \newcommand{\TensorModeIndex}{n_{\text{mode}}} \newcommand{\TensorParallelDegree}{N_{\text{TP}}} \newcommand{\TensorParallelLayerTime}{T_{\text{inference}}} \newcommand{\TensorRowModeSize}{I} \newcommand{\TerminalFeedbackGain}{\mathbf{K}_f} \newcommand{\TerminalInvariantSet}{\mathcal{X}_{f}} \newcommand{\TerminalPlantState}{\mathbf{x}_N} \newcommand{\TerminalTransitTime}{t_{\text{transit}}} \newcommand{\TerminalVoltageLimit}{V_{\max}} \newcommand{\TerminationProtocol}{\kappa} \newcommand{\TestExample}{z_{\text{test}}} \newcommand{\TestFamilySize}{k} \newcommand{\TestPhaseCapabilityGrant}{\Gamma_{\text{test}}} \newcommand{\TestsDirectoryShardGrant}{\Gamma_{a}} \newcommand{\TextTokenCount}{S_{\text{text}}} \newcommand{\TextTokenEmbeddings}{\mathbf{z}_{\text{text}}} \newcommand{\ThermalExpansionCoefficient}{\alpha} \newcommand{\ThermalPenaltyWeight}{\lambda_T} \newcommand{\ThermalPowerLimit}{P_{\text{thermal}}} \newcommand{\ThermalResistance}{R_{\text{th}}} \newcommand{\ThermalTimeConstant}{\tau_{\text{th}}} \newcommand{\ThirdAtomicGradientUpdate}{C} \newcommand{\ThirdFloatingPointAddend}{c} \newcommand{\ThirdRingTraceElement}{c} \newcommand{\ThresholdExceedanceCount}{N_u} \newcommand{\ThresholdExceedanceRate}{\zeta_u} \newcommand{\ThresholdExcess}{y} \newcommand{\ThresholdExcessVariable}{Y} \newcommand{\ThresholdedSparsityRatio}{\rho_{\text{sparse},\delta}} \newcommand{\ThrottleClearTemperature}{T_{\text{clear}}} \newcommand{\ThrottleOnsetJunctionTemperature}{T_{\text{j},\text{start}}} \newcommand{\ThrottleRecoveryTime}{t_{\text{recov}}} \newcommand{\ThrottleTripTemperature}{T_{\text{trip}}} \newcommand{\ThrottledClockFrequency}{f_{\text{throt}}} \newcommand{\TickCycleCount}{N} \newcommand{\TickIndex}{n} \newcommand{\TickPeriodJitterBound}{J_{\text{phase}}} \newcommand{\TieredRequestServiceTime}{T} \newcommand{\TightenedDiscreteSafeSet}{\mathcal{C}_{\text{discrete}}} \newcommand{\TileRowIndex}{m} \newcommand{\TiltAngle}{\theta_{\text{tilt}}} \newcommand{\Time}{T} \newcommand{\TimeBudgetUsedFraction}{\rho_T} \newcommand{\TimeInstant}{t} \newcommand{\TimeScaleSeparationRatio}{\epsilon} \newcommand{\TimeStepIndex}{t} \newcommand{\TimeToResult}{T_{\text{result}}} \newcommand{\TimeToTarget}{T_{\text{target}}} \newcommand{\TimeoutSafetyMultiplier}{k} \newcommand{\TimeoutTrialCount}{n_{\text{timeout}}} \newcommand{\TimerClockPeriod}{T_{\text{timer\_clk}}} \newcommand{\TimestampJitterDelay}{\delta_{\text{jitter}}} \newcommand{\TimestampQuantizationBound}{T_{\text{quant}}} \newcommand{\TimestampSkew}{t_{\text{skew}}} \newcommand{\TimingJitter}{\sigma_{\text{jitter}}} \newcommand{\TimingRealityGap}{\Delta_{\text{lat}}} \newcommand{\TokenAuthenticationCode}{\sigma} \newcommand{\TokenAveragedBatchLoss}{\mathcal{L}_{\text{token}}} \newcommand{\TokenBucketDepth}{b} \newcommand{\TokenBucketRefillRate}{r} \newcommand{\TokenBudgetUsedFraction}{\rho_N} \newcommand{\TokenByteDecoding}{s} \newcommand{\TokenCaveat}{c} \newcommand{\TokenDispatchTime}{T_{\text{dispatch}}} \newcommand{\TokenIdentifierSize}{s_{\text{id}}} \newcommand{\TokenIndex}{t} \newcommand{\TokenPrefix}{x_{<t}} \newcommand{\TokenVocabulary}{\mathcal{V}} \newcommand{\TokenizationTime}{T_{\text{tokenize}}} \newcommand{\ToleranceEllipsoidMatrix}{\mathbf{E}} \newcommand{\ToleratedFailureProbability}{\epsilon} \newcommand{\ToleratedPositionError}{\epsilon_{\text{pos}}} \newcommand{\TombstonedNodeSet}{V_{\text{tomb}}} \newcommand{\TombstonedRecordFraction}{\rho_{\text{dead}}} \newcommand{\ToolArgumentKey}{p} \newcommand{\ToolCallCategory}{y} \newcommand{\ToolCallCost}{c_{\text{tool}}} \newcommand{\ToolCallIndex}{i} \newcommand{\ToolCallReadSet}{R} \newcommand{\ToolCallWriteSet}{W} \newcommand{\ToolCartesianPose}{\mathbf{x}} \newcommand{\ToolCartesianVelocity}{\dot{\mathbf{x}}} \newcommand{\ToolCenterPointAxis}{\hat{\mathbf{z}}_{\text{TCP}}} \newcommand{\ToolCenterPointFrame}{\mathcal{F}_{\text{TCP}}} \newcommand{\ToolCenterPointPose}{\mathbf{T}_{\text{TCP}}} \newcommand{\ToolCenterPointPosition}{\mathbf{p}_{\text{TCP}}} \newcommand{\ToolClearanceDistance}{d_{\text{tool}}} \newcommand{\ToolDeclarationTokenCount}{S_{\text{tools}}} \newcommand{\ToolDescriptorSize}{S_{\text{desc}}} \newcommand{\ToolPlanarAbscissa}{x} \newcommand{\ToolPlanarOrdinate}{y} \newcommand{\ToolPositionError}{e_{\text{tool}}} \newcommand{\ToolServiceCount}{N_{\text{tool}}} \newcommand{\ToolSpeedLimit}{v_{\text{TCP}}} \newcommand{\ToolTargetState}{s} \newcommand{\ToolTime}{T_{\text{tool}}} \newcommand{\ToolTipPose}{\mathbf{T}_{\text{tool}}} \newcommand{\TopClassCount}{k} \newcommand{\TopMagnitudeIndicator}{\mathbf{1}_{|\mathbf{g}| \geq |\mathbf{g}|_{(K_{\text{top}})}}} \newcommand{\TopTokenSampleCount}{k} \newcommand{\TopologicalPlaceNode}{p^{\text{place}}} \newcommand{\TopologyEndpointCount}{N} \newcommand{\TorqueCutoffCommand}{\mathbf{u}_{\text{cutoff}}} \newcommand{\TorqueEffortPenaltyWeight}{\lambda_{\tau}} \newcommand{\TorqueProducingCurrent}{i_q} \newcommand{\TorqueRateLimit}{\dot{\tau}_{\max}} \newcommand{\TorqueRegularizationWeight}{w_\tau} \newcommand{\TorqueSlewPenaltyWeight}{\lambda_{\dot{\tau}}} \newcommand{\TorusFirstAxisChipCount}{X} \newcommand{\TorusSecondAxisChipCount}{Y} \newcommand{\TorusThirdAxisChipCount}{Z} \newcommand{\TotalChipPower}{P_{\text{total}}} \newcommand{\TotalCollisionQueryTime}{T_{\text{query\_total}}} \newcommand{\TotalDataCost}{C_{\text{total}}} \newcommand{\TotalDelayPhaseShift}{\phi_{\text{total}}} \newcommand{\TotalEnergy}{E_{\text{total}}} \newcommand{\TotalExecutedTrialCount}{N_{\text{total}}} \newcommand{\TotalFailureRecoveryTime}{T_{\text{recovery}}} \newcommand{\TotalGateCharge}{Q_g} \newcommand{\TotalInterventionCount}{N_{\text{int}}} \newcommand{\TotalKineticEnergy}{E_{k,\text{total}}} \newcommand{\TotalMemoryFootprint}{M_{\text{total}}} \newcommand{\TotalPipelineLatency}{L_{\text{lat,total}}} \newcommand{\TotalTrainingRunCost}{C_{\text{total}}} \newcommand{\TraceCrashCount}{N_{\text{crash}}} \newcommand{\TraceCrashIndex}{i} \newcommand{\TraceDecay}{\lambda} \newcommand{\TraceIntermediateAdjoint}{\bar{v}} \newcommand{\TraceIntermediateTangent}{\dot{v}} \newcommand{\TraceIntermediateVariable}{v} \newcommand{\TrackIndex}{i} \newcommand{\TrackLastUpdateTime}{t_{\text{last}}} \newcommand{\TrackLossTimeout}{T_{\text{lost}}} \newcommand{\TrackPositionDeviation}{\sigma_{\text{track}}} \newcommand{\TrackPredictedErrorCovariance}{\mathbf{P}_{t|t-1}} \newcommand{\TrackPredictedStateEstimate}{\hat{\mathbf{x}}_{t|t-1}} \newcommand{\TrackedEvidenceHorizon}{\tau_{\text{ev,tracked}}} \newcommand{\TrackerFrameIndex}{t} \newcommand{\TrackingErrorAcceleration}{\ddot{\mathbf{e}}} \newcommand{\TrackingErrorAllowance}{\epsilon_{\text{pos}}} \newcommand{\TrackingErrorBound}{\epsilon_{\text{track}}} \newcommand{\TrackingErrorDistance}{e} \newcommand{\TrackingErrorRate}{\dot{\mathbf{e}}} \newcommand{\TrackingErrorVector}{\mathbf{e}} \newcommand{\TrackingRelaxationSlack}{\delta} \newcommand{\TrackingSlackPenaltyWeight}{p} \newcommand{\TrackingStartInstant}{t_{\text{start}}} \newcommand{\TractionLimitedDeceleration}{a} \newcommand{\TractiveForce}{F_x} \newcommand{\TrainableStateMemory}{M_{\text{train}}} \newcommand{\TrainerUpdateTime}{T_{\text{train}}} \newcommand{\TrainingCompute}{O_{\text{train}}} \newcommand{\TrainingCost}{C_{\text{train}}} \newcommand{\TrainingDataset}{D} \newcommand{\TrainingDistribution}{P_0} \newcommand{\TrainingEmpiricalCdf}{F_{P_0}} \newcommand{\TrainingExample}{z} \newcommand{\TrainingFailureCount}{N_{\text{failures}}} \newcommand{\TrainingFeatureMean}{\mu} \newcommand{\TrainingFeatureStandardDeviation}{\sigma} \newcommand{\TrainingLabelMask}{\mathcal{M}_{\text{train}}} \newcommand{\TrainingLoss}{\mathcal{L}_{\text{train}}} \newcommand{\TrainingPathPredictor}{f_{\text{train}}} \newcommand{\TrainingPipelineFunction}{f} \newcommand{\TrainingRunCount}{N_{\text{runs}}} \newcommand{\TrainingSampleThroughput}{R_{\text{train}}} \newcommand{\TrainingSchemaKeySet}{\mathcal{K}_{\text{train}}} \newcommand{\TrainingServingSkew}{S_{\text{skew}}} \newcommand{\TrainingSplitFraction}{f_{\text{train}}} \newcommand{\TrainingStepCount}{K} \newcommand{\TrainingStepEnergy}{E_{\text{step}}} \newcommand{\TrainingStepOperations}{O_{\text{step}}} \newcommand{\TrainingStepTime}{T_{\text{step}}} \newcommand{\TrainingThroughput}{R_{\text{training}}} \newcommand{\TrainingTime}{T_{\text{train}}} \newcommand{\TrainingTransformFunction}{f_{\text{train}}} \newcommand{\Trajectory}{\tau} \newcommand{\TrajectoryAction}{a} \newcommand{\TrajectoryAdmissionRate}{\lambda_{\text{traj}}} \newcommand{\TrajectoryBudget}{\mathbf{B}} \newcommand{\TrajectoryCallCount}{N_{\text{call}}} \newcommand{\TrajectoryCategoryIndex}{j} \newcommand{\TrajectoryCheckpointCount}{N_{\text{ckpt}}} \newcommand{\TrajectoryDivergenceResidual}{e_{\text{div}}} \newcommand{\TrajectoryDuration}{T_{\text{traj}}} \newcommand{\TrajectoryGoodput}{\mathcal{G}} \newcommand{\TrajectoryObservation}{o} \newcommand{\TrajectoryOptimizationObjective}{\mathcal{U}} \newcommand{\TrajectoryRecordDuration}{T_{\text{record}}} \newcommand{\TrajectoryRecordFrame}{\mathcal{F}} \newcommand{\TrajectoryReturn}{R} \newcommand{\TrajectoryReward}{R} \newcommand{\TrajectorySampleCount}{N} \newcommand{\TrajectoryState}{s} \newcommand{\TrajectoryStateSpace}{\mathcal{S}} \newcommand{\TrajectoryTimeLimit}{T_{\max}} \newcommand{\TrajectoryTokenCost}{C_{\text{session}}} \newcommand{\TrajectoryTokenLimit}{N_{\max}} \newcommand{\TrajectoryTurnLimit}{H_{\max}} \newcommand{\TransceiverDelay}{t_{\text{transceiver}}} \newcommand{\TransductionInstant}{t_{\text{transduction}}} \newcommand{\TransferBufferCount}{N_{\text{transfer}}} \newcommand{\TransferDiscrepancyBound}{\epsilon_{\text{gap}}} \newcommand{\TransferTimeForPayload}{T_{\text{transfer}}} \newcommand{\TransferredDataVolume}{D_{\text{vol,transfer}}} \newcommand{\TransformGraph}{\mathcal{G}} \newcommand{\TransformGraphEdgeSet}{\mathcal{E}} \newcommand{\TransformGraphFrame}{\mathcal{F}} \newcommand{\TransformGraphVertexSet}{\mathcal{V}} \newcommand{\TransformRotationBlock}{\mathbf{R}_{AB}} \newcommand{\TransformTranslationBlock}{\mathbf{t}_{AB}} \newcommand{\TransformationInputCount}{k} \newcommand{\TransformedCartesianPosition}{\mathbf{p}'} \newcommand{\TransformedHomogeneousPointCoordinates}{\tilde{\mathbf{p}}'} \newcommand{\TransistorThresholdVoltage}{V_{\text{th}}} \newcommand{\TransitionStorageSize}{b_{\text{tr}}} \newcommand{\TranslationComponent}{v} \newcommand{\TranslationVector}{\mathbf{v}} \newcommand{\TranslationalDriftError}{e_{\text{trans}}} \newcommand{\TranslationalJerk}{j} \newcommand{\TranslationalKineticEnergy}{E_{k,\text{trans}}} \newcommand{\TransmissionEnergyPerByte}{E_{\text{tx}}} \newcommand{\TransmissionInputInertia}{J_{\text{in}}} \newcommand{\TransmissionTorsionalStiffness}{K_{\text{joint}}} \newcommand{\TransverseStandardDeviation}{\sigma_\perp} \newcommand{\TravelPosition}{x} \newcommand{\TraverseDistance}{d} \newcommand{\TreatedNeighborFraction}{e} \newcommand{\TreatmentAssignment}{w} \newcommand{\TreatmentConversionRate}{\hat{p}_B} \newcommand{\TreatmentSampleSize}{m_B} \newcommand{\TreeAllReduceCompletionTime}{T_{\text{tree}}} \newcommand{\TreeLikeAllReduceTime}{T_{\text{tree-like}}} \newcommand{\TreeSearchExplorationWeight}{c_{\text{explore}}} \newcommand{\TreeSearchLeafScore}{V} \newcommand{\TreeSearchMeanReturn}{Q} \newcommand{\TreeSearchPriorDistribution}{p_{\text{prior}}} \newcommand{\TreeSearchVisitCount}{N_{\text{visit}}} \newcommand{\TrialCampaignWallTime}{T_{\text{wall}}} \newcommand{\TrialCompletionIndicator}{Y} \newcommand{\TrialCondition}{c} \newcommand{\TrialControlStepCount}{N_{\text{steps}, i}} \newcommand{\TrialCount}{N} \newcommand{\TrialFailureIndicator}{x} \newcommand{\TrialFailureProbability}{p_{\text{fail}}} \newcommand{\TrialIndex}{n} \newcommand{\TrialInterventionCount}{n_{\text{int}}} \newcommand{\TrialLoadReversalCount}{n_{\text{rev}}} \newcommand{\TrialPassProbability}{p_{\text{trial}}} \newcommand{\TrialPathDistance}{d} \newcommand{\TrialResetLatency}{T_{\text{reset}}} \newcommand{\TrialResetTime}{t_{\text{reset}}} \newcommand{\TrialRolloutTime}{t_{\text{rollout}}} \newcommand{\TrialRunTime}{t_{\text{run}}} \newcommand{\TrialSuccessProbability}{p} \newcommand{\TriggeredWindowArrivalCount}{Q_{\text{arr}}} \newcommand{\TrueClearance}{C_{\text{true}}} \newcommand{\TrueLabelComponent}{y} \newcommand{\TrueOutcome}{Y} \newcommand{\TrueOutcomeLevel}{v} \newcommand{\TrueReferentScore}{c_{y_j}} \newcommand{\TruncatedDistanceSample}{d_{\mu}} \newcommand{\TruncatedKeyApproximation}{\hat{\mathbf{K}}_r} \newcommand{\TruncatedKeyLeftSingularMatrix}{\mathbf{U}_r} \newcommand{\TruncatedKeyRightSingularMatrix}{\mathbf{V}_r} \newcommand{\TruncatedKeySpectrumMatrix}{\mathbf{\Sigma}_r} \newcommand{\TruncationBandVolume}{V_{\text{band}}} \newcommand{\TruncationRank}{r} \newcommand{\TruthInstrumentSet}{\mathcal{I}_{\text{truth}}} \newcommand{\TsdfAccumulatedDistance}{D} \newcommand{\TsdfAccumulatedWeight}{W} \newcommand{\TsdfObservationWeight}{w} \newcommand{\TsdfTruncationBand}{\mu_{\text{tsdf}}} \newcommand{\TsdfWeightCap}{W_{\max}} \newcommand{\TuckerCoreTensor}{\mathcal{G}} \newcommand{\TurnAppendLength}{\Delta S_{\text{turn}}} \newcommand{\TurnBoundaryDelay}{t_{\text{boundary}}} \newcommand{\TurnBudgetUsedFraction}{\rho_H} \newcommand{\TurnContext}{c} \newcommand{\TurnContributionDeviationBound}{\sigma} \newcommand{\TurnCovarianceBoundScale}{C} \newcommand{\TurnCovarianceDecayRatio}{\alpha_{\text{corr}}} \newcommand{\TurnFailureRate}{\lambda_{\text{fail}}} \newcommand{\TurnGeneratedTokenCount}{n_{\text{gen}}} \newcommand{\TurnHorizon}{H} \newcommand{\TurnIndex}{t} \newcommand{\TurnInputTokenCost}{C_{\text{in}}} \newcommand{\TurnOffGateCurrent}{I_{g,\text{off}}} \newcommand{\TurnOffGateResistance}{R_{g,\text{off}}} \newcommand{\TurnOnGateResistance}{R_{g,\text{on}}} \newcommand{\TurnOutputTokenCost}{C_{\text{out}}} \newcommand{\TurnPayloadProbability}{q_{\text{turn}}} \newcommand{\TurnReadCount}{r} \newcommand{\TurnReconstructionTime}{T_{\text{recon}}} \newcommand{\TurnReexecutionTime}{T_{\text{exec}}} \newcommand{\TurnReward}{r} \newcommand{\TurnSandboxCost}{C_{\text{sandbox}}} \newcommand{\TurnStateGrowth}{s_{\text{turn}}} \newcommand{\TurnToolFeeCost}{C_{\text{tools}}} \newcommand{\TustinEigenvalue}{\lambda_{\text{Tustin}}} \newcommand{\TustinTransitionMatrix}{\mathbf{A}_{\text{Tustin}}} \newcommand{\TwinCriticReturnEstimate}{Q_{\phi_i}} \newcommand{\TwistCoordinates}{\boldsymbol{\xi}} \newcommand{\TwistCovarianceMatrix}{\boldsymbol{\Sigma}_{\boldsymbol{\xi}}} \newcommand{\TwistMatrix}{\hat{\boldsymbol{\xi}}} \newcommand{\TwistRotationAngle}{\theta_{\text{rot}}} \newcommand{\TwistRotationCoordinates}{\boldsymbol{\omega}} \newcommand{\TwistTranslationMatrix}{\mathbf{V}} \newcommand{\TwistWedgeOperator}{\wedge} \newcommand{\UnacceptedTaskMeanCost}{C_{\text{fail}}} \newcommand{\UnassistedCompletionCount}{N_{\text{unassisted}}} \newcommand{\UnassistedSuccessIndicator}{A} \newcommand{\UnbiasedAngularBrakingDeceleration}{\alpha_{\text{nom}}} \newcommand{\UnbrakedImpactForce}{F_{\text{unbraked}}} \newcommand{\UncachedInputTokenCount}{n_{\text{in}}} \newcommand{\UncachedPromptLength}{S_{\text{new}}} \newcommand{\UncertainScenarioParameters}{x} \newcommand{\UnconstrainedCallLatency}{T_{\text{free}}} \newcommand{\UnconstrainedParseFailureRate}{p_{\text{err}}} \newcommand{\UndampedNaturalFrequency}{\omega_n} \newcommand{\UnfoldedConvolutionOutput}{\mathbf{Y}_{\text{col}}} \newcommand{\UnfoldedPatchMatrix}{\mathbf{X}_{\text{col}}} \newcommand{\UniformDistribution}{\mathcal{U}} \newcommand{\UniformLoopTurnCost}{C_{\text{turn}}} \newcommand{\UnitAliasMultiplier}{k} \newcommand{\UnitImpulseFunction}{\delta} \newcommand{\UnitQuaternion}{\mathbf{q}_{\text{quat}}} \newcommand{\UnitQuaternionScalarComponent}{q_w} \newcommand{\UnitQuaternionSphere}{S^3} \newcommand{\UnitQuaternionXComponent}{q_x} \newcommand{\UnitQuaternionYComponent}{q_y} \newcommand{\UnitQuaternionZComponent}{q_z} \newcommand{\UnitTemperatureProbabilityVector}{\mathbf{p}_{\tau_{\text{temp}}=1}} \newcommand{\UnlabeledPool}{U} \newcommand{\UnloadedTickExecutionTime}{t_{\text{unloaded}}} \newcommand{\UnmitigatedHardwareFaultRate}{\lambda_{\text{unmitigated}}} \newcommand{\UnmodeledCommandPathDelay}{\Delta t_{\text{bus}}} \newcommand{\UnobservableForceOffset}{\Delta} \newcommand{\UnobservedUnknownSpace}{\mathcal{M}_{\text{unknown}}} \newcommand{\UnprojectionJacobian}{\mathbf{J}_{\text{unproj}}} \newcommand{\UnrecoverableDamageCost}{C_{\text{blast}}} \newcommand{\UnreservedStopDelay}{\delta} \newcommand{\UnscaledAttentionScoreMatrix}{\mathbf{A}} \newcommand{\UnshardedLocalExecutionTime}{T_{\text{compute}}} \newcommand{\UnsquashedLatentAction}{\mathbf{u}} \newcommand{\UntilPrefixTime}{t''} \newcommand{\UntrackedEvidenceHorizon}{\tau_{\text{ev,untracked}}} \newcommand{\UpdatedErrorCovariance}{\mathbf{P}_{k|k}} \newcommand{\UpdatedModelParameters}{\theta_{\text{new}}} \newcommand{\UpdatedParameterSubset}{\theta_{\text{updated}}} \newcommand{\UpdatedSoftmaxRunningMaximum}{m'} \newcommand{\UpdatedStateEstimate}{\hat{\mathbf{x}}_{k|k}} \newcommand{\UpperRatioClippingWidth}{\epsilon_{\text{high}}} \newcommand{\UprightPosition}{\mathbf{p}_{\text{upright}}} \newcommand{\UprightRange}{r} \newcommand{\UpstreamGradientElement}{\bar{y}} \newcommand{\UpstreamGradientVector}{\mathbf{v}} \newcommand{\UpstreamStageLatency}{X} \newcommand{\UsableDemonstrationYield}{Y_{\text{usable}}} \newcommand{\UsefulAcceleratorHourCost}{C_{\text{useful}}} \newcommand{\UsefulComputeFraction}{f_{\text{compute}}} \newcommand{\UsefulModelFlops}{O_{\text{useful}}} \newcommand{\UsefulStepCount}{N} \newcommand{\UsefulTrainingTime}{T_{\text{useful}}} \newcommand{\UserConnectionSet}{\mathcal{N}} \newcommand{\UserSpaceSetupTime}{T_{\text{user}}} \newcommand{\UvloThresholdVoltage}{V_{\text{UVLO}}} \newcommand{\VacuumLightSpeed}{c} \newcommand{\ValidCandidateRate}{p_{\text{valid}}} \newcommand{\ValidTokenSet}{\mathcal{V}_{\text{valid}}} \newcommand{\ValidatedMotionDuration}{T_{\text{yield}}} \newcommand{\ValidatedProposalEvent}{e_{\text{prop}}} \newcommand{\ValidationDataset}{\mathcal{D}_{\text{val}}} \newcommand{\ValidationGateThreshold}{\gamma_{\text{gate}}} \newcommand{\ValidationLoss}{\mathcal{L}_{\text{val}}} \newcommand{\VanishingTimeOffset}{\epsilon} \newcommand{\VariationalDistribution}{q_\phi} \newcommand{\VariationalParameters}{\phi} \newcommand{\VectorAngle}{\phi} \newcommand{\VectorElementCount}{N_{\text{vec}}} \newcommand{\Velocity}{\mathbf{v}} \newcommand{\VelocitySaturationExponent}{\alpha} \newcommand{\VerificationCheckCost}{C_{\text{ver}}} \newcommand{\VerificationCheckCount}{K} \newcommand{\VerificationPoolCapacity}{\mu_{\text{verify}}} \newcommand{\VerificationScheduleCost}{C} \newcommand{\VerificationTrialCount}{n_{\text{trial}}} \newcommand{\VerificationTrialIndex}{j} \newcommand{\VerificationTrialTime}{T_{\text{trial}}} \newcommand{\VerifiedDemonstrationDataset}{\mathcal{D}_{\text{verified}}} \newcommand{\VerifierFalseAcceptanceRate}{\epsilon_{\text{FA}}} \newcommand{\VerifierFalseRejectionRate}{\epsilon_{\text{FR}}} \newcommand{\VerifierPassProbability}{q} \newcommand{\VerifierPrecision}{\Pi_{V}} \newcommand{\VerifierTimeout}{T_{\text{out}}} \newcommand{\VerifierTrueAcceptanceRate}{u} \newcommand{\VerifierVerdict}{V} \newcommand{\VersionSkewBound}{k_{\text{skew}}} \newcommand{\VertexSlotTime}{d} \newcommand{\VerticalFocalLength}{f_y} \newcommand{\VibrationFrequency}{f_{\text{vib}}} \newcommand{\VirtualAccelerationCommand}{\ddot{\mathbf{q}}^*} \newcommand{\VirtualDampingMatrix}{\mathbf{D}_{\text{virt}}} \newcommand{\VirtualPipelineStagesPerDevice}{V} \newcommand{\ViscousDampingMatrix}{\mathbf{D}} \newcommand{\VisionBackboneTime}{t_{\text{backbone}}} \newcommand{\VisionTokenEmbeddings}{\mathbf{z}_{\text{vision}}} \newcommand{\VisualConditioningEmbedding}{\mathbf{E}} \newcommand{\VisualEncodingTime}{t_{\text{vis}}} \newcommand{\VitImagePatch}{\mathbf{x}_p} \newcommand{\VitPatchProjectionWeights}{\mathbf{W}_{\text{patch}}} \newcommand{\VitPatchSize}{p_{\text{patch}}} \newcommand{\VitPatchTokenEmbedding}{\mathbf{z}} \newcommand{\VocabularyToken}{v} \newcommand{\VocabularyTokenLogit}{o} \newcommand{\VolumetricFlowRate}{\dot{V}} \newcommand{\VoxelBlockCoordinate}{\mathbf{b}} \newcommand{\VoxelBlockEdgeLength}{L_{\text{blk}}} \newcommand{\VoxelCenterPosition}{\mathbf{p}_{\text{vox}}} \newcommand{\VoxelIndex}{i} \newcommand{\VoxelOccupancyState}{m} \newcommand{\VoxelPitch}{r} \newcommand{\VoxelStorageSize}{s_{\text{voxel}}} \newcommand{\VoxelUpdateTraffic}{s_{\text{rw}}} \newcommand{\WarmupEpochCount}{N_{\text{warmup}}} \newcommand{\WarmupStepCount}{W} \newcommand{\WatchdogClockFrequency}{f_{\text{wdg}}} \newcommand{\WatchdogCounterReading}{W} \newcommand{\WatchdogEarliestServiceTime}{T_{\text{lower}}} \newcommand{\WatchdogLatestServiceTime}{T_{\text{upper}}} \newcommand{\WatchdogLowerWindowCount}{W_{\text{lower}}} \newcommand{\WatchdogReloadCount}{W_{\text{init}}} \newcommand{\WatchdogServiceTime}{t_{\text{service}}} \newcommand{\WatchdogToken}{T} \newcommand{\WatchdogUpperWindowCount}{W_{\text{upper}}} \newcommand{\WaveImpedance}{b} \newcommand{\WeightElementStorageSize}{s_{\text{elem,W}}} \newcommand{\WeightMatrix}{\mathbf{W}} \newcommand{\WeightMatrixColumnCount}{n} \newcommand{\WeightMatrixEntry}{W_{ij}} \newcommand{\WeightMatrixRowCount}{m} \newcommand{\WeightMemory}{M_{\text{weights}}} \newcommand{\WeightOnlyStepTime}{t} \newcommand{\WeightPenaltyStrength}{\lambda_{\text{reg}}} \newcommand{\WeightQuantizationScale}{s_W} \newcommand{\WeightRangeBound}{W_{\text{max}}} \newcommand{\WeightStreamingDecodeTime}{T_{\text{decode}}} \newcommand{\WeightVector}{\mathbf{w}} \newcommand{\WeightedNormArgument}{\mathbf{z}} \newcommand{\WheelAngularSpeed}{\omega} \newcommand{\WheelDiameter}{D_{\text{wheel}}} \newcommand{\WheelInertia}{J_{\text{wheel}}} \newcommand{\WheelNormalLoad}{F_z} \newcommand{\WheelRadius}{r} \newcommand{\WheelRevolutionCount}{N_{\text{rev}}} \newcommand{\WheelTrackWidth}{b} \newcommand{\WhiteNoiseProcess}{\mathcal{WN}} \newcommand{\WholeBodyDecisionVariables}{\mathbf{z}} \newcommand{\WholeRepositoryShardGrant}{\Gamma_{b}} \newcommand{\WidthMultiplier}{w_{\text{mult}}} \newcommand{\WidthScalingRatio}{\beta} \newcommand{\WilsonIntervalCenter}{\tilde{p}} \newcommand{\WindingCoreThermalResistance}{R_{\text{th,wc}}} \newcommand{\WindingCurrent}{I} \newcommand{\WindingJouleHeat}{E_{\text{thermal}}} \newcommand{\WindingLossPower}{P_{\text{loss}}} \newcommand{\WindingTemperature}{T_{\text{winding}}} \newcommand{\WindingTemperatureLimit}{T_{\text{limit}}} \newcommand{\WindingTerminalVoltage}{V_{\text{terminal}}} \newcommand{\WindingThermalCapacitance}{C_{\text{wind}}} \newcommand{\WindowArrivalCount}{k} \newcommand{\WindowArrivalOffset}{t} \newcommand{\WindowSpendingLimit}{C_{\text{win}}} \newcommand{\WithinTaskRunStandardDeviation}{\sigma_{\text{run}}} \newcommand{\WorkedTraceProduct}{c} \newcommand{\WorkedTraceProductAdjoint}{\bar{c}} \newcommand{\WorkedTraceSine}{b} \newcommand{\WorkedTraceSineAdjoint}{\bar{b}} \newcommand{\WorkedTraceSquare}{a} \newcommand{\WorkedTraceSquareAdjoint}{\bar{a}} \newcommand{\WorkerBaseCommitHash}{h_{\text{base}}} \newcommand{\WorkerCandidateCommitHash}{h_{\text{worker}}} \newcommand{\WorkerCompletionDistribution}{F} \newcommand{\WorkerCompletionTime}{T} \newcommand{\WorkerCount}{N_{\text{workers}}} \newcommand{\WorkerDelayProbability}{p} \newcommand{\WorkerIndex}{k} \newcommand{\WorkerMinibatch}{B} \newcommand{\WorkerOverheadSlope}{\gamma} \newcommand{\WorkerTransformTime}{T_{\text{transform}}} \newcommand{\WorkerWrittenFileCount}{w} \newcommand{\WorkloadMeanOutputLength}{\mu} \newcommand{\WorkloadRequestIndex}{i} \newcommand{\WorkspaceExtentX}{L_x} \newcommand{\WorkspaceExtentY}{L_y} \newcommand{\WorkspaceExtentZ}{L_z} \newcommand{\WorkspaceRestoreTime}{T_{\text{ws}}} \newcommand{\WorkspaceVolume}{V_{\text{ws}}} \newcommand{\WorldBaseTransform}{\mathbf{T}_{WB}} \newcommand{\WorldBodyTransform}{\mathbf{T}_{wb}} \newcommand{\WorldFramePoint}{\mathbf{p}_{\text{world}}} \newcommand{\WorldLidarTransform}{\mathbf{T}_{wl}} \newcommand{\WorldMapTransform}{\mathbf{T}_{\text{world}}^{\text{map}}} \newcommand{\WorldPointCovariance}{\boldsymbol{\Sigma}_{\text{world}}} \newcommand{\WorldReferenceFrame}{\mathcal{F}_W} \newcommand{\WorldStateSpace}{\mathcal{S}} \newcommand{\WorldToCameraRotation}{\mathbf{R}_{CW}} \newcommand{\WorldToCameraTransform}{\mathbf{T}_{CW}} \newcommand{\WorldToCameraTranslation}{\mathbf{t}_{CW}} \newcommand{\WornPlantTransitionDistribution}{p_{n \gg 1}} \newcommand{\WorseArmSuccessProbability}{p_{\text{low}}} \newcommand{\WorstCaseExecutionTime}{C} \newcommand{\WorstCaseInterruptLatency}{t_{\text{irq,lat}}} \newcommand{\WorstCasePermissionCycleTime}{T_{\text{exec}}} \newcommand{\WorstCaseResponseTime}{R} \newcommand{\WristAngularVelocity}{\boldsymbol{\omega}_{\text{wrist}}} \newcommand{\WristCameraEmbedding}{\mathbf{e}_{\text{wrist}}} \newcommand{\WristLinearVelocity}{\mathbf{v}_{\text{wrist}}} \newcommand{\WristObjectTransform}{\mathbf{T}_{\text{wrist} \leftarrow \text{object}}} \newcommand{\WristSkewDisplacement}{\Delta \mathbf{p}_{\text{skew}}} \newcommand{\XAxisAngularRate}{\omega_x} \newcommand{\XAxisRotationCoordinate}{\omega_x} \newcommand{\XForceCeiling}{F_x} \newcommand{\XPositionErrorEnvelope}{e_x} \newcommand{\XTaskToleranceSemiAxis}{r_x} \newcommand{\XTorqueCeiling}{\tau_x} \newcommand{\YAxisAngularRate}{\omega_y} \newcommand{\YAxisRotationCoordinate}{\omega_y} \newcommand{\YForceCeiling}{F_y} \newcommand{\YPositionErrorEnvelope}{e_y} \newcommand{\YTaskToleranceSemiAxis}{r_y} \newcommand{\YTorqueCeiling}{\tau_y} \newcommand{\YawRate}{\omega_z} \newcommand{\YoshikawaManipulability}{w} \newcommand{\ZAxisRotationCoordinate}{\omega_z} \newcommand{\ZForceCeiling}{F_z} \newcommand{\ZPositionErrorEnvelope}{e_z} \newcommand{\ZTaskToleranceSemiAxis}{r_z} \newcommand{\ZTorqueCeiling}{\tau_z} \newcommand{\ZTransformVariable}{z} \newcommand{\ZeroEntryIndicator}{\mathbf{1}_{\{(\mathbf{W}_{\text{sparse}})_{ij} = 0\}}} \newcommand{\ZeroFailureTrialCount}{n} \newcommand{\ZeroFailureUpperConfidenceLimit}{p_{\text{fail, upper}}^{95\%}} \newcommand{\ZeroMatrix}{\mathbf{0}} \newcommand{\ZeroMomentPoint}{\mathbf{p}_{\text{ZMP}}} \newcommand{\ZeroVector}{\mathbf{0}} \newcommand{\ZohHoldTravel}{d_{\text{ZOH}}} \newcommand{\ZohPhaseShift}{\phi_{\text{ZOH}}} \newcommand{\ZohTransportDelay}{\tau_{\text{ZOH}}} \newcommand{\AuthorityLevels}{\AuthorityExposureLevel} \newcommand{\BreakEvenTaskVolume}{\BreakEvenTaskCount} \newcommand{\PertokenPricesCache}{\CachedInputTokenPrice} \newcommand{\ContentionAndCoherencyCoefficientsTwo}{\CoherencyCoefficient} \newcommand{\CoherencyContentionCoefficient}{\CoherencyCoefficient} \newcommand{\TaskDeadline}{\CompletionDeadline} \newcommand{\Deadline}{\CompletionDeadline} \newcommand{\Confidentiality}{\ConfidentialityLabel} \newcommand{\ContentionAndCoherencyCoefficients}{\ContentionCoefficient} \newcommand{\CostPerAcceptedTaskEff}{\CostPerAcceptedTask} \newcommand{\DuplicateeffectProbability}{\DuplicateEffectProbability} \newcommand{\EstimatedAdvantageK}{\EstimatedHistoryAdvantage} \newcommand{\EstimatedValueK}{\EstimatedRemainingReturn} \newcommand{\ExpectedIrreversibleLossA}{\ExpectedIrreversibleLoss} \newcommand{\PertokenPricesIn}{\InputTokenPrice} \newcommand{\CohensKappa}{\InterAnnotatorAgreement} \newcommand{\KvBlockSizeBlk}{\KvBlockSize} \newcommand{\MaskedFinetuningLossSft}{\MaskedFinetuningLoss} \newcommand{\ValidityIntervalOfAMemoryEntryBirth}{\MemoryEntryBirthGeneration} \newcommand{\ValidityIntervalOfAMemoryEntryDeath}{\MemoryEntryDeathGeneration} \newcommand{\MemoryHeldDuringAWait}{\MemoryHoldDuringWait} \newcommand{\OptimalCheckpointIntervalCkpt}{\OptimalCheckpointInterval} \newcommand{\PertokenPricesOut}{\OutputTokenPrice} \newcommand{\PertokenDecodeTime}{\PerTokenDecodeTime} \newcommand{\TokenLossMask}{\PositionLossMask} \newcommand{\LossMaskT}{\PositionLossMask} \newcommand{\ValidityIntervalOfAMemoryEntryQ}{\QueryWorkspaceGeneration} \newcommand{\RequestAndReplylossProbabilitiesTwo}{\ReplyLossProbability} \newcommand{\RequestAndReplylossProbabilities}{\RequestLossProbability} \newcommand{\EnvironmentStateK}{\RolloutEnvironmentState} \newcommand{\StalesupportRate}{\StaleSupportRate} \newcommand{\StateLevels}{\StateExposureLevel} \newcommand{\GoalContract}{\TaskContractGoal} \newcommand{\Environment}{\TaskEnvironment} \newcommand{\Vocabulary}{\TokenVocabulary} \newcommand{\ActionProposal}{\TrajectoryAction} \newcommand{\ConcurrentTrajectoriesTwo}{\TrajectoryAdmissionRate} \newcommand{\ActionObservation}{\TrajectoryObservation} \newcommand{\Observation}{\TrajectoryObservation} \newcommand{\StateAtTurn}{\TrajectoryState} \newcommand{\PerturnAppend}{\TurnAppendLength} \newcommand{\Context}{\TurnContext} \newcommand{\Horizon}{\TurnHorizon} \newcommand{\VerifierFalseacceptance}{\VerifierFalseAcceptanceRate} \newcommand{\VerifierFalseacceptanceFr}{\VerifierFalseRejectionRate} \newcommand{\WorkerCountWorkers}{\WorkerCount} \newcommand{\AllocationHoldTime}{\AllocatedWallTime} \newcommand{\CheckpointIntervalCkpt}{\CheckpointInterval} \newcommand{\AcceleratorsPerNodeNodes}{\ClusterNodeCount} \newcommand{\CommunicationcomputationRatio}{\CommunicationComputeRatio} \newcommand{\PercomponentFailureRate}{\ComponentFailureRate} \newcommand{\Correlation}{\CorrelationCoefficient} \newcommand{\DataparallelDegreeDp}{\DataParallelDegree} \newcommand{\NumberOfDevices}{\DeviceCount} \newcommand{\TypeIAndTypeIiErrorRatesStat}{\HypothesisTestFalseNegativeRate} \newcommand{\TypeIAndTypeIiErrorRatesSig}{\HypothesisTestSignificanceLevel} \newcommand{\DollarCostInfer}{\InferenceCost} \newcommand{\KvcacheBytesPerToken}{\KvCacheBytesPerToken} \newcommand{\KvcacheMemory}{\KvCacheMemory} \newcommand{\CrossoverPoint}{\LatencyBandwidthCrossoverSize} \newcommand{\LoggpLongmessageTime}{\LoggpLongMessageTime} \newcommand{\LogploggpNetworkLatency}{\LogpNetworkLatency} \newcommand{\LongmessageGapPerByte}{\LongMessageGapPerByte} \newcommand{\MeanTimeBetweenFailuresThree}{\MeanTimeBetweenFailures} \newcommand{\PermessageLatency}{\MessageStartupLatency} \newcommand{\NdeviceTime}{\MultiDeviceRunTime} \newcommand{\PipelineparallelDegreePp}{\PipelineParallelDegree} \newcommand{\MlProductivityGoodputFactorsProgram}{\ProgramGoodput} \newcommand{\ReceiverOverheadRecv}{\ReceiverOverhead} \newcommand{\CollectiveCompletionTimeRing}{\RingAllReduceCompletionTime} \newcommand{\RingtreeCrossoverPayload}{\RingTreeCrossoverPayload} \newcommand{\MlProductivityGoodputFactorsRuntime}{\RuntimeGoodput} \newcommand{\GoodputRatio}{\RuntimeGoodput} \newcommand{\ScalingExponentScale}{\ScalingExponent} \newcommand{\MlProductivityGoodputFactorsScheduling}{\SchedulingGoodput} \newcommand{\SingledeviceTimeOne}{\SingleDeviceRunTime} \newcommand{\ReliabilityFunctionSystem}{\SystemReliability} \newcommand{\TensorparallelDegreeTp}{\TensorParallelDegree} \newcommand{\SmallConstant}{\ToleratedFailureProbability} \newcommand{\DollarCostTrain}{\TrainingCost} \newcommand{\CollectiveCompletionTimeTree}{\TreeAllReduceCompletionTime} \newcommand{\UsefulComputetimeFraction}{\UsefulComputeFraction} \newcommand{\AccuracyAtTime}{\AccuracyAfterDeployment} \newcommand{\NumberOfAttentionHeads}{\AttentionHeadCount} \newcommand{\Distribution}{\InputDistribution} \newcommand{\NumberOfKeyValueHeads}{\KvHeadCount} \newcommand{\NumberOfKeyvalueHeadsKv}{\KvHeadCount} \newcommand{\NumberOfLayers}{\LayerCount} \newcommand{\LayerInputAndOutputWidths}{\LayerInputWidth} \newcommand{\LayerInputAndOutputWidthsTwo}{\LayerOutputWidth} \newcommand{\Gradient}{\LossGradient} \newcommand{\TrainingDistributionZero}{\TrainingDistribution} \newcommand{\AcceleratorCountGpu}{\AcceleratorCount} \newcommand{\ActivationMemoryActivations}{\ActivationMemory} \newcommand{\BatchServiceTimeSvc}{\BatchServiceTime} \newcommand{\EnergyPerOperationCompute}{\EnergyPerOperation} \newcommand{\GradientMemoryGradients}{\GradientMemory} \newcommand{\IronlawTermTimesCompute}{\IronLawComputeTime} \newcommand{\SingleDeviceComputeTime}{\IronLawComputeTime} \newcommand{\IronlawTermTimesMemory}{\IronLawMemoryTime} \newcommand{\LossscaleFactor}{\LossScaleFactor} \newcommand{\OptimizerstateMemory}{\OptimizerStateMemory} \newcommand{\RequestTimeInSystemLat}{\RequestTimeInSystem} \newcommand{\StoragePricePerByteTime}{\StorageCapacityPrice} \newcommand{\WeightMemoryWeights}{\WeightMemory} \newcommand{\WindingAndAmbientTemperatureTwo}{\AmbientTemperature} \newcommand{\BackemfVoltageBemf}{\BackEmfVoltage} \newcommand{\CoordinateReferenceFramesB}{\BodyReferenceFrame} \newcommand{\CameraframeThreedCoordinate}{\CameraFramePoint} \newcommand{\CartesianThreedPosition}{\CartesianPosition} \newcommand{\CommandTransportTimeBus}{\CommandTransportTime} \newcommand{\ContactForceVectorK}{\ContactPointForce} \newcommand{\ContactPointJacobianK}{\ContactPointJacobian} \newcommand{\ContinuousPeakCurrent}{\ContinuousCurrent} \newcommand{\CredibleDecelerationBrake}{\CredibleBrakingDeceleration} \newcommand{\OpenloopCrossoverFrequency}{\CrossoverFrequency} \newcommand{\PhaseLagDegradation}{\DelayPhaseLag} \newcommand{\DiffusionScheduleParameterK}{\DiffusionCumulativeSchedule} \newcommand{\DispatchtoadmissionIntervalDa}{\DispatchAdmissionInterval} \newcommand{\EmittedTokenCountOut}{\EmittedTokenCount} \newcommand{\FundamentalAndEssentialMatricesTwo}{\EssentialMatrix} \newcommand{\ForwardinvariantSafeSet}{\ForwardInvariantSafeSet} \newcommand{\FreespaceDepth}{\FreeSpaceDepth} \newcommand{\FundamentalAndEssentialMatrices}{\FundamentalMatrix} \newcommand{\TransmissionEfficiencyGear}{\GearboxTransmissionEfficiency} \newcommand{\HardwareAndCommoncauseRateOther}{\HardwareCommonCauseRate} \newcommand{\ContinuousPeakTorqueHold}{\HoldingTorque} \newcommand{\OptimalInertiamatchingRatio}{\InertiaMatchingRatio} \newcommand{\IntentleaseExpiryIntentexp}{\IntentLeaseExpiry} \newcommand{\LatentStyleStateEmbedding}{\LatentStyleVariable} \newcommand{\LinearBarrierDecayRateCbf}{\LinearBarrierDecayRate} \newcommand{\Momentum}{\LinearMomentum} \newcommand{\RotorAndLoadInertiaTwo}{\LoadInertia} \newcommand{\LqrGainAndWeights}{\LqrFeedbackGain} \newcommand{\CenterOfMass}{\MassCenterPosition} \newcommand{\TorqueAndBackemfConstants}{\MotorTorqueConstant} \newcommand{\NoisePredictionNetworkTwo}{\NoisedActionChunk} \newcommand{\ObservabilityMatricesNl}{\NonlinearObservationSpace} \newcommand{\ObservabilityMatrices}{\ObservabilityMatrix} \newcommand{\ContinuousPeakCurrentTwo}{\PeakCurrent} \newcommand{\ContinuousPeakTorque}{\PeakTorque} \newcommand{\PermissionloopPeriodTick}{\PermissionLoopPeriod} \newcommand{\PhaseInductanceAndResistance}{\PhaseInductance} \newcommand{\PhaseInductanceAndResistanceTwo}{\PhaseResistance} \newcommand{\InitialAndCeilingError}{\PositionErrorCeiling} \newcommand{\RenewaljitterAllowance}{\RenewalJitterAllowance} \newcommand{\ResidentStopDistanceSuffix}{\ResidentStopDistance} \newcommand{\CoefficientOfRestitution}{\RestitutionCoefficient} \newcommand{\RigidtransformTranslation}{\RigidTransformTranslation} \newcommand{\RotorAndLoadInertia}{\RotorInertia} \newcommand{\SamplingPeriodAndRate}{\SamplingPeriod} \newcommand{\SensorLeverarmVector}{\SensorLeverArm} \newcommand{\SequentialLoglikelihoodRatioM}{\SequentialLogLikelihoodRatio} \newcommand{\SinglestepImitationError}{\SingleStepImitationError} \newcommand{\SprtBoundariesLo}{\SprtLowerBoundary} \newcommand{\SprtBoundariesUp}{\SprtUpperBoundary} \newcommand{\LinearStatespaceMatrices}{\StateSpaceInputMatrix} \newcommand{\LinearStatespaceMatricesSys}{\StateSpaceSystemMatrix} \newcommand{\PertrialProbabilitiesTarget}{\TargetTrialSuccessProbability} \newcommand{\TorqueproducingCurrent}{\TorqueProducingCurrent} \newcommand{\TrackingerrorBound}{\TrackingErrorBound} \newcommand{\PertrialProbabilitiesFail}{\TrialFailureProbability} \newcommand{\TsdfAccumulatedVolumeVox}{\TsdfAccumulatedWeight} \newcommand{\VirtualDampingAndStiffness}{\VirtualDampingMatrix} \newcommand{\Radius}{\WheelRadius} \newcommand{\WindingAndAmbientTemperature}{\WindingTemperature} \newcommand{\CoordinateReferenceFramesW}{\WorldReferenceFrame} \newcommand{\ZerofailureTrialCount}{\ZeroFailureTrialCount} \newcommand{\ZeroMomentPointZmp}{\ZeroMomentPoint} \newcommand{\Glyph}[1]{#1} $$

2 System Paradigms

Isometric blueprint showing one model artifact moving across cloud, edge, mobile, and tiny-device deployment environments with shrinking resource envelopes.

Purpose

Machine Learning Systems Architecture Stack

Architecture stack focus for this chapter.

Why does deploying the same model to a phone vs. a data center demand fundamentally different engineering?

The defining insight of ML systems engineering is that constraints drive architecture. The speed of light sets an absolute floor on how quickly distant servers can respond, thermodynamics limits how much computation can occur in a given volume before heat becomes unmanageable, and memory physics makes moving data more expensive than processing it. Because these physical limits persist as technology improves, deployment categories organize recurring constraint regimes rather than divide hardware into fixed, mutually exclusive classes. A data center can train billion-parameter models yet cannot guarantee low-latency responses to users thousands of miles away; a smartphone can respond immediately yet holds a fraction of the memory budget and must share a small battery with the rest of the phone; and a microcontroller can run on a coin-cell battery for years while offering barely enough compute for a simple keyword detector. Across these regimes, power budgets span roughly nine orders of magnitude, from megawatts in a data center to milliwatts on a microcontroller, while memory capacity spans from terabytes to kilobytes. The same model applied to the same data therefore demands radically different engineering in each regime, not because the physics changes, but because different constraints dominate. The engineering task is not to identify a universally best deployment, but to locate the constraint that binds in the intended operating regime. In D·A·M terms, understanding these regimes turns deployment from an operational afterthought into a co-design problem in which data locality, algorithm structure, and machine constraints jointly determine what is possible.

Learning Objectives
  • Explain how physical constraints shape deployment paradigms from cloud to TinyML
  • Diagnose which term of a tier’s silicon contract binds a workload, separating iron-law limits from memory and energy feasibility
  • Match workload demands to deployment budgets using lighthouse model examples
  • Compare cloud, edge, mobile, and TinyML by operational constraints and quantitative trade-offs
  • Apply the decision framework to select paradigms by privacy, latency, resource, and cost constraints
  • Analyze hybrid patterns that combine paradigms to satisfy system constraints
  • Evaluate deployment placements against data-locality deadlines, energy per inference, and lifecycle cost

2.1 Four Deployment Regimes Across Nine Orders of Magnitude

Consider two extremes: a wake-word detector on a smartwatch and a recommendation engine in a data center. The wake-word detector represents a TinyML workload operating under milliwatt power budgets and kilobyte memory limits; the recommendation engine exemplifies a cloud ML workload requiring terabytes of embedding tables and megawatt-scale infrastructure. These systems solve different problems under opposite physical constraints, and their supporting infrastructure differs sharply in scale and design. The introduction’s D·A·M taxonomy (The D·A·M Intersection Landscape) treated the machine as one of three interacting components. Between these two extremes, the machine is the component that changes most, and its physical limits decide which data and algorithmic choices remain open.

D·A·M locator triangle with the Machine node highlighted and the Data and Algorithm nodes shown in gray.

The machine axis sets the deployment envelope.

Physical constraints determine where an ML model can run and shape what is possible in ways no algorithmic choice can override. They bind the whole system, not only the weights: data ingestion pipelines, feature extraction, serving runtimes, telemetry, and hardware resource managers must all fit the host platform’s physical envelope.
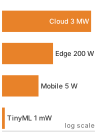
Vertical bar ladder of four deployment tiers by power on a log scale: Cloud 3 MW, Edge 200 W, Mobile 5 W, TinyML 1 mW, spanning megawatts to milliwatts.

Power falls from megawatts in the cloud to milliwatts in TinyML.

1 Deployment paradigm: A distinct operating regime defined by latency, power, memory, and connectivity constraints. The Cloud-to-TinyML spectrum changes which resources bind; optimizing within an infeasible regime cannot satisfy the application’s deployment budget. Raising a cloud model’s throughput by 5 percent, for example, cannot rescue an application whose 10 ms latency budget the network round trip alone exceeds.

Shi, Weisong, Jie Cao, Quan Zhang, Youhuizi Li, and Lanyu Xu. 2016. “Edge Computing: Vision and Challenges.” IEEE Internet of Things Journal 3 (5): 637–46. https://doi.org/10.1109/jiot.2016.2579198.

Three physical constraints (latency, power dissipation, and memory) organize four deployment paradigms.1 The categories overlap—edge describes proximity to data, while mobile and TinyML further distinguish local devices by their resource envelopes—and the combination of a workload and its target platform determines which constraint binds first. Centralizing computation in Cloud ML provides elastic compute and large memory capacity at the cost of wide-area network latency on every inference; moving workloads to Edge ML eliminates that network round trip and keeps sensitive data on premises (Shi et al. 2016), but caps available compute at local site power and cooling budgets. Stepping onto battery-powered devices, Mobile ML delivers responsive interaction directly on handsets and tablets within a passive thermal envelope where sustained computation triggers throttling, and at the low-power extreme, TinyML runs on microcontrollers (Janapa Reddi et al. 2022) whose milliwatt power budgets and kilobyte memories require compact models and integer arithmetic. Along the way, the memory constraint changes form: in the data center it usually binds as bandwidth, whereas on a microcontroller it binds first as capacity. Arranged along one physical continuum, these tiers run from warehouse-scale megawatts in data centers down to milliwatts on embedded microcontrollers (figure 1).

Figure 1: Distributed Intelligence Spectrum: Deployment tiers form a continuum governed by physical constraints, spanning nine orders of magnitude in power. Moving from centralized cloud infrastructure to on-device TinyML trades raw computational capacity and elastic scale for shorter communication paths, data locality, and network independence.

While figure 1 traces the continuous progression from embedded sensors to data centers, table 1 quantifies conceptual operating envelopes across processing location, round-trip latency, power draw, and memory capacity. The cloud row describes facility power; the other rows describe local systems or devices. These envelopes compare deployment scales, whose physical basis is developed in section 2.2.

Table 1: The Deployment Spectrum (Conceptual): Four paradigms span nine orders of magnitude in power (MW to mW) and memory (TB to KB). This conceptual overview defines each paradigm by its operating regime, and each power entry names a typical class rather than a bound; the concrete hardware spectrum in table 4 grounds these categories in specific platforms and quantitative decision thresholds. The hardware specifications and physical constants underpinning these numbers are catalogued in System Assumptions.
Paradigm Where Latency (ms) Power Memory Best For
Cloud ML Data centers 100-500 MW TB Training, complex inference
Edge ML Local servers 10-100 100 W GB Real-time inference, privacy
Mobile ML Smartphones 5-50 3–5 W GB Personal AI, offline
TinyML Microcontrollers 1-10 mW KB Always-on sensing

At every tier, the hardware offers a silicon contract: a compute rate, a memory bandwidth, and an execution overhead. Different tiers offer different budgets for these resources, and the contract also carries a memory capacity, which is not a term of execution time but a precondition that decides whether a workload fits on the tier at all. Physical constraints set those budgets, and each budget enters one term of the iron law of ML systems, which decomposes end-to-end execution time into data movement, computation, and system overhead. The speed of light, thermal dissipation, and memory signaling shape those terms, which is why deployment paradigms exist as distinct engineering regimes rather than arbitrary points on a continuous slider.

Self-Check: Question
  1. Which statement correctly characterizes the span of power and memory capacity across the four deployment paradigms (Cloud ML, Edge ML, Mobile ML, and TinyML)?

    1. Power spans approximately nine orders of magnitude from megawatts in cloud data centers to milliwatts in microcontrollers, while memory spans from terabytes to kilobytes.
    2. Power spans three orders of magnitude from kilowatts to watts, while memory remains in the gigabyte range across all four deployment tiers.
    3. Power is identical across Edge, Mobile, and TinyML tiers (all operating under 5 W), with only Cloud ML exceeding 100 W.
    4. Memory capacity varies by at most a factor of \(10^3\) between cloud servers and microcontrollers, while power varies by \(10^{12}\).
  2. In ML systems engineering, what is meant by the silicon contract established by a single-node stack?

    1. The legal warranty provided by chip foundries guaranteeing zero hardware defects during multi-week training runs.
    2. The fixed performance bargain offered by a hardware platform, defined by its peak compute rate, memory bandwidth, and fixed launch overhead.
    3. The software abstraction layer that guarantees automated portability across CPUs, GPUs, and microcontrollers without performance regression.
    4. The dynamic power-scaling policy that allows an accelerator to exceed its thermal design power indefinitely under heavy batch loads.
  3. Why does deploying an ML model across different paradigms require treating deployment as a first-order D·A·M co-design problem rather than a late-stage packaging step?

See Answers →

2.2 Physical Constraints on Deployment

A safety system with a 10 ms reaction budget cannot wait for a cross-country round trip, and a billion-parameter model cannot be squeezed into a microcontroller by better code alone. Both follow directly from the physical laws governing the speed of light, power thermodynamics, and memory signaling. The light barrier limits remote responsiveness, the power wall restricts sustained throughput, and the memory wall caps data transfer. Where a system runs changes the operational terms the hardware offers, which changes what the hardware can offer the model.

↩︎ A first sketch of the deployment spectrum and its three walls is established in Deployment context shapes the lifecycle.

The light barrier

Sending a sensor packet from California to a cloud data center in Virginia (~3,600 km straight-line) requires ~36 ms round-trip in optical fiber before a single floating-point operation begins, and real networks add routing, protocol, queuing, and processing delays on top. Any application that requires a sub-10 ms response cannot rely on distant cloud infrastructure, no matter how fast the remote accelerators are. The light barrier sets this absolute latency2 floor. Let \(\text{Distance}\) denote the one-way path length and \(\FiberPropagationSpeed\) the propagation speed in optical fiber. Equation 1 gives the minimum round-trip time: \[\MinimumRoundTripLatency= \frac{2 \times \text{Distance}}{\FiberPropagationSpeed} \approx \frac{2 \times \text{Distance}}{200{,}000 \text{ km/s}} \tag{1}\] For optical fiber, \(\FiberPropagationSpeed\approx 200{,}000\) km/s, roughly two-thirds of its vacuum value because light travels more slowly through glass than through a vacuum. This propagation floor directly motivates edge ML: when a tight latency budget rules out the round trip, computation must move closer to the data source.

2 Latency: The time between issuing a request and receiving a result, corresponding to \(\Time\) in the iron law, where propagation delay enters through the fixed-overhead term \(\Latency\). The light barrier makes that propagation floor irreducible, as equation 1 quantifies. Every millisecond consumed by distance is a millisecond unavailable for model inference, which is why the light barrier forces paradigm selection rather than mere optimization.

The power wall

Doubling a processor’s clock frequency to finish a model’s arithmetic in half the time does not merely double its power draw; because higher frequencies typically require higher supply voltages to switch transistors reliably, dynamic power can jump roughly eightfold, turning every extra watt into heat that the package and chassis must carry away. That thermal ceiling is the power wall, which limits how much computation can occur in a given volume. Dynamic CMOS power follows equation 2, where \(\SwitchedCapacitance\) is capacitance, \(\SupplyVoltage\) is supply voltage, and \(\ClockFrequency\) is clock frequency. Under the illustrative assumption that voltage rises proportionally with frequency (\(\SupplyVoltage\propto \ClockFrequency\)), dynamic power rises cubically (\(\text{Power} \propto \ClockFrequency^3\)). The exact voltage-frequency relationship varies by device, but increasing both consumes thermal headroom rapidly. \[\text{Power} \propto \SwitchedCapacitance\times \SupplyVoltage^2 \times \ClockFrequency\quad \text{where } \SupplyVoltage\propto \ClockFrequency\implies \text{Power} \propto \ClockFrequency^3 \tag{2}\]

When broad voltage scaling broke down in the mid-2000s,3 that cubic penalty ended “free” frequency speedups and forced hardware designers toward parallelism (multi-core CPUs) and domain-specific specialization (GPUs and Tensor Processing Units (TPUs)4). Figure 2 records that turn across five decades of processors. From the mid-2000s to the early 2020s the largest chips gained about 190× more transistors, yet the fastest clock stayed near 4.7 GHz and single-thread performance rose only 5×, against 21× in the decade before; the added transistors went into more cores and specialized units rather than a faster single thread.

3 Dennard scaling: Named after Robert Dennard, whose IBM team described MOSFET scaling relationships under which shrinking devices could reduce voltage and current while keeping power density approximately controlled (Dennard et al. 1974). As voltage scaling slowed and energy became a first-order architectural constraint, performance growth shifted toward parallelism and specialization: multi-core processors, GPUs, and TPUs (Hennessy and Patterson 2019; Esmaeilzadeh et al. 2011).

Dennard, Robert H., Frank H. Gaensslen, Hwa-Nien Yu, Victor L. Rideout, Elias Bassous, and Antoine R. LeBlanc. 1974. “Design of Ion-Implanted MOSFET’s with Very Small Physical Dimensions.” IEEE J. Solid-State Circuits 9 (5): 256–68. https://doi.org/10.1109/jssc.1974.1050511.
Hennessy, John L., and David A. Patterson. 2019. “A New Golden Age for Computer Architecture.” Communications of the ACM 62 (2): 48–60. https://doi.org/10.1145/3282307.
Esmaeilzadeh, Hadi, Emily Blem, Renee St. Amant, Karthikeyan Sankaralingam, and Doug Burger. 2011. “Dark Silicon and the End of Multicore Scaling.” Proceedings of the 38th Annual International Symposium on Computer Architecture, 365–76. https://doi.org/10.1145/2000064.2000108.

4 Tensor processing unit (TPU): An application-specific integrated circuit (ASIC) designed for operations common in ML, especially matrix multiplication. PFLOP/s-to-EFLOP/s figures describe aggregated TPU systems rather than one chip. Specialization trades general-purpose flexibility for workload-dependent efficiency; its advantage over a GPU depends on the model, numerical format, and systems being compared (Jouppi et al. 2023).

Jouppi, Norm, George Kurian, Sheng Li, Peter Ma, Rahul Nagarajan, Lifeng Nai, Nishant Patil, et al. 2023. “TPU v4: An Optically Reconfigurable Supercomputer for Machine Learning with Hardware Support for Embeddings.” Proceedings of the 50th Annual International Symposium on Computer Architecture, 1–14. https://doi.org/10.1145/3579371.3589350.

The same limit is tightest on mobile devices, which hit a thermal ceiling at 3–5 W; exceeding it causes “throttling,” where the device reduces performance to prevent overheating, a trace worked through in notebook 2.9. This physical limit gives rise to mobile ML: battery-powered devices cannot simply run cloud-scale models locally.

The memory wall

An accelerator’s matrix units can finish a block of multiplications in nanoseconds, yet spend most of an inference step sitting idle while weights and activations trickle in from off-chip DRAM. The memory wall (Wulf and McKee 1995) names this widening gap between processor speed and memory delivery, which shows up in ML chiefly as a bandwidth5 shortfall. A rough sketch with representative annual growth factors shows why the gap compounds: \[\frac{\text{Compute Growth Rate}}{\text{Memory Bandwidth Growth Rate}} \approx \frac{1.6}{1.2} \approx 1.33 \tag{3}\]

5 Memory bandwidth (the memory wall): The term “memory wall” comes from Wulf and McKee (1995), who predicted that the processor-memory performance gap would eventually dominate system performance, a prediction borne out for ML workloads in which weight or activation movement can bind performance. Whether bandwidth binds a given workload depends on arithmetic intensity, batch size, data reuse, access pattern, and hardware balance rather than model size alone.

Wulf, Wm. A., and Sally A. McKee. 1995. “Hitting the Memory Wall: Implications of the Obvious.” ACM SIGARCH Computer Architecture News 23 (1): 20–24. https://doi.org/10.1145/216585.216588.

In equation 3, the numerator and denominator are dimensionless annual growth factors. A ratio above 1 means compute capability is pulling away from memory bandwidth, so each hardware generation makes data movement a larger share of the performance problem unless the workload increases locality or arithmetic intensity (operations performed per byte moved).
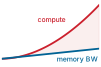
Two diverging trend strokes: a steep red compute-growth curve pulls away from a shallow blue memory-bandwidth curve, with the widening gap shaded red.

Compute capacity outruns memory bandwidth; the widening gap is the memory wall.

Horowitz, Mark. 2014. “1.1 Computing’s Energy Problem (and What We Can Do about It).” 2014 IEEE International Solid-State Circuits Conference Digest of Technical Papers (ISSCC), 10–14. https://doi.org/10.1109/isscc.2014.6757323.

This illustrative trend comparison assumes that compute capacity doubles every 18 months, about 1.6× per year (the numerator of equation 3), while memory bandwidth grows by ~20 percent annually (the denominator). These assumed rates illustrate the widening gap rather than a forecast for every hardware generation. Sustained for a decade, those rates leave compute about 16× further ahead of bandwidth than at the start. This widening gap makes data movement a frequent bottleneck, in both time and energy, for ML workloads. An on-chip arithmetic logic unit (ALU) operates over short local connections, whereas an off-chip DRAM access also drives memory interfaces and longer interconnects. In representative hardware, fetching operands from DRAM can cost orders of magnitude more energy than the arithmetic performed on them (Horowitz 2014). The ratio depends on the operation, numerical precision, memory technology, and amount of data transferred. The constraint affects all paradigms, and it takes a different form on TinyML devices, where capacity, not bandwidth, is usually exhausted first.

↪ The architectural responses to the memory wall, high-bandwidth memory (HBM) and on-chip SRAM hierarchies, are developed in Memory hierarchy.

Checkpoint 2.1: Physical constraints and deployment

Deployment choices are governed by physics, not just preference. Check your understanding:

These physical laws explain the trade-offs behind the four paradigms. Physical limits decide which designs can work at all; privacy regulation, economic incentives, and data sovereignty requirements further restrict the choices within those limits. No regulation can make the speed of light faster, and no economic model can repeal thermodynamics. Nor do those walls act in isolation: in practice, an ML system is limited by whichever physical boundary binds on its primary resource first. Evaluating these limits quantitatively requires analytical tools: the iron law to decompose execution time into its components, the bottleneck principle to identify the rate-limiting stage, and workload archetypes to classify the model’s resource demands.

Self-Check: Question
  1. A safety-critical autonomous braking system requires an end-to-end decision latency budget of 10 ms. A cloud data center is located 1,500 km away. Given that light travels through optical fiber at approximately \(200{,}000\text{ km/s}\), why is offloading inference to this cloud data center physically impossible?

    1. The cloud server queue latency always adds at least 25 ms regardless of server load.
    2. The speed of light in fiber allows a round trip in 5 ms, but serialization of model weights requires 15 ms.
    3. The minimum speed-of-light round-trip propagation time alone is 15 ms, consuming the entire 10 ms budget before compute begins.
    4. Wireless transmission protocols require a minimum 50 ms handshake before transmitting sensor packets.
  2. Under dynamic CMOS power scaling where supply voltage scales proportionally with clock frequency (\(V \propto f\)), doubling the processor clock frequency increases dynamic power dissipation by a factor of 8 (\(f^3\)).

  3. How does the memory wall manifest in modern computing hardware according to the historical growth rates of compute capacity versus memory bandwidth?

    1. Memory bandwidth doubles every 18 months while compute throughput increases by only 20% annually, causing compute starvation.
    2. Both compute throughput and memory bandwidth grow at identical 60% annual rates, but memory capacity limits model size.
    3. Processors have reached absolute thermal limits while memory signaling energy has dropped to near-zero levels.
    4. Compute capacity historically doubles roughly every 18 months (~60% annually), whereas memory bandwidth grows by only ~20% annually, causing the compute-to-bandwidth gap to widen compounding over time.
  4. What causes thermal throttling on passively cooled mobile devices running sustained ML inference, and how does it affect continuous model execution?

  5. The historical scaling relationship under which shrinking MOSFET transistor dimensions allowed reducing voltage and current while keeping power density constant is known as ____ scaling.

See Answers →

2.3 Analyzing Workloads

A vision model that saturates accelerator compute units during batched training can stall on memory bandwidth when serving one image at a time, and a model that runs effortlessly in a data center can overheat a phone in under a minute. Deciding which physical resource binds first on the target hardware—whether for a recommendation engine or a wake-word detector—requires the iron law of ML systems from Iron Law of ML Systems, restated here in the same notation because every tier in this chapter is analyzed through it. For a serialized execution path, equation 4 adds three costs: \[\Time= \frac{\DataVolume}{\Bandwidth} + \frac{\Operations}{\PeakRate \cdot \EfficiencyHw} + \Latency \tag{4}\]

Equation 4 decomposes total latency into three terms: data movement \((\DataVolume/\Bandwidth)\), compute \((\Operations/(\PeakRate \cdot \EfficiencyHw))\), and fixed overhead \((\Latency)\). For an inference path that executes these stages sequentially, their times add. A single request can also contain overlapping work, so its latency must follow the actual dependencies. In production systems, however, tasks are processed continuously as a stream, and the analysis shifts from single-task latency to identifying which term limits the system. The answer depends on the workload, its execution conditions, and the deployment hardware. A workload is compute bound when its compute term \(\Operations/(\PeakRate \cdot \EfficiencyHw)\) exceeds its data term \(\DataVolume/\Bandwidth\), and bandwidth-bound in the reverse case.

2.3.1 The bottleneck principle

Adding a twice-as-fast accelerator to a serving pipeline does nothing for steady-state throughput if the processor spends half of every step waiting for the memory bus to deliver the next batch of weights. Where the iron law quantifies the cost of each stage, the bottleneck principle identifies which stage governs continuous throughput. Iron Law of ML Systems gave the overlapped form of the iron law for pipelined execution, in which the memory system prefetches batch \(\BatchIndex+1\) while the accelerator computes on batch \(\BatchIndex\). The slowest stage then hides the others and sets the interval between completions, so speeding a nonlimiting stage does not raise ideal steady-state throughput while the system bottleneck remains unchanged. Deployment adds one more overlapped stage, \(\IoTransferTime\), the time to transfer data over a storage or network link, including offloading a request to a remote server. Equation 5 extends the pipelined form with that stage. Here the left-hand side is the steady-state time per completed task, with fixed overhead treated as nonoverlapped; equality requires ideal overlap of the other stages: \[ \PipelinedExecutionTime\ge \max\left(\frac{\DataVolume}{\Bandwidth}, \frac{\Operations}{\PeakRate \cdot \EfficiencyHw}, \IoTransferTime\right) + \Latency \tag{5}\]

When a system is bandwidth-bound \((\DataVolume/\Bandwidth > \Operations/(\PeakRate \cdot \EfficiencyHw))\), faster processors \((\PeakRate)\) do not raise ideal pipeline throughput while memory remains the slowest stage, just as widening a highway cannot help traffic constrained by a narrow bridge. Shortening a sequential compute stage can still reduce an individual request’s latency. Engineers must identify the dominant term before optimizing. The additive form in equation 4 describes a single task’s serialized path and the max form in equation 5 an ideally overlapped continuous stream; the actual dependencies determine which stages can overlap.

2.3.2 Workload archetypes

The bottleneck principle reduces optimization to identifying the dominant constraint for a given workload. The answer depends on all three D·A·M axes at once: the data a request carries, the algorithm’s arithmetic and memory demands, and the machine that executes it. Different deployment environments create different bottlenecks along these axes, so the same model family can require different engineering when it moves from a cloud server with terabytes of memory to a microcontroller with kilobytes. Classifying workloads by what binds them first yields four workload archetypes.6 Each archetype is a recurring physical bottleneck that determines which engineering moves can help. Two of them correspond to terms of the iron law. The other two are bound by preconditions the time equation assumes are already met, namely that the working set fits in memory and that the energy budget can pay for the run. A capacity or energy limit can therefore decide feasibility before any term of equation 4 is evaluated.

6 Workload archetype: A classification of ML workloads by their dominant bottleneck rather than by their model family. Misidentifying the archetype wastes optimization effort on the wrong term of the iron law, as when teams add accelerator FLOP/s to a bandwidth-bound inference pipeline and obtain little improvement while memory transfer remains dominant.

The first split, between the two iron-law terms, separates arithmetic-bound systems from data-movement-bound systems. A compute-bound workload performs many calculations per byte loaded, so progress comes from higher arithmetic throughput, better utilization, and more parallel execution; large neural-network training is the canonical case. A bandwidth-bound workload, by contrast, waits on dense weight or activation movement, so wider memory buses and better data reuse matter more than additional peak FLOP/s; autoregressive text generation illustrates this regime. The roofline literature calls this regime memory-bound; this book says bandwidth-bound to keep it distinct from running out of memory capacity, which is the next archetype.

The second split covers workloads where the binding constraint is not a term of the time equation at all. Capacity-bound workloads are dominated by irregular table lookups and poor cache locality, so memory capacity, access latency, and communication shape performance in recommendation systems with massive embedding tables. Power-bound workloads face the opposite envelope: energy per inference and memory footprint, not raw speed, determine whether always-on sensing can run at all.

Lighthouse 2.1: Five reference workloads

The introduction (Lighthouse models put the iron law into practice) introduced five lighthouse models by the system bottleneck each isolates (Lighthouse Models as Reference Workloads); table 2 pairs each with a representative workload archetype and deployment paradigm. The classifications describe operating regimes: batched image processing can emphasize arithmetic, single-request text generation can emphasize weight transfers, and a large recommendation table can exceed local memory capacity. Changing batch size, model size, or hardware can change the binding constraint. MobileNetV2 shows why. In table 2, it sits with the compute-oriented vision workloads because its pointwise convolutions carry most of its arithmetic, sized down to fit mobile thermal and energy envelopes. Its depthwise layers, however, perform few operations per byte and are often bandwidth-bound on mobile accelerators. Whether arithmetic throughput or memory bandwidth ultimately binds MobileNetV2 on a specific device depends on target hardware balance, precision, and batching, as the roofline analyses in section 2.4 demonstrate. Network Architectures opens up the architecture behind each lighthouse.

Table 2: Five Lighthouse Models: Five recurring workloads ground the iron law in concrete practice throughout the book. Each lighthouse pairs a home regime (compute-bound, bandwidth-bound, capacity-bound, power-bound) with the deployment paradigm where it predominantly runs, illustrating a distinct resource constraint under representative execution conditions.
Lighthouse Archetype Deployment Paradigm
ResNet-50 Compute-bound Cloud training, edge inference
GPT-2/Llama Bandwidth-bound (decode) Cloud inference
DLRM Capacity-bound Cloud for large tables
MobileNetV2 Compute-bound (efficient regime) Mobile, edge
Keyword Spotting (KWS) Power-bound TinyML, always-on

Large-scale compute-bound training and capacity-bound workloads gravitate to cloud data centers; compact vision workloads operating in efficient compute-bound regimes such as MobileNetV2 can fit mobile and edge devices; bandwidth-bound decoding runs in the cloud unless a smaller model fits locally; and power-bound workloads belong on microcontrollers. Those placements become concrete once each lighthouse is given its cost. The image classifier ResNet-50 spends approximately 8.2 GFLOP per image on 25.6 million parameters, which occupy 102.4 MB at FP32 (He et al. 2016). That regular, compute-dense structure makes it the canonical benchmark for hardware accelerator performance.

He, Kaiming, Xiangyu Zhang, Shaoqing Ren, and Jian Sun. 2016. “Deep Residual Learning for Image Recognition.” 2016 IEEE Conference on Computer Vision and Pattern Recognition (CVPR), 770–78. https://doi.org/10.1109/cvpr.2016.90.
Radford, Alec, Jeffrey Wu, Rewon Child, David Luan, Dario Amodei, and Ilya Sutskever. 2019. Language Models Are Unsupervised Multitask Learners. OpenAI.
Touvron, Hugo, Thibaut Lavril, Gautier Izacard, Xavier Martinet, Marie-Anne Lachaux, Timothée Lacroix, Baptiste Rozière, et al. 2023. “LLaMA: Open and Efficient Foundation Language Models.” arXiv Preprint arXiv:2302.13971.
Touvron, Hugo, Louis Martin, Kevin Stone, Peter Albert, Amjad Almahairi, Yasmine Babaei, Nikolay Bashlykov, et al. 2023. “Llama 2: Open Foundation and Fine-Tuned Chat Models.” arXiv Preprint arXiv:2307.09288.
Pope, Reiner, Sholto Douglas, Aakanksha Chowdhery, Jacob Devlin, James Bradbury, Jonathan Heek, Kefan Xiao, Shivani Agrawal, and Jeff Dean. 2023. “Efficiently Scaling Transformer Inference.” Proceedings of Machine Learning and Systems (MLSys) 5: 606–24.

The language models GPT-2/Llama exemplify autoregressive text generation (Radford et al. 2019; Touvron, Lavril, et al. 2023; Touvron, Martin, et al. 2023). These models generate text one token at a time. Because multi-billion parameter models exceed on-chip cache, weights reside in external memory; generating text token-by-token for one request at a time forces the processor to stream the weights across the memory bus for each token with little reuse across inputs (1.5 billion parameters for GPT-2, 7 billion–70 billion parameters for Llama). This sequential access pattern creates an autoregressive bottleneck that shapes serving cost (Pope et al. 2023).

↪ Continuous batching and KV-cache paging, the runtime mechanisms that serve token-by-token generation, are developed in Continuous batching.

7 Deep learning recommendation model (DLRM): Meta’s 2019 architecture that exemplifies the capacity-bound archetype. At that scale, memory capacity and communication \(\Bandwidth\) can constrain execution more than raw \(\PeakRate\). These demands motivate specialized cluster designs where memory, not arithmetic, is the scarce resource.

Naumov, Maxim, Dheevatsa Mudigere, Hao-Jun Michael Shi, Jianyu Huang, Narayanan Sundaraman, Jongsoo Park, Xiaodong Wang, et al. 2019. “Deep Learning Recommendation Model for Personalization and Recommendation Systems.” arXiv Preprint arXiv:1906.00091.

The recommendation lighthouse, DLRM7, represents the embedding-heavy recommendation workload behind large-scale “You might also like” systems (Naumov et al. 2019). It maps users and items to embedding vectors stored in tables that can exceed 100 GB of embeddings, making memory capacity rather than computation the binding constraint.

The mobile lighthouse, MobileNetV2, performs the same image classification task as ResNet-50 while cutting its computation by 13.7× (Sandler et al. 2018). It gets there by restructuring the image-filtering layers, splitting each expensive filtering step into two much cheaper ones (depthwise separable convolutions). That reduction makes it a candidate for real-time inference within a smartphone’s 3–5 W envelope; the implementation and workload determine whether it meets the deadline.

Sandler, Mark, Andrew Howard, Menglong Zhu, Andrey Zhmoginov, and Liang-Chieh Chen. 2018. “MobileNetV2: Inverted Residuals and Linear Bottlenecks.” 2018 IEEE/CVF Conference on Computer Vision and Pattern Recognition, 4510–20. https://doi.org/10.1109/cvpr.2018.00474.

↪ How depthwise separable convolutions factor one filtering step into two cheaper ones is developed in Depthwise separable convolutions.

Zhang, Yundong, Naveen Suda, Liangzhen Lai, and Vikas Chandra. 2017. Hello Edge: Keyword Spotting on Microcontrollers.

The TinyML lighthouse, keyword spotting (KWS), represents the always-on sensing archetype. KWS systems detect short trigger phrases with compact models built for resource-constrained microcontrollers (Zhang et al. 2017). The lighthouse workload has approximately 200K parameters, about 200 KB at INT8 (stored in flash), placing it in the kilobyte-memory, milliwatt-budget TinyML regime.

A smart doorbell, a TinyML scenario that recurs through later chapters alongside the five lighthouses, applies the same always-on pattern to vision. A visual wake-word model (Chowdhery et al. 2019), a small classifier that answers only whether a person is in view, runs on an ESP32-S3 microcontroller, the TinyML platform of table 4. Its feasibility is screened in two levels, storage first and latency second. At level 1, the 0.5 MB of 16-bit weights occupy 11.9 percent of the 4.2 MB flash. Passing this storage check does not establish complete memory fit, because intermediate results and runtime state must also fit in SRAM, the two-tier split that section 2.8.1 develops. Level 2 applies the iron law. The model needs 25 MFLOP per frame, and the microcontroller sustains about 0.25 GFLOP/s at this precision, so compute takes 100 ms; about 1 ms of fixed overhead brings the total to 101 ms. That estimate clears the scenario’s canonical 200 ms budget; sensor acquisition and any data movement omitted by the estimate must still be checked. A more responsive chime with a 50 ms budget changes the verdict without changing the model, and figure 3 plots that tightened case. In the plot, flash stays far below the saturation line while latency reaches 202 percent of its budget. Flash storage was not the binding constraint; latency is, and on-chip SRAM still has to be checked separately.

Chowdhery, Aakanksha et al. 2019. “Visual Wake Words Dataset.” arXiv Preprint arXiv:1906.05721.
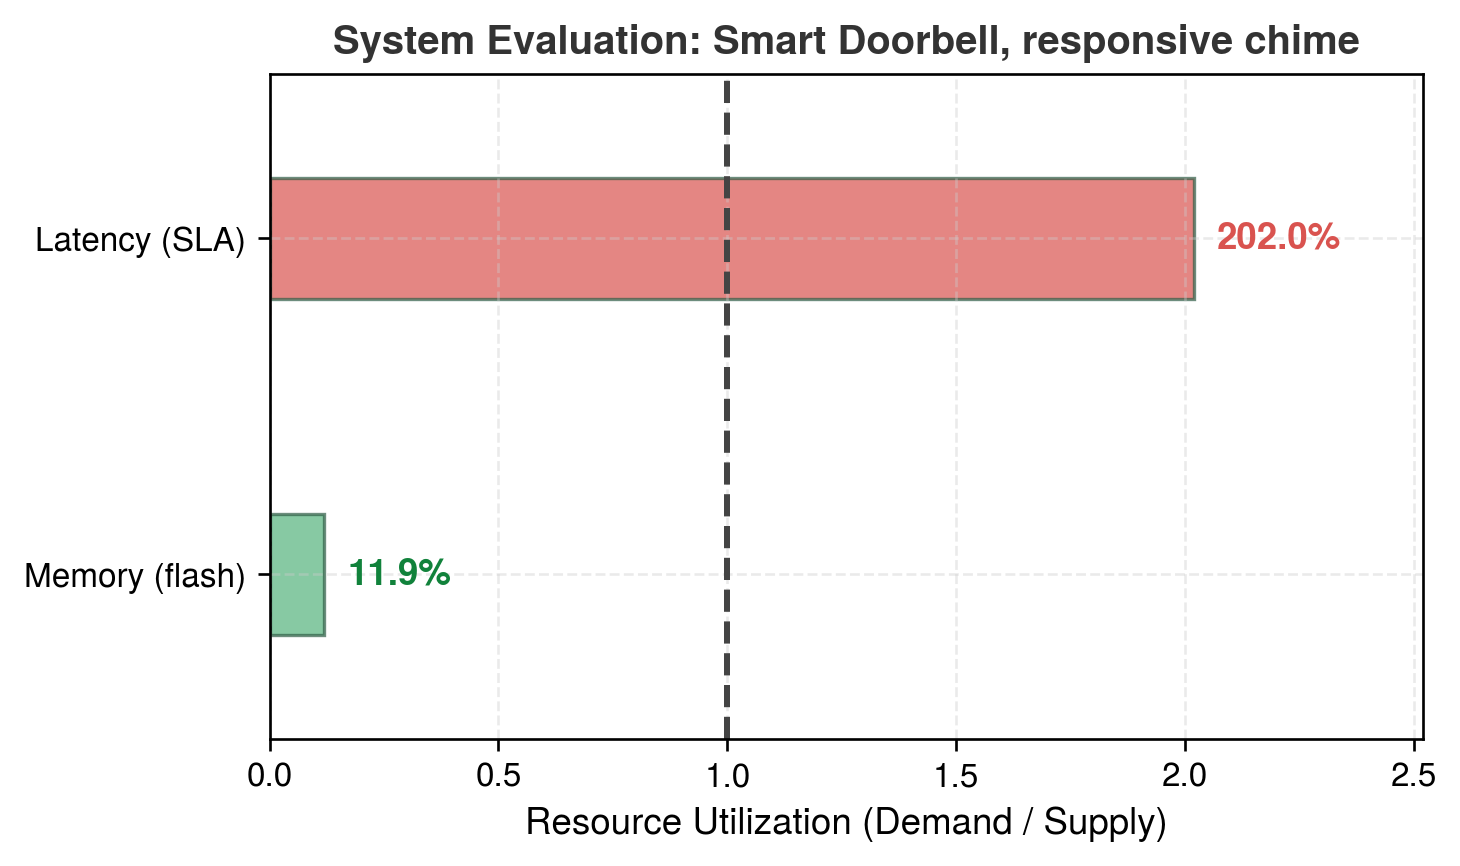
Figure 3: Smart Doorbell Constraint Scorecard: Each bar is demand over supply, so the dashed line marks the point where a level is exactly saturated. The model occupies a small fraction of the ESP32-S3’s 4 MB flash budget (Level 1: PASS), but its 101 ms latency (25 MFLOP of compute plus fixed overhead) is twice a tightened 50 ms budget for a responsive chime (Level 2: FAIL), even though it clears the scenario’s canonical 200 ms budget.

The range in compute requirements and memory footprints explains why no single deployment paradigm fits all workloads. A keyword spotter can operate with roughly 20 MFLOP per inference and about 200 KB of INT8 weights, while ResNet-50 requires about 8.2 GFLOP per image and roughly 102.4 MB of FP32 weights. The reference DLRM example already reaches 100 GB, and Meta has demonstrated scaling recommendation models to 100 TB using embedding offloading (Park et al. 2024). Language models add a bandwidth-dominated regime, with billions of parameters streamed repeatedly from memory during autoregressive inference. Whether each of these demands is affordable depends on the compute, bandwidth, and memory a given platform supplies.

Park, Intaik, Ehsan Ardestani, Damian Reeves, Sarunya Pumma, Henry Tsang, Levy Zhao, Jian He, et al. 2024. “Toward 100TB Recommendation Models with Embedding Offloading.” 18th ACM Conference on Recommender Systems, 841–43. https://doi.org/10.1145/3640457.3688037.
Self-Check: Question
  1. When analyzing ML system performance, when should an engineer apply the additive form of the iron law (\(T = \frac{D_{\text{vol}}}{\text{BW}} + \frac{O}{R_{\text{peak}} \cdot \eta_{\text{hw}}} + L_{\text{lat}}\)) versus the bottleneck principle’s max form (\(T_{\text{pipelined}} \ge \max\left(\frac{D_{\text{vol}}}{\text{BW}}, \frac{O}{R_{\text{peak}} \cdot \eta_{\text{hw}}}, T_{\text{IO}}\right) + L_{\text{lat}}\))?

    1. Use the additive form for single-request serialized latency, and the max form for steady-state pipelined completion interval after the pipeline fills, where overlapped stages are bounded by the slowest one.
    2. Use the additive form exclusively for cloud workloads, and the max form exclusively for microcontroller TinyML workloads.
    3. Use the additive form when batch size is greater than 128, and the max form when batch size equals 1.
    4. Use the additive form during model training only, and the max form during on-device model quantization.
  2. Which pairing correctly matches a workload archetype to its dominant physical bottleneck and canonical lighthouse model?

    1. Compute-bound \(\rightarrow\) dominated by irregular table lookups and cache misses \(\rightarrow\) DLRM
    2. Bandwidth-bound \(\rightarrow\) dominated by dense parameter streaming during autoregressive token decode \(\rightarrow\) GPT-2/Llama
    3. Capacity-bound \(\rightarrow\) dominated by dense FLOP throughput at high arithmetic intensity \(\rightarrow\) ResNet-50
    4. Power-bound \(\rightarrow\) dominated by petabyte-scale distributed training \(\rightarrow\) Keyword Spotting (KWS)
  3. Explain why shortening a stage that is not the bottleneck can still reduce the latency of one sequential request, even though it does not improve ideal pipelined throughput once the pipeline is full.

  4. Order the steps of the hierarchical deployment feasibility evaluation for the Smart Doorbell scenario from initial problem framing to latency verification:

  1. Check Level 1 storage fit by screening whether the visual wake-word model’s weights fit in flash
  2. Define the application mission targets (person at the door, required quality, and responsiveness budget)
  3. Check Level 2 timing constraints by evaluating per-inference latency against the interaction budget
  4. Select a candidate platform and model for the task (for example, a visual wake-word model on an ESP32-S3)
  1. An ML workload characterized by high arithmetic intensity where throughput is bounded by peak FLOP/s (\(R_{\text{peak}}\)) rather than memory bandwidth, such as dense convolutional neural network training, belongs to the ____ archetype.

See Answers →

2.4 System Balance and Hardware

A model that clears its latency budget on paper can still stall on a real host if PCIe transfers between CPU and GPU memory choke the pipeline or if single-sample inference leaves the accelerator’s matrix units starved for bytes. Checking the iron law and workload archetypes against real hardware means tracing a request through every layer of one host, from the application’s latency or throughput target down to the silicon that must meet it.

2.4.1 Inside one machine: The single-node stack

When an application issues an inference request or a training step on a single machine, that work travels down a four-layer single-node stack, which refines the machine side of the D·A·M taxonomy for one host while data and algorithm enter through workload requirements. At the top of the stack, the application defines the mission through a training-throughput or inference-latency target, and the ML framework below it translates model code into executable operations that aim to meet that target. Those operations then pass through the operating system, drivers, and runtime, which coordinate resources and move tensors between host memory and accelerator memory, down to the hardware itself—where HBM capacity, memory bandwidth, intra-node interconnects such as NVLink, and compute throughput set the physical limits, with the memory wall as a recurring constraint.

↪ How an ML framework turns model code into executed operations, eagerly or through a captured graph, is developed in Execution: From Graphs to Kernels.

The hardware layer fixes the terms on offer to any model: a memory bandwidth \((\Bandwidth)\), a peak compute rate \((\PeakRate)\), and a fixed overhead \((\Latency)\). These are the terms of the silicon contract. The hardware offers them, and the workload and its execution conditions determine which resource limits progress first. Deployment analysis works with the hardware’s half, asking which term a given platform makes scarce; the model architecture’s half, the choice of which resource to saturate, belongs to Network Architectures.

↩︎ The iron law of ML systems and its decomposition of end-to-end latency are established in Iron Law of ML Systems.

2.4.2 Matching workloads to hardware

Before profiling cache reuse or arithmetic intensity, an engineer can rule out impossible hardware placements with a two-step test that proceeds from coarse to fine. The coarse test asks whether an operation can fit inside the latency budget at all. The fine test asks which hardware resource limits the operations that do fit, and its answer depends on system balance, the ratio of peak compute throughput to memory bandwidth and I/O capacity on a given platform.

Operation latencies supply the coarse test, and they turn latency-vs-throughput trade-offs into decisions through concrete numbers. They span roughly eight orders of magnitude, from about a nanosecond for an on-chip cache hit or a single accelerator multiply, through milliseconds for one mobile vision inference, to tens or hundreds of milliseconds for a cross-region network call. Numbers to Know collects the memory-hierarchy and network round-trip anchors along with illustrative application latency budgets. The span matters because of one strict rule: an operation with latency \(> \CompletionDeadline\) cannot appear on the critical path of a system whose latency budget is \(\CompletionDeadline\) ms.8

8 Critical path: The longest sequential chain of dependent operations in a pipeline. The decision rule in the triggering sentence is strict: if a 200 ms cross-region network call appears anywhere on the critical path, a system with a 100 ms total budget is guaranteed to fail regardless of how fast every other stage runs. Model inference need not be the longest stage; preprocessing and postprocessing can dominate, making the critical path longer than model execution alone suggests.
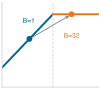
A roofline silhouette: a blue memory-bound slope rising to a dashed ridge line, then a flat orange compute-bound ceiling, with a batch-1 workload dot on the memory-bound slope, left of the ridge, and a gray arrow to a B=32 dot on the compute-bound ceiling, right of the ridge.

In this example, batching moves the workload from the memory-bound side toward the compute ceiling.

Williams, Samuel, Andrew Waterman, and David Patterson. 2009. “Roofline: An Insightful Visual Performance Model for Multicore Architectures.” Communications of the ACM 52 (4): 65–76. https://doi.org/10.1145/1498765.1498785.

For the operations that pass the latency test, system balance decides which resource limits them. Roofline analysis classifies bottlenecks by comparing a workload’s arithmetic intensity, the operations it performs per byte moved (FLOP/byte), against the hardware machine balance point \((\PeakRate / \Bandwidth)\), the ridge point (Williams et al. 2009) introduced with the iron law in Iron Law of ML Systems. The framing is informal here; Performance Bounds develops the model and the ridge point that separates the memory-bound and compute-bound regimes, with a worked derivation collected for reference in The Roofline model. In that framing, the same ResNet-50 model can shift from compute-bound training behavior at high batch sizes to more memory-sensitive single-image inference at batch=1. Deployment paradigm selection must account for this shift.

The batch-size shift is one instance of a broader change between execution phases, in which physical constraints reconfigure all three D·A·M axes at once. Training updates model weights from batches of examples; serving applies fixed weights to new inputs. Table 3 contrasts typical training and latency-sensitive serving demands; cloud serving can also batch requests for throughput.

Table 3: D·A·M \(\times\) Phase: The same model imposes starkly different demands on Data, Algorithm, and Machine depending on whether the system is training or serving. When bottlenecks shift unexpectedly, check which phase is currently being optimized.
Component Training (Mutable) Inference (Immutable)
Data Massive throughput: large batches, shuffling, augmentation Low latency: single samples, freshness, speed
Algorithm Learning phase: update model parameters from examples Prediction phase: apply fixed weights to new inputs
Machine Throughput-optimized: high-bandwidth clusters, large memory Latency-optimized: edge devices, inference accelerators

ResNet-50 inference on a high-end data center accelerator and on a mobile neural processing unit (NPU)9 puts numbers on this analysis. The hardware figures are point-in-time anchors; the reasoning rests on compute rate, memory bandwidth, and batch size, which outlast any one product.

9 Neural processing unit (NPU): A dedicated hardware block on a mobile system-on-chip whose circuits are designed for low-precision tensor operations. This specialization can improve energy efficiency relative to CPU execution, helping AI workloads fit within mobile power budgets.

Napkin Math 2.1: ResNet-50 on cloud vs. mobile

Problem: Is ResNet-50 inference compute-bound or bandwidth-bound on (a) a high-end data center accelerator (an NVIDIA A100) and (b) a flagship mobile NPU?

Given (from lighthouse models):

  • ResNet-50: 8.2 GFLOP per inference, 25.6 million parameters (102.4 MB FP32, 51.2 MB FP16)

Analysis:

(a) Cloud data-center accelerator (batch=1, FP16)

The analytical model assumes 56.3 MB moved per inference, including weights and activation traffic. This is a modeled transfer volume, not the stored parameter footprint; reuse and runtime choices can change it.

  • Peak compute: 312 TFLOP/s (FP16)
  • Memory bandwidth: 2.04 TB/s
  • Compute time: \(\IronLawComputeTime\) = \(\frac{8.20 \times 10^{9}}{3.12 \times 10^{14}}\) = 0.026 ms
  • Memory time (weights plus activations): \(\IronLawMemoryTime\) = \(\frac{5.63 \times 10^{7}}{2.04 \times 10^{12}}\) = 0.028 ms
  • Result: Bottleneck = Memory (1.1× slower than compute)
  • Ridge point: \(\PeakRate/\Bandwidth\) = 312 TFLOP/s ÷ 2.04 TB/s ≈ 153 FLOP/byte.
  • Analysis: Arithmetic intensity = \(\frac{8.20 \times 10^{9}}{5.63 \times 10^{7}}\) = 146 FLOP/byte, just below the ridge point, so the workload is bandwidth-bound; above the ridge it would be compute bound. For single-image inference, the low batch size yields limited reuse, explaining why even high-throughput accelerators can be bandwidth-bound at batch = 1. Both times use peak rates (efficiency \(\EfficiencyHw = 1\) and full bandwidth), so they are lower bounds; because this workload sits close to the ridge, the efficiencies a real kernel achieves decide which term dominates in practice.

(b) Mobile: Flagship NPU (batch=1, INT8)

At INT8, the analytical model assumes 28.2 MB moved per inference, including weights and activation traffic. The INT8 weight footprint below is only one component of that transfer volume.

  • Peak compute: ~35 TOPS (INT8), representative of modern mobile NPUs
  • Memory bandwidth: ~51.2 GB/s (LPDDR5)
  • Model size: 25.6 MB (INT8 quantized)
  • Compute time: \(\IronLawComputeTime\) = \(\frac{8.20 \times 10^{9} \text{ INT8 ops}}{3.50 \times 10^{13} \text{ INT8 ops/s}}\) = 0.23 ms
  • Memory time (weights plus activations): \(\IronLawMemoryTime\) = \(\frac{2.82 \times 10^{7}}{5.12 \times 10^{10}}\) = 0.55 ms
  • Result: Bottleneck = Memory (2.3× slower than compute)

Systems insight: Under these peak-rate assumptions, both platforms are bandwidth-bound for single-image inference. The A100’s faster memory bandwidth (2.04 TB/s vs. 51.2 GB/s = 39.8×) gives roughly 19.9× lower modeled memory-transfer time under the stated FP16 and INT8 traffic assumptions; this ratio is not a measured end-to-end inference speedup. Byte-reduction and lower-precision techniques can therefore beat simply buying more peak FLOP/s for deployment.

ResNet-50 becomes compute bound when batching and data reuse raise computation per byte moved above the hardware balance point, \(\ArithmeticIntensity > \PeakRate/\Bandwidth\), where \(\ArithmeticIntensity = \Operations/\DataVolume\). With ideal reuse during batched inference, each weight is transferred across the memory bus once and used across all \(\BatchSize\) samples in the batch. This amortizes the weight transfer over \(\BatchSize\) inputs, increasing the arithmetic intensity until computation time overtakes memory-transfer time. The crossover is architecture- and implementation-dependent because activation traffic, input/output movement, cache reuse, and runtime execution details all change the effective bytes moved per inference.

The four deployment paradigms gain precision when grounded in concrete hardware. Where table 1 defined the paradigms by operating regime, table 4 places one real platform in each and pairs it with the per-device envelope that marks the tier.10 The example-platform and power columns describe complete systems, including a cloud pod, while the tier compute and bandwidth columns describe per-device envelopes. The following spans compare those complete examples, not equivalent individual chips. Memory drops from 128 TB (cloud) to 512 KB (TinyML), a 250 million-fold reduction. Power runs from about 3 MW for the cloud pod to the TinyML tier’s average-power target of < 1 mW, and hardware cost spans six orders of magnitude, from multimillion-dollar clusters to $10 microcontrollers. Together with facility overheads such as power usage effectiveness (PUE),11 these spreads decide which paradigm can serve a workload economically, and they explain why model compression becomes essential as the budget tightens.

10 ML hardware cost spectrum: The million-fold cost range makes deployment paradigm selection an economics decision as well as a physics decision. The same accuracy target may be achievable on a low-cost microcontroller only after substantial model reduction, or on an expensive data-center accelerator with a much larger resource budget, and the two designs carry fundamentally different latency, power, and operational cost profiles.

11 Power usage effectiveness (PUE): Total facility energy divided by IT equipment energy over the same period (The Green Grid 2007), developed in Power and Energy Measurement. It captures facility overhead, including cooling and power distribution. Even a PUE of 1.06 leaves substantial noncompute power at data-center scale. TinyML does not require dedicated facility cooling, although sensing, communication, conversion losses, and sleep power still contribute to its complete system-energy budget. These device-level costs sit outside PUE.

The Green Grid. 2007. Green Grid Data Center Power Efficiency Metrics: PUE and DCIE. The Green Grid.

The hardware spectrum turns the bottleneck diagnosis into a fit test, in which each workload must be matched to the tier whose compute, bandwidth, power, and cost envelope it can satisfy. These platforms are products of decades of hardware evolution, from floating-point coprocessors in the 1980s through graphics processors in the 2000s to today’s domain-specific AI accelerators.

↪ The progression from floating-point coprocessors to domain-specific AI accelerators is developed in Specialized computing.

Table 4: Hardware Spectrum (Concrete Platforms): Each paradigm in table 1 is represented by one platform, paired with the per-device compute and memory-bandwidth envelope that marks the tier and the constraint that usually binds first there: an iron-law term for cloud and edge, a precondition outside the time equation for mobile (energy) and TinyML (memory capacity). Envelope figures mark a paradigm’s typical class rather than a hard ceiling. The DGX Spark sits at the high end of the edge spectrum as a compact workstation example; most edge deployments use far smaller devices. BF16 and FP4 are reduced-precision number formats (16 and 4 bits per value; “sparse” rates count skipped zero-valued operations); HBM2 and LPDDR5x are high-bandwidth and low-power memory types; NVMe is solid-state storage.
Paradigm Example Platform Tier Compute Tier Memory BW Power Price Binding Constraint
Cloud ML Google TPU v4 Pod: 4,096 TPU v4 chips, 1.1 EFLOP/s BF16, 128 TB HBM2 > 1000 TFLOP/s > 1000 GB/s ~3 MW per pod; PUE 1.1–1.3 Rental Compute (training); memory bandwidth (LLM decode)
Edge ML NVIDIA DGX Spark: GB10 Grace Blackwell (1 PFLOP/s sparse FP4), 128 GB LPDDR5x, 4 TB NVMe ~1 PFLOP/s > 270 GB/s ~200 W; 100 W class typical ~$3,000–$5,000 Memory bandwidth
Mobile ML Flagship smartphone: mobile SoC (CPU + GPU + NPU), 8–16 GB RAM, 128 GB-1 TB storage 15–45 TOPS 51.2–77 GB/s 3–5 W $999+ Energy (battery and heat)
TinyML ESP32-S3: dual-core @ 240 MHz, 512 KB SRAM, 4.2 MB flash < 1 TOPS — 0.05 W–1.2 W active; < 1 mW average target $10 Memory capacity (working state must fit in SRAM)

Systems Perspective 2.1: System balance across paradigms
The last column of table 4 reads each tier through the pipelined bound in equation 5. For cloud and edge the binding constraint is a term of that bound, whereas for mobile and TinyML it is a limit the time equation leaves out, and in every tier the dominant constraint sets the optimization strategy. Compute-bound cloud training rewards higher accelerator utilization and larger batches, while bandwidth-bound large language model (LLM) decode (token-by-token generation) and bandwidth-bound edge inference reward moving fewer bytes—through smaller models, lower precision, and more reuse per loaded weight—so a faster accelerator helps them little. Moving to battery-powered devices adds an implicit energy term: mobile systems integrate power over time under a tight thermal cap, which makes lower precision and duty cycling pay off in both battery life and sustained speed, while TinyML faces a strict memory precondition before any time or energy term applies, because weights and code must fit in flash and activations and runtime state must fit in SRAM through compact models and low-precision arithmetic. Acting on the binding term maps each dominant term to the optimizations that work and the ones that are wasted, turning this diagnosis into an action plan.

Each paradigm is therefore an operating envelope with different resource budgets, and moving from warehouse data centers down to microcontrollers traces a physical gradient that trades raw compute throughput for energy and memory efficiency. The four sections that follow walk that gradient one tier at a time, and each asks the same four questions, which the constraint map in each section draws as four branches: which constraint binds, how the system responds, where the paradigm fails, and which workloads fit. Because that structure is shared, each section concentrates on what is distinctive about its tier and on the one or two calculations that decide whether a workload belongs there.

Self-Check: Question
  1. Why is single-image (batch=1) ResNet-50 inference memory-bound on both a high-end cloud accelerator (NVIDIA A100) and a mobile NPU (iPhone 15 Pro)?

    1. ResNet-50 contains dynamic control flow that causes branching stalls on SIMD execution units.
    2. Both platforms lack matrix multiplication coprocessors, forcing scalar CPU execution.
    3. At batch=1, model weights must be loaded from memory once per single image without weight reuse across batch items, keeping arithmetic intensity below each platform’s hardware balance point (\(R_{\text{peak}}/\text{BW}\)).
    4. The activations at batch=1 exceed the total high-bandwidth memory (HBM) and SRAM capacities of both devices.
  2. Why does a convolutional neural network (e.g., ResNet-50) shift from a compute-bound regime during cloud training to a memory-bound regime during single-sample (\(\text{batch}=1\)) edge inference?

  3. An ML service SLA guarantees a total end-to-end response time of 100 ms. The pipeline involves client preprocessing, a cross-region network RPC, model inference, and postprocessing. According to critical path latency principles, why will this system fail if a cross-region network call taking 120 ms is placed on the synchronous critical path?

    1. The ML framework compiler will refuse to lower the graph if network RPC operations are detected.
    2. Cross-region RPCs corrupt the numerical precision of FP16 tensors during serialization.
    3. A cross-region network call reduces the accelerator compute throughput (\(R_{\text{peak}}\)) by half.
    4. The critical path is the longest sequential chain of dependent operations; any single stage exceeding 100 ms guarantees the end-to-end SLA will be breached regardless of how fast all other stages execute.
  4. What is the hardware balance point (or roofline ridge point) of an accelerator, and what does it tell an ML systems engineer about whether a workload will be compute-bound or memory-bound?

  5. For batch-1 LLM decode in the cloud and for most edge inference, the iron-law term that binds first is memory ____ rather than peak compute, so a faster accelerator alone yields little speedup.

  6. Order the four architectural layers of the single-node stack from the top-level mission goal down to the physical execution engine:

  1. Operating system (resource orchestration and host-accelerator memory transfers)
  2. ML framework (operator graph lowering and execution planning)
  3. Hardware and silicon contract (peak compute throughput, memory bandwidth, HBM/SRAM)
  4. Application layer (training throughput target or inference latency SLA)

See Answers →

2.5 Cloud ML: Computational Power

Consider the estimated resources needed to train GPT-3 (Brown et al. 2020): 3,634 PFLOP-days of computation, equivalent to 10,000 V100 GPUs running for approximately 15 days at the reported sustained rate, and about 1.3 GWh of electricity (Patterson et al. 2021). A PFLOP-day is \(10^{15}\) FLOP/s sustained for one day, about \(8.6 \times 10^{19}\) FLOPs, so this total is the same few hundred zettaFLOPs estimated from the model’s parameter and token counts in The deep learning era and the infrastructure bottleneck. At the hardware rates used in that estimate, a smartphone or edge server could not have completed this training run on a practical schedule. It required a data-center-scale cluster with enough aggregate compute, memory, and storage. The bitter lesson shows up here as hardware. General methods that improve with computation keep winning, and the computation they consume concentrates wherever power, cooling, and accelerators can be pooled. Cloud ML follows from this proposition. When latency can be tolerated, it offers computational scale that no other paradigm can match. Training location does not fix serving location, however, because a trained model or a smaller derived version can later run near users and sensors.

Brown, Tom B., Benjamin Mann, Nick Ryder, Melanie Subbiah, Jared Kaplan, Prafulla Dhariwal, Arvind Neelakantan, et al. 2020. “Language Models Are Few-Shot Learners.” Advances in Neural Information Processing Systems 33: 1877–901. https://doi.org/10.48550/arxiv.2005.14165.
Patterson, David, Joseph Gonzalez, Quoc Le, Chen Liang, Lluis-Miquel Munguia, Daniel Rothchild, David So, Maud Texier, and Jeff Dean. 2021. “Carbon Emissions and Large Neural Network Training.” arXiv Preprint arXiv:2104.10350.

↩︎ The bitter lesson, the book’s account of why compute-scaled general methods keep winning, is established in The Bitter Lesson.

12 Cloud as utility computing: A provisioning model in which a provider owns and operates a specialized hardware portfolio that few organizations could economically maintain themselves and rents it on demand. Renting gives direct access to the architecture each workload archetype requires, such as dense accelerator pods for compute-bound workloads, HBM-equipped nodes for bandwidth-bound workloads, and high-memory systems with fast interconnects for capacity-bound workloads, without purchasing and maintaining the entire installation.

Centralizing these resources under a utility model12 allows providers to assemble specialized accelerator topologies tailored to distinct hardware demands. This infrastructure serves as the natural home for three of the four workload archetypes: compute-bound workloads like ResNet training that demand sustained TFLOP/s across thousands of accelerators, bandwidth-bound workloads like large language model inference that benefit from TB/s HBM bandwidth, and capacity-bound workloads like DLRM-style recommendation engines, whose embedding tables routinely exceed terabytes in aggregate, far beyond any single accelerator. Those tables are sharded across pooled host and accelerator memory, so distributed lookups and training updates place heavy demands on the cluster interconnect. Voice assistants show the split between tiers: they lean on the cloud for language understanding while their always-on wake-word stage runs on the device, a division that section 2.10 quantifies. Even as cloud deployments scale from single-accelerator instances to warehouse-scale clusters, systems engineering at every one of these scales begins on a single node, with memory bus saturation, PCIe and NVLink bandwidth, and accelerator utilization inside one machine.

↪ The memory-capacity bounds and sparse gather patterns of high-cardinality embedding tables are developed in Sparse Architectures: Recommendation Systems.

Definition 2.1: Cloud ML

Cloud machine learning is the deployment paradigm that trades latency for elastic compute by locating ML workloads in centralized data centers, decoupling computational capacity from the physical location of data sources and users.

  1. Significance: Cloud deployment dominates the \(\PeakRate\) term: a cloud region can pool thousands of accelerators, with access governed by capacity, quotas, and cost. The trade-off is the \(\Latency\) term: a minimum round-trip latency of 10–100 ms (set by the speed of light over continental distances) makes those distant cloud paths infeasible for workloads requiring sub-10 ms response.
  2. Distinction: Unlike edge ML, which prioritizes local response and data locality at fixed \(\PeakRate\), cloud ML prioritizes elastic \(\PeakRate\) at the cost of variable \(\Latency\).
  3. Common pitfall: A frequent misconception is that cloud ML is “unlimited compute.” In reality, the distance penalty \((\Latency)\) and the ingestion bottleneck \((\DataVolume/\Bandwidth)\) are physics constraints that no software optimization can eliminate, setting a hard floor on response time for any workload whose data originates outside the data center.
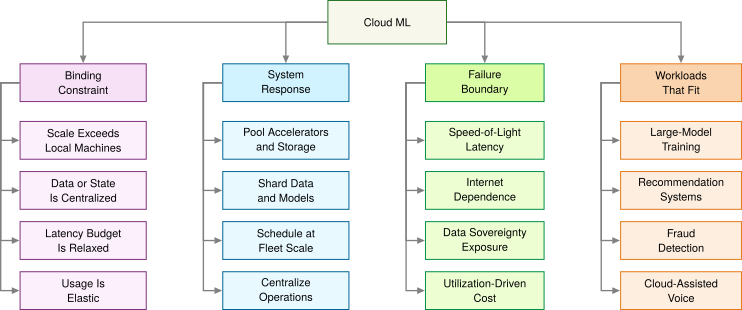
Figure 4: Cloud ML Constraint Map: Centralized infrastructure solves the scale problem for compute-bound workloads, bandwidth-bound workloads, and capacity-bound workloads, but it introduces the distance, dependency, privacy, and cost constraints that determine when cloud ML stops being the right deployment target.

Pooling elastic accelerators and sharding models overcome local capacity ceilings, but they meet hard failure boundaries in speed-of-light propagation latency and internet dependence (figure 4). Workloads that thrive in this regime (such as asynchronous fraud detection, batch recommendation updates, and large language model pretraining) accept this trade because scale matters more than instantaneous response. When an application requires real-time control, however, network latency stops being an engineering inconvenience and becomes a hard physical barrier. The light-barrier calculation already ruled out a cross-country data center for a 10 ms budget; the sharper question is whether a regional data center, much closer to the machine it protects, fares any better.

Napkin Math 2.2: The distance penalty
Problem: Consider a real-time safety monitor for a robotic arm on a factory floor. The safety logic requires a 10 ms end-to-end response time to prevent injury, so the distance penalty imposed by the light barrier matters. The model runs in a regional cloud data center 1,500 km away, less than half the cross-country distance. Can the safety budget be met?

Physics:

  1. Light in fiber: ~200,000 km/s.
  2. Round-trip propagation: (1,500 km \(\times\) 2)/200,000 km/s = 15 ms.
  3. Result: Round-trip propagation alone requires 15 ms, exceeding the 10 ms end-to-end budget by 5 ms before the model performs any inference.

Systems insight: The specified regional cloud path misses the budget on propagation alone and is therefore infeasible. Running the model beside the arm removes that remote propagation term, but the complete local sensing, inference, and control path must still be checked against the deadline.

2.5.1 Cloud infrastructure and scale

Training a frontier model across hundreds of terabytes of data requires connecting thousands of accelerator chips so tightly that they behave like one computer. Cloud ML concentrates computational resources at physical dimensions no local device approaches: TPU supercomputer designs organize thousands of specialized accelerator chips into data-center-scale systems that deliver PFLOP/s-to-EFLOP/s reduced-precision throughput (Jouppi et al. 2023), orders of magnitude beyond the edge and mobile rows of table 4. Warehouse-scale facilities pack aisles of liquid-cooled racks and dense optical cabling that draw megawatts to sustain that exaFLOP-scale matrix throughput (figure 5), providing the physical scale that makes training on hundreds of terabytes of data practical.

↪ What changes when training extends beyond a single node is developed in Scaling beyond a single node.
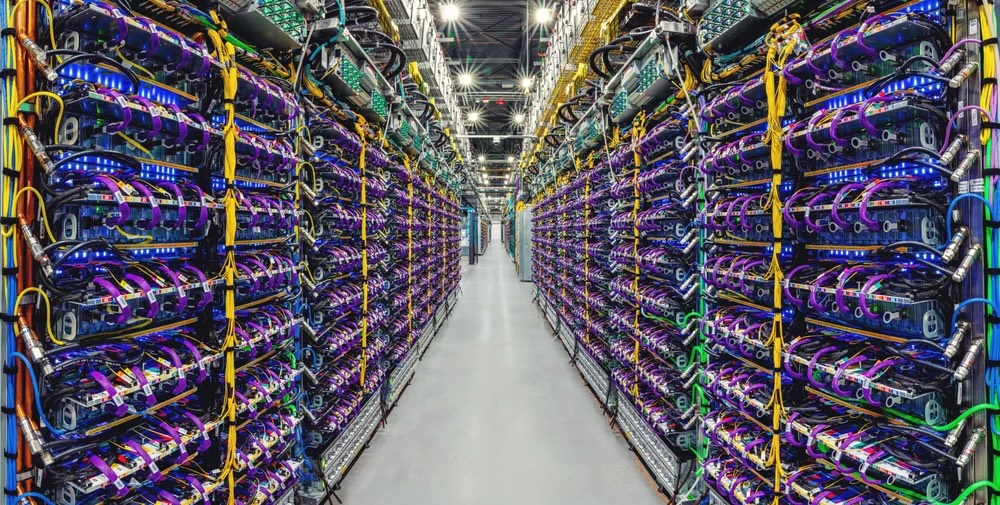
Figure 5: Cloud Data Center Scale: Dedicated accelerator facilities aggregate thousands of specialized TPU chips in liquid-cooled racks to deliver exaFLOP-scale matrix throughput. This centralized infrastructure makes large-scale model training and high-throughput serving viable, but incurs megawatt-scale power consumption and speed-of-light network distance penalties. Source: (Pichai 2023).
Pichai, Sundar. 2023. Introducing Gemini: Our Largest and Most Capable AI Model.

Centralization also changes how models are served and governed. Cloud APIs make trained models accessible worldwide across mobile, web, and IoT platforms. Shared infrastructure enables engineering teams to collaborate with unified version control, while pay-as-you-go pricing models convert upfront capital expenditure (CapEx) into usage-based operational expenditure (OpEx) that scales with demand.

Scale does not make the cloud universally superior. The data-gravity principle (2) explains why. Shipping a dataset of size \(\DataVolume\) over a network link of bandwidth \(\NetworkBandwidth\) takes \(\DataVolume/\NetworkBandwidth\), a time that grows with the data, while shipping the computation (a model and its code) costs roughly the same however much data waits at the other end. As data volume grows, moving the data to a remote cluster therefore eventually costs more than moving the computation to the data. Data gravity works through the transfer arithmetic, and the edge section applies the same comparison to a single request under a deadline. The deployment paradigm is dictated by the binding physical constraint, not by the largest available throughput.

2.5.2 Cloud ML trade-offs and constraints

A regional cloud outage can take down every connected client at once, and a sudden traffic spike can turn an elastic GPU pool into a runaway monthly bill. For latency-sensitive workloads, the distance penalty is the cloud’s most consequential cost, and network jitter makes it unpredictable as well as large. Three further costs follow from centralization: the exposure of data the cloud must receive, spending that scales with use, and dependence on the network.

The first cost is privacy and security. Transmitting sensitive data to remote data centers expands the disclosure surface and complicates regulatory compliance. Organizations handling data subject to regulations such as the General Data Protection Regulation (GDPR) or the Health Insurance Portability and Accountability Act (HIPAA) must select, document, and maintain safeguards appropriate to the data, system, and applicable legal duties. Privacy-preserving approaches can reduce how much sensitive data leaves its original environment, but they complement rather than replace infrastructure controls.

The second cost is financial, because cloud infrastructure turns upfront hardware purchases into ongoing operating bills. Comparing paradigms by raw accelerator hourly rates obscures the cumulative expenses of network egress, persistent storage, and managed orchestration. Sound evaluation instead compares total cost of ownership (TCO), which includes power, cooling, and labor and weighs upfront capital expense against recurring operating expense over the system’s lifetime.

A vision system serves 1M daily inferences at ResNet-50 scale (10 ms latency, 100 KB response). The TCO analysis begins with an illustrative budget spanning 3 years. It includes the listed components rather than a complete, matched TCO. Cloud operating labor, edge redundancy, installation, and failure recovery are not included, and comparable capacity and availability have not been established. The 4 instances are a provisioning choice (redundancy and headroom for traffic peaks), not a throughput requirement. Table 5 itemizes the annual GPU, network, load-balancer, and observability costs of this fixed-capacity cloud implementation under public list pricing, and table 6 itemizes the corresponding hardware, power, cooling, network, and DevOps labor costs of an on-premises edge-server implementation.

Table 5: Cloud Inference Annual Budget: The fixed-capacity cloud implementation of the ResNet-50-scale vision workload incurs itemized GPU, network, load-balancer, and observability costs.
Cost Component Calculation Annual Cost
GPU inference 4 instances \(\times\) 8760 h/year \(\times\) $0.75/hr ~$26,280
Network egress 100 GB/day \(\times\) 365 d/year \(\times\) $0.09/GB ~$3,285
Load balancer $0.025/hr + capacity units ~$3,723
Monitoring/logging Monitoring, alerts ~$2,000
Total Cloud ~$35,288/year
Table 6: Edge Inference Annual Budget: The on-premises edge-server implementation incurs itemized hardware, power, cooling, network, and DevOps labor costs, and labor is the dominant component in this scenario.
Cost Component Calculation Annual Cost
Hardware CapEx $15,000 ÷ 3 years life ~$5,000
Power (24/7) 300 W \(\times\) 8760 h/year \(\times\) $0.12/kWh ~$315
Cooling overhead ~30% of power ~$95
Network (fiber) Fixed line for remote management ~$1,200
DevOps labor 0.1 FTE \(\times\) $150,000 salary ~$15,000
Total Edge ~$21,610/year

Napkin Math 2.3: Cloud vs. edge annual budgets
Problem: Under the partial accounting boundaries itemized in table 5 and table 6, which implementation has the lower estimated annual budget over 3 years?

Math: The question is the annual cost at this operating point, so the comparison is the gap between the cloud and edge annual totals.

At 1M inferences/day, the gap is ~$35,288/year − ~$21,610/year = ~$13,678/year. Almost all of the cloud cost is provisioned capacity rather than use. At 10 ms per request the day’s traffic needs only about 2.8 GPU-hours of the 96 provisioned, about 2.9 percent utilization. Only egress scales with traffic.

Result: The listed edge budget costs about 38.8 percent less at this operating point. Because the fixed cloud pool alone already costs more than the listed edge budget, no traffic level under this fixed provisioning and partial accounting makes the cloud cheaper; a genuine break-even analysis would need cloud capacity that scales with demand.

Systems insight: The listed edge budget is dominated by labor (~$15,000 ÷ ~$21,610/year ≈ 69.4 percent), not hardware. Organizations without existing DevOps capacity should factor in the full cost of maintaining on-premises infrastructure.

Unpredictable usage spikes also complicate budgeting and call for automated monitoring and cost governance. Network dependency, the last of the three costs, creates an availability hazard: any connectivity disruption between clients and the data center immediately degrades or halts service. Proprietary cloud APIs compound the dependency with vendor lock-in, making it harder to move workloads from one provider to another. Even so, centralized infrastructure remains uniquely suited to consumer-scale services that require elastic capacity, such as voice assistants and recommendation engines. These applications trade latency for scale, accepting remote-path delay in exchange for computational resources that cannot be supplied locally. The trade fails when a latency budget drops below what the remote path permits or when data volumes exceed what networks can carry, and computation must then move closer to the data source.

Self-Check: Question
  1. In the chapter’s 3-year budget comparison for an on-premises edge server deployment serving 1 million inferences per day, what is the largest component of the edge system’s listed annual budget in the chapter’s scenario?

    1. GPU hardware silicon purchase price amortized over 3 years
    2. DevOps engineering labor required to maintain, update, and manage on-premises edge infrastructure
    3. Electricity costs for running the server 24/7
    4. Dedicated server room air-conditioning and cooling overhead
  2. What is the data-gravity principle in cloud ML, and why does it make moving multi-terabyte raw sensor datasets to the cloud economically and physically problematic?

  3. Under GDPR Article 17 (Right to Erasure), when a user requests deletion of their data, an organization is legally mandated to retrain from scratch every ML model that ever encountered that user’s training samples.

See Answers →

2.6 Edge ML: Latency and Privacy

The robotic-arm safety monitor in napkin math 2.2, an industrial IoT (IIoT) control loop,13 left one option open, running the model beside the arm it protects. Moving computation adjacent to the data source removes that remote transmission term from the request path, and edge ML is the paradigm built on that move.

13 Industrial IoT (IIoT): A domain where latency constraints can be set by physical safety rather than user perception. Keeping sensing and the stop decision local removes the long-haul network term but leaves the edge system bounded by its local compute capacity \((\PeakRate)\).

Edge ML trades elastic cloud capacity for shorter request paths and local data retention. Proximity does not by itself guarantee a sub-100 ms response, so the complete path must still be verified. Offloading a workload over a wide-area link can make remote-path latency, rather than local execution, the binding term. Under the iron law from equation 5, local execution removes the I/O offload term from the request path, leaving execution time bounded by local compute and memory transfer.

Definition 2.2: Edge ML

Edge machine learning is the deployment paradigm optimized for local response and data locality by locating computation physically adjacent to data sources.

  1. Significance: It circumvents the distance penalty \((\Latency)\) of the cloud, trading elastic scale for a fixed local compute capacity \((\PeakRate)\).
  2. Distinction: Unlike cloud ML, which prioritizes throughput, edge ML prioritizes response deadlines and local data control. Unlike TinyML, edge ML may still use workstation-class accelerators such as general-purpose GPUs (GPGPUs).
  3. Common pitfall: A frequent misconception is that edge ML refers to a specific hardware class. In reality, it is a location paradigm: it spans from IoT gateways to on-premises servers, unified by physical proximity to the data source.

Real-time deadlines are not the only driver. Data sovereignty and privacy rules can restrict transmitting raw sensor streams across external networks, which places computation on local gateways, industrial PCs, and on-premises servers. Placing compute near sensors and filtering data locally helps meet sub-100 ms response budgets, while introducing failure boundaries in fixed node capacity and remote fleet management (figure 6).
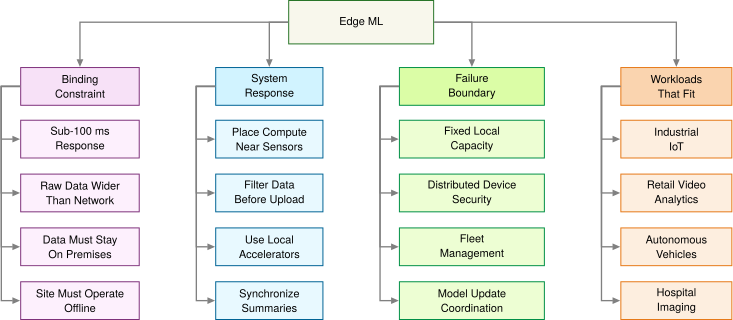
Figure 6: Edge ML Constraint Map: Moving computation near the data removes the network-latency term and reduces bandwidth pressure, but it replaces centralized scale with fixed local capacity, distributed security exposure, and operational complexity across many sites.

Two-rung bandwidth ladder comparing 100 raw 1080p camera feeds at about 18.7 GB per second with a 10G link at about 1.25 GB per second.

Raw edge data can be wider than the network pipe.

14 Internet of things (IoT) data wall: IoT deployments depend on continuous sensor streams from devices distributed across homes, factories, farms, vehicles, and infrastructure (McKinsey Global Institute 2021). In many of those settings, the aggregate \(\DataVolume\) from raw streams overwhelms the available uplink budget or latency budget for centralized ingestion, making local edge processing an architectural requirement rather than merely a cost optimization.

McKinsey Global Institute. 2021. The Internet of Things: Catching up to an Accelerating Opportunity. McKinsey & Company.

IoT sensor ingestion rates14 above network uplink capacity rule out transmitting the full raw stream. Local filtering or compression can reduce the transmitted representation; the complete local and remote paths then determine where inference can meet the application’s requirements.

Napkin Math 2.4: The bandwidth bottleneck
Problem: Consider a quality control system for a factory floor with 100 cameras running at 30 FPS with 1080p resolution. Does video streaming become the bandwidth bottleneck, and does edge ML reduce the bandwidth enough to process locally?

Physics:

  1. Raw data rate per camera: 1920 \(\times\) 1080 \(\times\) 3 bytes \(\times\) 30 FPS ≈ 186.6 MB/s.
  2. Total data rate: 100 cameras \(\times\) 186.6 MB/s = 18.7 GB/s.
  3. Cloud transfer exposure: Uploading raw camera feeds is primarily a bandwidth, ingest, storage, and processing problem; per-GB cloud egress charges apply when data is transferred back out of the cloud. If the raw stream were later retrieved at $0.09/GB data-transfer-out pricing, the transfer charge alone would reach $4.4M/month.
  4. Network reality: Even a dedicated 10 Gbps line (1.25 GB/s) cannot carry the load, because the workload demands 14.9× more bandwidth than exists.

Systems insight: Streaming these raw feeds over the stated link is impossible. Local processing or a smaller transmitted representation is required; compression changes the bandwidth calculation but must preserve the information and timing needed for defect detection. If an edge server transmits only defect metadata (1 KB per detection at roughly 20 events/s across the floor), bandwidth falls by about 933,120×.

Uncompressed sensor streams can saturate an uplink, which is the bandwidth barrier to centralized ingestion. For battery-powered edge devices (wireless cameras, drones, wearables), the energy cost of wireless communication introduces an even stricter physical ceiling. Offloading adds energy to the time-based analysis of equation 5, so the local-versus-offload decision must weigh joules as well as milliseconds.

Napkin Math 2.5: The energy of transmission
Problem: Should a battery-powered sensor process data locally (on-device NPU inference) or send it to the cloud when the energy of transmission must come out of a fixed battery budget?

Given:

  • Data \((\DataVolume)\): 1 MB (illustrative payload volume).
  • Transmission energy \((\TransmissionEnergyPerByte)\): 100 mJ/MB (Wi-Fi/LTE).
  • Compute energy \((\LocalInferenceEnergy)\): 0.1 mJ/inference (illustrative MobileNetV2 anchor for the neural processing unit alone, excluding the rest of the phone).

Math:

  1. Cloud approach: \(\CloudOffloadEnergy\approx \DataVolume \times \TransmissionEnergyPerByte\) = 1 MB \(\times\) 100 mJ/MB = 100 mJ.
  2. Local approach: \(\LocalInferenceEnergy\approx\) Inference = 0.1 mJ.

Systems insight: Transmitting raw data is 1,000× more expensive than processing it locally. Charging local inference with the whole phone’s energy over the inference window (2.6 mJ, the MobileNetV2 bar charted in figure 7) still leaves transmission 39× more expensive. Even if the cloud had infinite speed \((\Time\approx 0)\), the stated battery budget favors local inference over raw-data transmission. The machine constraint (battery) shapes the deployment choice.

Figure 7 steps back from that matched comparison and supplies energy scale anchors for different tasks and accounting boundaries on a logarithmic scale spanning eight orders of magnitude, isolating the 100,000,000× gap between an always-on TinyML keyword spotting inference (about 10 µJ) and a cloud foundation-model query (about 1 kJ, an order-of-magnitude scenario anchor that includes data-center overhead rather than a measured value).
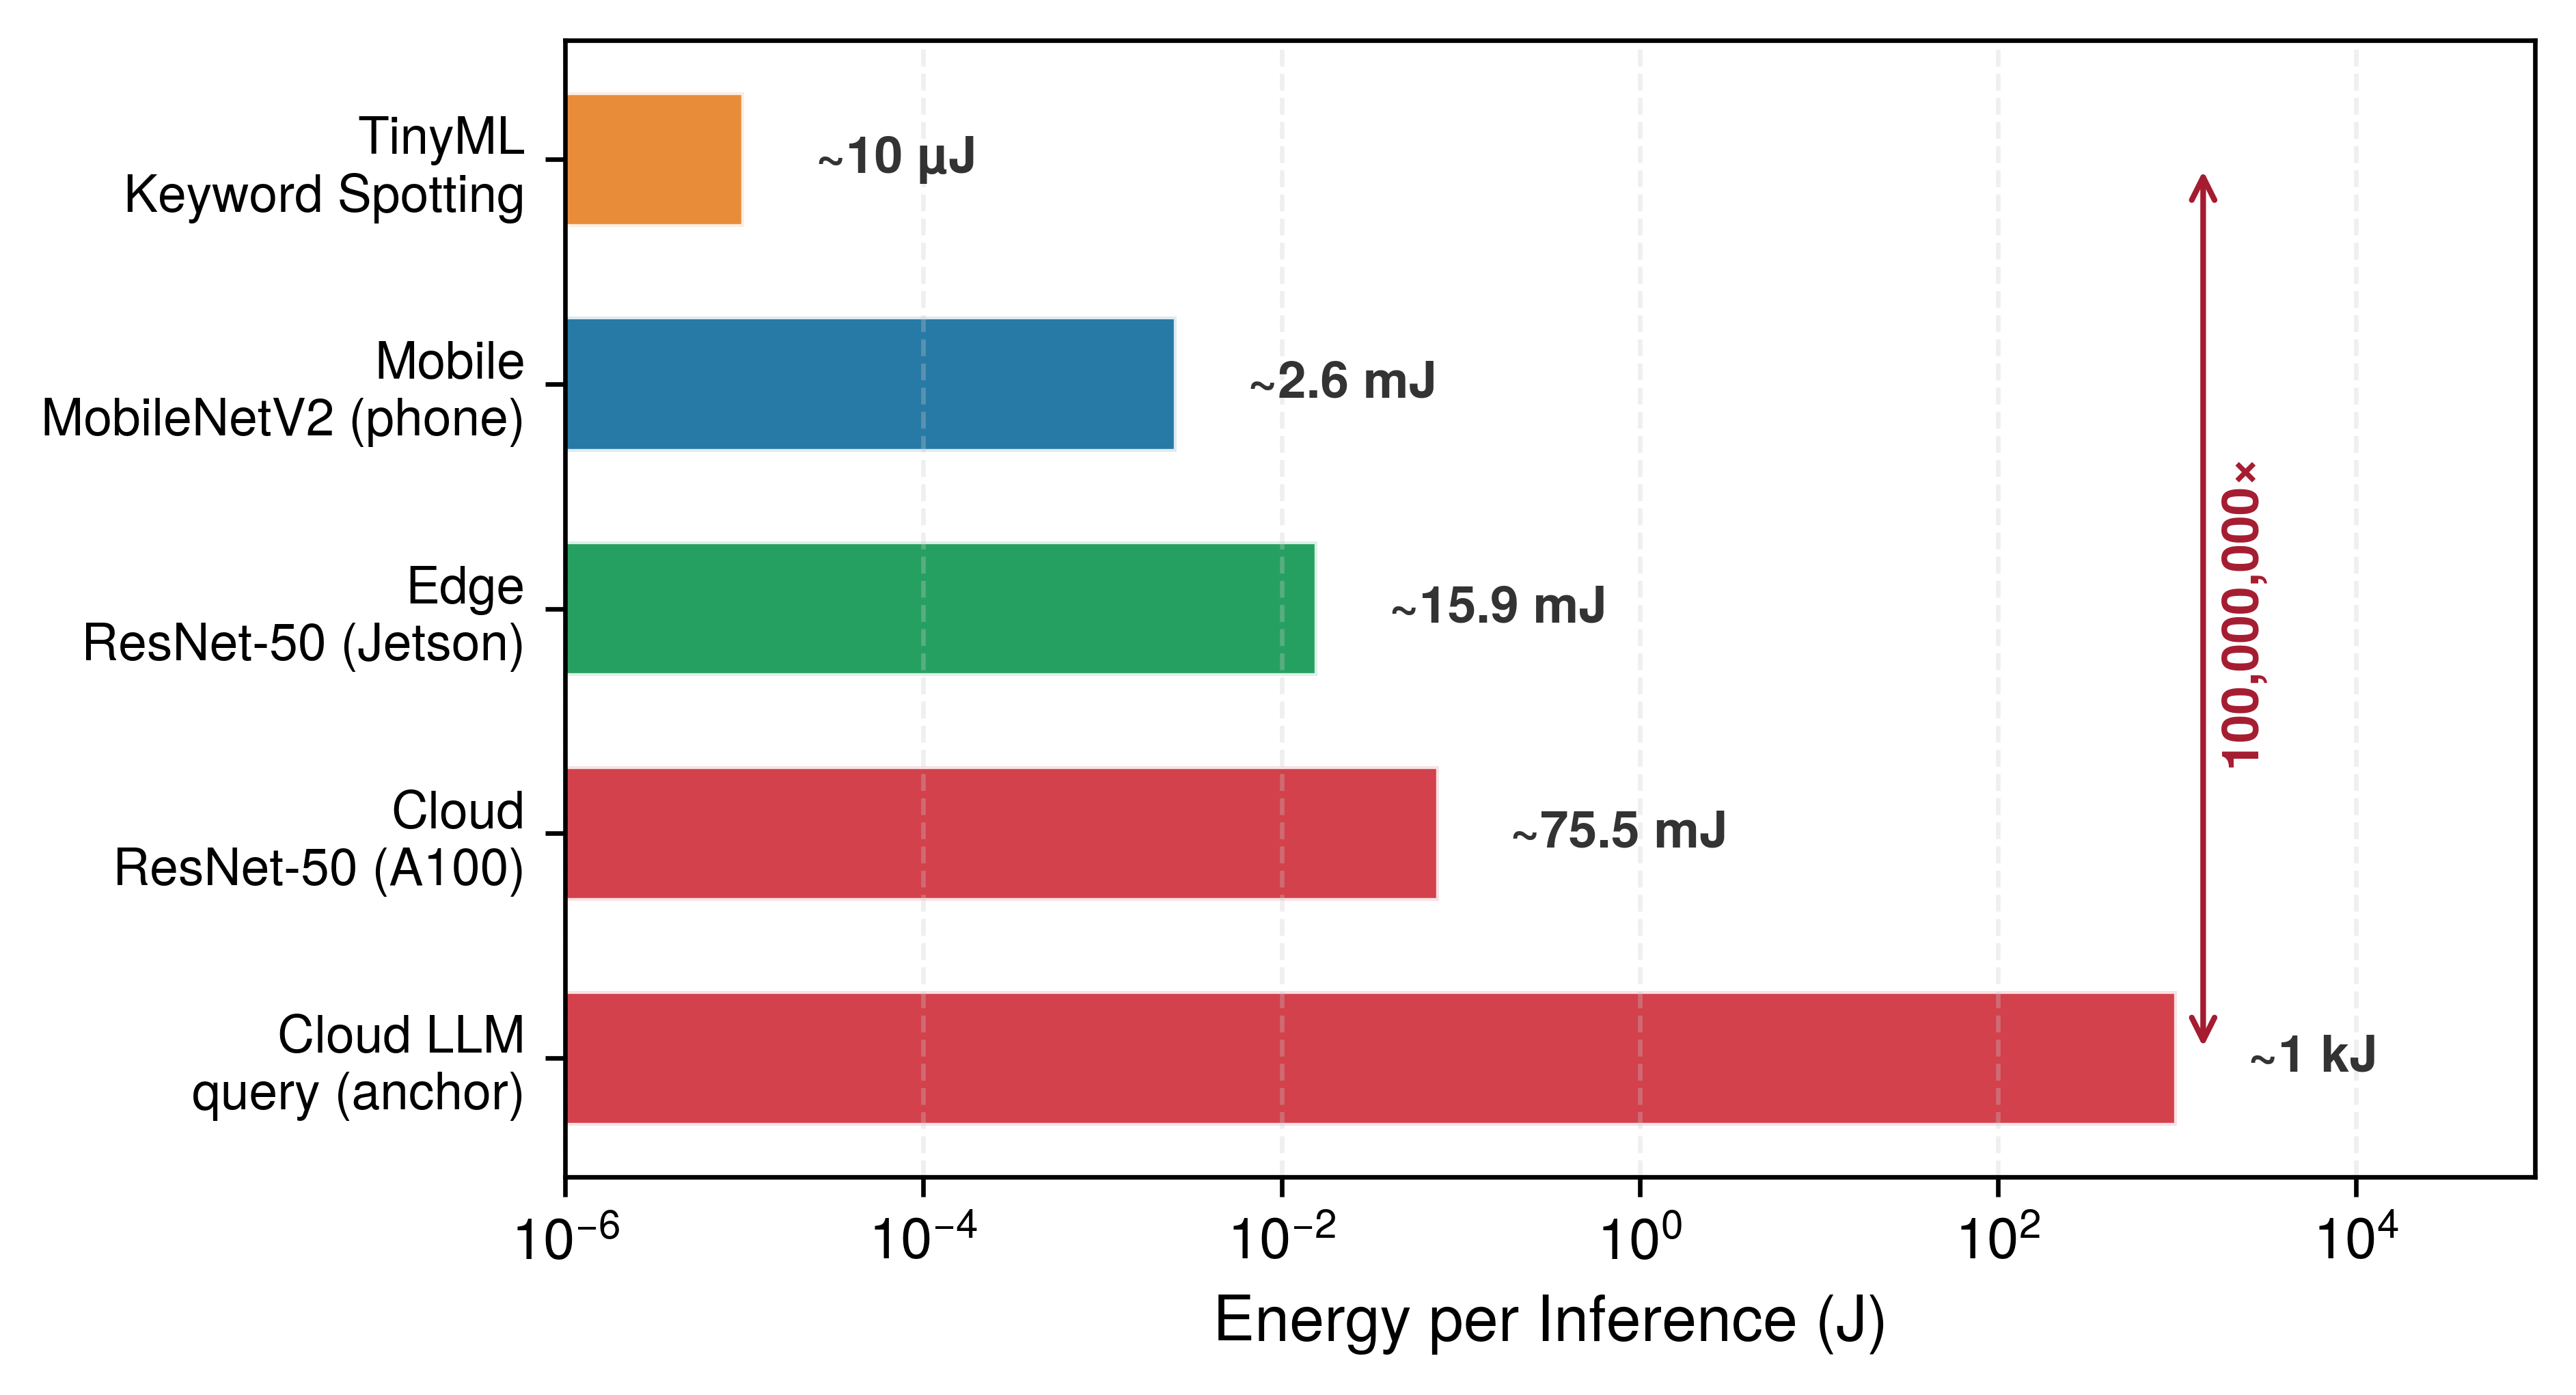
Figure 7: Energy per Inference Across Deployment Tiers: An eight-order-of-magnitude energy gap separates always-on TinyML keyword spotting (~10 µJ) from a cloud foundation-model query (~1 kJ) on a log scale. The three vision bars are device-level estimates (the device’s power draw at its modeled utilization over the batch-1 inference window, counting the whole phone, the edge tier’s NVIDIA Jetson embedded GPU module, or the A100 card) from the same analytical model used throughout this chapter; the two endpoints are scenario anchors. The tasks and accounting boundaries differ, so these bars illustrate energy scales rather than a controlled hardware-efficiency or offload comparison.

Systems Perspective 2.2: Reading the energy-per-inference numbers
The logarithmic comparisons plotted in figure 7 combine solver-derived device-energy estimates with separate scale anchors; they are not controlled full-system measurements. Each vision bar counts one device over its batch-1 inference window. The cloud ResNet-50 bar, for example, charges an A100 averaging about ~130 W for 0.57 ms; it excludes the host CPUs, memory, networking, and cooling that bring an entire server to about ~1 kW, so a whole-server accounting of the same request would be several times larger.

The span becomes tangible when measured in a familiar unit of energy, one smartphone battery. The nominal energy stored in a 3.7 V, 3000 mAh battery is equivalent to about 4 billion inferences by the keyword spotter but only about 40 queries to a cloud LLM. The comparison is one of scale only: a cloud query’s energy is spent in the data center, not drawn from the phone. Nor are the keyword-spotting counts elapsed battery life: actual runtime still depends on inference cadence, sleep power, sensing, communication, and the rest of the device.

2.6.1 The data locality invariant: When the network is too slow

When a delivery drone captures 4K video at 60 frames per second to dodge obstacles, shipping even one uncompressed frame over a cellular link takes longer than the 16.7 ms interval before the next frame arrives. That per-request bandwidth-latency trade-off governs the choice between local edge processing and remote cloud offload. The data locality invariant below is the per-request, deadline-bound form of the data-gravity principle from the cloud section: where data gravity weighs moving a whole dataset against moving the computation, the invariant weighs moving one input against one deadline. A remote path is rejected when its complete time exceeds the service deadline, and among the paths that remain, the faster one wins.

Definition 2.3: The data locality invariant

The data locality invariant first screens a remote path against the service deadline. The expression below gives a lower bound on complete remote-path time \(\RemotePathTime\); let \(\CompletionDeadline\) denote the deadline, \(\NetworkBandwidth\) offload bandwidth, \(\NetworkLatency\) network latency, and \(\RemotePeakRate\) and \(\RemoteHardwareEfficiency\) the remote compute rate and efficiency: \[\RemotePathTime \ge \frac{\DataVolume}{\NetworkBandwidth} + \NetworkLatency + \frac{\Operations}{\RemotePeakRate \cdot \RemoteHardwareEfficiency}\]

The bound includes input transmission, network round-trip time, and arithmetic execution, but omits remote memory movement, queueing, preprocessing, runtime overhead, and response serialization. If even this lower bound exceeds the deadline, reject the remote path. A bound below the deadline leaves a candidate for complete-path measurement; it does not establish feasibility. Compare complete local and remote times only after each path meets the deadline and its resource constraints. Here, \(\NetworkLatency\) covers propagation, routing, and protocol handshakes; response serialization may be small for a class label but must be included when material.

  1. Significance: The invariant defines a crossover beyond which adding remote compute \((\RemotePeakRate)\) has little effect because transmission dominates the lower bound. The local path is preferred only after its own complete execution time and resource limits are checked.
  2. Distinction: Unlike the iron law, which decomposes one execution path, the locality invariant uses a deadline to reject an idealized remote path, then requires complete-path evidence to choose between the remaining alternatives.
  3. Common pitfall: A frequent misconception is that 5G/6G “solves” locality. While these technologies improve \(\NetworkBandwidth\), they do not remove propagation and protocol latency, so a remote path can still miss a tight service deadline.

The locality formulation also explains what every local tier gains, edge, mobile, and TinyML alike. Local execution removes network transit time (\(\DataVolume/\NetworkBandwidth + \NetworkLatency\)) from the request path, eliminating wide-area network variability. A closed-loop latency guarantee requires validating a bound on the complete local path under its operating conditions, \(\LocalPathTime\le \CompletionDeadline\). Uplink traffic drops from raw sensor bitrates to lightweight event telemetry, relieving congestion and recurring transit charges. Keeping raw sensor data where it is captured shrinks the transmission attack surface, although local processing alone does not guarantee privacy: data at rest still needs access control, and retention and secondary use still need governance. Local inference also continues through wide-area outages whenever local power and sensor links remain functional. Mobile and TinyML inherit all four gains; what distinguishes them is what each gives up to obtain them. A single high-rate sensor frame under a strict frame deadline is enough to force that crossover.

Napkin Math 2.6: The locality crossover
Problem: Should a drone’s object avoidance system (4K, 60 FPS) offload to the cloud, or does this become a locality crossover?

Given:

  • Data \((\DataVolume)\): 4K frame ≈ 24.9 MB.
  • Bandwidth \((\NetworkBandwidth)\): 100 Mb/s cellular uplink.
  • Remote network and compute response: 110 ms (round-trip + remote compute).
  • Per-frame completion deadline: 16.7 ms, equal to the frame interval in this illustrative scenario; each avoidance result must be ready before the next frame arrives.

Math:

  1. Transmission time: 24.9 MB \(\times\) 8 bits/100 Mb/s = 1,990.7 ms.
  2. Remote-path lower bound: Transmission + 110 ms remote response = 2100.7 ms, vs. the stated 16.7 ms per-frame deadline.

Systems insight: The remote path misses the stated per-frame deadline, and faster remote compute cannot remove the transmission time. Cloud offload is therefore infeasible under these assumptions; the local path must still be measured to confirm that it meets the deadline.

2.6.2 Edge ML deployment challenges

Keeping inference on the factory floor or inside a retail store eliminates the wide-area network delay, but now the model must fit inside whatever compute box is bolted to the wall—and if a firmware update fails across a thousand stores, no data-center operations team can walk down the aisle to swap the board. Edge deployment trades network transit for fixed local capacity. Edge hardware spans a wide power envelope, from 5–50 W embedded modules to site-powered servers drawing hundreds of watts, and its binding limit is the fixed capacity of a site rather than the elastic capacity of a cloud region. Many smaller embedded modules operate within 1–8 GB of memory,15 and their power and board budgets cannot support the wide, high-power interfaces of HBM. They rely on LPDDR or shared system DRAM instead, so memory capacity limits parameter scale and memory bandwidth limits throughput. Fitting modern machine learning models into these bounds requires efficiency techniques that store weights in fewer bits (quantization), remove weights that contribute little (pruning), or train a smaller model to imitate a larger one (distillation). Model footprint, activation buffers, runtime state, and thermal duty cycles all become binding. Operationally, coordinating software updates and model versions across thousands of heterogeneous, physically exposed devices requires specialized deployment pipelines,16 where intermittent links and physical access complicate rollback and failure diagnosis.

15 Embedded edge constraints: Across representative edge envelopes, 1–8 GB can hold roughly 1–8 billion INT8 weights before activations, runtime state, and other buffers, so the memory budget, not a fixed parameter count, sets the ceiling. Sustainable compute is further limited by power, cooling, and duty cycle.

16 Edge fleet coordination: Managing thousands of distributed edge devices amplifies coordination problems: intermittent connectivity causes model version drift, hardware heterogeneity requires per-target optimization, and limited remote access can make failed firmware rollbacks require a site visit.

↪ Over-the-air updates, dual-bank rollback, and lightweight fleet telemetry for edge devices are developed in Edge AI deployment.

A realistic retail deployment shows how those constraints turn into throughput, hardware, and fleet-cost requirements. Consider a smart retail chain that deploys person detection across 500 stores, each with 20 cameras/store running at 15 FPS. Table 7 cascades the per-store inference rate through the per-frame FLOP count of YOLOv8-nano, a compact object-detection model, to yield the throughput each store must sustain. The 2\(\times\) headroom keeps the device out of saturation when traffic bursts above the average rate.

Table 7: Edge Inference Sizing Requirements: The per-store inference rate and model cost set the throughput target for the smart-retail person-detection scenario.
Metric Calculation Result
Inferences per store 20 cameras/store \(\times\) 15 FPS 300 inferences/s
Model compute YOLOv8-nano: 8.7 GFLOP/inference 2610 GFLOP/s
Required throughput 2610 GFLOP/s \(\times\) 2 (headroom) ~5.22 TOPS equivalent

Three candidate edge accelerators, including an embedded GPU accelerator, differ sharply in the power, unit cost, and fleet cost of reaching that throughput target (table 8).

Table 8: Edge Accelerator Options: Three candidate edge accelerators differ in throughput, power, and cost at fleet scale. Fleet cost assumes one unit per store for Jetson and NUC. Jetson power depends on the module: Jetson Orin Nano draws 7–15 W, Orin NX 10–25 W, and AGX Orin 15–60 W, so Jetson power figures in this book should be read against the module named in context.
Edge Device INT8 TOPS Power Unit Cost Fleet Cost
NVIDIA Jetson Orin NX 100 TOPS 10–25 W $600 $300,000
Intel NUC + Movidius 1 TOPS 15 W $400 $200,000
Google Coral Dev (3 boards/store) peak 12 TOPS
derated 6 TOPS
6 W $450 $225,000

Napkin Math 2.7: Edge inference sizing
Problem: Given the throughput target in table 7 and the candidates in table 8, which edge accelerator (USB-scale TPU, workstation-class embedded GPU, or general-purpose mini-PC) delivers the required throughput at the lowest estimated three-year hardware-and-power budget?

Math: The capacity screen uses an assumed sustained rate rather than the datasheet peak. The scenario’s 50 percent derating plays the role of the efficiency \(\EfficiencyHw\) in the iron law. One Jetson derates from 100 TOPS to 50 TOPS, far above the 5.22 TOPS requirement. One NUC derates to 0.5 TOPS and falls short; meeting the target would take 11 per store, about $2,200,000 of hardware across the fleet. A Coral Dev Board is rated at 4 TOPS peak; the same derating gives 2 TOPS, so the count per store is 5.22 TOPS required ÷ 2 TOPS per board = 2.6 boards, which rounds up to 3 boards/store. This estimate assumes the model’s operations and numerical format are supported and that work can be divided across the boards at the assumed rate.

Over 3 years across 500 stores, the hardware-and-power estimate for that configuration is Hardware $225,000 + Power (0.006 kW \(\times\) 500 \(\times\) 8760 h/year \(\times\) 3 years \(\times\) $0.12/kWh = $9,461) = $234,461 total vs. a baseline of one dedicated cloud GPU per store, at the same $0.75/hr instance rate as the cloud-versus-edge comparison, of ~$9,855,000. Within this accounting boundary, the other two candidates need no power arithmetic to rank, because the Coral configuration’s hardware-and-power estimate is already below the Jetson fleet’s $300,000 hardware cost and far below a feasible NUC fleet’s. Integration, maintenance, redundancy, and matched cloud operating costs remain outside this comparison.

Result: One Coral alone is undersized under these assumptions, but the sharded configuration with 3 boards/store is a low-cost edge candidate within the hardware-and-power boundary, with an estimated 6 TOPS and about 1.3× lower per-store hardware CapEx than Jetson. Jetson remains the simpler single-device candidate when integration complexity matters more than hardware cost.

Systems insight: Edge sizing is a capacity-and-cost problem, not a device-name problem. The cheapest feasible design may be several small accelerators per site rather than one larger board, but that hardware saving must be weighed against the coordination and maintenance burden of a sharded edge fleet. The estimate narrows the candidates; measurements of the actual model and runtime must establish task quality, throughput, and end-to-end latency before deployment.

Edge hardware is also physically exposed. Unlike servers housed in access-controlled data centers, edge hardware deployed across retail floors or public infrastructure is physically accessible to adversaries. This exposure requires hardware-enforced protection mechanisms: secure boot chains to prevent unauthorized firmware modification, encrypted local storage for model weights and intermediate activations, and tamper-evident enclosures. Capital expenditures also scale linearly with deployment footprint, so equipping 1,000 sites with $500–2,000 of edge hardware per site requires $500,000–2,000,000 in upfront CapEx before installation, cabling, and fleet operations. Whether that upfront investment yields a lower total cost of ownership than recurring cloud inference depends on utilization duty cycles, local energy rates, and site maintenance overhead.

2.6.3 Real-time industrial and IoT systems

Edge applications differ by domain, but each rests on a locality argument, because the system cannot wait for the network, cannot ship the data, cannot expose the raw signal, or cannot stop during an outage. Autonomous vehicles represent a demanding application because safety-critical perception and control decisions must fit millisecond-scale budgets. Onboard systems process streams from multiple cameras and other sensors through local hardware; a remote cloud path cannot satisfy the tight control loop when its network delay alone exceeds the deadline.

In smart retail, uplink bandwidth and privacy bind before compute does. A checkout-free store17 can process feeds from many cameras on local edge servers, tracking customer movements and item selections without continuously transmitting raw video over a wide-area link. This architecture reduces bandwidth demand and transmission exposure, but it does not by itself ensure privacy: retention, access, secondary use, and governance controls still determine the system’s compliance and risk.

17 Checkout-free retail: A store design that fuses camera observations with shelf events and transaction state locally, then transmits only selected events or aggregates. Those derived records still fall inside the privacy boundary.

18 Industry 4.0: The fourth industrial revolution integrates ML into the sensor-actuator feedback loop on factory floors. In an illustrative welding-robot scenario, defect detection samples at 60 Hz, giving a 16.7 ms sampling interval; if each response must finish before the next sample, the complete sensing-to-actuation path must fit that deadline. This completion requirement is a scenario assumption; the sampling rate alone does not establish the control deadline or guarantee safe operation.

19 Predictive maintenance: The use of sensor data such as vibration and temperature to estimate equipment condition and failure risk. Continuous monitoring makes sensing cadence, duty cycle, power, and local storage first-class constraints. Battery-powered monitoring nodes may require sub-watt average operation, whereas mains-powered industrial gateways can use a much larger envelope.

The industrial IoT, often called Industry 4.0 when ML closes the factory control loop,18 uses edge ML where millisecond-level responsiveness affects production quality and worker safety. Manufacturing facilities deploy edge ML systems for real-time quality control and predictive maintenance.19

Many industrial and retail edge systems are stationary and connected to site power, where a factory edge server drawing hundreds of watts around the clock remains viable. Mobile devices, by contrast, travel with untethered users on strictly bounded battery reserves. When computation moves from stationary infrastructure to an untethered mobile device, battery energy becomes a central constraint alongside latency, and the dominant optimization target shifts from raw execution time to energy per inference.

Self-Check: Question
  1. A manufacturing facility deploys 100 cameras recording uncompressed 1080p video (\(1920 \times 1080 \times 3\text{ bytes/pixel}\)) at 30 FPS. The factory has a dedicated 10 Gbps (~1.25 GB/s) fiber uplink. Why is streaming all raw video to a cloud ML server physically impossible?

    1. The total is only about \(186.6\text{ MB/s}\) because that is the per-camera rate, so the 10 Gbps uplink has ample headroom.
    2. The aggregate is about \(18.7\text{ Gb/s}\) because the camera output should be compared numerically to 10 Gbps without converting bytes to bits, so the link is close enough to be practical.
    3. The aggregate raw video data rate is approximately \(18.7\text{ GB/s}\), which exceeds the \(1.25\text{ GB/s}\) uplink capacity by roughly \(15\times\).
    4. The aggregate raw stream is large, but normal compression assumptions would make it fit within the 10 Gbps uplink in practice.
  2. An autonomous drone navigates at 60 FPS (16.7 ms per-frame budget) capturing uncompressed 4K frames (~24.9 MB per frame). The drone connects via a 100 Mbps uplink to a cloud server whose round-trip latency plus inference time is 110 ms. Applying the data locality invariant, what is the feasibility of offloading this obstacle avoidance system to the cloud?

    1. Feasible, because the cloud GPU computes inference in under 10 ms.
    2. Feasible, provided 5G network slicing is enabled on the drone modem.
    3. Infeasible, solely because cloud servers do not support drone telemetry protocols.
    4. Infeasible, because transmitting a 24.9 MB frame over a 100 Mbps link requires ~2,000 ms, causing even the remote-path lower-bound estimate (~2,110 ms) to violate the 16.7 ms frame deadline by over two orders of magnitude.
  3. Why cannot high-bandwidth wireless networking technologies (such as 5G or 6G) eliminate the need for edge ML in tight real-time control loops (\(<10\text{ ms}\))?

  4. A retail store needs about 5.2 TOPS of sustained throughput. Why does the chapter’s estimate call for three 4 TOPS boards rather than two, even though two boards’ combined 8 TOPS peak exceeds the target?

  5. An illustrative 60 Hz industrial control scenario assumes each sensing-to-actuation response must finish before the next sample. Its complete ML control loop latency (\(L_{\text{lat}}\)) must therefore fit within one ____ (about 16.7 ms).

See Answers →

2.7 Mobile ML: Offline Intelligence

Carrying edge-style locality into a user’s pocket changes which budget binds. A phone must deliver responsive, private inference all day from a pocket-sized battery, inside a thin chassis with no fan to carry heat away. Mobile ML integrates machine learning directly into smartphones and tablets to meet that envelope. It fits workloads where data locality, offline operation, and immediate response matter more than computational scale, such as voice recognition, computational photography,20 health monitoring, and navigation or translation that must keep working without a network, and its battery and thermal envelope suit frequent, short-duration inference rather than sustained heavy computation.

20 Computational photography: The use of ML algorithms (for example, multi-frame fusion and neural denoising) to overcome the physical limits of small mobile camera sensors.

21 Mobile vision model reduction: MobileNet-style architectures reduce the computation in common vision layers while preserving useful accuracy for mobile tasks. The systems point here is that mobile deployment often requires changing the model family, not merely moving the same model to a phone.

On a phone, energy per inference is a primary design constraint, because a phone operates from a finite battery without active cooling, so every joule consumed directly erodes device runtime and thermal headroom. While stationary cloud and edge deployments often focus on minimizing latency \(\Time\) under continuous utility or site power, mobile systems must strictly balance total energy (\(\text{Energy} = \text{Power} \times \Time\)) under the passive thermal envelope of 3–5 W that the power wall (equation 2) imposes. In archetype terms, a compute-heavy workload such as image classification must be transformed into a more compact vision model,21 reducing FLOPs by 13.7× at a modest accuracy cost. The design accepts lower peak throughput in exchange for sustainable operation within a 3–5 W thermal envelope.

Definition 2.4: Mobile ML

Mobile machine learning is the deployment paradigm bounded by thermal design power (TDP) and battery energy.

  1. Significance: It is constrained by the few-watt heat dissipation capacity of passive cooling, requiring architectures that prioritize sustained energy efficiency over peak throughput \((\PeakRate)\).
  2. Distinction: Unlike edge ML, which may have active cooling, mobile ML must operate within a personal energy budget. Unlike TinyML, it still provides a rich OS and multi-watt compute capacity.
  3. Common pitfall: A frequent misconception is that mobile ML performance is a fixed value. In reality, it is a time-varying constraint. Performance often drops as the device hits its thermal wall, triggering thermal throttling that lowers clock frequencies and reduces the active duty cycle.

Two boundaries define the mobile envelope, and together they push the design toward on-device NPU acceleration and model compression (figure 8). The first is the battery tax, the share of the phone’s finite energy budget that an always-on ML feature spends before the rest of the system runs, because the battery limits total energy over time. Thermodynamics imposes the second boundary, which holds even for a plugged-in tablet: every watt becomes heat, and where a data center removes heat with active cooling, a thin mobile device relies on passive transfer through its chassis and surfaces. This creates the thermal wall, the power wall’s device-level form, which sets a hard ceiling on sustained power consumption independent of battery capacity.
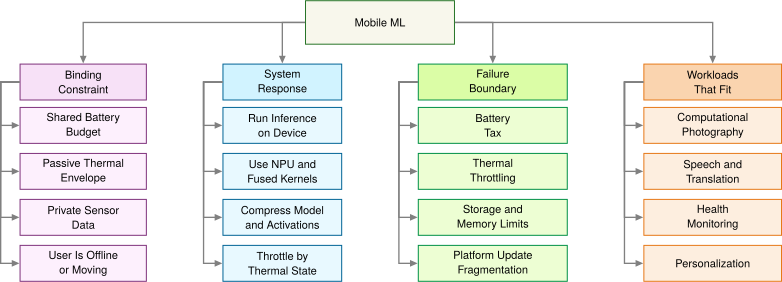
Figure 8: Mobile ML Constraint Map: On-device processing buys responsiveness, privacy, offline operation, and personalization, but the phone’s shared battery and passive thermal envelope make sustained energy efficiency the binding design constraint.

Napkin Math 2.8: The battery tax
Problem: Consider deploying a “real-time” background object detector on a smartphone. The model consumes 2 W of continuous power when active. The phone has a standard 15 Wh battery. Can the feature stay on all day? This is the battery tax that turns battery life into a mobile ML energy-budget constraint.

Physics:

  1. Ideal runtime: \(\frac{15\text{ Wh}}{2\text{ W}}\) = 7.5 hours
  2. Reality: A user expects their phone to last 24 hours. Running this single feature continuously for a day would require 320 percent of the phone’s daily energy budget.

Systems insight: The model cannot simply be “deployed.” A lighter model, duty cycling, or both must reduce the energy demand, so the feature can stay on all day.

Two horizontal throughput levels: a high burst line and, well below it, a lower sustained line after thermal throttling engages.

Sustained thermal performance falls well below burst peaks.

The distinction matters for engineering decisions. The battery tax is a budget problem, solvable in principle by reducing how often the model runs or by increasing battery capacity. The thermal wall is a physics ceiling. A larger battery cannot raise the maximum sustained wattage a passive chassis can dissipate; duty-cycle and software changes can only reduce heat generation. Sustained operation above the thermal envelope triggers hardware throttling regardless of remaining battery energy. The two constraints therefore attack different points in the iron law: the battery limits total operations per charge (\(\Operations\) integrated over time), while the thermal wall caps the instantaneous rate (\(\PeakRate \cdot \EfficiencyHw\)) the silicon can sustain.

Napkin Math 2.9: The thermal wall
Problem: An unoptimized vision model requires 12 W peak compute. Can it be deployed on a mobile device, or does it hit the thermal wall and the mobile power wall?

Scenario: A mobile system-on-chip (SoC) allows approximately 3 W for passive cooling. Assume the unoptimized model is deployed as is. A representative throttling trace for this heavier model runs in three steps:

  1. Temperature rise: At 12 W, the SoC junction temperature rises at approximately 1 °C/s.
  2. Thermal trip: Within 60 s, the hardware reaches the thermal trip point (80 °C), triggering OS throttling.
  3. Throttled throughput: The 100 FPS model suddenly drops to 30 FPS to stay within the thermal envelope.

Math: Assume that a redesign (a lighter architecture running INT8 instead of FP32 arithmetic) cuts active power by an illustrative 4×: 12 W ÷ 4 = 3 W, which lands right at the 3 W passive-cooling ceiling with no headroom to spare. The factor is a scenario input for the whole redesign. Quantization alone shrinks weight storage by that factor but does not cut power proportionally, because switching and leakage energy outside the arithmetic remain.

Systems insight: Even a 4× power reduction does not create thermal headroom; it only just reaches the sustainable limit. Optimization can bring a model down to the thermal ceiling; it cannot raise the ceiling.

Battery and heat are the two limits a mobile deployment must account for explicitly. Within them, the phone’s hardware envelope determines which models can run and how often.

2.7.1 Mobile ML benefits and resource constraints

The mobile row of table 4 gives the hardware envelope: gigabytes of RAM, neural processing units delivering tens of TOPS, and 3–5 W of sustained power on a system-on-chip22 that integrates computation and memory to minimize data-movement energy. Memory capacity constrains model footprint and memory bandwidth constrains how quickly weights and activations move, but the battery sets the budget users notice. Adding 1 W of continuous ML processing to a phone that otherwise lasts 24 hours would cut its runtime to roughly 9.2 hours–11.5 hours, depending on a battery capacity of 15 Wh–22 Wh.

22 System-on-chip (SoC): Mobile SoCs integrate CPU, GPU, and NPU cores with caches and memory controllers to reduce data-movement costs. Mobile DRAM is generally off-die, and feasible model size depends on capacity, precision, working memory, bandwidth, and latency.

23 Face ID: Apple performs facial matching within the Secure Enclave and encrypts the stored mathematical representations so that they remain available only to that subsystem and do not leave the device (Apple 2024a, 2024b). Apple reports a random false-match probability below 1 in 1,000,000 for one enrolled appearance, with higher probabilities for some populations and configurations. The example shows how local inference and hardware isolation can reduce transmission exposure while supporting low-latency authentication.

Apple. 2024a. Facial Matching Security. Apple Platform Security.
Apple. 2024b. The Secure Enclave. Apple Platform Security.

Mobile adds two gains to those every local tier shares. The first is hardware isolation for the most sensitive inputs, since on-device enclaves such as Apple’s Secure Enclave keep biometric matching inside a dedicated subsystem,23 although the strength of any privacy guarantee still depends on the complete system design and threat model. The second is personalization, because models can exploit on-device signals and user context without shipping raw data anywhere. Specialized on-device ML frameworks keep such inference within 5–50 ms user-interface response times.

The cost shows up in engineering effort as well as joules. Peak NPU throughput can substantially exceed what the device sustains under prolonged load, device heterogeneity requires multiple model variants, development multiplies across platforms, and app-store review and staged release slow iteration compared with a service its operator controls entirely.

2.7.2 Personal assistant and media processing

Several short ML pipelines on one phone must share the same battery and thermal budget, and computational photography shows that constraint most sharply. Modern flagships process each photo through multiple ML stages: portrait mode uses depth estimation and segmentation, night mode aligns multiple frames with ML-based denoising, and HDR merging, super-resolution, and scene optimization run in sequence. The binding constraint falls on the pipeline rather than on any individual model, because these models must share a 3–5 W power budget and complete within the user’s perceived shutter delay, which requires careful scheduling across CPU, GPU, and NPU to avoid thermal throttling.

Voice-driven interactions are bound by the energy of always-on listening, so they partition work across the same SoC by power tier. Wake-word detection runs continuously on a dedicated low-power core, while speech recognition and keyboard prediction wake the higher-power neural processing tiers only when needed.

Health monitoring and augmented reality push mobile ML to its sustained-performance limits. Wearables like Apple Watch process ECG and accelerometer data on-device to reduce the radio energy of transmission, while AR frameworks must fit simultaneous localization, hand tracking, and scene understanding into a 16.7 ms frame budget at 60 FPS without exceeding the sustained thermal envelope. These applications represent the ceiling of what battery-powered, passively-cooled devices can sustain, and they define the boundary beyond which mobile optimization alone is insufficient.

A common pitfall is deploying desktop-trained models directly to mobile or edge devices without architecture modifications. A desktop ResNet-50 pipeline may require gigabytes once activations, batches, preprocessing buffers, and runtime overhead are included, even though the FP32 weights alone are about 102.4 MB. Those weights fit in the 512 MB of RAM on a representative low-end edge target, but at 8.2 GFLOP per inference its 1 GFLOP/s processor takes seconds per inference, a latency failure rather than a capacity one. Desktop-optimized models may also use operations unsupported by mobile hardware, assume numerical formats unavailable on embedded systems, or require batch processing incompatible with single-sample inference. Successful deployment demands architecture-aware design from the beginning, so model families, arithmetic formats, and implementation choices must all match the target device.

↪ The framework that organizes pruning, distillation, and quantization to fit edge memory budgets is developed in Fitting the Deployment Budget.

Mobile ML shows that useful intelligence fits within a 3–5 W thermal envelope on battery power. A smartphone still costs hundreds of dollars, carries gigabytes of memory, and needs a daily recharge, and no amount of mobile optimization closes the roughly 10,000-fold memory gap to a device that must cost dollars and run unattended for years. That regime needs a different class of hardware and algorithms.

Self-Check: Question
  1. How do the battery tax and the thermal wall differ as physical constraints on mobile ML systems?

    1. The battery tax is an energy budget problem bounding total operations over time (\(\int \text{Power} \cdot dt\)), whereas the thermal wall is a heat dissipation ceiling bounding instantaneous sustained power (\(\text{Power} \le 2\text{--}5\text{ W}\)) regardless of battery size.
    2. The battery tax applies only to iOS devices, while the thermal wall applies only to Android devices.
    3. The battery tax can be resolved by lowering clock frequency, but the thermal wall requires increasing the clock frequency to finish calculations faster.
    4. The battery tax represents static memory leakage in SRAM, while the thermal wall represents network transmission power in 5G modems.
  2. Why does deploying a mobile computational photography feature (such as Portrait Mode or Night Mode) present a pipeline scheduling challenge rather than a single-model optimization problem?

    1. Mobile cameras can only run one neural network per battery charge cycle.
    2. The feature executes a multi-stage pipeline (depth estimation, semantic segmentation, alignment, and HDR tone mapping) that must all complete within a perceived shutter delay while sharing a 3–5 W thermal budget across CPU, GPU, and NPU.
    3. Computational photography models cannot use quantized INT8 representations due to mathematical rounding artifacts in lens optics.
    4. Camera image signal processors (ISPs) operate asynchronously from the operating system and reject all external ML tensor inputs.
  3. Why does deploying an unoptimized desktop-trained vision model (such as an FP32 ResNet-50 pipeline) directly onto a mobile device frequently fail, even when the model’s FP32 weights (~98 MB) appear smaller than the phone’s total RAM?

  4. Running biometric matching (such as Face ID) inside a dedicated on-device Secure Enclave reduces data disclosure risks by keeping mathematical representations isolated in encrypted hardware, but it does not automatically eliminate all security or privacy risks without rigorous end-to-end system design.

  5. Order the sequence of events that occurs when an unoptimized 12 W deep learning model runs continuously on a passively cooled 3 W smartphone SoC:

  1. The device temperature rises rapidly (e.g., at ~1 °C per second) as power dissipation exceeds passive cooling capacity
  2. The unoptimized model launches at full burst performance (e.g., 100 FPS) drawing 12 W of active compute power
  3. Operating system and hardware thermal controllers engage thermal throttling, reducing clock frequencies and duty cycles
  4. The internal SoC junction temperature reaches the critical thermal trip point (e.g., 80 °C)
  5. Sustained inference throughput drops precipitously (e.g., from 100 FPS to 30 FPS) to stabilize power within the 3 W TDP envelope

See Answers →

2.8 TinyML: Ubiquitous Sensing

Instrumenting every pallet in a warehouse, every cable on a suspension bridge, or every beehive in an apiary means putting “eyes and ears” on tens of thousands to millions of physical objects. At that count, each device must cost dollars rather than hundreds of dollars and measure millimeters rather than centimeters. Smartphones are far too expensive and too large for the role; ubiquitous sensing at this scale requires unit costs under ten dollars.

TinyML completes the deployment spectrum with low-cost, low-power ML on deeply constrained embedded devices (Warden and Situnayake 2020; Janapa Reddi et al. 2022). Devices costing under $10 and averaging less than one milliwatt24 of power when duty-cycled make ubiquitous25 sensing economically practical at massive scale; MLPerf Tiny and MCUNet show how such constraints are evaluated and optimized in practice (Banbury et al. 2021; Lin et al. 2020). Its first feasibility screen is memory capacity, because weights must fit in flash and working state in SRAM, but once a model fits, power is the limit that shapes the design. This is the domain of the power-bound archetype, where the optimization objective shifts from maximizing throughput to minimizing energy per inference. With duty-cycled execution, a keyword spotting model consuming about 10 µJ per inference on dedicated low-power audio silicon (a general-purpose microcontroller running the same model spends orders of magnitude more) can operate for years on a coin-cell battery, trading model capacity for operational longevity. On an Arduino Nano 33 BLE Sense development board (figure 9), on-board microphone, motion, and environmental sensors share a single substrate with a low-power microcontroller executing quantized TensorFlow Lite Micro models (David et al. 2021). The board illustrates integration; its full power draw depends on the sensors, radio, and duty cycle.

Warden, Pete, and Daniel Situnayake. 2020. TinyML: Machine Learning with TensorFlow Lite on Arduino and Ultra-Low-Power Microcontrollers. O’Reilly Media.

24 The 1 mW threshold: Ambient energy harvesting can power a device indefinitely only when long-term harvested power exceeds the complete system’s average load. Available power varies across sources and environments. Solar cells the size of a thumbnail may produce ~10 mW outdoors but ~10 µW indoors, thermoelectric generators on warm pipes ~100 µW, and RF energy from nearby transmitters ~10 µW. This crossover can transform the deployment model from “battery-limited lifetime” to “deploy and forget,” but it depends on the source, environment, and workload.

25 Ubiquitous computing: Mark Weiser’s ubiquitous-computing vision imagined computation woven into everyday environments until it receded from direct attention (Weiser 1991). TinyML is one modern path toward that vision, because it brings the cost and power of an intelligent sensor low enough for mass deployment.

Weiser, Mark. 1991. “The Computer for the 21st Century.” Scientific American 265 (3): 94–104. https://doi.org/10.1038/scientificamerican0991-94.
David, Robert, Jared Duke, Advait Jain, Vijay Janapa Reddi, Nat Jeffries, Jian Li, Nick Kreeger, et al. 2021. “TensorFlow Lite Micro: Embedded Machine Learning for TinyML Systems.” Proceedings of Machine Learning and Systems 3: 800–811.
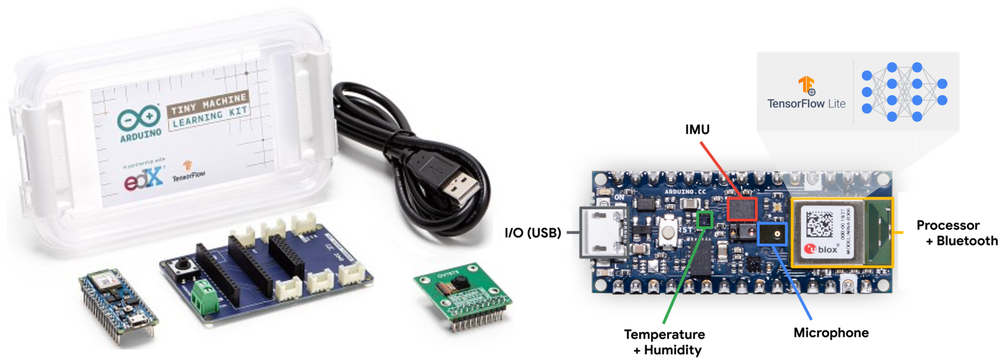
Figure 9: TinyML Hardware Scale: Microcontroller development boards integrate sensors, processing cores, and low-power radios onto a compact substrate, making constrained ML applications accessible for prototyping. Finished sensing devices must budget SRAM, sensor and radio power, inference cadence, and sleep energy to achieve multi-year battery life. Source: Figure 6 in Janapa Reddi et al. (2022), licensed under CC BY 4.0.

TinyML runs on microcontrollers (MCUs),26 which omit the power-hungry infrastructure of conventional computing. Mobile and edge processors rely on external dynamic RAM (DRAM), high-speed memory buses, and operating system runtimes that draw milliwatts just to keep DRAM in self-refresh and hundreds of milliwatts once the memory bus is active. Many microcontrollers integrate the processor core, non-volatile flash, and static RAM (SRAM) onto a single silicon die, reducing reliance on external memory buses (Banbury et al. 2021; Lin et al. 2020; Janapa Reddi et al. 2022). Eliminating off-chip signaling lets duty-cycled average power fall below a milliwatt and sleep power reach microwatts, although active inference on boards such as the ESP32-S3 still draws tens to hundreds of milliwatts. Some targets, including ESP32-S3 variants, instead attach external flash or additional RAM. On-chip integration still imposes a strict internal-memory ceiling. On-chip SRAM is physically constrained by silicon die area: because each SRAM cell requires six transistors (\(6\text{T}\)), expanding capacity directly inflates manufacturing cost. A TinyML model must therefore execute within tens to hundreds of kilobytes of SRAM, with no virtual memory, paging, or swap space to cushion an overflow. The small keyword-spotting task and low-power hardware place it at the bottom of figure 7; duty cycle also determines its average power.27 Multi-year coin-cell operation additionally requires the complete device load to fit the battery budget.28 Fitting the entire inference pipeline, from sensor acquisition to classification output, into this kilobyte-scale memory footprint defines the TinyML operating regime.

26 Microcontroller (MCU): A single-chip computer whose design prioritizes minimal cost and power over performance. Memory fit therefore becomes a deployment prerequisite, because the memory actually available to the target is often orders of magnitude less than a smartphone provides.

Banbury, Colby, Vijay Janapa Reddi, Peter Torelli, Jeremy Holleman, Nat Jeffries, Csaba Kiraly, Pietro Montino, et al. 2021. “MLPerf Tiny Benchmark.” arXiv Preprint.
Lin, Ji, Wei-Ming Chen, Yujun Lin, John Cohn, Chuang Gan, and Song Han. 2020. “MCUNet: Tiny Deep Learning on IoT Devices.” In Advances in Neural Information Processing Systems 33: Annual Conference on Neural Information Processing Systems 2020, NeurIPS 2020, December 6-12, 2020, Virtual, edited by Hugo Larochelle, Marc’Aurelio Ranzato, Raia Hadsell, Maria-Florina Balcan, and Hsuan-Tien Lin. Curran Associates.
Janapa Reddi, Vijay, Brian Plancher, Susan Kennedy, Laurence Moroney, Pete Warden, Lara Suzuki, Anant Agarwal, et al. 2022. “Widening Access to Applied Machine Learning with TinyML.” Harvard Data Science Review 4 (1). https://doi.org/10.1162/99608f92.762d171a.

27 TinyML energy gap: The figure compares different tasks on different hardware and with different energy accounting boundaries; its ratios do not identify the effect of hardware integration alone. A batch-1 ResNet-50 inference on a cloud accelerator consumes about 75.5 mJ of accelerator energy, while an always-on keyword spotter uses about 10 µJ, a gap of ~7,500×. A cloud LLM query at about 1 kJ widens the gap to 100,000,000×, the span plotted in figure 7.

28 Coin-cell deployment: A CR2032 battery (225 mAh at 3 V, ~675 mWh) ideally powers a complete 10–50 µW system for about 1.5–7.7 years. This “deploy-and-forget” operating model drives innovation in intermittent computing, where the device sleeps between inferences to stretch the energy budget across years of unattended operation.

Definition 2.5: TinyML

TinyML is the machine learning domain of always-on sensing constrained by kilobyte-scale memory and milliwatt-scale power.

  1. Significance: It requires models whose weights and code fit in flash while activations and runtime state fit in on-chip SRAM, enabling continuous inference on milliwatt power budgets.
  2. Distinction: Unlike mobile ML, which uses multi-watt processors and a full OS, TinyML runs on microcontrollers using bare-metal firmware or a real-time operating system.
  3. Common pitfall: A frequent misconception is that TinyML is just “small models.” In reality, it is a power-bound regime, and the primary metric is energy per inference (microjoules), not just the parameter count.

This definition reframes the iron law of ML systems. In terms of equation 5, TinyML imposes a physical memory-capacity precondition that execution time does not capture: the weight footprint \(\WeightMemory\) and activation footprint \(\ActivationMemory\) must stay within memory capacity \(\DeviceMemoryCapacity\). When total memory is measured in kilobytes, model structure and runtime allocation determine feasibility before latency optimization begins, and every avoidable data movement spends part of the energy budget. The objective therefore shifts from raw throughput toward energy per inference and memory fit.

The same four-branch map applies at the bottom of the spectrum (figure 10). Milliwatt budgets and kilobyte memories favor low-precision execution and duty-cycled sleep, and they move the failure boundary away from latency toward compression-driven accuracy loss and risky firmware updates.
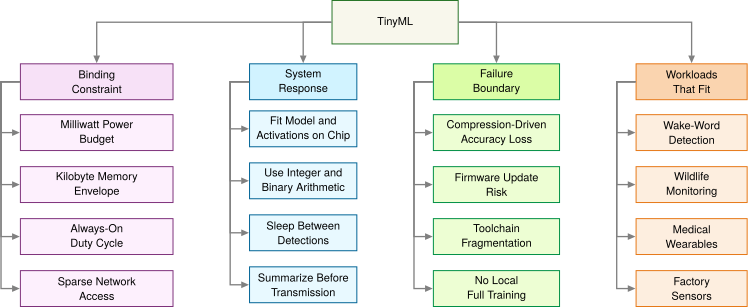
Figure 10: TinyML Constraint Map: Milliwatt power and kilobyte memory make always-on sensing economically possible, but those same limits force the model, activations, runtime, and update path to fit a radically smaller engineering envelope.

2.8.1 TinyML advantages and operational trade-offs

TinyML devices range from palm-sized developer kits to millimeter-scale chips,29 and their kilobyte memories and milliwatt budgets allow months or years of autonomous operation. The models are usually trained elsewhere,30 and the devices demand specialized algorithms, aggressive model compression, and careful systems co-design. TinyML also changes deployment economics: removing the radio uplink and the application processor lets per-node unit cost fall to single-digit dollars, which makes dense instrumentation across thousands of physical assets financially viable, and microjoule inference budgets allow multi-year operation on inexpensive coin-cell batteries or on harvested ambient energy.

29 TinyML device range: This physical range reflects a direct trade-off between deployment context and computational capability. Millimeter-scale systems prioritize minimal power for single-function, long-duration tasks, whereas palm-sized boards offer more sensing, interfaces, and debugging support at higher cost and power. Development-board size and power therefore should not be treated as limits for a finished TinyML product.

30 On-device training constraints: Updating a model requires working memory beyond that needed to apply it, including information retained from the prediction computation to determine parameter changes. Intermediate results can be discarded only after their final use, which often occurs later during training than during inference. With only 256 KB–2 MB RAM, many microcontrollers cannot hold the full training state; specialized methods reduce that state by limiting which parameters change. TinyTL, for example, freezes the weights and updates mainly the biases, so most intermediate activations need not be retained for the update (Cai et al. 2020). Training elsewhere and delivering an updated model is therefore a common design, although constrained local adaptation remains possible.

Cai, Han, Chuang Gan, Ligeng Zhu, and Song Han. 2020. “TinyTL: Reduce Activations, Not Trainable Parameters for Efficient on-Device Learning.” Advances in Neural Information Processing Systems 33: 11285–97.

The trade-offs are just as distinctive. Microcontrollers commonly provide \(10^5\) to \(10^6\) bytes of RAM and enforce a strict two-tier memory partition, in which static model weights and compiled code reside in non-volatile flash (often a few megabytes), while mutable activations and the runtime buffer (the tensor arena, a fixed block of SRAM reserved for them) must fit within the much smaller on-chip SRAM (a few hundred kilobytes at most, such as the ESP32-S3’s 512 KB, and as little as tens of kilobytes on the smallest parts). As a result, peak intermediate activation volume, rather than static parameter storage, is frequently the barrier that prevents a model from executing. The smart doorbell’s level-1 check (figure 3) shows why that check is only a first screen: its weights fill just 11.9 percent of flash, a figure that says nothing about whether its intermediate results fit in SRAM. Embedded development also demands cross-stack co-design: engineers manage memory pools by hand, debug bare-metal firmware without operating-system abstractions, and optimize operator kernels directly for constrained instruction sets.

These bounds also create lifecycle and reliability challenges. An energy-harvesting device can satisfy its long-term average power budget yet fail when stored energy is exhausted before the next harvest. Its duty cycle must therefore respect both energy per inference and the timing of available power. Model quality can also suffer from aggressive quantization and pruning: converting 32-bit floating-point weights to 8-bit integers (INT8) saves memory but can degrade accuracy and robustness on out-of-distribution sensor inputs. Post-deployment flexibility is also sharply constrained: models are often packaged with firmware, so field updates must account for limited storage, interrupted transfers, and safe rollback. Ecosystem fragmentation31 across microcontroller vendors and ML frameworks creates additional overhead and portability challenges.

31 TinyML ecosystem fragmentation: TinyML spans microcontroller families such as Arm Cortex-M, RISC-V, and Xtensa, each with different instruction sets, memory layouts, kernels, and vendor toolchains; cloud and mobile stacks also vary, but their runtimes usually hide more of this hardware diversity. A model optimized for one microcontroller target may therefore require retuning and revalidation for another, multiplying the engineering cost of multi-device deployment.

2.8.2 Environmental and health monitoring

The TinyML regime becomes essential when power budgets, unit economics, and physical isolation rule out every higher tier. Wake-word detection is the most familiar case. Its binding constraint is average power, so the always-on detector acts as a power gate that wakes the costlier processors only when a wake phrase is heard.32 Precision agriculture is bound instead by sparse, expensive connectivity across large fields. FarmBeats used sensors, cameras, drones, and local gateway processing to reduce raw data movement where connectivity was costly (Vasisht et al. 2017), and TinyML pushes that logic down to sensing nodes that must run under milliwatt budgets.

32 Always-on wake-word detection: A small model that listens continuously for the acoustic signature of a wake phrase. The acceptable detector budget depends on the platform, but spending even a few extra milliwatts continuously can materially shorten battery life, and the architecture succeeds only when the always-on path consumes far less average power than the components it prevents from waking.

Vasisht, Deepak, Zerina Kapetanovic, Jongho Won, Xinxin Jin, Ranveer Chandra, Sudipta N. Sinha, Ashish Kapoor, Madhusudhan Sudarshan, and Sean Stratman. 2017. “FarmBeats: An IoT Platform for Data-Driven Agriculture.” 14th USENIX Symposium on Networked Systems Design and Implementation (NSDI 17), 515–29.

Wildlife conservation shows the uplink arithmetic in an illustrative case. Solar-powered acoustic sensors identify species on-device and transmit periodic detection summaries rather than raw audio, cutting uplink data from 4.3 GB/day to 400 KB/day, a 10,750× reduction that conserves power in off-grid deployments. Medical wearables apply the same logic to physiological monitoring, where runtime remains bounded by sensor draw, radio power, duty cycle, and sleep energy rather than by the model alone.

All four paradigms sit on one continuum bounded by the speed of light, heat dissipation, and memory signaling, and a real feature usually presses against several of those bounds at once. Choosing among the paradigms therefore means mapping an application’s constraints against all of them together.

Self-Check: Question
  1. Comparing a dedicated TinyML keyword spotting model (~\(10\ \mu\text{J}\) per inference) to a cloud foundation model query (~\(1\text{ kJ}\) per inference), by approximately what factor does energy consumption per inference differ?

    1. Approximately \(100\times\) (2 orders of magnitude)
    2. Approximately \(10{,}000\times\) (4 orders of magnitude)
    3. Approximately \(100{,}000{,}000\times\) (\(10^8\), 8 orders of magnitude)
    4. Approximately \(10^{14}\times\) (14 orders of magnitude)
  2. Why are microcontroller TinyML devices predominantly restricted to inference-only execution rather than full in-situ backpropagation training?

    1. Microcontrollers use flash memory which permanently locks all transistor gates against state changes.
    2. Backpropagation requires double-precision FP64 floating-point arithmetic which is mathematically impossible on 32-bit cores.
    3. The speed of light inside microcontroller silicon is too slow to support backward gradient propagation.
    4. Conventional training retains intermediate results needed for gradient calculations and adds gradient and optimizer state, which can exceed a microcontroller’s working-memory budget.
  3. Why is the 1 mW average power threshold considered a transformative milestone in TinyML system deployment?

  4. Why is it a fallacy to treat TinyML as merely ‘scaled-down mobile ML’ that can be addressed simply by applying standard INT8 post-training quantization?

  5. The power management paradigm in which a battery-less or energy-harvesting microcontroller sleeps in ultra-low-power states and wakes periodically to perform inference before energy reserves deplete is called ____ computing.

See Answers →

2.9 Choosing a Deployment Paradigm

An architect choosing where to run an ML feature rarely optimizes one dimension. A privacy rule may forbid cloud processing, a latency budget may forbid remote inference, a memory footprint may exceed the mobile device, and a cost target may rule out always-on edge hardware. Cloud, edge, mobile, and TinyML are operating envelopes for those conflicts, so selecting among them requires a unified comparison framework and a structured decision process.

2.9.1 Weighing operational trade-offs across tiers

A model that fits comfortably inside a tier’s latency, power, and memory budgets can still fail in production if the team cannot ship updates to it, if a dropped internet link halts the service, or if monthly cloud bills outrun the product’s revenue. Choosing a deployment tier requires weighing latency-vs-throughput paradigm trade-offs across physical and operational budgets at once. The resource envelopes are already on the table: table 1 gives each paradigm’s latency, power, and memory regime, and table 4 grounds them in concrete platforms. What those tables leave out are the operational dimensions that decide many real deployments: how the system scales, what it exposes, whether it needs a network, what it costs, and how hard it is to build and ship. Table 9 contrasts the four paradigms along those eight dimensions.

Table 9: Operational Paradigm Comparison: Eight operational dimensions complement the resource envelopes of table 1 and table 4. Cloud ML scales most easily, while local processing can reduce transmission and centralized-storage exposure without itself guaranteeing privacy; local tiers can operate without a WAN, but real-time response depends on workload and complete-path timing, while development complexity is highest at the two ends of the spectrum. Cost anchors mix recurring service bills with device purchase prices; they are partial illustrations, not a matched lifecycle-cost ranking.
Aspect Cloud ML Edge ML Mobile ML TinyML
Scalability High (provider capacity limits) Good (limited by edge hardware) Moderate (per-device scaling) Limited (fixed hardware)
Data Exposure Remote processing expands the surface Local processing reduces transmission On-device processing reduces transmission Raw data can remain local
Connectivity Required Required for remote requests Intermittent Optional None
Offline Capability None Good Excellent Complete
Real-time Processing Network and execution must fit deadline Local execution must fit deadline Deadline and sustained-power limits Deadline and memory-capacity limits
Cost anchor Service bill ($1000s+/month) Hardware purchase ($100s–$1,000s per device) Device purchase ($200–$1000+; often user-owned) Hardware purchase ($1–$10 per device)
Development Complexity High (cloud expertise needed) Moderate-High (edge+networking) Moderate (mobile SDKs) High (embedded expertise)
Deployment Speed Fast Moderate Fast Slow

Remote processing widens the network attack surface and requires transport encryption and strict isolation between tenants; local processing keeps raw data on the device, reducing network exposure without eliminating the risk of physical tampering. The workload archetypes from section 2.3 map directly to these boundaries, with each archetype gravitating toward paradigms that relieve its primary bottleneck. Each paradigm also shifts engineering complexity to a different subsystem: cloud deployments demand expertise in multi-tenant networking and dynamic cost governance, whereas edge and TinyML deployments trade those cloud concerns for local thermal and memory limits along with distributed updates and site maintenance. Mobile deployments sit between the two, operating on user-owned hardware that avoids infrastructure purchase costs at the price of platform-specific drivers, operating-system background task limits, and shared energy budgets, so none of the four categories supplies a workload-independent latency or energy ranking.

A common architectural failure is selecting a deployment target based on model accuracy alone while treating hardware constraints as downstream optimization details. An unquantized model that delivers 99 percent accuracy in an offline evaluation becomes unviable if its memory footprint triggers paging on mobile hardware, or if continuous inference drives thermal throttling within seconds. Physical invariants (memory capacity, thermal dissipation limits, and network transit delay) must serve as early screening criteria before model development begins, pruning invalid deployment targets before training resources are expended.

2.9.2 Four screening gates for choosing a tier

Before asking whether a workload belongs in the cloud or on a microcontroller, an engineer should ask a simpler question: does this problem need machine learning at all? Deep neural networks carry a heavy maintenance burden that deterministic code avoids, and a fifty-line heuristic rule set can often solve the problem at a tiny fraction of the operating cost.

Systems Perspective 2.3: The complexity tax
Consider a classification task solvable either by deterministic heuristic rules or by a deep learning pipeline. The heuristic requires fifty lines of code, incurs near-zero compute cost, demands approximately one hour per month to update rules, and fails in ways engineers can read in the code. The ML system may require only fifty lines of model definition, but, as Sculley et al. (2015) observed of production ML generally, it introduces roughly 2,000 lines of supporting infrastructure for feature ingestion, telemetry logging, drift monitoring, and GPU driver management, alongside 40 hours per month diagnosing data drift and maintaining pipelines.

An ML model that increases accuracy from 90 percent to 95 percent while multiplying operational maintenance by, say, 40\(\times\) requires an economic comparison. The accuracy and maintenance ratios alone do not establish the return; the value of the avoided errors must justify the additional engineering cost. When the ongoing maintenance cost outstrips the value of marginal statistical gains, deterministic software remains the correct systems choice.

Sculley, D., Gary Holt, Daniel Golovin, Eugene Davydov, Todd Phillips, Dietmar Ebner, Vinay Chaudhary, Michael Young, Jean-François Crespo, and Dan Dennison. 2015. “Hidden Technical Debt in Machine Learning Systems.” Advances in Neural Information Processing Systems (NeurIPS) 28: 2503–11.

↪ Framing the problem against the existing baseline, and retaining that baseline when the expected benefit does not justify the added cost, is developed in Stage 1: Problem Definition.

When this complexity tax outweighs the operational value of improved statistical predictions, the ML deployment costs the system more than it returns. Once a learned system is justified, however, paradigm selection relies on a tiered decision framework ordered by how rapidly a constraint invalidates an architecture. The screening hierarchy evaluates four successive gates: regulatory privacy, physical latency, local compute capacity, and lifecycle economics. Privacy leads the order because a legal prohibition on moving data eliminates an option before anything is measured, whereas the latency and compute gates require numbers. Each gate passes only its survivors to the next, so the screening sequence acts as successive filters on a candidate set (figure 11).
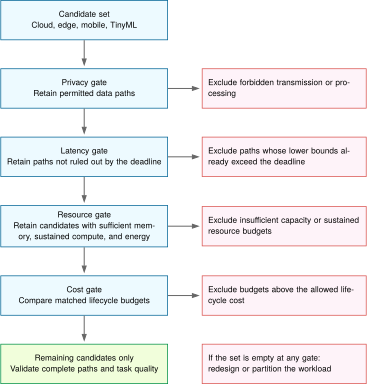
Figure 11: Deployment Decision Screening: Apply privacy, latency, resource, and cost gates to the remaining candidate set. Every gate retains upstream exclusions. An empty set requires redesign or partitioning; surviving candidates still need complete-path validation.

The flowchart carries a remaining candidate set through all four gates. If regulatory rules or data sovereignty forbid off-device transmission, remote cloud processing stays excluded when compute demand is considered. If a network round-trip lower bound exceeds the deadline, additional remote compute cannot restore that path. Cost compares only the survivors, and an empty set calls for changing the workload or partitioning it across tiers. Passing a lower-bound latency screen still requires complete-path validation. In automotive emergency braking, the latency gate binds before compute capacity or cost are even considered.

Example 2.1: Autonomous vehicle emergency braking
Scenario: An autonomous vehicle vision system performs real-time pedestrian detection for emergency braking under a strict 100 ms end-to-end latency budget.

Diagnosis: At 100 km/h, the vehicle covers 2.8 m during the 100 ms budget, so every millisecond of delay is distance traveled before braking begins. The scenario assumes 50–150 ms of network round-trip delay for cloud offload, which consumes half the budget at best and more than all of it at worst before any detection runs. Local object detection on an automotive edge accelerator takes 10–30 ms; at 10 GFLOPs per frame and 30 FPS, that accelerator must sustain 300 GFLOP/s.

Systems lesson: The stated network-delay range cannot guarantee the deadline, so the latency gate excludes that cloud path. The local candidates remain subject to the resource gate: the pedestrian detector must fit memory and sustain the stated frame rate within its power budget. An automotive edge accelerator remains a candidate under these assumptions; its complete sensing-to-braking path still needs validation. Cloud connections can support offline training and telemetry without reentering the emergency decision path.

A completed placement decision needs evidence about the surviving paths as well as grounds for rejecting the others. A factory inspection line supplies both.

Example 2.2: Completing a placement decision
Problem: A fixed factory camera requires 20 FPS inspection with a 100 ms sensing-to-decision deadline. Raw images must remain on premises. Which feasible deployment has the lowest matched lifecycle cost under the following hypothetical evidence?

Supplied evidence: A rule-based baseline fails the specified missed-defect criterion, while the learned detector meets both the missed-defect and false-alarm criteria on representative inspection data. The proposed mobile and microcontroller variants fail that same quality requirement. Local edge candidates A and B preserve the validated detector and preprocessing. Both have a complete peak working set of 2 GB within an available 4 GB, and each must stay within a 25 W sustained system-power budget.

Under the specified peak load and thermal conditions, the supplied complete-path latency bounds are 80 ms for A and 40 ms for B, including acquisition, preprocessing, queuing, inference, and the inspection decision. Their sustained rates are 25 FPS and 40 FPS, at 10 W and 20 W. Both satisfy the same availability and recovery requirements. Annualized budgets over the same service lifetime, including hardware, power, installation, maintenance, and recovery provisions, are $2,400 for A and $3,600 for B. These supplied bounds and budgets define an instructional scenario, not benchmarks of named products.

Result: Select local edge candidate A. Privacy excludes raw-image cloud offload, task quality excludes the proposed smaller variants, and both edge paths satisfy the timing, throughput, memory, and power requirements. A has the lower matched cost. B’s faster response supplies no required benefit under this specification; a tighter deadline could change the choice.

Systems lesson: The final choice follows from task quality and complete-path evidence, not the tier label or peak compute rate. The decision remains valid within the supplied operating conditions; changes to the input stream, detector, load, or thermal environment require reevaluating the relevant gates.

The completed comparison depends on operational maintainability as well as execution performance. Its matched budgets include obligations that a hardware-only comparison would omit. Deploying a model across thousands of edge nodes or millions of microcontrollers introduces sustained lifecycle overhead: automated firmware updates, out-of-band telemetry, distributed drift monitoring, and hardware failure recovery. An organization equipped for cloud operations may lack the embedded toolchains and physical testing infrastructure required to support edge or TinyML targets at scale.

Checkpoint 2.2: System design

First justify the learned system against simpler baselines; then screen its deployment candidates against the physical and operational constraints.

Decision gates

The decision framework screens candidate tiers for physical feasibility and then compares their operational costs. If no single tier meets the requirements of the whole pipeline, the next question is which stages can run separately, and what must cross the boundaries between them.

Self-Check: Question
  1. In the four-layer deployment screening decision framework, why is the Privacy layer evaluated first, followed by Latency, Compute Demand, and Cost?

    1. The layers are ordered by how rapidly a hard constraint can completely invalidate an architecture: legal/privacy rules may forbid remote transmission entirely, physical latency limits can make cloud offload impossible, compute demands eliminate undersized devices, and cost compares the remaining feasible survivors.
    2. Privacy is the easiest parameter to optimize in software using compiler flags, whereas cost cannot be calculated until after deployment.
    3. Cloud providers require privacy agreements before allowing access to GPU instances.
    4. The framework is ordered purely alphabetically based on traditional software engineering conventions.
  2. An autonomous vehicle travels at 100 km/h (~27.8 m/s). An emergency pedestrian detection system evaluates two architectures: (1) an automotive Edge ML accelerator with a 15 ms local detection latency, and (2) a Cloud ML server with 115 ms total latency (100 ms network RTT + 15 ms compute). How much additional distance does the vehicle travel before braking begins if the cloud architecture is used?

    1. 0.28 meters
    2. Approximately 2.8 meters
    3. Approximately 28 meters
    4. Exactly 100 meters
  3. What is the complexity tax in ML systems engineering, and when is a simple heuristic (e.g., rule-based logic or regular expressions) superior to a deep learning pipeline?

  4. In ML systems engineering, selecting a deployment paradigm based solely on benchmark model accuracy is a sound practice because hardware infrastructure can always be scaled to meet application constraints later.

  5. What is the Total Cost of Ownership (TCO) calculation, and why must ML architects evaluate TCO rather than hardware purchase price or cloud VM hourly rates alone when selecting a deployment paradigm?

See Answers →

2.10 Hybrid Architectures

A voice interface can use a microcontroller to listen continuously for a wake word, a phone to transcribe speech, and cloud servers to interpret requests that need a larger model. Each stage has a different task and resource budget. Sending every audio sample to the cloud would add communication and radio costs; asking the microcontroller to perform every stage would exceed its compute and memory capacity. Hybrid architectures divide the pipeline across tiers so that each stage meets its requirements (Kang et al. 2017). Economics drive this division as much as latency: processing voice interactions for billions of devices entirely in the cloud runs into both an economic and an infrastructure ceiling, and the voice assistant wall puts a number on each.

Kang, Yiping, Johann Hauswald, Cao Gao, Austin Rovinski, Trevor Mudge, Jason Mars, and Lingjia Tang. 2017. “Neurosurgeon.” International Conference on Architectural Support for Programming Languages and Operating Systems (ASPLOS), 615–29. https://doi.org/10.1145/3037697.3037698.

Napkin Math 2.10: The voice assistant wall
Problem: In this illustrative capacity scenario, 1B voice assistant devices (smartphones, smart speakers, earbuds) each issue 20 queries/day after the wake word. Detecting the wake word itself in the cloud would require every microphone to stream audio continuously. What load would cloud-side detection impose, and what load remains in the cloud once detection moves on device?

Cloud-side detection: The always-listening path that local detection removes.

  • Audio streaming: Every device streams audio continuously (16 kHz, 16-bit), about 32 KB/s each. Across 1 billion devices the aggregate is 32 TB/s, and each stream would also need its own continuously running detector.
  • Cloud cost: ~$0.50/device/year → 1B devices = $500,000,000/year. Economically prohibitive under these assumptions for a free feature.
  • TinyML alternative: 0.1–1 mW local wake-word detection, <$0.01/device/year. If each post-wake query uploads about 5 s of audio, local detection cuts the audio leaving each device by about 860×.

Residual cloud load: The post-wake queries the hybrid design still serves in the cloud. Even with local wake-word filtering, the residual query volume (1 billion devices generating 20B queries/day at ~200 ms per query) still requires substantial centralized accelerator capacity (~1.1 million GPU-hours per day).

Five parameters determine the required cluster capacity:

  1. Query volume: 1 billion devices \(\times\) 20 queries/day = 20B queries/day.
  2. GPU demand: Each query requires ~200 ms of GPU time. Total: 1.1 million GPU-hours/day.
  3. Scenario capacity: A data-center equivalent provisioned with 10,000 GPUs provides 240,000 GPU-hours/day.
  4. Average requirement: ~4.6 dedicated data centers just for voice inference.
  5. Peak reality: Queries cluster in waking hours (~4.5× peak-to-average), requiring ~20.8 data centers at peak.

Systems insight: Local detection reduces each device’s upload to its post-wake queries, 20 queries/day of a few seconds each. The residual post-wake load is still large, tens of data centers at peak, but it is bounded by what users actually ask, and it is the load the hybrid design deliberately keeps in the cloud to use a larger language model than the local device can support.

Partitioning the voice pipeline into an on-device wake-word filter and a cloud-based language model relieves both the client’s energy limit and the data center’s capacity limit. The division also creates engineering work: deciding what data crosses each boundary and keeping the participating stages consistent. Three integration patterns organize these choices.

2.10.1 Splitting work across tiers: Three integration patterns

When a single tier cannot satisfy every stage of an ML pipeline, engineers split the pipeline along one of three physical boundaries: train-serve split, hierarchical processing, or progressive deployment. Selecting a pattern is an iron-law decision: each stage of computation must execute where its binding term (throughput capacity \(\PeakRate\), local latency floor \(\Latency\), or the memory-capacity precondition) incurs the lowest system penalty.

Under a train-serve split, training executes in centralized data centers while inference runs locally on edge, mobile, or embedded devices. Training must retain intermediate results and information used to calculate and apply parameter updates, in addition to the model weights. Under common 16-bit mixed-precision training with a standard adaptive optimizer, the weights, their gradients, and the optimizer’s running statistics together occupy about 16 bytes per parameter (Rajbhandari et al. 2020), roughly 8\(\times\) the 2 bytes per parameter that 16-bit inference weights need, before any batch activations are counted (Memory management develops this accounting). Inference uses the trained weights to compute predictions, sometimes through repeated passes as in token-by-token generation, and must satisfy local latency and privacy constraints. Amortization underpins the economics of this split: the high fixed cost of training is distributed across millions of forward-pass queries served locally without recurring network transmission costs.33

Rajbhandari, Samyam, Jeff Rasley, Olatunji Ruwase, and Yuxiong He. 2020. “ZeRO: Memory Optimizations Toward Training Trillion Parameter Models.” SC20: International Conference for High Performance Computing, Networking, Storage and Analysis, 1–16. https://doi.org/10.1109/sc41405.2020.00024.

33 Train-serve cost asymmetry: Training usually requires many forward and backward passes, whereas one inference request uses a trained artifact for one or more forward passes. Training is not literally one-time because models may be retrained, and inference cost varies sharply with model size, sequence length, batching, and service overhead. The economic rationale for the split is amortization: repeated use can spread each training cycle’s fixed cost across many served predictions.

Definition 2.6: Hybrid ML

Hybrid machine learning is the deployment strategy that distributes an ML pipeline across two or more deployment tiers, assigning each stage according to its latency, compute, data, and operational constraints.

  1. Significance: Hybrid architectures exploit the iron law’s additive structure: the edge tier can reduce \(\Latency\) for time-sensitive preprocessing and inference, while the cloud tier can provide the \(\PeakRate\) needed for training, retraining, and heavy batch inference. The split follows the data locality invariant: compare each stage’s complete local and remote paths, reject paths that miss the service deadline, and then choose among the feasible alternatives.
  2. Distinction: Unlike cloud-only deployment (which accepts the distance penalty for all stages) or edge-only deployment (which accepts limited \(\PeakRate\) for all stages), hybrid ML assigns each pipeline stage to the tier where its binding iron law term is minimized.
  3. Common pitfall: A frequent misconception is that hybrid ML is just “running two models.” In reality, the participating tiers must share synchronized state (feature definitions, model versions, and preprocessing logic) so that their paths produce consistent results. Without this synchronization, training-serving skew emerges at tier boundaries.

Under hierarchical processing, computation cascades across tiers to filter and summarize data step by step, matching communication volume to available link bandwidth. Raw sensor streams from cameras or microphones at the edge of the network often exceed wide-area network (WAN) uplink capacity; continuously streaming uncompressed telemetry to a data center saturates network links and wastes radio power. To prevent network saturation, early tiers filter data locally: TinyML microcontrollers run low-power anomaly detectors, edge gateways aggregate and correlate temporal features across multiple sensors, and cloud clusters ingest only anomalous events or aggregated summaries for global analytics. During inference serving, hierarchical processing frequently takes the form of a confidence cascade (Teerapittayanon et al. 2017). A compact, low-latency model on the local device evaluates the input first. If its prediction confidence exceeds a calibrated confidence threshold, the device returns the result immediately, bypassing the network entirely. Only ambiguous or low-confidence inputs trigger a WAN payload transfer to a larger cloud model. The cascade seeks lower median latency at the required task quality, but confident local errors can bypass escalation. Representative evaluation must establish the routed system’s accuracy, error costs, and escalation frequency before accepting that trade-off.

Teerapittayanon, Surat, Bradley McDanel, and Hsiang-Tsung Kung. 2017. “Distributed Deep Neural Networks over the Cloud, the Edge and End Devices.” IEEE International Conference on Distributed Computing Systems (ICDCS), 328–39. https://doi.org/10.1109/ICDCS.2017.226.

Under progressive deployment, an engineering team derives a family of specialized model variants from a unified architecture or training corpus, tailoring each variant to the memory capacity, arithmetic intensity, and thermal limits of a specific tier. Rather than forcing a single model onto every device, developers produce tier-specific artifacts and evaluate the quality lost or retained as resource demands fall. The compression mechanisms are developed later; the placement decision here depends on whether each artifact meets its task and hardware constraints. For a shared image-classification task, an edge server and a phone can use different members of a model family, each evaluated against the same task requirements and its own resource budget. A voice interface that divides wake-word detection, acoustic processing, and language understanding among tiers illustrates hierarchical processing across different tasks, and it can also use tier-specific variants within a task.

With three integration patterns available, selection becomes a constraint-matching problem: choose the pattern whose trade-off profile matches the system’s dominant bottleneck, weighing the conditions that favor each pattern against those that disqualify it (table 10).

Table 10: Hybrid Pattern Selection Guide: Each of the three hybrid integration patterns has a characteristic trade-off, favoring conditions, and disqualifying conditions. Selection matches the pattern’s trade-off profile to the system’s dominant bottleneck.
Pattern Trade-off Choose when Avoid when
Train-Serve Split Training cost vs. inference latency Training requires more resources than inference; training data may leave the serving device Local adaptation cannot wait for remote training and model delivery
Hierarchical Processing Local autonomy vs. global optimization Data volume exceeds transmission capacity; decisions needed at multiple timescales All processing can occur at one tier; network is reliable and fast
Progressive Deployment Model quality vs. deployment reach Same model needed at multiple capability levels; graceful degradation required Model cannot be meaningfully compressed; single deployment target

Production deployments rarely implement these patterns in isolation; complex systems compose them across different phases of the pipeline. An autonomous vehicle, for example, combines progressive deployment to fit specialized vision backbones into its on-board compute envelope, hierarchical processing to arbitrate between immediate millisecond-scale emergency braking on local hardware and multi-second trajectory planning, and a train-serve split that uploads anomalous driving slices to cloud clusters for fleet-level retraining. Privacy-preserving distributed training approaches extend this composition further when raw training data cannot leave client devices for regulatory or privacy reasons. In federated learning (McMahan et al. 2017), for example, each device trains on its own data and sends only model updates to the cloud for aggregation.

McMahan, Brendan, Eider Moore, Daniel Ramage, Seth Hampson, and Blaise Agüera y Arcas. 2017. “Communication-Efficient Learning of Deep Networks from Decentralized Data.” International Conference on Artificial Intelligence and Statistics (AISTATS), Proceedings of machine learning research, vol. 54: 1273–82.

2.10.2 How hybrid tiers communicate in production

If a phone’s audio preprocessor updates its normalization constants while the cloud transcription model expects the old scaling, or if a smartwatch and phone disagree on which activity labels are active, the hybrid pipeline fails silently across the tier boundary. Keeping multiple execution tiers working as one system requires explicit communication pathways. Five interaction channels connect the tiers (figure 12): compiled model artifacts deploy downward from cloud training clusters to edge, mobile, and TinyML inference engines, while raw sensor streams and filtered telemetry propagate upward toward cloud analytics, complemented by peer-to-peer result forwarding, local assist handoffs, and state synchronization that keeps feature definitions and model versions consistent across tiers.
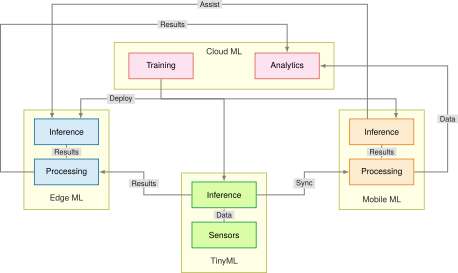
Figure 12: Hybrid System Interactions: Data flows upward from sensors through processing layers to cloud analytics, while trained models deploy downward to edge, mobile, and TinyML inference points. Five connection types (deploy, data, results, assist, and sync) establish a distributed architecture where each paradigm contributes unique capabilities.

Production systems place each tier boundary at a distinct physical bottleneck:

  1. Industrial defect detection: Assembly lines running at high cycle rates require sub-10 ms deterministic visual inspection. Streaming high-resolution camera frames over WAN to a data center violates inspection deadlines and exhausts factory uplink bandwidth. The system deploys a train-serve split: centralized cloud infrastructure trains high-capacity vision models on historical defect databases, then compiles and quantizes runtime weights for factory-floor edge servers and embedded smart cameras, which run inference locally without external network dependencies. The complete local pipeline, including frame acquisition, preprocessing, and inference, must still be validated under the expected load.
  2. Agricultural monitoring: Deployed across hundreds of hectares, remote soil probes run on coin-cell batteries or small solar harvesters and communicate over low-power wide-area radios such as LoRa, which carry little data and spend much energy per bit. Streaming continuous moisture and temperature telemetry would exhaust battery reserves within days. Hierarchical processing therefore keeps high-frequency sampling and basic anomaly detection on TinyML microcontrollers in sub-milliwatt power budgets, while local edge gateways aggregate measurements across clusters of probes and send only compressed, field-level summaries over cellular backhaul to cloud servers that schedule irrigation farm-wide.
  3. Wearable fitness tracking: A battery-powered smartwatch must keep its always-on sensing path averaging under \(1\text{ mW}\) to preserve battery life. The system employs hierarchical processing: lightweight integer kernels run on an embedded microcontroller to track real-time motion and detect heart-rate thresholds; intermediate biometric data synchronizes over Bluetooth Low Energy (BLE) to a paired smartphone, which uses mobile neural engines and gigabytes of DRAM to classify complex activity patterns; finally, the smartphone transmits periodic compressed summaries over Wi-Fi or cellular networks to cloud infrastructure for longitudinal health modeling.
Checkpoint 2.3: Hybrid ML patterns

Hybrid architectures work when partitioning work across tiers, not when copying the same pipeline everywhere.

Integration patterns

Design sanity checks

Self-Check: Question
  1. Why does serving always-on voice assistant traffic entirely in the cloud create an infrastructure and economic wall, and what does on-device wake-word detection actually remove?

    1. On-device wake-word detection removes the need to stream every microphone continuously to the cloud, so the data-center-count estimate applies to the remaining post-wake queries rather than to constant listening traffic.
    2. Once wake-word detection moves on device, all cloud serving disappears because speech recognition and language understanding no longer need remote models.
    3. The main problem is only that encrypted audio cannot be processed efficiently in cloud accelerators, so local wake detection solves a hardware compatibility issue rather than a traffic-scaling issue.
    4. Wake-word detection on device matters only for privacy; it does not materially change network load because continuous listening traffic and post-wake query traffic are the same scale.
  2. A smart agriculture system deploys soil moisture sensors on microcontrollers performing local anomaly detection, local gateway edge servers that aggregate sensor feeds across crop fields to trigger automated irrigation valves, and a central cloud system that aggregates regional data for seasonal crop yield forecasting. Which hybrid ML integration pattern does this architecture exemplify?

    1. Pure Train-Serve Split
    2. Monolithic Cloud Offload
    3. Hierarchical Processing
    4. Linear Single-Node Pipelining
  3. What is the primary operational failure risk in a hybrid ML system where preprocessing and feature extraction are split between client devices (mobile/edge) and centralized cloud servers?

    1. Transistors in edge devices reverse polarity when receiving cloud RPC payloads.
    2. The speed of light in optical fiber decreases proportionally with the number of connected edge clients.
    3. Edge devices become unable to allocate floating-point registers during network handshakes.
    4. Training-serving skew, where slight discrepancies in feature extraction logic, library versions, or numerical precision between the edge client and cloud server cause silent model degradation.
  4. What is the economic rationale behind the Train-Serve Split pattern in hybrid ML architectures?

  5. Order the steps of a Progressive Deployment evaluation for a shared task across multiple tiers:

  1. Measure each candidate and accept only those that satisfy both task quality and tier constraints
  2. Establish a reference model or artifact for that task
  3. Produce tier-specific candidate artifacts for cloud, edge, mobile, or TinyML targets
  4. Define the shared task, required quality level, and each tier’s resource budgets

See Answers →

2.11 What Every Tier Shares

Although the four deployment tiers differ by orders of magnitude in available energy, memory capacity, and compute throughput, they rest on shared systems foundations. Every tier moves data through a pipeline, manages a fixed budget of compute, memory, energy, and network capacity, and binds models to hardware through a software architecture. On those three shared foundations rest the same cross-cutting concerns of efficiency, monitoring, and trustworthy engineering (figure 13).
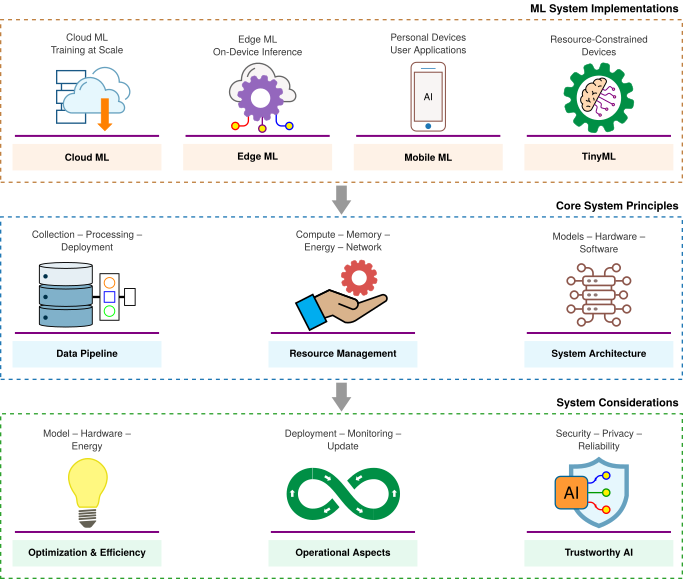
Figure 13: Convergence of ML Systems: Despite vast resource disparities across cloud, edge, mobile, and TinyML tiers, all deployments converge on three shared systems foundations: data pipelines, resource management, and hardware-software architecture. These shared pillars in turn support unified requirements for performance optimization, operational monitoring, and trustworthy engineering.

This convergence lets one set of techniques serve every tier, and every stage of a hybrid system, because optimizations that target the same physical bottlenecks transfer across hardware scales. Techniques that reduce off-chip transfers, the cost the memory wall imposes, help both an embedded microcontroller and a warehouse-scale accelerator. Lower-precision numerical representations (such as FP8, INT8, and INT4, which Numerical Precision: Changing How Values Are Stored develops) cut the bytes stored and moved on local devices and in cloud clusters alike, and they raise arithmetic throughput only where the datapath has a matching low-precision path (Precision trade-offs); prediction quality and complete memory traffic still determine the useful gain. Kernel fusion (executing a chain of operations in one pass so that intermediate results stay on chip, as The memory wall and kernel fusion explains) reduces off-chip traffic on mobile SoCs and HBM traffic during cloud autoregressive decoding. Graph partitioning, which splits a model’s computation graph into pieces assigned to different processors, divides work across the CPU, GPU, and neural processing units of a mobile SoC just as it divides work across cloud workers.

The shared systems foundation extends through data engineering, model compression, and operational lifecycles. The same vulnerabilities therefore recur at every tier, namely data distribution drift, model staleness, and telemetry degradation, and they call for uniform monitoring wherever the model runs. Of these, drift needs the closest watch, because it degrades a system whose code, weights, and hardware all execute correctly and so raises no infrastructure alarm. Accuracy falls with the divergence between training and operational data, the silent degradation that When ML Systems Fail Silently states with the degradation equation (equation 1.1), and ML Operations develops the monitoring and retraining that respond to it.

Self-Check: Question
  1. Optimization techniques such as quantization and memory traffic reduction are mutually exclusive between tiers, meaning methods developed for TinyML microcontrollers have no applicability to cloud data center serving.

See Answers →

2.12 Fallacies and Pitfalls

Most deployment misconceptions share one root. Each treats a physical envelope as a software detail that a later optimization can fix. Data movement, thermal dissipation, and hardware balance can invalidate otherwise reasonable optimization choices, and each fallacy and pitfall below records a system mismatched to its operating envelope.

Fallacy: One deployment paradigm solves all ML problems.

No single paradigm satisfies every physical constraint. Table 1 lists illustrative deployment envelopes rather than physics-only latency bounds. A real-time robotics system requiring sub-10 ms response cannot use a remote cloud path whose end-to-end network round-trip exceeds that budget, while a billion-parameter language model cannot reside within the few hundred kilobytes of SRAM on a microcontroller regardless of compression. Robust architectures frequently combine paradigms, using cloud resources for distributed training and burst capacity while executing localized inference or sensor preprocessing on client devices.

A related misconception assumes that moving computation closer to the user always reduces latency, overlooking the execution delay introduced by thermally constrained or lower-bandwidth edge processors, a trade-off exposed when end-to-end latency is separated from model execution time, as in End-to-end vs. component latency.

Pitfall: Relying on model optimization to overcome mobile power and thermal limits.

Compression techniques reduce power but cannot remove the thermal ceiling. Consider a smartphone equipped with a 15 Wh battery. A light inference workload drawing 1 W runs for \(\frac{15\text{ Wh}}{1\text{ W}}\) = 15 h, but an intensive workload drawing 5 W in this illustrative heavy-load scenario depletes that same battery in \(\frac{15\text{ Wh}}{5\text{ W}}\) = 3 h.

Sustained execution at 5 W also exceeds the approximately 3 W that a smartphone chassis can dissipate passively, so the device throttles as in notebook 2.9. Quantizing FP32 parameters to INT8 shrinks the memory footprint by an illustrative 4×, but switching energy and static leakage (the power a chip draws even while idle) do not fall in proportion, so a continuous pipeline above the thermal envelope still requires a lower duty cycle, a restructured architecture, or dedicated accelerator silicon.

Fallacy: TinyML represents scaled-down mobile ML.

The boundary between TinyML and mobile deployment changes the execution environment: much smaller working-memory and energy budgets require different scheduling and runtime choices. As section 2.8.1 establishes, microcontrollers provide \(10^5\) to \(10^6\) bytes of on-chip RAM compared to mobile platforms with 8–16 GB of LPDDR DRAM, a 10,000\(\times\) capacity disparity that dictates memory residency. Where mobile systems execute models with tens of millions of parameters, many TinyML architectures use tens or hundreds of thousands of parameters, with low-precision arithmetic and layer scheduling that holds fewer intermediate results at once. Operating power budgets show an even sharper discontinuity: mobile inference draws 3–5 W, whereas TinyML targets an average power of < 1 mW to operate within energy-harvesting envelopes. Teams that apply mobile optimization techniques directly to TinyML environments discover that quantizing a trained model from FP32 to INT8 is insufficient on the smallest microcontrollers, where total working memory must fit inside as little as 64 KB of SRAM, forcing complete algorithmic redesign.

Pitfall: Minimizing computational resources minimizes total cost.

Shaving dollars off per-inference compute in isolation often drives up operating bills and slows down shipping. As the decision framework in section 2.9.2 emphasizes, architectural selection requires evaluating TCO across the entire system lifecycle rather than raw server costs. In this scenario, a cloud inference service costing $2,000/month in compute appears expensive compared to $500/month in amortized edge hardware. However, a distributed edge fleet introduces recurring operational expenses: network engineering ($3,000/month), field hardware maintenance ($500/month), and fleet reliability engineering ($2,000/month). Together with hardware amortization, these bring the listed edge budget to $6,000/month, erasing the apparent hardware-only saving. The cloud figure includes compute alone, so the two totals do not establish a total-cost ranking; cloud operating costs and comparable service capacity remain outside this comparison. Unlike the single-server comparison in napkin math 2.3, this scenario operates a distributed fleet, where network, maintenance, and reliability labor scale with the number of sites. If a cloud-managed service reaches production in two months while custom edge infrastructure requires six, the four-month delay also carries an opportunity cost. Sound systems engineering balances compute efficiency against developer velocity, fleet manageability, and operational maintenance.
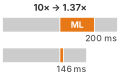
Two stacked pipeline bars, before and after a 10× model-stage speedup: the model segment shrinks sharply while the other camera-pipeline stages stay fixed, so the total drops only modestly.

A faster model stage does not linearly speed up a camera pipeline.

Fallacy: Model optimization translates linearly to system speedup.

Amdahl’s law34 caps end-to-end speedup by the share of time an optimization leaves untouched, the limit that the introduction’s fallacies already showed for preprocessing (Fallacies and Pitfalls); equation 11.1 states the bound for an accelerated path. Pipelining can overlap stages to raise steady-state throughput (section 2.3.1), but the stages of an interactive capture path run in strict serial order, so the cap applies in full. A smartphone camera spends 60 ms of its 200 ms capture path on ML scene classification, which runs between 100 ms of image signal processing and 40 ms of tone mapping and HDR merge. A 10× faster model (6 ms of classification) shortens the path only to 146 ms, an end-to-end gain of 1.37×, and even an infinitely fast model cannot exceed 1.43× while the other 70 percent of the path is unchanged. Optimizing an ML system requires profiling the full execution graph; accelerating an isolated stage yields diminishing returns once that stage ceases to be the critical-path bottleneck.

34 Amdahl’s law: Formalized by Amdahl (1967) for multiprocessor scaling, this principle applies directly to ML deployment pipelines where the model is only one stage among many. Where ML is 30 to 50 percent of runtime, even a 100\(\times\) model speedup yields only about 1.4–2× end-to-end improvement, because the rest of the pipeline is unchanged. Teams that benchmark model latency in isolation systematically overestimate deployment gains.

Amdahl, Gene M. 1967. “Validity of the Single Processor Approach to Achieving Large Scale Computing Capabilities.” Proceedings of the April 18-20, 1967, Spring Joint Computer Conference on - AFIPS ’67 (Spring), AFIPS ’67 (spring), 483–85. https://doi.org/10.1145/1465482.1465560.

Pitfall: Assuming more training data always improves deployed model performance.

Three constraints bound the returns of data scaling. First, algorithmic capacity (\(\text{A}\)) saturates: when a model’s parameter budget is fixed, additional training data cannot squeeze more patterns into a model whose layers are too small to represent them. Second, data quality (\(\text{D}\)) matters more than raw volume: mislabeled examples, uncalibrated sensors, and spurious shortcuts corrupt gradient updates, so scaling up a noisy dataset only teaches the model its errors with higher confidence. Third, the deployment tier decides which data counts as in-domain. A microcontroller’s microphone, a phone camera, and a data-center log stream capture inputs with different noise, resolution, and sampling, so a large corpus gathered under one tier’s conditions can match another tier’s inputs poorly. High-fidelity data collected under the target tier’s own sensing conditions often yields higher serving accuracy than a much larger out-of-domain corpus.

Fallacy: One model binary can serve every edge hardware target efficiently.

Teams frequently compile a single model artifact and deploy it uniformly across diverse devices, treating deployment as a packaging step rather than a hardware co-design problem. In practice, hardware-specific compilation and kernel lowering (translating each operation into code tuned for the target’s instruction set and memory layout) capture critical efficiencies that generic binaries forfeit. For example, quantized INT8 operations on a dedicated neural processing unit (NPU) achieve substantially higher throughput per watt than the identical model on a general-purpose CPU, and kernel fusion keeps intermediate activation tensors in on-chip SRAM rather than evicting them to energy-expensive off-chip DRAM. As the hardware analysis in section 2.4 establishes, hardware architectures impose divergent execution constraints: a binary compiled for a general-purpose mobile CPU does not use the specialized matrix engines of an embedded NPU. A portable model artifact can run through multiple backends, but portability alone does not establish efficiency. Production deployment requires profiling the target runtime and hardware, then selecting compilation, kernels, and memory layouts that meet its resource and thermal limits.

Self-Check: Question
  1. A smartphone camera pipeline takes 200 ms total: 100 ms for the image signal processor (ISP), 60 ms for ML scene classification, and 40 ms for postprocessing. If an engineering team optimizes the ML model to run \(10\times\) faster (reducing ML time from 60 ms to 6 ms), what is the overall system-level speedup?

    1. \(10.00\times\) speedup
    2. \(1.37\times\) speedup
    3. \(5.50\times\) speedup
    4. \(0.73\times\) speedup (system becomes slower)
  2. Why does deploying a single generic FP32 model binary across diverse edge devices (e.g., Arm CPU, Apple Neural Engine, and Google Coral Edge TPU) result in suboptimal efficiency compared to per-target compilation?

    1. Generic model binaries violate cryptographic signatures required by PCI Express buses.
    2. Floating-point operations are mathematically undefined on mobile CPUs.
    3. Generic binaries cannot exploit hardware-specific kernel fusion, dedicated fixed-point INT8 matrix datapaths, or accelerator-specific on-chip SRAM memory tiling.
    4. The operating system automatically deletes untuned model weights to prevent memory fragmentation.
  3. Why does choosing an on-premises edge deployment solely because its hardware amortizes to a lower monthly compute cost than a cloud VM often result in a higher Total Cost of Ownership (TCO)?

  4. Increasing the quantity of training data is guaranteed to continuously improve deployed model performance regardless of model capacity, label noise, or domain distribution shift.

  5. What is kernel fusion in ML compilers, and how does it optimize memory-bound inference pipelines?

See Answers →

2.13 Summary

The same model demands different engineering on a phone and in a data center because each deployment target offers the model different hardware terms. The iron law of ML systems (\(\Time= \frac{\DataVolume}{\Bandwidth} + \frac{\Operations}{\PeakRate \cdot \EfficiencyHw} + \Latency\)) unifies these physical limits into a single execution model. Propagation delay contributes fixed latency (\(\Latency\)), the memory wall bounds data movement (\(\DataVolume/\Bandwidth\)), and thermal power budgets cap sustained compute.

By applying the bottleneck principle to workload archetypes, engineers determine whether a model’s latency is dominated by compute efficiency, memory bandwidth, or network transit before committing to single-node or hybrid architectures. The quantitative trade-offs summarized in table 9 and the tiered screening sequence formalized in figure 11 establish the physical baselines for later decisions in model compression, data pipeline design, and high-performance serving.

Key Takeaways: Same model, different engineering
  • Physical constraints define feasibility: Propagation delay sets a lower bound on remote response time (about 36 ms for a cross-country round trip). Power and memory budgets limit what a platform can sustain, so a feasible deployment must meet the task’s deadline within the target platform’s resource limits.
  • Identify bottlenecks before optimizing: The same model can be compute bound in batched training yet bandwidth-bound at batch-1 inference. The iron law and bottleneck principle pinpoint which constraint dominates; shortening a nonlimiting stage may reduce request latency without increasing steady-state throughput.
  • Match workload demands to deployment budgets: A compute-bound workload such as large-scale image-model training often needs cloud-scale resources; a power-bound workload such as keyword spotting benefits from microcontroller efficiency. Engineers must identify the binding constraint under the intended execution conditions rather than choose a deployment from the model name alone.
  • Screen feasibility before comparing cost: Privacy, latency, and resource gates remove infeasible tiers before cost is compared. Among the survivors, utilization, provisioning, and fleet maintenance, not resource savings alone, decide which architecture is cheaper.
  • Hybrid architectures divide work by constraint: The voice-assistant example assigns wake-word detection to TinyML, speech-to-text to mobile, and language understanding to cloud. Train-serve split, hierarchical processing, and progressive deployment provide three patterns for combining tiers; the choice depends on each stage’s requirements.
  • Deployment begins a feedback loop: Live data can diverge from training conditions while code and weights stay fixed, so monitoring and bounded operational exposure are part of the system architecture.

Deployment paradigms are not product categories. They are operating regimes shaped by physical and operational constraints, and selecting one changes which constraint is most likely to bind. Data-center training can push against peak compute (\(\Operations/\PeakRate\)). Mobile inference is bounded by energy, with the battery setting the budget and the chassis capping the rate at which it can be spent. Remote real-time inference can be constrained by propagation delay (\(\Latency\)). Systems engineering begins by measuring that binding constraint, and the measurement is worth most when it comes early. Optimizing model architecture or software runtimes without first identifying the binding constraint produces systems that fail when they meet real operating conditions.

What’s Next: From theory to process
The decision framework in section 2.9.2 identifies where an ML system can execute, but the team must use those constraints throughout development. Knowing where a model can run helps little if the team learns it too late, because constraints discovered at launch invalidate months of earlier decisions. ML Lifecycle traces exactly that failure, a deployment memory budget discovered only after five months of work, and shows how such constraints must travel backward to the first design meeting. It introduces the machine learning lifecycle, the iterative engineering process that carries a system from problem definition through deployment, monitoring, and maintenance, and the workflow that carries constraints around it.

2.14 Self-Check Answers

Self-Check: Answer
  1. Which statement correctly characterizes the span of power and memory capacity across the four deployment paradigms (Cloud ML, Edge ML, Mobile ML, and TinyML)?

    1. Power spans approximately nine orders of magnitude from megawatts in cloud data centers to milliwatts in microcontrollers, while memory spans from terabytes to kilobytes.
    2. Power spans three orders of magnitude from kilowatts to watts, while memory remains in the gigabyte range across all four deployment tiers.
    3. Power is identical across Edge, Mobile, and TinyML tiers (all operating under 5 W), with only Cloud ML exceeding 100 W.
    4. Memory capacity varies by at most a factor of \(10^3\) between cloud servers and microcontrollers, while power varies by \(10^{12}\).

    Answer: The correct answer is A. Cloud ML operates at megawatt (\(10^6\text{ W}\)) scale in data centers with terabytes (\(10^{12}\text{ bytes}\)) of memory, whereas TinyML operates on microcontrollers consuming milliwatts (\(10^{-3}\text{ W}\)) with kilobytes (\(10^3\text{ bytes}\)) of RAM, establishing a nine-order-of-magnitude span in power and memory capacity. The option claiming a three-order power span severely underestimates data-center power and microcontroller power limits. The claim that Edge, Mobile, and TinyML have identical sub-5 W power ignores that edge servers typically consume 100 W to several hundred watts. The option asserting only a \(10^3\) memory variation fails to recognize the gap between terabytes and kilobytes (\(10^9\) ratio).

    Learning Objective: Compare the operational power and memory envelopes across the four deployment paradigms.

  2. In ML systems engineering, what is meant by the silicon contract** established by a single-node stack?**

    1. The legal warranty provided by chip foundries guaranteeing zero hardware defects during multi-week training runs.
    2. The fixed performance bargain offered by a hardware platform, defined by its peak compute rate, memory bandwidth, and fixed launch overhead.
    3. The software abstraction layer that guarantees automated portability across CPUs, GPUs, and microcontrollers without performance regression.
    4. The dynamic power-scaling policy that allows an accelerator to exceed its thermal design power indefinitely under heavy batch loads.

    Answer: The correct answer is B. The silicon contract refers to the fixed performance bargain a specific piece of hardware provides to a model, dictated by its physical limits: peak arithmetic rate (\(R_{\text{peak}}\)), memory bandwidth (\(\text{BW}\)), and fixed execution overhead (\(L_{\text{lat}}\)). Software can only optimize within this boundary. The option referring to legal foundry warranties confuses systems architectural concepts with commercial guarantees. The choice describing an automated portability abstraction conflates compiler frameworks with hardware limits. The claim regarding exceeding thermal limits indefinitely violates basic thermodynamics.

    Learning Objective: Explain the concept of the silicon contract and how physical hardware constraints define system performance limits.

  3. Why does deploying an ML model across different paradigms require treating deployment as a first-order D·A·M co-design problem rather than a late-stage packaging step?

    Answer: Deployment is a first-order co-design problem because physical machine constraints (such as power, thermal dissipation, memory bandwidth, and on-chip SRAM capacity) dictate what algorithmic structures and data representations are feasible. Deferring deployment until after training often results in models that exceed target memory budgets or violate latency SLAs, requiring fundamental redesigns of the model architecture, precision formats, or batching strategies.

    Learning Objective: Justify why deployment must be treated as a first-order D·A·M co-design problem rather than a late-stage packaging task.

← Back to Questions

Self-Check: Answer
  1. A safety-critical autonomous braking system requires an end-to-end decision latency budget of 10 ms. A cloud data center is located 1,500 km away. Given that light travels through optical fiber at approximately \(200{,}000\text{ km/s}\), why is offloading inference to this cloud data center physically impossible?

    1. The cloud server queue latency always adds at least 25 ms regardless of server load.
    2. The speed of light in fiber allows a round trip in 5 ms, but serialization of model weights requires 15 ms.
    3. The minimum speed-of-light round-trip propagation time alone is 15 ms, consuming the entire 10 ms budget before compute begins.
    4. Wireless transmission protocols require a minimum 50 ms handshake before transmitting sensor packets.

    Answer: The correct answer is C. The minimum round-trip propagation time over optical fiber is \(\frac{2 \times 1{,}500\text{ km}}{200{,}000\text{ km/s}} = 0.015\text{ s} = 15\text{ ms}\). This propagation delay alone exceeds the 10 ms budget by 5 ms before accounting for network routing, packet queuing, or model inference. The option citing a fixed 25 ms server queue latency confuses operational queuing with an invariant physical floor. The option claiming a 5 ms round trip miscalculates the distance-speed formula. The option attributing the failure to wireless handshakes references protocol overhead rather than the primary speed-of-light constraint.

    Learning Objective: Calculate the physical latency floor imposed by the speed of light in optical fiber for distributed ML workloads.

  2. Under dynamic CMOS power scaling where supply voltage scales proportionally with clock frequency (\(V \propto f\)), doubling the processor clock frequency increases dynamic power dissipation by a factor of 8 (\(f^3\)).

    Answer: True. Dynamic CMOS power follows \(\text{Power} \propto C \cdot V^2 \cdot f\). When supply voltage \(V\) must scale proportionally with frequency \(f\) to support faster switching, substituting \(V \propto f\) yields \(\text{Power} \propto C \cdot f^3\). Consequently, doubling clock frequency (\(2\times\)) results in an \(8\times\) (\(2^3\)) increase in dynamic power, which explains why frequency scaling stalled when Dennard scaling broke down.

    Learning Objective: Explain the cubic relationship between clock frequency and dynamic power in CMOS circuits and its impact on hardware scaling.

  3. How does the memory wall manifest in modern computing hardware according to the historical growth rates of compute capacity versus memory bandwidth?

    1. Memory bandwidth doubles every 18 months while compute throughput increases by only 20% annually, causing compute starvation.
    2. Both compute throughput and memory bandwidth grow at identical 60% annual rates, but memory capacity limits model size.
    3. Processors have reached absolute thermal limits while memory signaling energy has dropped to near-zero levels.
    4. Compute capacity historically doubles roughly every 18 months (~60% annually), whereas memory bandwidth grows by only ~20% annually, causing the compute-to-bandwidth gap to widen compounding over time.

    Answer: The correct answer is D. The memory wall is defined by the widening gap between compute growth (doubling roughly every 18 months, ~60% annual growth) and memory bandwidth growth (~20% annual growth), yielding a growth factor ratio of approximately \(\frac{1.6}{1.2} \approx 1.33\). This divergence makes data movement an increasingly dominant bottleneck across successive hardware generations. The option reversing compute and memory bandwidth growth contradicts historical scaling trends. The option claiming identical growth rates ignores the core definition of the memory wall. The option claiming memory signaling energy has dropped to near zero contradicts the physics of memory bus signaling.

    Learning Objective: Analyze the quantitative divergence between processor compute growth and memory bandwidth growth that creates the memory wall.

  4. What causes thermal throttling on passively cooled mobile devices running sustained ML inference, and how does it affect continuous model execution?

    Answer: Passively cooled mobile devices have a limited thermal dissipation capacity (typically 3–5 W TDP). When sustained ML computation generates heat faster than the chassis can dissipate it, the internal temperature rises until it reaches the hardware thermal trip point (e.g., 80 °C). The operating system then throttles clock frequencies and duty cycles to protect the hardware, which can cause frame rates and inference throughput to drop precipitously (e.g., from 60 FPS down to 15 FPS).

    Learning Objective: Evaluate the thermal throttling mechanism on mobile devices and its operational impact on sustained inference throughput.

  5. The historical scaling relationship under which shrinking MOSFET transistor dimensions allowed reducing voltage and current while keeping power density constant is known as ____ scaling.

    Answer: Dennard. Dennard scaling (formulated by Robert Dennard in 1974) held that as transistors shrank, power density remained constant because operating voltage and current scaled downward proportionally. Its breakdown in the mid-2000s ended free clock frequency scaling and forced the computing industry toward multicore parallelism and domain-specific accelerators.

    Learning Objective: Explain the transistor power-scaling law whose breakdown led to domain-specific ML accelerators.

← Back to Questions

Self-Check: Answer
  1. When analyzing ML system performance, when should an engineer apply the additive form of the iron law (\(T = \frac{D_{\text{vol}}}{\text{BW}} + \frac{O}{R_{\text{peak}} \cdot \eta_{\text{hw}}} + L_{\text{lat}}\)) versus the bottleneck principle’s max form (\(T_{\text{pipelined}} \ge \max\left(\frac{D_{\text{vol}}}{\text{BW}}, \frac{O}{R_{\text{peak}} \cdot \eta_{\text{hw}}}, T_{\text{IO}}\right) + L_{\text{lat}}\))?

    1. Use the additive form for single-request serialized latency, and the max form for steady-state pipelined completion interval after the pipeline fills, where overlapped stages are bounded by the slowest one.
    2. Use the additive form exclusively for cloud workloads, and the max form exclusively for microcontroller TinyML workloads.
    3. Use the additive form when batch size is greater than 128, and the max form when batch size equals 1.
    4. Use the additive form during model training only, and the max form during on-device model quantization.

    Answer: The correct answer is A. The additive form models one request’s serialized latency when data movement, compute, and fixed overhead lie on the dependent path and therefore add. The max form is for pipelined steady-state throughput: after the pipeline fills, the time between completed tasks is at least the slowest overlapped stage, with \(L_{\text{lat}}\) added separately because nonoverlapped overhead sits outside the \(\max(\cdot)\). The cloud-versus-TinyML answer confuses execution structure with deployment location, and the batch-size rule is not the governing distinction.

    Learning Objective: Apply the iron law and bottleneck principle to distinguish single-request serialized latency from steady-state pipelined completion interval.

  2. Which pairing correctly matches a workload archetype to its dominant physical bottleneck and canonical lighthouse model?

    1. Compute-bound \(\rightarrow\) dominated by irregular table lookups and cache misses \(\rightarrow\) DLRM
    2. Bandwidth-bound \(\rightarrow\) dominated by dense parameter streaming during autoregressive token decode \(\rightarrow\) GPT-2/Llama
    3. Capacity-bound \(\rightarrow\) dominated by dense FLOP throughput at high arithmetic intensity \(\rightarrow\) ResNet-50
    4. Power-bound \(\rightarrow\) dominated by petabyte-scale distributed training \(\rightarrow\) Keyword Spotting (KWS)

    Answer: The correct answer is B. Bandwidth-bound workloads, exemplified by autoregressive language models such as GPT-2 and Llama, perform sequential token decoding where generating each token requires streaming large parameter matrices through memory, making memory bandwidth (\(\text{BW}\)) the primary bottleneck. The option pairing Compute-bound with DLRM confuses dense arithmetic with sparse embedding lookups. The option pairing Capacity-bound with ResNet-50 misclassifies a dense convolution model as an irregular lookup table. The option pairing Power-bound with petabyte-scale distributed training contradicts the kilobyte memory and milliwatt power constraints of TinyML.

    Learning Objective: Classify ML workloads into archetypes based on their dominant iron law bottlenecks and reference lighthouse models.

  3. Explain why shortening a stage that is not the bottleneck can still reduce the latency of one sequential request, even though it does not improve ideal pipelined throughput once the pipeline is full.

    Answer: Shortening any stage on a sequential request’s dependent path reduces that request’s total latency because the additive form sums all required stages. In a pipelined stream, however, ideal steady-state throughput is set by the slowest overlapped stage, so making a faster nonlimiting stage even shorter does not change the completion interval after the pipeline fills. For example, reducing compute time helps a single request finish sooner, but if memory or \(T_{\text{IO}}\) remains the longest stage, the assembly-line rate stays unchanged. The practical consequence is that engineers should separate latency optimization for one request from throughput optimization for a continuous stream.

    Learning Objective: Explain why improving a nonlimiting stage can lower sequential request latency without increasing ideal pipelined throughput.

  4. **Order the steps of the hierarchical deployment feasibility evaluation for the Smart Doorbell scenario from initial problem framing to latency verification:

  1. Check Level 1 storage fit by screening whether the visual wake-word model’s weights fit in flash
  2. Define the application mission targets (person at the door, required quality, and responsiveness budget)
  3. Check Level 2 timing constraints by evaluating per-inference latency against the interaction budget
  4. Select a candidate platform and model for the task (for example, a visual wake-word model on an ESP32-S3)**

Answer: The correct order is: (2) Define the application mission targets (person at the door, required quality, and responsiveness budget), (4) Select a candidate platform and model for the task (for example, a visual wake-word model on an ESP32-S3), (1) Check Level 1 storage fit by screening whether the visual wake-word model’s weights fit in flash, (3) Check Level 2 timing constraints by evaluating per-inference latency against the interaction budget. The sequence is necessary because the budget and task define what “fit” means, the candidate must be chosen before it can be screened, and the scorecard checks flash before latency. Passing the flash check does not prove complete memory fit: SRAM for activations and runtime state still has to be checked separately.

Learning Objective: Sequence a hierarchical feasibility screen for embedded deployment and distinguish flash screening from separate SRAM/runtime-memory validation.

  1. An ML workload characterized by high arithmetic intensity where throughput is bounded by peak FLOP/s (\(R_{\text{peak}}\)) rather than memory bandwidth, such as dense convolutional neural network training, belongs to the ____ archetype.

    Answer: Compute-bound. Compute-bound workloads perform many floating-point operations per byte of memory loaded (\(I = \text{FLOPs/byte}\)), ensuring that processor arithmetic units remain saturated and execution time is dominated by the compute term (\(O / (R_{\text{peak}} \cdot \eta_{\text{hw}})\)) of the iron law.

    Learning Objective: Classify ML workloads exhibiting high arithmetic intensity into the Compute-bound archetype.

← Back to Questions

Self-Check: Answer
  1. Why is single-image (batch=1) ResNet-50 inference memory-bound on both a high-end cloud accelerator (NVIDIA A100) and a mobile NPU (iPhone 15 Pro)?

    1. ResNet-50 contains dynamic control flow that causes branching stalls on SIMD execution units.
    2. Both platforms lack matrix multiplication coprocessors, forcing scalar CPU execution.
    3. At batch=1, model weights must be loaded from memory once per single image without weight reuse across batch items, keeping arithmetic intensity below each platform’s hardware balance point (\(R_{\text{peak}}/\text{BW}\)).
    4. The activations at batch=1 exceed the total high-bandwidth memory (HBM) and SRAM capacities of both devices.

    Answer: The correct answer is C. For single-image inference (\(\text{batch}=1\)), the full model weight parameters must be fetched from memory to process a single sample. Because weights cannot be amortized across multiple samples in parallel, the effective arithmetic intensity (\(I = \text{FLOPs/byte}\)) is low and falls to the left of the roofline ridge point (\(R_{\text{peak}}/\text{BW}\)) on both the A100 and the mobile NPU, making memory bandwidth the limiting constraint on both chips. The option citing dynamic control flow is incorrect because ResNet-50 consists of regular static feedforward convolutions. The claim that both platforms lack matrix acceleration is false, as both feature specialized tensor cores / NPUs. The option claiming activations exceed memory capacity is false, as ResNet-50 activations at batch=1 require only a few megabytes.

    Learning Objective: Analyze why single-batch inference is memory-bound across heterogeneous hardware platforms using the roofline model.

  2. Why does a convolutional neural network (e.g., ResNet-50) shift from a compute-bound regime during cloud training to a memory-bound regime during single-sample (\(\text{batch}=1\)) edge inference?

    Answer: During cloud training with large batch sizes (e.g., \(\text{batch}=256\)), loaded model weights are reused across hundreds of input samples in parallel, raising arithmetic intensity (\(I = \text{FLOPs/byte}\)) above the hardware balance point into the compute-bound regime. During single-sample inference (\(\text{batch}=1\)), the full set of model weights must be streamed from memory to process just one input without reuse, causing arithmetic intensity to plummet onto the memory-bandwidth-bound slope of the roofline.

    Learning Objective: Explain how the dominant bottleneck shifts between compute-bound and memory-bound regimes across training and inference phases.

  3. An ML service SLA guarantees a total end-to-end response time of 100 ms. The pipeline involves client preprocessing, a cross-region network RPC, model inference, and postprocessing. According to critical path latency principles, why will this system fail if a cross-region network call taking 120 ms is placed on the synchronous critical path?

    1. The ML framework compiler will refuse to lower the graph if network RPC operations are detected.
    2. Cross-region RPCs corrupt the numerical precision of FP16 tensors during serialization.
    3. A cross-region network call reduces the accelerator compute throughput (\(R_{\text{peak}}\)) by half.
    4. The critical path is the longest sequential chain of dependent operations; any single stage exceeding 100 ms guarantees the end-to-end SLA will be breached regardless of how fast all other stages execute.

    Answer: The correct answer is D. In a synchronous pipeline, end-to-end latency is bounded below by the sum of sequential operations on the critical path. If an individual operation on the critical path requires 120 ms, the system latency is guaranteed to be at least 120 ms, violating the 100 ms budget before accounting for inference, preprocessing, or postprocessing. The options citing compiler lowering errors, tensor precision corruption, or halved accelerator throughput invent non-existent technical failures instead of applying critical-path analysis.

    Learning Objective: Apply the critical path latency rule to evaluate end-to-end ML service level agreements.

  4. What is the hardware balance point (or roofline ridge point) of an accelerator, and what does it tell an ML systems engineer about whether a workload will be compute-bound or memory-bound?

    Answer: The hardware balance point is the ratio of peak arithmetic throughput to memory bandwidth (\(R_{\text{peak}} / \text{BW}\)), expressed in \(\text{FLOPs/byte}\). If a workload’s arithmetic intensity (\(I = \text{operations} / \text{bytes moved}\)) is greater than this balance point (\(I > R_{\text{peak}}/\text{BW}\)), the workload is compute-bound and limited by processor arithmetic capacity. If \(I < R_{\text{peak}}/\text{BW}\), the workload is memory-bound and limited by memory bandwidth, meaning buying more peak FLOP/s will provide zero speedup unless data movement is reduced.

    Learning Objective: Calculate the hardware balance point and use it to classify workloads into compute-bound and memory-bound regimes.

  5. For batch-1 LLM decode in the cloud and for most edge inference, the iron-law term that binds first is memory ____ rather than peak compute, so a faster accelerator alone yields little speedup.

    Answer: bandwidth. These workloads stream weights and activations with little reuse per byte loaded, so the data-movement term \(D_{\text{vol}}/\text{BW}\) dominates. The productive optimizations reduce bytes moved (smaller models, lower precision, more reuse per loaded weight) rather than adding peak FLOP/s.

    Learning Objective: Identify the binding iron-law term for a deployment tier and the optimizations it rewards.

  6. **Order the four architectural layers of the single-node stack from the top-level mission goal down to the physical execution engine:

  1. Operating system (resource orchestration and host-accelerator memory transfers)
  2. ML framework (operator graph lowering and execution planning)
  3. Hardware and silicon contract (peak compute throughput, memory bandwidth, HBM/SRAM)
  4. Application layer (training throughput target or inference latency SLA)**

Answer: The correct order is (4) Application layer, (2) ML framework, (1) Operating system, and (3) Hardware and silicon contract. The application layer defines the latency or throughput mission. The ML framework translates model code into an executable computation graph. The operating system orchestrates memory buffers and transfers between host and accelerator memory. Finally, the physical hardware executes the operations bounded by memory bandwidth, compute throughput, and fixed latencies.

Learning Objective: Classify the hierarchical layers of the single-node ML systems stack from mission requirements to physical execution.

← Back to Questions

Self-Check: Answer
  1. In the chapter’s 3-year budget comparison for an on-premises edge server deployment serving 1 million inferences per day, what is the largest component of the edge system’s listed annual budget in the chapter’s scenario?

    1. GPU hardware silicon purchase price amortized over 3 years
    2. DevOps engineering labor required to maintain, update, and manage on-premises edge infrastructure
    3. Electricity costs for running the server 24/7
    4. Dedicated server room air-conditioning and cooling overhead

    Answer: The correct answer is B. In the chapter’s illustrative edge-server budget, engineering labor (e.g., 0.1 FTE DevOps support per server/site, totaling ~$15,000/year) accounts for roughly 69% of the listed annual edge budget, far exceeding hardware CapEx (~$5,000/year), power (~$315/year), or cooling (~$95/year). Teams that focus solely on minimizing hardware purchase costs systematically underestimate the total cost of ownership. The choices identifying hardware amortization, electricity, or cooling as the dominant cost do not match this scenario. The comparison is a partial budget: cloud operating labor and edge redundancy are not priced, so it does not establish a matched total-cost ranking.

    Learning Objective: Evaluate the listed edge-server budget to identify the dominant role of operational labor.

  2. What is the data-gravity principle in cloud ML, and why does it make moving multi-terabyte raw sensor datasets to the cloud economically and physically problematic?

    Answer: The data-gravity principle states that as data volume (\(D_{\text{vol}}\)) grows, the time and cost of moving the data to remote compute eventually exceed the cost of moving the computation (a model and its code) to the data, because transfer time grows with the data while shipping the computation costs roughly the same however much data waits. For massive sensor streams (such as hundreds of raw video feeds generating tens of gigabytes per second), the raw upload can exceed uplink capacity; uplink service and storage costs may also matter, while cloud egress applies to later outbound transfers rather than the upload itself. Local computation can reduce transport, but compressed frames, features, or event summaries may also change the comparison. Evaluate the transmitted representation and complete local and remote paths before choosing placement.

    Learning Objective: Explain the data-gravity principle and its implications for data-movement costs in cloud systems.

  3. Under GDPR Article 17 (Right to Erasure), when a user requests deletion of their data, an organization is legally mandated to retrain from scratch every ML model that ever encountered that user’s training samples.

    Answer: False. GDPR Article 17 provides a right to erasure across source data stores, derived feature pipelines, caches, and logs where specified grounds apply, but it is technology-neutral and does not prescribe retraining every trained model as the sole mandatory remediation. Organizations evaluate risk, data persistence, and technical measures appropriate to the system.

    Learning Objective: Classify the operational and legal boundaries of data erasure regulations (GDPR) on deployed ML models.

← Back to Questions

Self-Check: Answer
  1. A manufacturing facility deploys 100 cameras recording uncompressed 1080p video (\(1920 \times 1080 \times 3\text{ bytes/pixel}\)) at 30 FPS. The factory has a dedicated 10 Gbps (~1.25 GB/s) fiber uplink. Why is streaming all raw video to a cloud ML server physically impossible?

    1. The total is only about \(186.6\text{ MB/s}\) because that is the per-camera rate, so the 10 Gbps uplink has ample headroom.
    2. The aggregate is about \(18.7\text{ Gb/s}\) because the camera output should be compared numerically to 10 Gbps without converting bytes to bits, so the link is close enough to be practical.
    3. The aggregate raw video data rate is approximately \(18.7\text{ GB/s}\), which exceeds the \(1.25\text{ GB/s}\) uplink capacity by roughly \(15\times\).
    4. The aggregate raw stream is large, but normal compression assumptions would make it fit within the 10 Gbps uplink in practice.

    Answer: The correct answer is C. Each camera produces about \(1920 \times 1080 \times 3 \times 30 \approx 186.6\text{ MB/s}\), and multiplying by 100 cameras gives about \(18.66\text{ GB/s}\). The 10 Gbps uplink delivers only about \(1.25\text{ GB/s}\), so the raw stream is roughly \(15\times\) larger than the available link. The per-camera answer fails to multiply by all 100 cameras, the gigabits-versus-gigabytes answer compares unlike units without converting, and the compression answer assumes a reduction mechanism the scenario never grants. The physical impossibility here is for uncompressed raw streaming under the stated link budget.

    Learning Objective: Calculate aggregate sensor bandwidth demand and compare it against uplink limits to diagnose when edge processing is mandatory.

  2. An autonomous drone navigates at 60 FPS (16.7 ms per-frame budget) capturing uncompressed 4K frames (~24.9 MB per frame). The drone connects via a 100 Mbps uplink to a cloud server whose round-trip latency plus inference time is 110 ms. Applying the data locality invariant, what is the feasibility of offloading this obstacle avoidance system to the cloud?

    1. Feasible, because the cloud GPU computes inference in under 10 ms.
    2. Feasible, provided 5G network slicing is enabled on the drone modem.
    3. Infeasible, solely because cloud servers do not support drone telemetry protocols.
    4. Infeasible, because transmitting a 24.9 MB frame over a 100 Mbps link requires ~2,000 ms, causing even the remote-path lower-bound estimate (~2,110 ms) to violate the 16.7 ms frame deadline by over two orders of magnitude.

    Answer: The correct answer is D. Under the data locality screen, the remote-path lower-bound estimate is \(T_{\text{remote}} = \frac{D_{\text{vol}}}{\text{BW}_{\text{network}}} + L_{\text{lat,network}} + T_{\text{compute,remote}}\). Transmitting \(24.9\text{ MB} = 199.2\text{ Mbits}\) over a \(100\text{ Mbps}\) uplink requires \(\frac{199.2}{100} \approx 1.992\text{ s} \approx 2{,}000\text{ ms}\). Adding the 110 ms network/compute delay yields \(T_{\text{remote}} \approx 2{,}110\text{ ms}\), vastly exceeding the 16.7 ms per-frame budget. Because transmission time alone exceeds the deadline, this raw-frame offload is infeasible. A lower-bound estimate below the deadline would instead require complete-path measurement, including remote memory movement, queues, preprocessing, runtime overhead, and response serialization. The options claiming feasibility ignore the two-second transmission bottleneck. The option blaming telemetry protocols misses the fundamental bandwidth-latency physics.

    Learning Objective: Apply the data locality invariant equation to determine whether an application must run locally at the edge.

  3. Why cannot high-bandwidth wireless networking technologies (such as 5G or 6G) eliminate the need for edge ML in tight real-time control loops (\(<10\text{ ms}\))?

    Answer: While 5G and 6G technologies dramatically increase network bandwidth (\(\text{BW}_{\text{network}}\)) and reduce data transmission serialization time, they cannot alter the speed of light in optical fiber or eliminate physical geographic routing delays and protocol overhead (\(L_{\text{lat,network}}\)). For tight real-time control loops (\(<10\text{ ms}\)), physical round-trip propagation over geographic distances alone can consume the entire latency budget before any computation begins, making local edge execution physically mandatory.

    Learning Objective: Evaluate why high-bandwidth cellular networks (5G/6G) cannot eliminate the need for edge ML in sub-10 ms control loops.

  4. A retail store needs about 5.2 TOPS of sustained throughput. Why does the chapter’s estimate call for three 4 TOPS boards rather than two, even though two boards’ combined 8 TOPS peak exceeds the target?

    Answer: Hardware datasheets publish peak theoretical throughput (\(R_{\text{peak}}\)), but real-world sustained workloads encounter thermal limits, memory bandwidth bottlenecks, and software overhead, so the peak rating alone does not establish sustained performance. Under the illustrative 50% derating assumption, each 4 TOPS board sustains about 2 TOPS, so the target needs 5.2 ÷ 2 ≈ 2.6 boards, which rounds up to three. Multiple boards or a higher-tier accelerator remain candidates only if the model’s operators and numerical format are supported. A multi-board design additionally requires divisible work and manageable coordination overhead; measurements of the actual model and runtime must establish sustained performance and task quality.

    Learning Objective: Calculate sustained accelerator requirements for edge deployments using hardware derating factors.

  5. An illustrative 60 Hz industrial control scenario assumes each sensing-to-actuation response must finish before the next sample. Its complete ML control loop latency (\(L_{\text{lat}}\)) must therefore fit within one ____ (about 16.7 ms).

    Answer: sampling interval (or control cycle time / sampling period). This scenario sets the completion deadline equal to one sampling interval. Sampling rate alone does not establish a control deadline, and meeting the timing requirement alone does not guarantee safety or defect prevention.

    Learning Objective: Evaluate the control loop timing constraints governing real-time industrial IoT ML deployments.

← Back to Questions

Self-Check: Answer
  1. How do the battery tax** and the thermal wall differ as physical constraints on mobile ML systems?**

    1. The battery tax is an energy budget problem bounding total operations over time (\(\int \text{Power} \cdot dt\)), whereas the thermal wall is a heat dissipation ceiling bounding instantaneous sustained power (\(\text{Power} \le 2\text{--}5\text{ W}\)) regardless of battery size.
    2. The battery tax applies only to iOS devices, while the thermal wall applies only to Android devices.
    3. The battery tax can be resolved by lowering clock frequency, but the thermal wall requires increasing the clock frequency to finish calculations faster.
    4. The battery tax represents static memory leakage in SRAM, while the thermal wall represents network transmission power in 5G modems.

    Answer: The correct answer is A. The battery tax represents the depletion of finite electrochemical energy (\(E = P \cdot t\)) over a full day, meaning a model running continuously draws down the daily battery budget. The thermal wall represents the maximum rate of heat that a phone’s passive chassis can continuously dissipate (typically 3–5 W TDP). Adding a larger battery extends runtime but cannot prevent thermal throttling if the workload exceeds the thermal dissipation ceiling. The option dividing the constraints by mobile operating system is factually baseless. The option suggesting higher clock frequencies to beat the thermal wall violates the cubic power law (\(\text{Power} \propto f^3\)). The option conflating the terms with SRAM leakage and modem power misdefines both concepts.

    Learning Objective: Compare the battery tax and the thermal wall as distinct energy and thermodynamic constraints in mobile ML.

  2. Why does deploying a mobile computational photography feature (such as Portrait Mode or Night Mode) present a pipeline scheduling challenge rather than a single-model optimization problem?

    1. Mobile cameras can only run one neural network per battery charge cycle.
    2. The feature executes a multi-stage pipeline (depth estimation, semantic segmentation, alignment, and HDR tone mapping) that must all complete within a perceived shutter delay while sharing a 3–5 W thermal budget across CPU, GPU, and NPU.
    3. Computational photography models cannot use quantized INT8 representations due to mathematical rounding artifacts in lens optics.
    4. Camera image signal processors (ISPs) operate asynchronously from the operating system and reject all external ML tensor inputs.

    Answer: The correct answer is B. Mobile computational photography does not rely on a single isolated model; it executes a sequence of specialized real-time models (such as depth estimation, segmentation, and denoising) alongside the ISP. All stages must execute within the user’s perceived shutter delay (tens to hundreds of milliseconds) while sharing the phone’s tight 3–5 W thermal envelope across heterogeneous SoC cores (CPU, GPU, NPU) without triggering thermal throttling. The option claiming one network per charge cycle is absurd. The option claiming optics prevent INT8 quantization is false, as mobile vision pipelines routinely use quantized models. The option claiming ISPs reject ML tensor inputs misrepresents modern mobile SoC architectures where ISPs and NPUs share memory.

    Learning Objective: Analyze the system scheduling and thermal constraints of multi-stage computational photography pipelines on mobile SoCs.

  3. Why does deploying an unoptimized desktop-trained vision model (such as an FP32 ResNet-50 pipeline) directly onto a mobile device frequently fail, even when the model’s FP32 weights (~98 MB) appear smaller than the phone’s total RAM?

    Answer: While the raw FP32 weights are ~98 MB, a complete desktop pipeline requires gigabytes of memory once intermediate activation tensors, input/output preprocessing buffers, runtime framework overhead, and batch buffers are allocated. Furthermore, unoptimized desktop models execute billions of FLOPs (e.g., 4.1 GFLOPs per image) using unsupported float operations or desktop-specific layers, exceeding the mobile device’s 3–5 W thermal envelope and causing thermal throttling or out-of-memory crashes.

    Learning Objective: Analyze why desktop-trained models fail on mobile devices due to activation memory, thermal budgets, and unsupported operations.

  4. Running biometric matching (such as Face ID) inside a dedicated on-device Secure Enclave reduces data disclosure risks by keeping mathematical representations isolated in encrypted hardware, but it does not automatically eliminate all security or privacy risks without rigorous end-to-end system design.

    Answer: True. Hardware isolation mechanisms like the Secure Enclave restrict biometric mathematical representations to dedicated encrypted memory on-device, preventing remote transmission and unauthorized operating system access. However, overall system security and privacy still depend on the complete threat model, authentication policies, and software implementation.

    Learning Objective: Evaluate how dedicated hardware enclaves (e.g., Secure Enclave) provide biometric privacy while recognizing holistic system threat models.

  5. **Order the sequence of events that occurs when an unoptimized 12 W deep learning model runs continuously on a passively cooled 3 W smartphone SoC:

  1. The device temperature rises rapidly (e.g., at ~1 °C per second) as power dissipation exceeds passive cooling capacity
  2. The unoptimized model launches at full burst performance (e.g., 100 FPS) drawing 12 W of active compute power
  3. Operating system and hardware thermal controllers engage thermal throttling, reducing clock frequencies and duty cycles
  4. The internal SoC junction temperature reaches the critical thermal trip point (e.g., 80 °C)
  5. Sustained inference throughput drops precipitously (e.g., from 100 FPS to 30 FPS) to stabilize power within the 3 W TDP envelope**

Answer: The correct order is (2) The unoptimized model launches at full burst performance drawing 12 W, (1) The device temperature rises rapidly as power exceeds passive cooling capacity, (4) The internal SoC temperature reaches the critical thermal trip point, (3) OS and hardware engage thermal throttling, and (5) Sustained inference throughput drops precipitously to stabilize within the 3 W TDP envelope. This sequence illustrates why peak burst benchmarks on mobile devices do not reflect sustained real-world performance.

Learning Objective: Explain the physical sequence of events during mobile thermal throttling under unoptimized compute workloads.

← Back to Questions

Self-Check: Answer
  1. Comparing a dedicated TinyML keyword spotting model (~\(10\ \mu\text{J}\) per inference) to a cloud foundation model query (~\(1\text{ kJ}\) per inference), by approximately what factor does energy consumption per inference differ?

    1. Approximately \(100\times\) (2 orders of magnitude)
    2. Approximately \(10{,}000\times\) (4 orders of magnitude)
    3. Approximately \(100{,}000{,}000\times\) (\(10^8\), 8 orders of magnitude)
    4. Approximately \(10^{14}\times\) (14 orders of magnitude)

    Answer: The correct answer is C. The energy ratio between a cloud LLM query (\(1\text{ kJ} = 10^3\text{ J}\)) and an always-on TinyML keyword spotting inference (\(10\ \mu\text{J} = 10^{-5}\text{ J}\)) is \(\frac{10^3\text{ J}}{10^{-5}\text{ J}} = 10^8 = 100{,}000{,}000\times\) (eight orders of magnitude). This is a scale comparison across different tasks and accounting boundaries, not a controlled hardware-efficiency comparison. TinyML lifetime still depends on inference cadence, sensing, communication, sleep power, and the complete device energy budget. The options citing 2 orders (\(100\times\)) or 4 orders (\(10{,}000\times\)) severely underestimate the energy gap between cloud data centers and microcontrollers. The option citing 14 orders (\(10^{14}\)) overstates the ratio.

    Learning Objective: Calculate the energy scale ratio between TinyML sensing and cloud LLM queries while distinguishing it from a matched efficiency comparison.

  2. Why are microcontroller TinyML devices predominantly restricted to inference-only execution rather than full in-situ backpropagation training?

    1. Microcontrollers use flash memory which permanently locks all transistor gates against state changes.
    2. Backpropagation requires double-precision FP64 floating-point arithmetic which is mathematically impossible on 32-bit cores.
    3. The speed of light inside microcontroller silicon is too slow to support backward gradient propagation.
    4. Conventional training retains intermediate results needed for gradient calculations and adds gradient and optimizer state, which can exceed a microcontroller’s working-memory budget.

    Answer: The correct answer is D. During inference, an intermediate buffer can be reused only after its final consumer has finished; skip connections can extend that lifetime. Conventional training retains results needed for gradient calculations and adds gradients and optimizer state. Its memory demand depends on tensor shapes, model structure, checkpointing or recomputation, and which parameters are updated, rather than depth alone. Many microcontrollers cannot fit the full training state. Methods such as TinyTL reduce it by freezing weights and updating mainly biases, but constrained local adaptation is not categorically impossible. The other choices do not explain the memory requirement.

    Learning Objective: Explain how training-state memory requirements constrain on-device learning on microcontrollers.

  3. Why is the 1 mW average power threshold considered a transformative milestone in TinyML system deployment?

    Answer: Crossing below about 1 mW average power can make energy-harvesting deployment feasible, but only when the harvested source covers the device’s complete long-term average load and stored energy can bridge interruptions in supply. For example, a sensor that averages under this threshold may shift from frequent battery replacement toward much longer unattended operation if its solar, thermal, or RF source is reliable enough and buffering handles dark or idle periods. The practical implication is that 1 mW is not an automatic deploy-and-forget guarantee; it is a systems crossover that still depends on source variability, storage, and the full device power budget.

    Learning Objective: Explain why sub-1 mW average power can enable energy-neutral TinyML operation only when harvested supply and stored energy cover the complete device load.

  4. Why is it a fallacy to treat TinyML as merely ‘scaled-down mobile ML’ that can be addressed simply by applying standard INT8 post-training quantization?

    Answer: TinyML constrains both storage and working memory: model weights and code generally reside in flash, while intermediate activations and runtime buffers must fit the smaller SRAM budget. FP32-to-INT8 conversion reduces the bytes of converted values by four, but does not guarantee that the artifact fits flash or that its peak working set fits SRAM. Power, operator support, and task quality must also meet the target envelope. Appropriate architectures and memory scheduling may therefore be needed in addition to quantization.

    Learning Objective: Explain the qualitative architectural discontinuities in memory and power that differentiate TinyML from mobile ML.

  5. The power management paradigm in which a battery-less or energy-harvesting microcontroller sleeps in ultra-low-power states and wakes periodically to perform inference before energy reserves deplete is called ____ computing.

    Answer: intermittent (or duty-cycled). Intermittent computing enables microcontrollers powered by tiny batteries (like CR2032 coin cells) or ambient energy harvesters to achieve multi-year lifespans by keeping average active power consumption in the microwatt to milliwatt regime.

    Learning Objective: Explain the operational role of intermittent computing in energy-harvesting TinyML deployments.

← Back to Questions

Self-Check: Answer
  1. In the four-layer deployment screening decision framework, why is the Privacy** layer evaluated first, followed by Latency, Compute Demand, and Cost?**

    1. The layers are ordered by how rapidly a hard constraint can completely invalidate an architecture: legal/privacy rules may forbid remote transmission entirely, physical latency limits can make cloud offload impossible, compute demands eliminate undersized devices, and cost compares the remaining feasible survivors.
    2. Privacy is the easiest parameter to optimize in software using compiler flags, whereas cost cannot be calculated until after deployment.
    3. Cloud providers require privacy agreements before allowing access to GPU instances.
    4. The framework is ordered purely alphabetically based on traditional software engineering conventions.

    Answer: The correct answer is A. The decision framework sequences evaluation gates by their ability to disqualify candidates immediately: privacy and regulatory mandates can strictly prohibit sending raw data off-premises; physical latency constraints (e.g., speed of light) can make remote execution physically incapable of meeting real-time SLAs; compute/memory capacity determines whether candidate hardware can fit the workload; and finally, cost and operational complexity compare the feasible options. The option claiming privacy is a compiler flag trivializes regulatory compliance. The option alleging cloud GPU access requires upfront privacy agreements confuses commercial terms with architectural screening. The choice claiming alphabetical ordering is factually false.

    Learning Objective: Apply the sequential screening logic of the four-layer deployment decision framework.

  2. An autonomous vehicle travels at 100 km/h (~27.8 m/s). An emergency pedestrian detection system evaluates two architectures: (1) an automotive Edge ML accelerator with a 15 ms local detection latency, and (2) a Cloud ML server with 115 ms total latency (100 ms network RTT + 15 ms compute). How much additional distance does the vehicle travel before braking begins if the cloud architecture is used?

    1. 0.28 meters
    2. Approximately 2.8 meters
    3. Approximately 28 meters
    4. Exactly 100 meters

    Answer: The correct answer is B. At \(100\text{ km/h}\), the vehicle travels at \(\frac{100}{3.6} \approx 27.78\text{ m/s}\). The cloud architecture adds \(100\text{ ms} = 0.1\text{ s}\) of network round-trip delay. The additional distance traveled during this delay is \(27.78\text{ m/s} \times 0.1\text{ s} \approx 2.78\text{ m}\) (~2.8 meters). In safety-critical emergency braking, a 2.8-meter delay can be the difference between stopping safely and a catastrophic collision, demonstrating why the specified 115 ms remote path fails the chapter’s 100 ms deadline. The 15 ms local detection time is only one component; the complete local response path still needs validation. The options calculating 0.28 m, 28 m, or 100 m represent arithmetic scaling errors.

    Learning Objective: Calculate the physical displacement and safety consequences of network latency in autonomous vehicle braking systems.

  3. What is the complexity tax** in ML systems engineering, and when is a simple heuristic (e.g., rule-based logic or regular expressions) superior to a deep learning pipeline?**

    Answer: The complexity tax refers to the extensive hidden operational overhead that an ML system introduces beyond its core model code, including data validation pipelines, continuous monitoring, retraining infrastructure, GPU dependencies, and model drift management. An accuracy increase from 90% to 95% alongside a maintenance increase from 1 to 40 hours/month requires comparing the value of avoided errors with the additional operating costs and risks. Those ratios alone do not establish the better choice: a simple heuristic is preferable when the ML system’s additional costs and risks outweigh the value of its improved predictions.

    Learning Objective: Evaluate the complexity tax of deploying machine learning systems compared to traditional software heuristics.

  4. In ML systems engineering, selecting a deployment paradigm based solely on benchmark model accuracy is a sound practice because hardware infrastructure can always be scaled to meet application constraints later.

    Answer: False. Selecting a deployment paradigm based solely on accuracy without evaluating physical constraints (latency floors, battery life, thermal ceilings, memory budgets, network availability) leads to deployment failures. A high-accuracy cloud model is useless if network delay violates an emergency response SLA, and an edge model that drains a mobile battery in minutes fails regardless of benchmark accuracy. Systems constraints must be co-designed upfront.

    Learning Objective: Evaluate the critical pitfall of selecting deployment paradigms based on model accuracy alone.

  5. What is the Total Cost of Ownership (TCO) calculation, and why must ML architects evaluate TCO rather than hardware purchase price or cloud VM hourly rates alone when selecting a deployment paradigm?

    Answer: Total Cost of Ownership (TCO) encompasses all direct and indirect expenses over a system’s multi-year operational lifetime, including hardware CapEx, recurring energy and cooling costs, network bandwidth/egress, reliability engineering, software maintenance, and DevOps labor. Focusing solely on hardware purchase price or cloud VM rental rates leads to false economies, because operational overhead and engineering labor can dominate the listed budget, as labor does in the chapter’s edge-server scenario. A deployment ranking requires matching accounting boundaries, service capacity, availability, and time horizon.

    Learning Objective: Evaluate how Total Cost of Ownership (TCO) analysis prevents misleading paradigm selection based on compute list prices alone.

← Back to Questions

Self-Check: Answer
  1. Why does serving always-on voice assistant traffic entirely in the cloud create an infrastructure and economic wall, and what does on-device wake-word detection actually remove?

    1. On-device wake-word detection removes the need to stream every microphone continuously to the cloud, so the data-center-count estimate applies to the remaining post-wake queries rather than to constant listening traffic.
    2. Once wake-word detection moves on device, all cloud serving disappears because speech recognition and language understanding no longer need remote models.
    3. The main problem is only that encrypted audio cannot be processed efficiently in cloud accelerators, so local wake detection solves a hardware compatibility issue rather than a traffic-scaling issue.
    4. Wake-word detection on device matters only for privacy; it does not materially change network load because continuous listening traffic and post-wake query traffic are the same scale.

    Answer: The correct answer is A. The section separates two loads: continuous listening from every microphone, and the much smaller post-wake query traffic that the hybrid design still sends to the cloud. Local wake-word detection removes the continuous always-listening upload path, but it does not eliminate all cloud serving because post-wake speech and language tasks may still use larger remote models. The claim that all cloud serving disappears ignores this hybrid split, and the privacy-only answer misses the central scaling point: filtering idle audio locally changes the traffic pattern itself, not just where it is processed.

    Learning Objective: Analyze how on-device wake-word detection changes cloud load by removing continuous listening traffic while leaving post-wake serving in place.

  2. A smart agriculture system deploys soil moisture sensors on microcontrollers performing local anomaly detection, local gateway edge servers that aggregate sensor feeds across crop fields to trigger automated irrigation valves, and a central cloud system that aggregates regional data for seasonal crop yield forecasting. Which hybrid ML integration pattern does this architecture exemplify?

    1. Pure Train-Serve Split
    2. Monolithic Cloud Offload
    3. Hierarchical Processing
    4. Linear Single-Node Pipelining

    Answer: The correct answer is C. Hierarchical Processing organizes data and decision-making across computational tiers based on timescale and capability: TinyML nodes perform millisecond-level local anomaly detection, edge gateways aggregate multi-sensor data for sub-second local irrigation actuation, and cloud infrastructure handles macro-scale long-term analytics. Train-Serve Split focuses specifically on separating centralized training from distributed serving. Monolithic Cloud Offload routes all raw sensor telemetry directly to the cloud without intermediate edge intelligence. Linear Single-Node Pipelining refers to overlapping compute within a single host.

    Learning Objective: Classify real-world multi-tier deployments into canonical hybrid ML integration patterns.

  3. What is the primary operational failure risk in a hybrid ML system where preprocessing and feature extraction are split between client devices (mobile/edge) and centralized cloud servers?

    1. Transistors in edge devices reverse polarity when receiving cloud RPC payloads.
    2. The speed of light in optical fiber decreases proportionally with the number of connected edge clients.
    3. Edge devices become unable to allocate floating-point registers during network handshakes.
    4. Training-serving skew, where slight discrepancies in feature extraction logic, library versions, or numerical precision between the edge client and cloud server cause silent model degradation.

    Answer: The correct answer is D. In hybrid systems spanning multiple tiers, participating platforms must maintain strict synchronization of feature extraction logic, tokenizers, normalization parameters, and model versions. Discrepancies between how features are computed on edge devices versus cloud training environments produce training-serving skew, leading to silent prediction errors. The options claiming reversed transistor polarity, reduced speed of light, or register allocation failures during handshakes describe fabricated physical absurdities.

    Learning Objective: Analyze the risk of training-serving skew in hybrid architectures with distributed feature pipelines.

  4. What is the economic rationale behind the Train-Serve Split** pattern in hybrid ML architectures?**

    Answer: The train-serve split works because training and serving have different cost structures: training consumes substantial centralized compute and memory during each training cycle, while inference reuses the resulting trained artifact across many predictions and may require one or more forward passes per request. For example, a cloud cluster can absorb the heavy optimization cost of a training run, then edge or mobile systems can serve many local predictions without paying a network round trip each time. The practical consequence is amortization across each training cycle: the fixed cost of producing the model is spread over many served inferences, while deployment still respects local latency and privacy constraints.

    Learning Objective: Explain how the train-serve split amortizes each training cycle’s centralized cost across many served inferences with different local constraints.

  5. **Order the steps of a Progressive Deployment evaluation for a shared task across multiple tiers:

  1. Measure each candidate and accept only those that satisfy both task quality and tier constraints
  2. Establish a reference model or artifact for that task
  3. Produce tier-specific candidate artifacts for cloud, edge, mobile, or TinyML targets
  4. Define the shared task, required quality level, and each tier’s resource budgets**

Answer: The correct order is: (4) Define the shared task, required quality level, and each tier’s resource budgets, (2) Establish a reference model or artifact for that task, (3) Produce tier-specific candidate artifacts for cloud, edge, mobile, or TinyML targets, (1) Measure each candidate and accept only those that satisfy both task quality and tier constraints. The sequence is necessary because progressive deployment starts by defining what success means under each tier’s envelope, then setting a reference point for the shared task, then creating candidate artifacts for each tier, and only afterward evaluating which ones meet both quality and resource constraints. Measuring before candidate creation or before defining the task would leave the process without a valid object to test or a criterion for acceptance.

Learning Objective: Sequence a progressive deployment workflow that evaluates tier-specific artifacts for one shared task against common quality goals and tier-specific resource budgets.

← Back to Questions

Self-Check: Answer
  1. Optimization techniques such as quantization and memory traffic reduction are mutually exclusive between tiers, meaning methods developed for TinyML microcontrollers have no applicability to cloud data center serving.

    Answer: False. Because memory bandwidth bottlenecks and the memory wall exist across all computing scales, core systems principles transfer across tiers. Techniques such as integer quantization, kernel fusion, and memory layout tuning originally developed to fit models into microcontrollers or mobile NPUs are routinely applied to cloud LLM serving to reduce HBM traffic and lower inference serving costs.

    Learning Objective: Explain how systems optimization techniques (e.g., quantization, kernel fusion) transfer across deployment scales.

← Back to Questions

Self-Check: Answer
  1. A smartphone camera pipeline takes 200 ms total: 100 ms for the image signal processor (ISP), 60 ms for ML scene classification, and 40 ms for postprocessing. If an engineering team optimizes the ML model to run \(10\times\) faster (reducing ML time from 60 ms to 6 ms), what is the overall system-level speedup?

    1. \(10.00\times\) speedup
    2. \(1.37\times\) speedup
    3. \(5.50\times\) speedup
    4. \(0.73\times\) speedup (system becomes slower)

    Answer: The correct answer is B. Prior to optimization, total latency is \(100\text{ ms} + 60\text{ ms} + 40\text{ ms} = 200\text{ ms}\). The ML model represents \(p = \frac{60}{200} = 0.30\) (30%) of total pipeline execution time. Optimizing the ML stage by \(s = 10\times\) reduces its latency to \(\frac{60}{10} = 6\text{ ms}\), resulting in a new total latency of \(100\text{ ms} + 6\text{ ms} + 40\text{ ms} = 146\text{ ms}\). The overall system speedup is \(\frac{200\text{ ms}}{146\text{ ms}} \approx 1.37\times\). Even an infinite ML speedup (\(s = \infty\)) would yield at most \(\frac{200}{140} \approx 1.43\times\) speedup because the remaining 70% of the pipeline is unoptimized. The option claiming a \(10.00\times\) system speedup commits the classic fallacy of assuming model-level speedup translates linearly to end-to-end system speedup. The options claiming \(5.50\times\) or \(0.73\times\) represent calculation errors.

    Learning Objective: Calculate end-to-end pipeline speedup using Amdahl’s law when optimizing an isolated ML component.

  2. Why does deploying a single generic FP32 model binary across diverse edge devices (e.g., Arm CPU, Apple Neural Engine, and Google Coral Edge TPU) result in suboptimal efficiency compared to per-target compilation?

    1. Generic model binaries violate cryptographic signatures required by PCI Express buses.
    2. Floating-point operations are mathematically undefined on mobile CPUs.
    3. Generic binaries cannot exploit hardware-specific kernel fusion, dedicated fixed-point INT8 matrix datapaths, or accelerator-specific on-chip SRAM memory tiling.
    4. The operating system automatically deletes untuned model weights to prevent memory fragmentation.

    Answer: The correct answer is C. Different edge accelerators feature unique hardware architectures, such as specialized INT8 tensor systolic arrays, proprietary NPU delegates, and distinct on-chip memory hierarchies. A generic model binary fails to utilize kernel fusion (which avoids round-trip memory traffic between layers), cannot map operations to dedicated low-precision datapaths, and fails to align tensor dimensions with on-chip cache lines. The options claiming PCI Express signature violations, undefined mobile float math, or automatic OS weight deletion are entirely fabricated.

    Learning Objective: Explain why hardware-aware compilation and kernel fusion are essential for efficient edge deployment.

  3. Why does choosing an on-premises edge deployment solely because its hardware amortizes to a lower monthly compute cost than a cloud VM often result in a higher Total Cost of Ownership (TCO)?

    Answer: Hardware compute cost is only one fraction of the total cost of ownership. Deploying on-premise edge fleets introduces substantial recurring operational expenses (OpEx), including distributed network engineering, on-site hardware maintenance, security patching, and DevOps reliability engineering, alongside extended development timelines. Adding these costs can erase an apparent hardware-only saving. A valid total-cost verdict requires the cloud and edge budgets to include comparable operating costs, capacity, availability, and accounting periods; the chapter’s cloud-compute-only figure does not supply that matched comparison.

    Learning Objective: Evaluate the pitfall of ignoring operational expenses and DevOps labor when calculating edge ML deployment costs.

  4. Increasing the quantity of training data is guaranteed to continuously improve deployed model performance regardless of model capacity, label noise, or domain distribution shift.

    Answer: False. Data scaling benefits are bounded by three critical constraints: model capacity (a small model saturates and cannot absorb more information), data quality (noisy, mislabeled, or redundant data harms accuracy), and distribution alignment (adding massive out-of-domain data does not improve, and can degrade, performance on target deployment distributions).

    Learning Objective: Explain the physical and statistical limits that prevent data quantity from guaranteeing deployment accuracy gains.

  5. What is kernel fusion in ML compilers, and how does it optimize memory-bound inference pipelines?

    Answer: Kernel fusion is an optimization technique where a compiler merges multiple adjacent operations in a neural network graph (such as Conv2D, BatchNorm, and ReLU) into a single executed kernel. By computing intermediate values directly in high-speed processor registers or on-chip SRAM rather than writing them back to off-chip DRAM and reading them again for the next layer, kernel fusion drastically reduces off-chip memory traffic (\(D_{\text{vol}}/\text{BW}\)) and kernel launch overhead (\(L_{\text{lat}}\)).

    Learning Objective: Explain how kernel fusion reduces memory traffic and kernel launch overhead in inference pipelines.

← Back to Questions

Back to top