7 ML Frameworks
Purpose
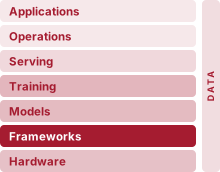
Architecture stack focus for this chapter.
Why does the framework silently constrain every decision that comes after it?
Model equations do not execute themselves. A framework translates an architecture into work that hardware can run, and that translation is not neutral. It decides when operations execute, what intermediate state training retains, how memory is allocated, and which deployment targets can use the resulting artifact. These choices shape more than speed. They also determine what can be debugged directly, what the compiler can optimize, and whether the same model survives the path from a research environment to a production runtime. The same model expressed through two execution paths can differ in speed or memory use by several times, a gap that no amount of model tuning recovers when the framework hides the structure a compiler needs. The abstractions that make experimentation convenient therefore create long-lived commitments. Once a project accumulates checkpoints, modules, data loaders, serving formats, and team expertise around a framework, changing it becomes a system migration rather than a library substitution, measured in engineer-months rather than afternoons. A framework well suited to rapid exploration can expose too little structure for efficient deployment, while a constrained execution path can sacrifice the flexibility needed during discovery. Because these choices meet in one software layer, a local convenience can become a downstream performance or portability constraint. The engineering question is not which framework is universally best, but which trade-offs the workload, team, and target machine can afford to make fixed. Understanding frameworks is therefore about reasoning through those system choices rather than learning transient API syntax, which changes with each release while the underlying trade-offs persist. In D·A·M terms, the framework mediates algorithm-machine co-design by turning algorithmic intent and data representation into executable work under machine constraints.
Learning Objectives
- Explain how frameworks mediate algorithm-machine co-design through execution, differentiation, and hardware abstraction
- Compare eager, graph, and just-in-time compiled execution using dispatch overhead, kernel fusion, compilation cost, and deployment constraints
- Analyze how reverse-mode differentiation computes every gradient in one backward pass and which forward state it must save or recompute
- Estimate host-to-device transfer time and explain how tensor layout, data type, and device placement determine which kernel runs and whether transfers overlap computation
- Implement module abstraction patterns for parameter discovery, mode behavior, serialization, and hooks
- Calculate training-step FLOPs, memory traffic, and dispatch overhead to identify whether a step is bound by dispatch, memory traffic, or arithmetic
- Select a development framework and deployment path based on model, hardware, team, and deployment requirements
Explore the concepts in this chapter
The volume’s concept map, opened on this chapter. Select a concept to read how it connects to ideas in other chapters. Open the full map ↗
7.1 Three Framework Problems
A few lines of Python can express one decoding step of a language model: embed the newest token, pass it through every transformer block, and project the result onto the vocabulary. The accelerator never sees those lines. It sees a stream of kernels,1 the compiled routines it executes one launch at a time, together with memory allocations and copies, and the machine learning framework is the software that turns the first into the second. Network Architectures fixed what work each architecture performs. It left open when each operation runs, how its gradients are computed, and which kernel on which device executes it.
1 Kernel (GPU): In GPU programming, a kernel is the function dispatched to execute in parallel across thousands of threads. Each kernel launch costs about 5 \(\MicroUnitPrefix\)s of CPU-side overhead for parameter assembly and GPU signaling, and an eager framework’s Python dispatch adds about 10 \(\MicroUnitPrefix\)s more before the launch, the split this chapter’s overhead model uses. Small, unfused operations therefore spend more time on launch overhead \((\Latency)\) than on useful arithmetic. Reducing kernel count through fusion is a direct attack on the overhead term of the iron law.
GPT-2 XL, the book’s bandwidth-bound lighthouse, shows what those open questions cost. One batch-one decoding step reads 3 GB of FP16 weights, which takes about 0.9 ms at the 3.35 TB/s memory bandwidth of an H100, the book’s reference accelerator. Executed one operation at a time, the same step issues about 12 kernels in each of its 48 transformer blocks, 576 launches in all. At 5 μs of driver overhead per launch, launching alone takes 2.9 ms, about 3× the weight read. An eager Python framework adds 10 μs of dispatch to every operation, which raises the host’s time to issue the step to 8.6 ms, about 10× the time the accelerator needs to read its weights. The accelerator spends most of the step waiting for its next instruction. Whether the step costs one millisecond or ten depends on what the framework does with those few lines of Python: run each operation as it is called, or capture the sequence, fuse it into fewer kernels, and launch it as a unit.
Every ML framework, regardless of API or design philosophy, must solve three core problems. The first is the execution problem: deciding when and how computation runs. A framework can execute operations immediately as written (eager execution2) or first construct a computational graph3 (a record of operations and their data dependencies, developed in section 7.3.1) to optimize before launching device kernels (graph execution). The decoding step above is an execution problem, and this choice sets the trade-off between interactive debugging and whole-program compiler optimization.
2 Eager execution: This mode executes each operation immediately, which enables direct debugging with standard tools but sacrifices the global view needed for graph-level optimizations. Without capturing a larger region of computation, an eager runtime cannot fuse across that region or preplan its memory, leaving workload-dependent optimization opportunities for compilers such as torch.compile.
3 Computational graph: Optimizing before executing is the design choice that separates graph execution from eager execution. Capturing the program as a data structure lets a framework fuse compatible operations into fewer GPU kernels before execution, reducing launch overhead and intermediate memory traffic. The engineering cost of this visibility is that the executed program differs from the source code, making debugging harder, a trade-off every graph-based framework must justify against the performance gain.
With an execution strategy in place, the framework must solve the differentiation problem: computing gradients automatically. Because gradient-based training requires derivatives of a scalar loss with respect to millions or billions of parameters, manual calculus is impossible at scale. Frameworks implement automatic differentiation by registering derivative rules across supported operator compositions, chaining vector-Jacobian products while managing numerical precision and the memory overhead of intermediate activations retained for backward passes.
↩︎ Reverse-mode automatic differentiation and computational graph traversal for gradient computation are established in Gradient computation and backpropagation.
Tillet, Philippe, H. T. Kung, and David Cox. 2019. “Triton: An Intermediate Language and Compiler for Tiled Neural Network Computations.” Proceedings of the 3rd ACM SIGPLAN International Workshop on Machine Learning and Programming Languages, 10–19. https://doi.org/10.1145/3315508.3329973.
Nickolls, John, Ian Buck, Michael Garland, and Kevin Skadron. 2008. “Scalable Parallel Programming with CUDA: Is CUDA the Parallel Programming Model That Application Developers Have Been Waiting For?” Queue 6 (2): 40–53. https://doi.org/10.1145/1365490.1365500.
The third problem is hardware abstraction: targeting diverse hardware from a single interface. The same model definition should be expressible across CPUs, GPUs, Tensor Processing Units (TPUs), and mobile accelerators, even though each target presents distinct memory hierarchies, instruction sets, and interconnect bandwidths. For every operation the framework must choose which kernel runs on which device, with which memory layout and precision. Within the GPU domain, framework ecosystems increasingly expose custom-kernel languages such as Triton (Tillet et al. 2019), allowing developers to write high-performance, block-level kernels without hand-crafting low-level CUDA (NVIDIA’s GPU programming platform (Nickolls et al. 2008)) or device assembly.
These three problems are tightly coupled: the execution model dictates when differentiation data structures are recorded, while the hardware abstraction layer determines which graph transformations can be lowered to the target. In the terms of the iron law of ML systems (principle 3), the model architecture fixes the operation count \(\Operations\), and the framework shapes the remaining terms. Execution strategy bears most directly on the fixed overhead \(\Latency\), differentiation on the bytes moved \(\DataVolume\) (and on \(\Operations\), since the backward pass adds work), and abstraction on the hardware efficiency \(\EfficiencyHw\). These are emphases rather than exclusive assignments, since fusion, for example, cuts both launches and traffic, and the chapter uses this one mapping throughout. The framework plays the role for a model that a compiler plays for a C program. The correspondence is literal: modern frameworks include optimizing compilers, such as Accelerated Linear Algebra (XLA) (Google 2025) and TorchInductor (Ansel et al. 2024), that lower a captured graph to machine code for the target accelerator. The formal definition below makes that role precise and separates frameworks from numerical libraries such as NumPy.
Definition 7.1: Machine learning frameworks
Machine learning frameworks are software systems that translate high-level mathematical model definitions into hardware-optimized execution plans by managing the computational graph, automatic differentiation, kernel dispatch, and memory allocation across the hardware hierarchy.
- Significance: Frameworks shape every iron law term that the model itself does not fix: the bytes moved \((\DataVolume)\), the hardware efficiency achieved \((\EfficiencyHw)\), and the fixed overhead paid \((\Latency)\). Compiler-backed kernel fusion, for example, can eliminate writes and subsequent reads of intermediate values between compatible operations. Fusing a matrix multiplication, bias add, and rectified linear unit (ReLU) changes how the same mathematics reaches hardware without changing the model.
- Distinction: Unlike a numerical library such as NumPy, which normally evaluates each operation as it is called, an ML framework can capture or defer execution to analyze a larger computational graph and apply cross-operation optimizations: kernel fusion, memory layout transformations, and parallel scheduling. Those optimizations require visibility beyond separately dispatched operations.
- Common pitfall: A frequent misconception is that frameworks are interchangeable API wrappers. Framework choice determines which compiler paths are available. PyTorch can recover graph-level optimization from eager code through
torch.compile(), while TensorFlow and JAX commonly rely on XLA-backed compilation paths that lower operations to target hardware. Moving from eager execution to a compiler path can change throughput materially, but the gain depends on model structure, shapes, operator support, and hardware.
An ML framework translates logical intent into physical execution under the constraints of the iron law. It decides how to partition computation across memory hierarchies, when to trade numerical precision for throughput, and how to schedule operations so that whichever term dominates (data movement \(\DataVolume\), arithmetic computation, or launch latency \(\Latency\)) is minimized. The framework is where the governing physics developed throughout this book becomes executable code.
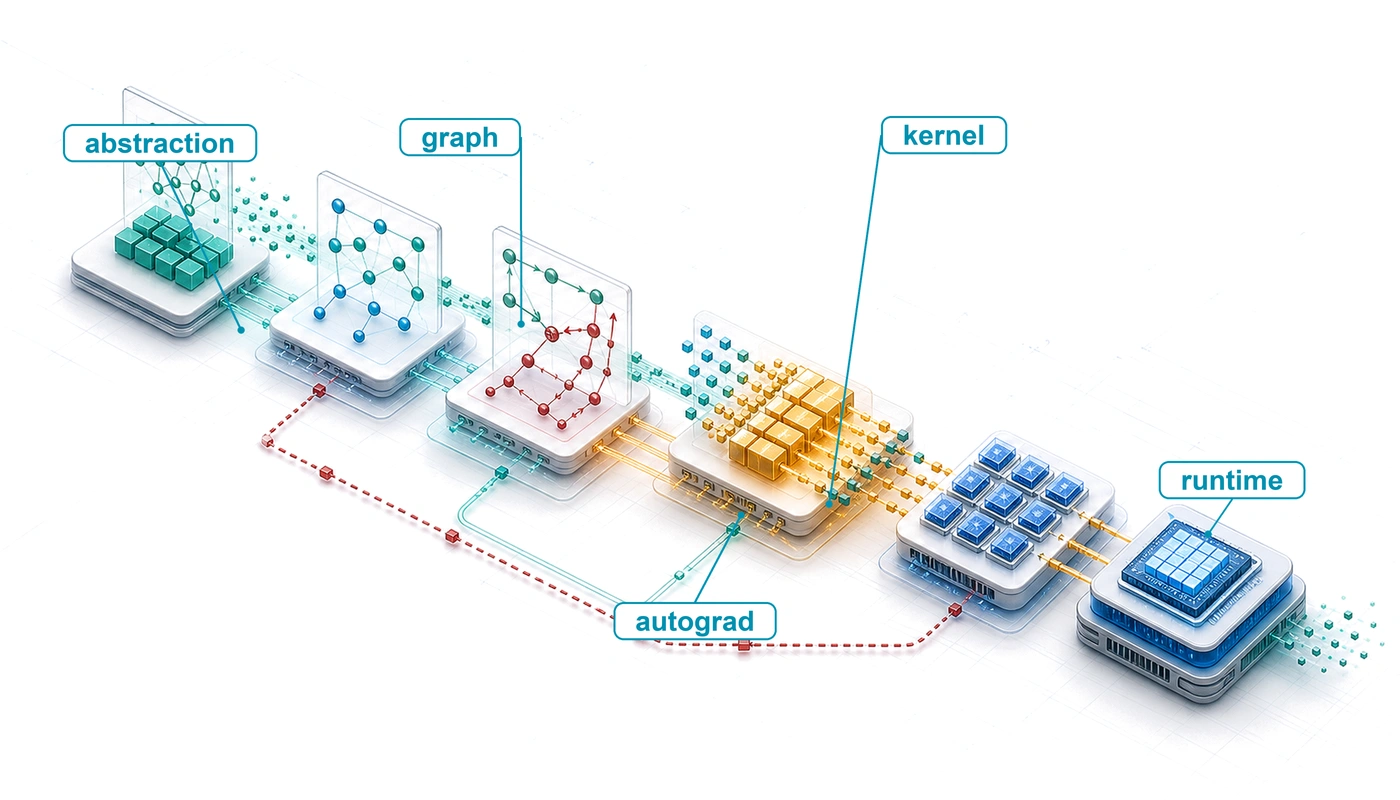
This chapter follows a model’s graph downward, one level at a time (table 1): the decoding step above carries the execution level, and a two-layer MNIST training step, traced at the end, gathers every level. After a brief look at how the layers of the stack came to exist, the execution section takes the graph to kernels and decides when each operation runs. The differentiation section builds the backward graph that training adds and accounts for the values it must keep. The abstraction section reaches the bottom of the descent, where tensors occupy device memory and kernels operate on them. Modules then assemble those pieces back into a model, and the anatomy of one training step traces a single step through every level. The chapter closes with the major frameworks and how to choose among them.
| Section | Level of the graph | Question it answers | Iron law term most affected |
|---|---|---|---|
| Evolution of Framework Abstractions | Libraries, autodiff, compilers | How the levels of the stack came to exist | (context) |
| Execution: From Graphs to Kernels | Graph to kernels | When each operation runs, and how many launches it costs | Fixed overhead \(\Latency\) |
| Differentiation: Automatic Gradient Computation | Forward graph to backward graph | How gradients are computed, and which values must be kept | Bytes moved \(\DataVolume\), and \(\Operations\) |
| Abstraction: Tensors, Devices, and Operations | Tensors in device memory | Where each value lives and which kernel runs on it | Hardware efficiency \(\EfficiencyHw\) |
| Modules: From Operations to Models | Operations to a model | How parameters and training state are organized | (organization) |
| Anatomy of a Training Step | Execution, differentiation, and abstraction in one step | Where one step’s time and bytes go | All terms |
| Major Frameworks and Choosing a Framework | Complete systems | Which framework fits a given constraint | All terms |
Automating this machinery (recording operation graphs, allocating gradient buffers, traversing dependencies in reverse, and dispatching hardware kernels) did not happen all at once. Execution, differentiation, and abstraction emerged sequentially as responses to scaling bottlenecks in earlier numerical tools, a four-decade progression from hand-tuned assembly routines to compiled graph runtimes.
Self-Check: Question
A team reports that their model executes correctly on CPU but produces mismatched tensor shapes and silent numerical corruption when switched to a GPU backend because some operators silently default to a different memory layout (such as NCHW versus NHWC). Which of the three fundamental framework problems does this failure most directly expose?
- The hardware abstraction problem, because one unified model interface must preserve consistent semantic behavior, memory layouts, and numerical behavior across diverse hardware backends
- The execution problem, because the operators were evaluated eagerly instead of being captured into a static graph
- The differentiation problem, because the backward pass failed to propagate gradients through non-contiguous strides
- A data engineering pipeline defect unrelated to framework runtime responsibilities
Explain how viewing an ML framework as a compiler that lowers a model graph to hardware, rather than merely a numerical library like NumPy, changes an engineer’s expectations regarding framework selection and optimization under the systems iron law.
True or False: Two frameworks that expose nearly identical user-facing Python tensor APIs and target the same GPU hardware will necessarily provide equivalent graph-level operator fusion and ahead-of-time compilation capabilities.
An engineering organization chose a specialized research framework for rapid prototyping, only to discover later that the framework lacks export paths to their production edge accelerators, requiring months of manual re-implementation. Applying the chapter’s infrastructure-commitment principle, what is the key systems insight?
- Framework choice is easily reversible because weight arrays can be loaded into any runtime with zero engineering overhead
- Framework selection functions as a durable infrastructure commitment whose reversal cost compounds across model checkpoints, serving runtimes, CI/CD pipelines, and hardware access
- The primary failure was selecting an overly compact model architecture that failed to saturate edge accelerator memory
- Hardware abstraction layers eliminate all differences between training frameworks and production inference engines
7.2 Evolution of Framework Abstractions
In 1979, writing a matrix multiplication in Fortran that used the hardware efficiently required deep knowledge of cache lines, register scheduling, and vector units. By the late 2010s, a single line of Python (torch.matmul(A, W)) could dispatch to a tuned implementation without the programmer knowing the details of the hardware. Four decades of abstraction closed that gap, each layer removing a bottleneck that made the previous generation impractical at scale. Each layer automated a job the layer below left to the programmer. History built the layers from the bottom up, starting with tuned kernels and ending with graph compilers; the rest of this chapter walks them from the top down, starting from the graph a model defines.
The first layer established reusable hardware primitives. The Basic Linear Algebra Subprograms (BLAS)4 standardized low-level linear-algebra operations (Lawson et al. 1979), and LAPACK (Anderson et al. 1999) built factorizations and eigensolvers on top of them. Naive nested loops saturate memory bandwidth long before the arithmetic units reach peak throughput. BLAS let numerical software delegate these operations to vendor libraries tuned for each processor’s cache sizes, vector widths, and register files. Its Level 3 extension added the matrix-matrix routines, such as matrix multiplication (C = A @ B),5 that dominate ML workloads (Dongarra et al. 1990). The second layer, NumPy6 (Harris et al. 2020), wrapped those libraries in Python: the interpreter manages control flow and array metadata (shape, strides, and data type), while compiled code runs the inner loops over contiguous buffers. That division of labor, high-level intent in an interpreted language and inner loops in native code, became the template for every framework that followed.
4 BLAS (basic linear algebra subprograms): The 1979 API specification at the bottom layer of the stack; it fixed a set of Fortran-callable vector operations and separated the public routine names from the machine-specific implementation beneath them. Every framework above it inherits the same division: call a standard linear-algebra routine from any language and let a tuned vendor library target the processor. On NVIDIA GPUs, the tuned path for general matrix multiply (GEMM), a Level 3 routine added in 1990, is cuBLAS (NVIDIA 2024).
NVIDIA. 2024. cuBLAS: CUDA Basic Linear Algebra Subprograms.
Lawson, Charles L., Richard J. Hanson, David R. Kincaid, and Fred T. Krogh. 1979. “Basic Linear Algebra Subprograms for Fortran Usage.” ACM Transactions on Mathematical Software 5 (3): 308–23. https://doi.org/10.1145/355841.355847.
Anderson, Edward, Zhaojun Bai, Christian Bischof, L. Susan Blackford, James Demmel, Jack Dongarra, Jeremy Du Croz, et al. 1999. LAPACK Users’ Guide. 3rd ed. SIAM. https://doi.org/10.1137/1.9780898719604.
5 GEMM: The matrix-matrix primitive behind C = A @ B. Hardware vendors hand-tune GEMM for their specific chips because dense layers, attention projections, and convolution lowering all rely on matrix multiplication, making this one routine a performance floor for many frameworks above it in the stack. Its high arithmetic intensity makes GEMM the operation most able to approach peak compute throughput, while small or misaligned shapes often fall back to much lower utilization.
Dongarra, Jack J., Jeremy Du Croz, Sven Hammarling, and Iain S. Duff. 1990. “A Set of Level 3 Basic Linear Algebra Subprograms.” ACM Transactions on Mathematical Software 16 (1): 1–17. https://doi.org/10.1145/77626.79170.
6 NumPy (numerical Python): In 2005, Travis Oliphant unified two competing Python array libraries (Numeric and Numarray) into a single BLAS-backed package. Its pattern of writing logic in Python and executing loops in compiled code became the design template for ML frameworks: PyTorch tensors and TensorFlow arrays extend the same \(\TensorAxisCount\)-dimensional array abstraction to GPUs.
Harris, Charles R., K. Jarrod Millman, Stéfan J. van der Walt, Ralf Gommers, Pauli Virtanen, David Cournapeau, Eric Wieser, et al. 2020. “Array Programming with NumPy.” Nature 585 (7825): 357–62. https://doi.org/10.1038/s41586-020-2649-2.
7 Theano: Developed at the Montreal Institute for Learning Algorithms (MILA) under Yoshua Bengio starting in 2007, Theano was an early and influential Python framework that compiled symbolic mathematical expressions into optimized CPU and GPU code via computational graphs (Bergstra et al. 2010; Team et al. 2016). It demonstrated that a Python-defined computation graph could be compiled for GPU execution without requiring the researcher to write CUDA code. Mila ended active development of Theano in 2017 (Mila 2026).
Bergstra, James, Olivier Breuleux, Frédéric Bastien, Pascal Lamblin, Razvan Pascanu, Guillaume Desjardins, Joseph Turian, David Warde-Farley, and Yoshua Bengio. 2010. “Theano: A CPU and GPU Math Compiler in Python.” Proceedings of the Python in Science Conference 4: 18–24. https://doi.org/10.25080/majora-92bf1922-003.
Team, The Theano Development, Rami Al-Rfou, Guillaume Alain, Amjad Almahairi, Christof Angermueller, Dzmitry Bahdanau, Nicolas Ballas, et al. 2016. “Theano: A Python Framework for Fast Computation of Mathematical Expressions.” arXiv Preprint.
Mila. 2026. Open Source Software.
The third layer automated gradient computation. NumPy users still derived and coded backpropagation by hand, an error-prone process that does not scale to deep networks. Deep learning frameworks such as Theano,7 TensorFlow (Abadi et al. 2016), and PyTorch (Paszke et al. 2019) made automatic differentiation a runtime primitive: by recording the forward computation as a graph, they construct the backward computation automatically. That automation let the bitter lesson operate at the pace of research. Once a new architecture no longer needed a hand-derived backward pass, general methods that scale with computation could be tried as quickly as their forward functions could be written.
↩︎ The bitter lesson, that general methods which exploit growing computation outlast hand-engineered approaches, is established in The Bitter Lesson.
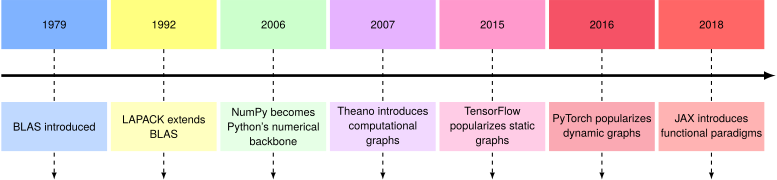
Across that history (figure 1), the milestones run from BLAS and LAPACK routines through NumPy vectorization to symbolic graph capture in Theano and TensorFlow, dynamic graphs in PyTorch, and functional transformations in JAX. Each generation preserved the vendor-tuned kernel layer beneath it while raising the level of abstraction at which engineers express and differentiate models.
Each generation hid details that consumed engineering effort in the previous one, and each introduced new trade-offs. BLAS hid assembly-level optimization but fixed the interface. NumPy hid memory management but left differentiation manual. Modern frameworks hide gradient computation but force a choice among execution models. Every layer also hides assumptions about the data it passes along: each operation expects its inputs to have a particular shape, data type, device, and, for physical quantities, unit. When nothing checks those expectations at the boundary, correct components can compose into a wrong system.
War Story 7.1: The interface that forgot its units (1999)
Context: NASA’s Mars Climate Orbiter depended on ground software, spacecraft software, navigation teams, and contractor interfaces all agreeing on the physical meaning of exchanged values (Mars Climate Orbiter Mishap Investigation Board 1999).
Mechanism: Ground software supplied by Lockheed Martin computed thruster impulse in English units (pound-force seconds), while JPL navigation software consumed the values assuming SI units (newton-seconds), a 4.45\(\times\) implicit unit mismatch.
Impact: On September 23, 1999, the spacecraft was lost after passing behind Mars (occultation). Its corrected 57 km periapsis, rather than the planned 226 km, was judged too low for survival.
Response: The board recommended unit-consistency checks, specification audits of transferred data, and stronger end-to-end verification of ground software.
Systems lesson: Two pieces of correct code can compose into a wrong system when the meaning of the values they exchange is implicit. ML frameworks meet the same failure whenever tensor memory layouts (such as channels-first NCHW [\(\text{Batch} \times \text{Channels} \times \text{Height} \times \text{Width}\)] vs. channels-last NHWC [\(\text{Batch} \times \text{Height} \times \text{Width} \times \text{Channels}\)]), quantization scale factors, or physical feature units differ across pipeline stages. The outputs look plausible but quietly corrupt downstream inference. Frameworks guard against the tensor cases by checking, at every operation, that its inputs have the expected shape, data type, and device.
Mars Climate Orbiter Mishap Investigation Board. 1999. Mars Climate Orbiter Mishap Investigation Board Phase i Report. National Aeronautics; Space Administration.
A framework can run those checks as each operation executes, when the failing line and its intermediate values are directly visible, or before execution, when a captured graph can be validated and optimized as a whole. When checks and optimizations happen is the execution problem. It is the first framework design choice because runtime dispatch and graph capture determine both the debugging experience and what optimizations automatic differentiation and hardware mapping can later exploit.
Self-Check: Question
While NumPy provided high-performance linear algebra by wrapping BLAS in Python, what critical scaling bottleneck did it leave unaddressed that motivated the development of deep learning frameworks such as Theano, TensorFlow, and PyTorch?
- Inability to execute matrix multiplications on single-core CPU architectures
- Lack of an \(n\)-dimensional array data structure in scientific computing
- The requirement for manual gradient derivation and hand-written backpropagation passes for multi-layer neural networks
- Inability to run compiled Fortran and C routines through high-level scripting languages
Explain why the relationship between rungs on the ladder of abstraction (such as BLAS/LAPACK, NumPy, and modern deep learning frameworks) is characterized by inheritance rather than replacement.
Order the following historical computing milestones in the evolution of numerical and machine learning software abstractions, from earliest (1979) to most recent (2018):
JAX introduces functional composable transformations and XLA compilation
BLAS standardizes reusable low-level linear algebra primitives
Theano introduces compiled Python computational graphs for GPUs
NumPy establishes Python’s unified \(n\)-dimensional array and vectorization standard
PyTorch introduces dynamic define-by-run execution graphs
LAPACK extends BLAS with higher-level numerical routines (e.g., SVD, factorizations)
The architectural design pattern established by NumPy, where high-level control logic is written in an expressive interpreted language (such as Python) while inner numerical loops are delegated to compiled C/Fortran libraries, is known as ____.
7.3 Execution: From Graphs to Kernels
Consider two engineers writing the same neural network. The first debugs interactively, printing tensor shapes after each operation, inspecting intermediate values, and stepping through code with pdb. The second waits through a compilation step, then watches a model built from many small operations run faster while losing that direct, line-by-line view of intermediate state. Both are correct; they have made different choices about the execution problem, the question of whether operations should execute immediately as written or be recorded for later execution. It sets debugging workflow, deployment options, and peak hardware utilization. The GPT-2 XL decoding step that opened this chapter is the case in point: issued one operation at a time, it keeps the accelerator waiting on the host for most of the step.
7.3.1 Computational graphs
If a runtime sees only one Python operation at a time and forgets it as soon as the kernel returns, it cannot know which intermediate tensors later gradient rules will need or which adjacent operations could share registers on the accelerator. To plan across operations, a framework represents the program the same way Network Architectures represented model architectures, as a computational graph: a directed acyclic graph (DAG) where nodes represent operations and edges represent data dependencies. The rest of this chapter follows that graph down toward the hardware. It is the same structure that backpropagation traverses in reverse, here serving as the framework’s internal model of the computation for scheduling and optimization as well.
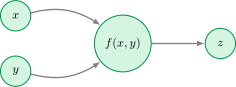
A graph decouples the mathematical operations from the order in which hardware evaluates them. In the minimal case (figure 2), directed edges route input variables \(\FunctionInputVariable\) and \(\FunctionSecondInputVariable\) into the central transformation operator \(\IllustrativeFunction(\FunctionInputVariable, \FunctionSecondInputVariable)\), which emits the output variable \(\FunctionOutputVariable\).
Real machine learning models require much more complex graph structures. Figure 3 partitions this system interaction into two coupled domains: the left container isolates a six-node neural network DAG with explicit dataflow edges, while the right container houses the runtime components (memory management and device placement) that interface with it.
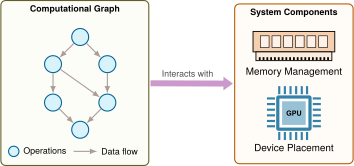
This graph representation is more than a visualization; it is the data structure that enables both efficient execution and automatic differentiation. Without a graph that spans multiple operations, a runtime must launch each operator in isolation and materialize every intermediate tensor in off-chip memory before the next kernel can read it.
7.3.2 The memory wall and kernel fusion
That isolation is costly whenever an unoptimized runtime evaluates a sequence of element-wise operations such as \(\text{LayerNorm} \to \text{Dropout} \to \text{ReLU}\) as three separate GPU kernels. The first reads inputs from off-chip high-bandwidth memory (HBM) and writes intermediate results back to HBM, the second reads those results and writes back again, and the third reads them a final time. Shuttling intermediate tensors across the external memory bus three times dwarfs the arithmetic time and leaves compute units idle.
This bottleneck stems from the memory wall, the widening gap between compute growth and memory-bandwidth growth that equation 2.3 quantifies. An accelerator performs arithmetic far faster than it fetches operands from off-chip memory. Most individual operation types in a neural network (activations, normalizations, and other element-wise operations) are therefore memory bound, limited by data movement. The large matrix multiplications that dominate total arithmetic can be compute bound, limited by arithmetic throughput. Performance Bounds formalizes the boundary between the two regimes. On-chip storage (registers and SRAM scratchpads) runs at tens of terabytes per second but holds only tens of megabytes, whereas off-chip HBM or GDDR holds tens to a few hundred GB behind external buses with hundreds of cycles of latency.
↩︎ The memory wall and the growth-rate ratio behind it are established in Physical Constraints on Deployment.
8 Fused attention kernel: A fused attention kernel combines the \(\AttentionQueryMatrix\AttentionKeyMatrix^T\) product, softmax, and value-weighted output into a tiled implementation that keeps intermediate values in on-chip memory rather than materializing the full attention matrix in HBM. FlashAttention, introduced in Memory requirements, is the canonical named example. The framework lesson is broader than the specific algorithm: fusion can shift an operation’s position on the roofline model from bandwidth-limited toward throughput-limited execution by reducing round-trips through external memory.
Dao, T., D. Y. Fu, S. Ermon, A. Rudra, and C. Ré. 2022. “FlashAttention: Fast and Memory-Efficient Exact Attention with IO-Awareness.” Advances in Neural Information Processing Systems (NeurIPS) 35: 16344–59. https://doi.org/10.52202/068431-1189.
Kernel fusion (also called operator fusion) fixes memory-bound chains by combining them into a single kernel that avoids intermediate HBM traffic. Instead of three round-trips to HBM, a fused kernel loads inputs from HBM once, evaluates normalization, dropout, and ReLU entirely within on-chip registers and SRAM, and writes only the final output tensor back to HBM, cutting memory traffic by roughly 3\(\times\). In general, for \(\TensorElementCount\) elements of \(\ElementStorageSize\) bytes each, fusing a chain of \(\ChainedOperationCount\) elementwise operations into one kernel reduces idealized read-and-write traffic from \(2\ChainedOperationCount \TensorElementCount\ElementStorageSize\) to \(2\TensorElementCount\ElementStorageSize\) bytes, a derivation worked in Operator fusion. Fusion also removes all but one of the chain’s kernel launches. Attention kernels8 use the same principle at larger scale. Instead of materializing the full attention matrix in HBM, a fused implementation can keep tiles close to the compute units, cut HBM accesses by up to 9\(\times\), and produce workload-specific speedups from 15 percent to 3\(\times\) (Dao et al. 2022).
↪ The on-chip limits that decide which intermediates a fused kernel can keep on a specific accelerator are developed in Kernel fusion on the accelerator.
Framework compilers can fuse only operations that are visible to them simultaneously. When an eager runtime dispatches operations individually, each kernel launch executes in isolation, concealing cross-operation fusion and buffer-reuse opportunities. Capturing a broader region of computation into a deferred graph removes that isolation: the compiler can examine an entire sequence of dependencies, establish intermediate tensor lifetimes, and fuse compatible operations before dispatching work to the accelerator.
The computational graph enables global optimization, but the timing of its construction forces a four-way trade-off across debugging, optimization, deployment, and flexibility. Consider an elementary expression such as y = x * 2. Evaluating the multiplication immediately yields a concrete tensor in y so developers can inspect intermediate values and branch on computed tensor values with standard Python control flow, but the runtime sees only one operation at a time. Deferring execution records the operation symbolically into a dependency graph that can be fused, memory-planned, and exported to run without the host interpreter. Because no single execution model serves all four demands at once, modern frameworks span three strategies: eager execution with dynamic graphs, static computation graphs, and hybrid approaches that combine just-in-time (JIT) compilation with eager development.
7.3.3 Eager execution with dynamic graphs
When a tensor shape mismatches or an activation turns to NaN mid-layer, a deferred graph fails far from the Python line that created the operation, hiding the intermediate values that caused the fault. Eager execution, also called define-by-run, avoids that disconnect by evaluating each operation as soon as the program calls it and building the computation graph dynamically at runtime.
Example 7.1: Eager vs. graph execution code comparison
PyTorch (eager execution):
import torch

x = torch.tensor([1.0, 2.0])
y = x * 2
print(f"Intermediate value: {y}")  # Works immediately
z = y.sum()
TensorFlow 1.x (static graph):
import tensorflow as tf

x = tf.placeholder(tf.float32)
y = x * 2
# print(y) -> Prints Tensor("mul:0"...), not value!
z = tf.reduce_sum(y)

with tf.Session() as sess:
    result = sess.run(z, feed_dict={x: [1.0, 2.0]})
Systems insight: Eager execution exposes intermediate values as ordinary runtime state, which makes debugging direct. Static graphs stage computation before execution, which enables whole-graph optimization but changes the debugging model.
In this define-by-run model, when host code evaluates y = x * 2, the runtime dispatches the multiplication kernel to the device command queue and returns a tensor handle for subsequent operations. Device execution can continue asynchronously; dependent operations must wait for the result, and reading its value on the host can require synchronization.
Immediate evaluation gives eager code the flexibility of ordinary programming: developers can print intermediate values, use conditionals based on computed results, and debug with standard tools. The framework records operations as they happen, constructing a dynamic graph that reflects the actual execution path taken.
For gradient computation, the framework records a history of operations in what is called an autograd tape,9 a transient data structure built during execution. Each tensor operation creates a node that records: the operation performed, references to input tensors, and how to compute gradients. These nodes form a DAG that records the actual path taken during forward-pass execution rather than a graph fixed in advance. Listing 1 shows how PyTorch records operations as they execute in its default eager mode.
9 Autograd tape: The tape’s own nodes are small; its memory cost comes from the tensors they reference. That footprint grows with model depth and sequence length as saved activations accumulate until backpropagation releases them, which is why deep models retain only selected activations and recompute the rest (activation checkpointing) to avoid out-of-memory failures.
import torch

x = torch.tensor([1.0], requires_grad=True)
y = x * 2  # Executes immediately; records MulBackward node
z = y + 1  # Executes immediately; records AddBackward node
# The autograd tape exists NOW, built during execution
After these two operations, the framework has constructed an autograd tape with two nodes: one for the multiplication and one for the addition. The tape records that z depends on y, and y depends on x.
Calling z.backward() traverses this tape in reverse topological order, applying the chain rule at each node:
- Compute \(\frac{\partial \FunctionOutputVariable}{\partial \FunctionOutputVariable} = 1\) (seed gradient)
- Call
AddBackward0.backward()\(\rightarrow \frac{\partial \FunctionOutputVariable}{\partial \TapeIntermediateResult} = 1\) - Call
MulBackward0.backward()\(\rightarrow \frac{\partial \FunctionOutputVariable}{\partial \FunctionInputVariable} = 2\) - Accumulate gradient in
x.grad
After backward() completes, autograd normally releases the saved state needed by its backward rules. Other live references can still retain tensor storage and graph nodes. The next forward pass builds a new graph. Values needed for gradients are saved during the forward pass and remain available until backward consumes them, so their memory cost spans both phases rather than appearing only during backward.
Example 7.2: In-place operations can break gradients
Scenario: An engineer applies an in-place mutation (
x += 1) within a custom PyTorch activation function to reduce memory allocations.
Diagnosis: In-place operations overwrite tensor memory containing forward-pass activations required by the autograd tape for backward-pass gradient computation, triggering a runtime version-counter error (PyTorch Contributors 2026a). PyTorch enforces this safety invariant by maintaining an integer version counter on each tensor that increments on every in-place write. If a saved tensor’s version at backward execution differs from its version recorded during the forward pass, autograd throws an error, because the activation required by the derivative rule was modified in place.
Systems lesson: Framework automatic differentiation depends on immutable forward-pass activation records. In-place writes to a saved tensor invalidate the autograd record, so PyTorch stops with an error rather than compute a wrong gradient.
PyTorch Contributors. 2026a. PyTorch Autograd Mechanics.
Recording that tape and launching device work happen inside the same one-operation-at-a-time loop (figure 4). Python defines an operation, the runtime records its backward node and enqueues its device work, and control returns to Python for the next call while the device may execute asynchronously. When the runtime decides what to launch, it sees only the current operation rather than a whole region of future calls.

The dynamic autograd tape expresses data-dependent behavior directly in the host language. Conditionals and loops can depend on tensor values computed during execution, enabling algorithms such as beam search, dynamic-length recurrent models, or adaptive compute paths that adjust their execution based on intermediate activations. Static graphs can also represent data-dependent control flow and dynamic dimensions through graph operations, but eager execution makes these patterns natural to write and debug in Python. Because operations are issued immediately, developers can print tensors, inspect values, and use standard debuggers (pdb, breakpoints) to diagnose errors much as they would in another Python program.
This flexibility imposes latency costs that map directly to the iron law. Each training step constructs an autograd tape dynamically, adding host-side Python dispatch latency and tape allocation to \(\Latency\). Because every operation traverses the framework dispatcher before a device kernel launches, host overhead quickly dominates when individual kernels execute in single-digit microseconds. Eager execution also lacks a whole-graph view, preventing the framework from fusing element-wise chains into single GPU launches (which would cut \(\DataVolume\)) or pre-allocating a static memory arena for intermediate activations (which would cut allocation overhead in \(\Latency\)). The autograd tape must retain every tensor requested by registered backward rules, holding memory until backpropagation consumes it. Together, these costs impose a throughput ceiling on fine-grained workloads where dispatch latency overshadows device arithmetic.
7.3.4 Dispatch overhead in eager execution
That throughput ceiling appears whenever a kernel finishes in a few microseconds while the host-side interpreter and driver need tens of microseconds to issue it. The dispatch overhead ratio, host software time \(\HostSoftwareTime\) divided by device hardware time \(\DeviceHardwareTime\), quantifies this mismatch in an additive model without host-device overlap (asynchronous execution can hide part of the host cost when device queues stay full). When the ratio exceeds 1, host dispatch takes more than half of each step; the dispatch overhead law of section 7.3.7.2 later expresses the same ratio across a multi-operation workload through operation count and per-operation cost.
Fixed dispatch dominates small ops and fades behind large ones.
In the illustrative eager-execution model used here, every operation pays a fixed cost of approximately 15 μs for Python-side dispatch and driver launch combined, the same per-operation cost as the decoding step that opened the chapter. Actual overhead varies by framework, backend, and hardware, but its relative weight still depends on operation size. For a small operation such as a ReLU on a small vector, the kernel might execute in only 1 μs. Dispatch then takes 94 percent of the modeled step time, the dispatch overhead ratio sits far above 1, and the GPU spends most of its time waiting for the next command. For a large operation such as a large matrix multiply, the kernel executes for 100 μs, dispatch drops to 13 percent of the modeled step time, and the dispatch overhead ratio falls well below 1. The operation is device-work dominated; distinguishing compute from memory limits still requires comparing its work and traffic.
Dispatch overhead explains why models with many small layers run significantly slower than their raw FLOP count predicts. Acting on the binding term places this symptom in the bottleneck taxonomy, classifying a dispatch-dominated workload as overhead-bound rather than compute-bound and showing which optimizations actually move it. Removing that per-operation interpreter work requires moving from kernel-by-kernel dispatch to graph-level execution, either by defining a static computation graph ahead of time or by capturing and compiling regions just in time (section 7.3.6). A captured graph can still launch multiple kernels; fusion and runtime replay determine how much launch overhead remains.
↩︎ The MNIST epoch estimate, in which this fixed per-operation cost decides training time on a CPU and an accelerator alike, is established in Iterative learning process.
7.3.5 Static computation graphs
The overhead costs of eager execution motivate the opposite design: capturing the entire computation before executing any of it. Because an eager runtime sees only one operation at a time, it cannot fuse a chain of small kernels or plan buffer reuse across a whole layer before launching work on the accelerator. Static graph execution solves this visibility problem by defining the complete computational graph as a symbolic representation first and executing it in a separate phase. This “define-then-run” execution model means the graph exists before any computation occurs, enabling ahead-of-time analysis, transformation, and global optimization that separate eager calls cannot support unless a compiler captures them.
Static graphs implement a clear separation between graph construction and execution. TensorFlow 1.x, which exemplified this approach, makes the two phases explicit in code (listing 2). It deliberately runs the same x * 2 then + 1 computation shown under eager execution in listing 1, holding the arithmetic fixed so that the only thing that changes is when it executes. Symbolic definition creates placeholders and operations without computation, while explicit execution triggers actual arithmetic.
# Phase 1: Graph Construction (symbolic, no computation)
import tensorflow.compat.v1 as tf

tf.disable_v2_behavior()

# Define graph symbolically
x = tf.placeholder(tf.float32, shape=[1])  # Just a placeholder
y = x * 2  # Not executed, just recorded
z = y + 1  # Still no execution
# At this point, nothing has been computed

# Phase 2: Graph Execution (actual computation)
with tf.Session() as sess:
    result = sess.run(z, feed_dict={x: [1.0]})
    # Now computation happens: result = [3.0]
In the definition phase, the program declares operations and variables and builds the symbolic DAG without allocating any tensor memory. Only in the execution phase do data load, concrete buffers materialize on the accelerator, and the captured graph run (figure 5).

The key difference from eager execution is that during construction, x, y, and z are not tensors containing values but rather symbolic nodes in a graph. Operators such as * and + append transformation nodes to the graph definition without issuing arithmetic. Calling print(y) makes this distinction visible: it prints symbolic tensor metadata rather than numerical values. Only when the host invokes sess.run() does the runtime analyze, optimize, and execute the captured graph on device buffers.
Because the framework has the complete graph before execution, it can perform ahead-of-time optimization unavailable across uncaptured eager calls. The kernel fusion opportunity introduced in section 7.3.2 becomes actionable here. Because the framework sees y = x * 2 and z = y + 1 together in the graph, it can fuse them into z = x * 2 + 1, eliminating the intermediate y and halving idealized memory traffic. When tensor shapes and lifetimes are known, the compiler can plan memory before execution and reuse buffers whose lifetimes do not overlap; dynamic dimensions may require bounds or runtime allocation. Tensor layouts can also be transformed globally (for example, NCHW to NHWC) to match hardware preferences, though physical layout conversions may still require copies. Dead-code elimination (DCE)10 removes operations whose results are unused, and constant folding precomputes operations on constant values when their inputs are known. These optimizations map directly to iron law terms: kernel fusion can reduce \(\DataVolume\) by avoiding intermediate memory writes, constant folding reduces repeated work, planned allocation can reduce runtime overhead, and dead code elimination removes work and associated data movement when unused computations are present. Compilers such as XLA11 (Google 2025) extend this approach, compiling captured subgraphs into fused machine code specialized for target hardware.
10 Dead code elimination (DCE): Removes graph nodes whose results do not affect observable outputs or side effects. In ML graphs, dead code arises from unused branches or post-transform artifacts; side-effect analysis ensures safe removal to prevent execution of dead operations and reduce kernel launch overhead.
11 XLA (accelerated linear algebra): XLA fuses subgraphs, specializes layouts, and lowers high-level operations into backend-specific code, so its fusion attacks both launch overhead \((\Latency)\) and intermediate memory writes \((\DataVolume)\). Its speedup is therefore not a fixed multiplier. Large GEMM-heavy regions may already be compute bound, while chains of small elementwise operations benefit more because fusion removes repeated trips through external memory, so gains depend on graph structure, backend support, and input-shape stability.
Static graphs can therefore approach high utilization when shapes, operators, and layouts match efficient backend paths. The cost of this performance is reduced flexibility. Standard Python control flow (if, for) cannot depend on computed tensor values in static graphs. TensorFlow provides graph-level control flow primitives (tf.cond and tf.while_loop) that support data-dependent conditions, but these require special syntax that diverges from standard Python, making code harder to write and reason about. Debugging is difficult because stack traces point to graph construction code, not execution code. Error messages often reference symbolic node names rather than the actual operations that failed.
7.3.6 Graph capture and JIT compilation
Staying in eager mode leaves small-operation workloads bound by host dispatch and unfused HBM traffic, while rewriting a research model into a static graph gives up interactive Python debugging and standard control flow. JIT compilation bridges that gap by letting developers write and debug ordinary eager code while capturing regions of the program at runtime for graph-level optimization. The core trade-off in graph capture is fidelity vs. generality. Tracing captures the execution path taken during a sample run, producing high fidelity to that path but missing branches not taken. Source-level compilation (scripting) analyzes supported program structure, preserving supported control flow but requiring a restricted language subset. Both approaches produce an intermediate representation (IR)12 that enables graph optimizations such as kernel fusion, constant folding, dead code elimination, and buffer reuse.
12 Intermediate representation (IR): The “intermediate” captures this format’s architectural role: a language-independent layer that decouples the frontend (Python capture) from the backend (hardware code generation), exactly as LLVM IR decouples C/Rust/Swift frontends from x86/ARM backends. ML frameworks adopted this compiler pattern because it reduces the \(\mathcal{O}(\CompilerFrontendCount\times \CompilerBackendCount)\) cost of supporting \(\CompilerFrontendCount\) frontends and \(\CompilerBackendCount\) backends to \(\mathcal{O}(\CompilerFrontendCount+ \CompilerBackendCount)\): a single graph capture mechanism (PyTorch’s TorchDynamo, or TensorFlow’s bridge into XLA) can target multiple hardware backends without rewriting the capture logic.
The eager-vs.-compiled trade-off has a direct iron law consequence: JIT compilation amortizes \(\Latency\) (dispatch overhead) and fuses memory traffic across each captured region, so compilation pays only when captured regions are long enough and stable enough to amortize capture, lowering, code generation, and cache-management costs.
Graph-capture JIT systems follow a common architectural pattern across frameworks. The first execution observes tensor operations, records a graph region guarded by assumptions about shapes, dtypes, layouts, and control flow, lowers that region into an intermediate representation, applies fusion and layout optimizations, and caches executable code for later calls that satisfy the same guards. The compiled artifact remains valid only while those guards hold; a failed guard forces the runtime to recompile or fall back to eager execution.
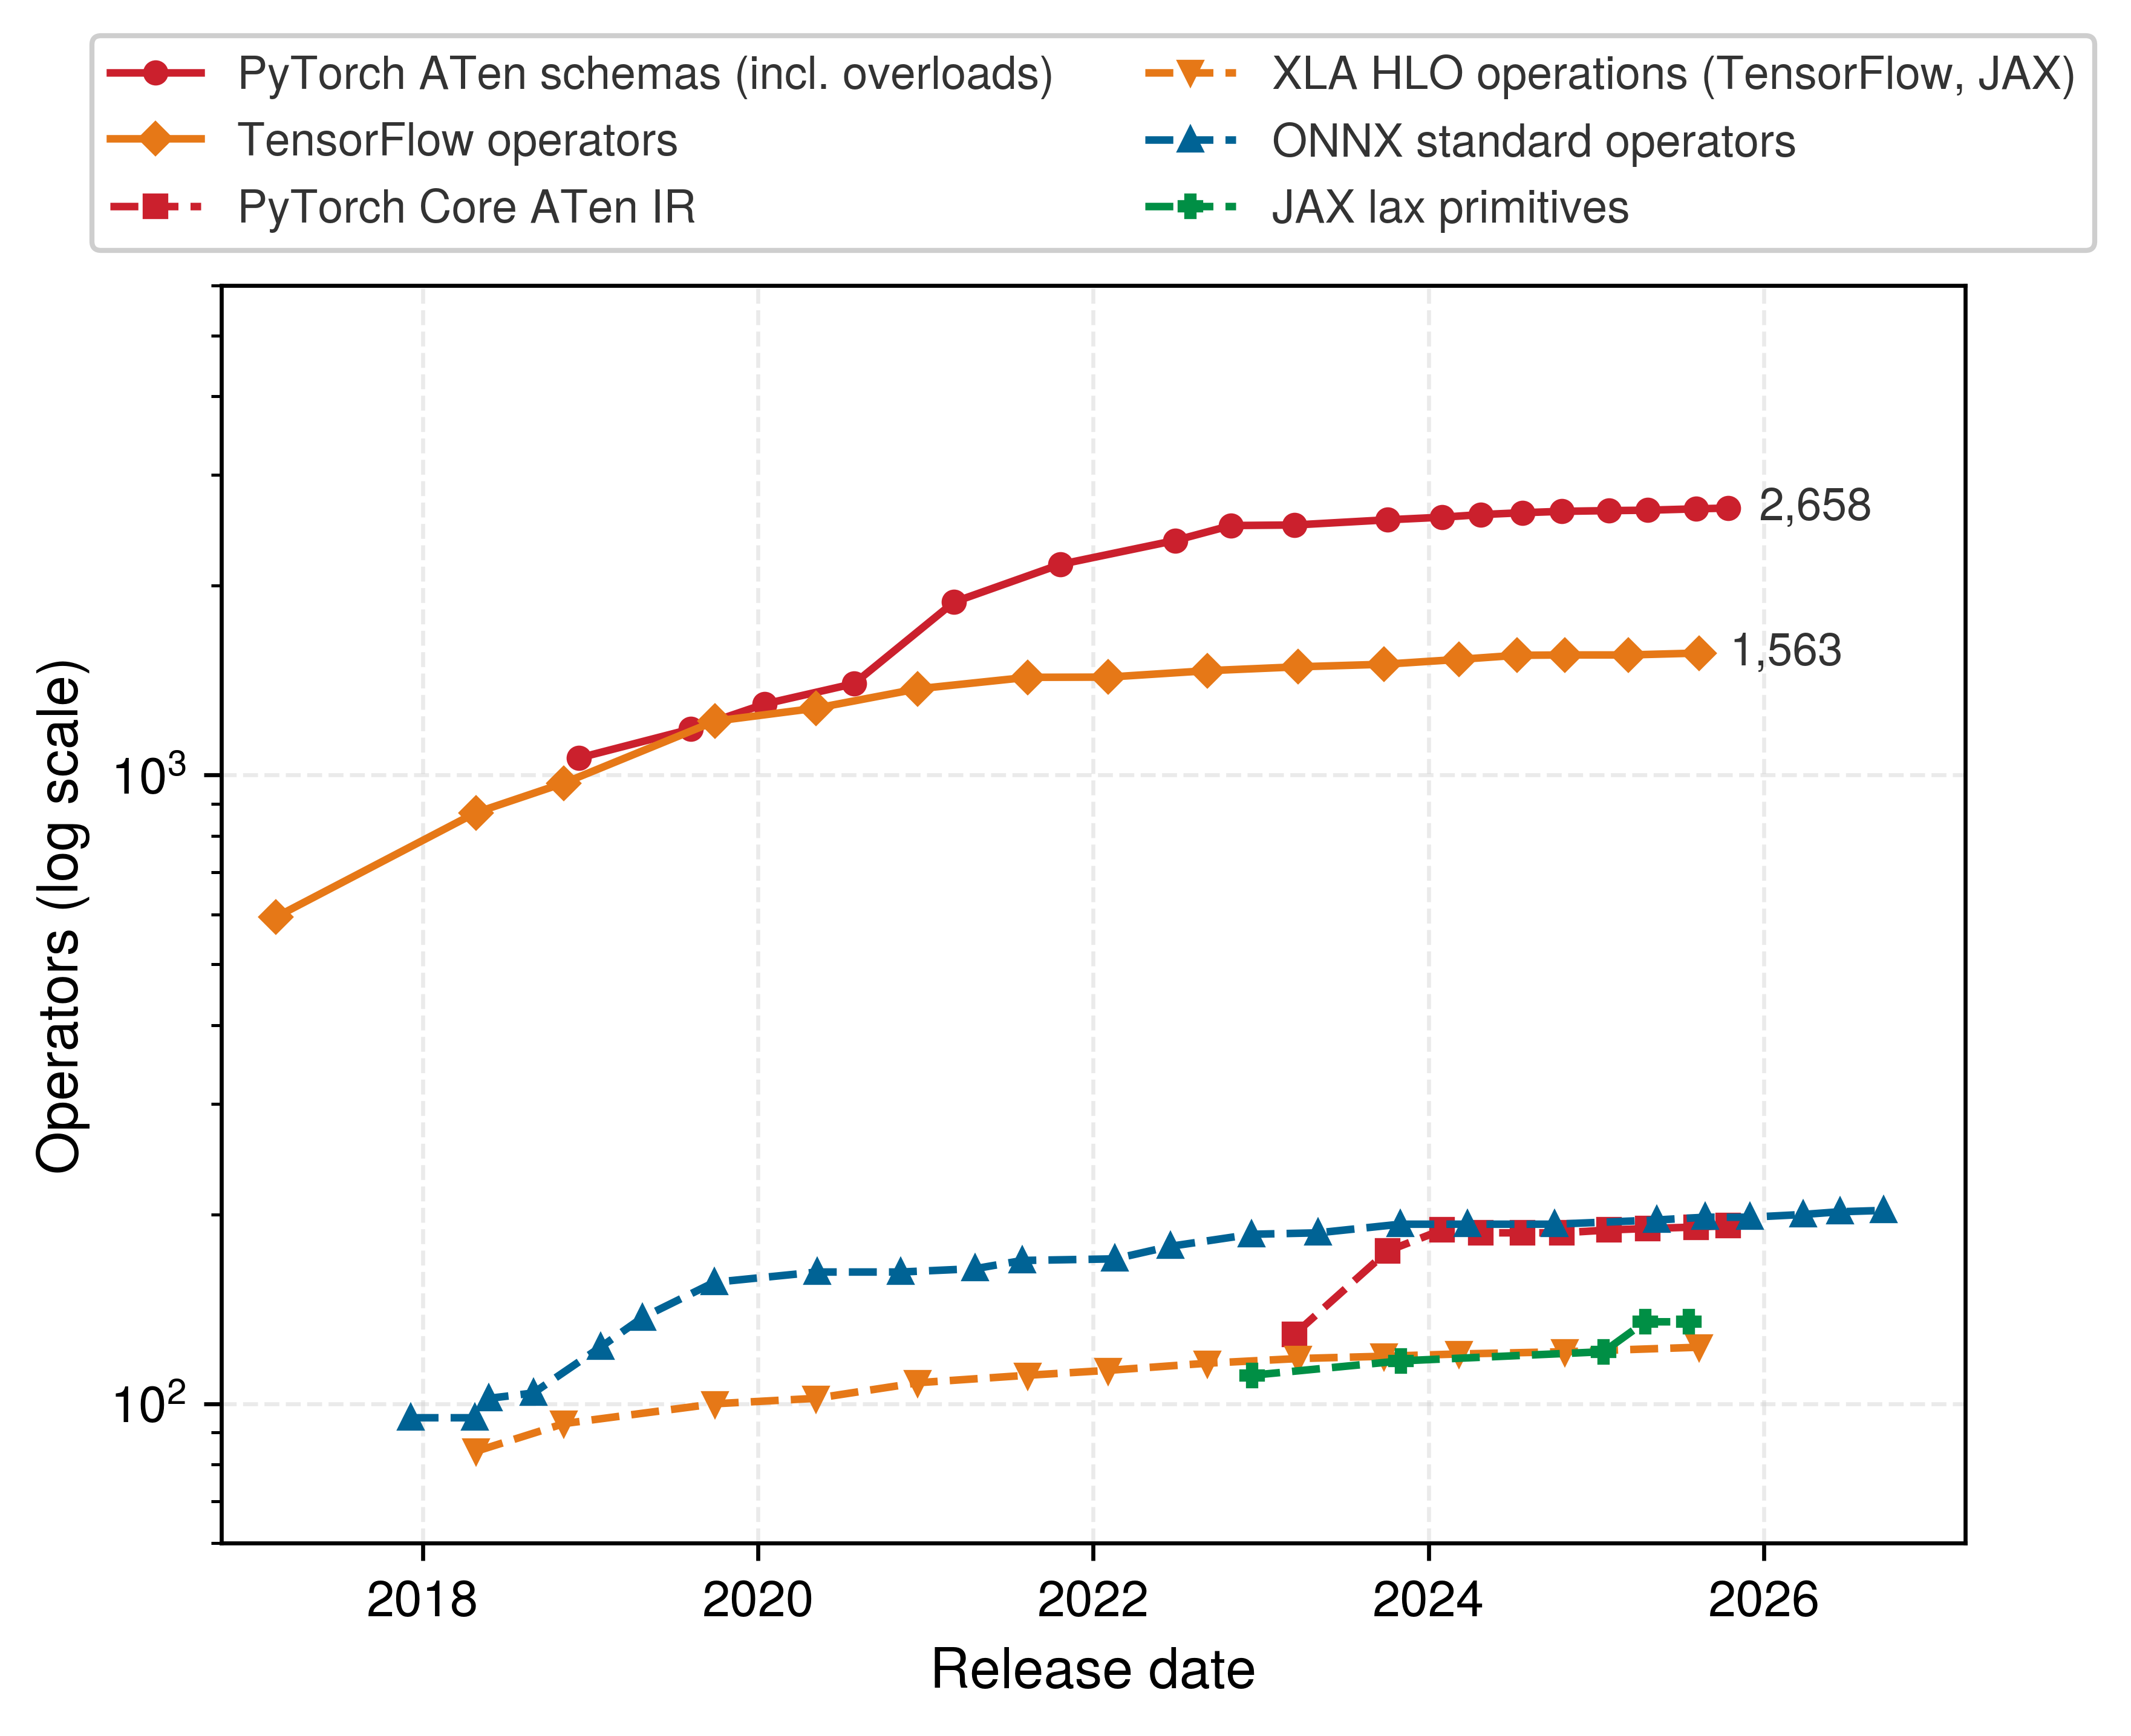
Lowering into an intermediate representation is far easier when the target vocabulary is small, and the eager frameworks a compiler starts from are not small. Figure 6 counts the operators that each framework defines at successive releases. PyTorch’s native-function table grew from 1,064 schemas, overloads included, at version 1.0 in 2018 to 2,658 by version 2.9 in 2025 (PyTorch Contributors 2025). TensorFlow’s operator registry grew from 594 at version 1.0 in 2017 to 1,563 by version 2.20 in 2025 (TensorFlow Developers 2025). Every one of those entries is something a backend must either implement directly or reduce before compilation through two lowering passes. Functionalization rewrites in-place mutations and view aliases into pure operations that return new tensors, which lets a compiler reorder and fuse nodes without corrupting shared storage. Decomposition then expands composite convenience operators into combinations of a much smaller set of primitive operations.
Compiler-facing representations work from far smaller sets, which grew by tens of operators while the eager surfaces grew by thousands. The Core ATen IR, the operator set that PyTorch’s compiler and export paths lower to, holds 192 operators (PyTorch Contributors 2025). The XLA compiler that TensorFlow and JAX both target defines 123 high-level optimizer (HLO) operations (OpenXLA Project 2025). The Open Neural Network Exchange (ONNX) standard, which carries models between frameworks and runtimes, defines 203 (ONNX Project 2026). JAX starts on the compiler’s side of this divide. Its user-facing operations reduce to about 135 lax primitives (JAX Developers 2025), a set the size of the compiler cores, so a JAX program reaches XLA with little decomposition left to do. The 13–14× gap between an eager surface and its compiler core (for TensorFlow, on its XLA path) is the work that decomposition performs. A new accelerator backend that implements a small core set can run models written against the full eager surface, which is why operator coverage, not peak throughput, often decides whether a model runs on a new device at all.
lax primitives) at each release, on a logarithmic axis. The eager surfaces grew past 1,500 and 2,600 entries while every compiler-facing set stayed between about 80 and 200. Counts mined from each project’s repository at its release tags (PyTorch Contributors 2025; TensorFlow Developers 2025; OpenXLA Project 2025; ONNX Project 2026; JAX Developers 2025).
PyTorch Contributors. 2025. ATen Native Functions Registry.
TensorFlow Developers. 2025. TensorFlow Operator Registry.
OpenXLA Project. 2025. XLA HLO Opcode List.
ONNX Project. 2026. ONNX Operator Schemas.
JAX Developers. 2025. JAX Lax Primitives.
Reaching one of those compact compiler IRs requires capturing operations from Python first, which brings back the fidelity-generality trade-off from the start of this section. The two capture modes of PyTorch’s TorchScript, now deprecated in favor of capture and export paths such as torch.export (PyTorch Contributors 2026c, 2026b), make that trade-off concrete. Tracing executed a function with example inputs and recorded the tensor operations observed on that path. Scripting instead compiled a restricted, type-annotated subset of Python source, preserving supported branches in the graph at the cost of rejecting unsupported Python objects, library calls, and metaprogramming. Both produced an IR with static types in static single-assignment (SSA) form, where each variable is assigned exactly once, so fusion, constant folding, and dead code elimination could run without the Python interpreter.
PyTorch Contributors. 2026c. TorchScript.
PyTorch Contributors. 2026b. torch.export.
The main limitation of tracing is that a trace records operations from an observed path rather than preserving arbitrary Python control flow. A data-dependent branch can therefore freeze into whichever side the example input took (listing 3).
TracerWarning when a tensor value is converted to a Python condition because the resulting trace may not generalize.
import torch


def conditional_forward(x):
    if x.sum() > 0:  # Data-dependent condition
        return x * 2
    else:
        return x * 3


traced = torch.jit.trace(conditional_forward, torch.tensor([1.0]))
# Tracing captures ONLY the x.sum() > 0 branch
# If input later has sum <= 0, traced version
# still executes x * 2 branch
In this example, converting the tensor condition to a Python Boolean commonly produces a TracerWarning; the resulting trace can still follow the captured branch for later inputs that require the other branch. Trace warnings should therefore be treated as correctness failures when data-dependent Python control flow is present. The same hazard survives in modern graph-capture systems, which is why they guard each captured region with explicit assumptions about shapes and control flow.
Compilation therefore attacks the dispatch overhead of section 7.3.4 directly, and fusion adds a second saving in memory traffic. Notebook 7.1 quantifies both for a two-operation activation block.
Napkin Math 7.1: The physics of software overhead
Iron law connection: For small operations, the latency term \((\Latency)\) in the iron law is dominated by software overhead: dispatching instructions from Python to the GPU. Each operation pays a Python dispatch cost of ~10 μs plus a kernel launch cost of ~5 μs, which together set the per-operation overhead applied in the two scenarios below. Python dispatch covers the framework call; driver launch covers submission to the device. A compiled region invoked from Python still pays an entry cost, whereas replay of a captured launch sequence removes repeated per-operation Python work and has its own submission cost.
Scenario one: Eager mode (the tiny-op trap) Consider a simple activation block, y = relu(x + bias), in which the input and output each contain \(\TensorElementCount\) elements of \(\ElementStorageSize\) bytes each. Assume a scalar or broadcast bias remains in fast memory, so the traffic model counts the full input, intermediate, and output tensors.
- Operations: Two (Add, ReLU).
- Execution:
- Launch
AddKernel: 15 μs overhead. - Read/Write Memory: \(2\TensorElementCount\ElementStorageSize\) bytes.
- Launch
ReLUKernel: 15 μs overhead. - Read/Write Memory: \(2\TensorElementCount\ElementStorageSize\) bytes.
- Launch
- Total overhead: 30 μs.
- Total memory traffic: \(4\TensorElementCount\ElementStorageSize\) bytes.
Scenario two: Compiled mode (fusion) The compiler fuses this into one kernel: FusedAddRelu. This scenario retains one ordinary Python entry and one driver launch, applying the same combined cost as eager mode to isolate the effect of reducing two calls to one. It does not model captured-graph replay.
- Execution:
- Launch
FusedKernel: 15 μs overhead. - Read/Write Memory: \(2\TensorElementCount\ElementStorageSize\) bytes (the intermediate result stays on chip).
- Launch
- Total overhead: 15 μs (2× less launch overhead).
- Total memory traffic: \(2\TensorElementCount\ElementStorageSize\) bytes (2× bandwidth efficiency).
Systems insight: Fusion saves on both terms at once: half the launches and, by the fused-chain traffic rule of section 7.3.2 with \(\ChainedOperationCount = 2\), half the idealized traffic.
Scaling this arithmetic to a sequence of 5 small operations exposes the idle gaps on the accelerator timeline (figure 7). In eager execution, each 1 μs kernel waits on 10 μs of Python dispatch, leaving the accelerator idle for about 91 percent of the sequence. The figure isolates the Python share, and the per-kernel launch cost would widen each gap further. Compiling the sequence resolves both constraints. The framework submits the work in a single launch of 5 μs, which eliminates all intermediate host dispatch gaps. Operator fusion keeps intermediate activations in registers or cache, so the entire sequence completes in 4 μs instead of the uncompiled 5 μs.
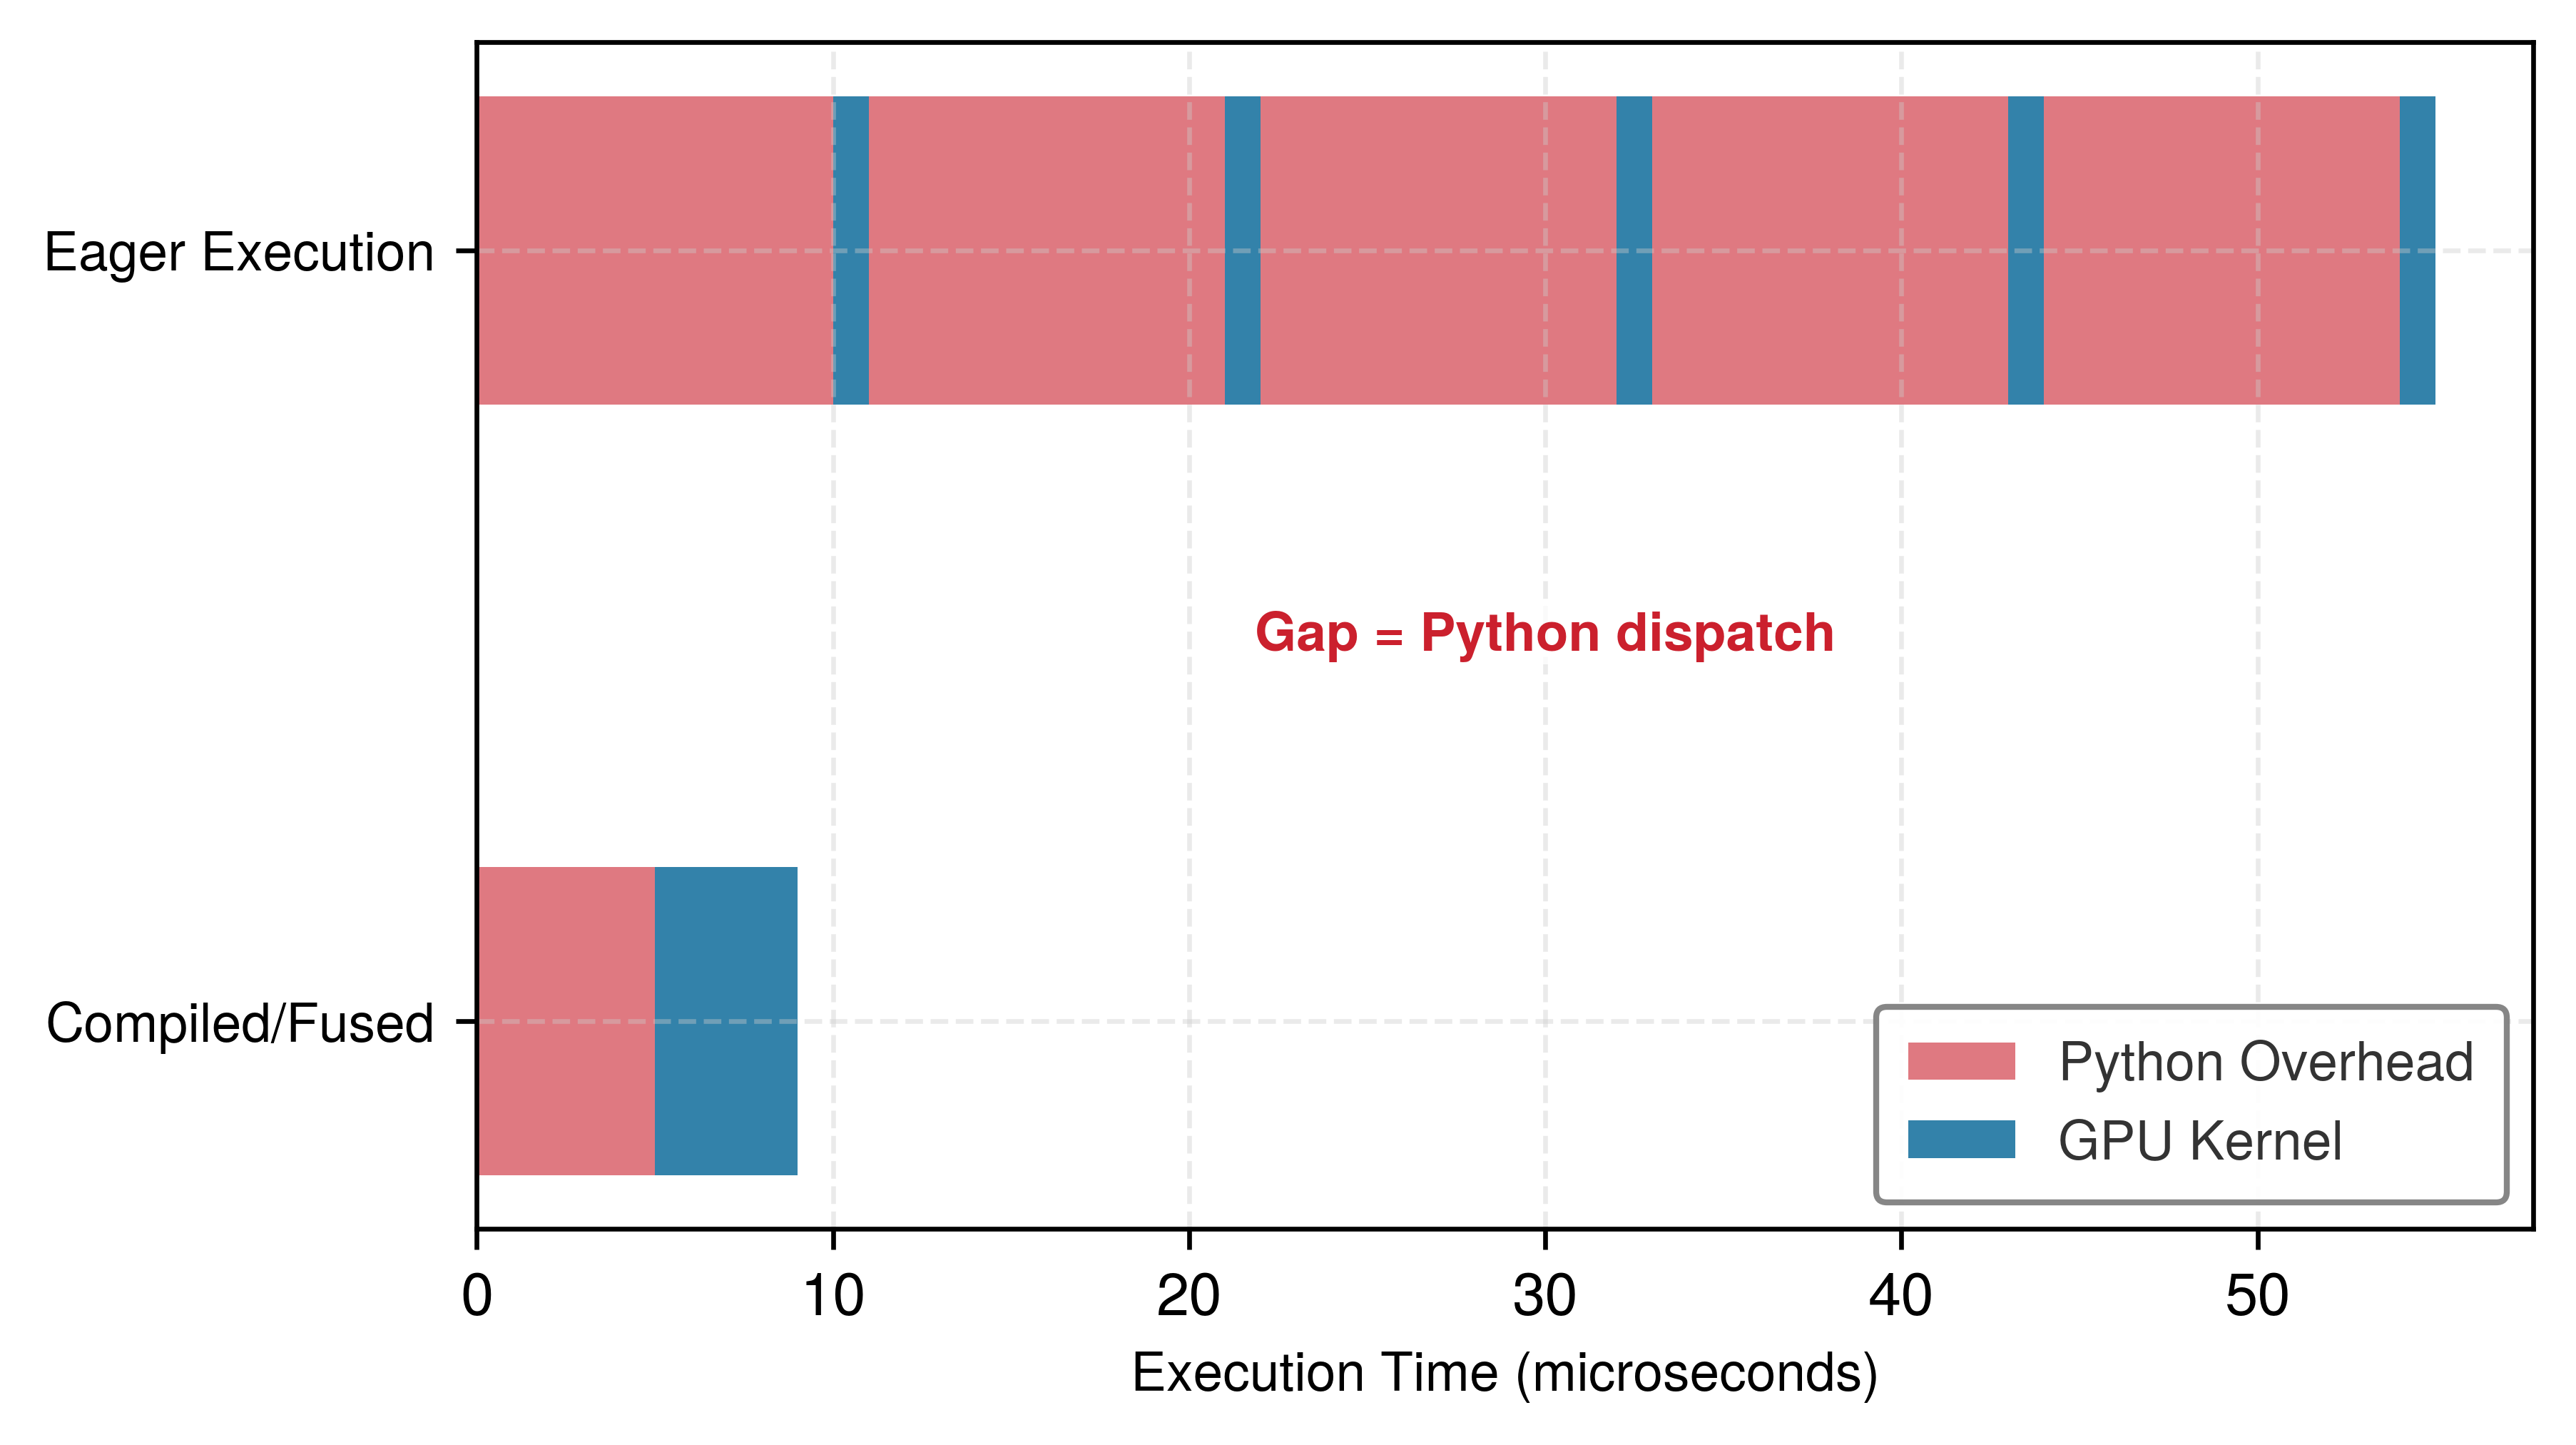
Graph-capture compilers such as PyTorch 2.0’s torch.compile13 (Ansel et al. 2024) realize the compiled timeline of figure 7 over captured regions without requiring engineers to write custom CUDA kernels.14 However, compilation cannot span arbitrary Python code: graph breaks mark the boundary where compilation ceases to apply (a configuration requiring full-graph capture can instead report an error). Data-dependent Python control flow, unsupported library calls, I/O, custom Python objects, and highly variable shapes can shorten compiled regions. With eager fallback enabled, each break separates compiled subgraphs with standard Python execution, reintroducing interpreter dispatch, resetting \(\Latency\) amortization, and preventing fusion across the boundary. Tensor handles can pass between these regions while their storage remains on the device; host reads of device values can additionally require synchronization. This is why graph-break analysis belongs in performance engineering: the relevant metric is not whether compilation is enabled, but how much of the hot path remains inside long, stable compiled regions.
13 torch.compile: PyTorch’s capture front end analyzes Python bytecode as each frame runs, rather than recording tensor operations alone. That vantage lets it keep capturing across Python control flow it can resolve from guarded values and insert a graph break where it cannot, which is why graph breaks rather than tracing errors are its characteristic failure mode.
Ansel, Jason, Edward Yang, Horace He, Natalia Gimelshein, Animesh Jain, Michael Voznesensky, Bin Bao, et al. 2024. “PyTorch 2: Faster Machine Learning Through Dynamic Python Bytecode Transformation and Graph Compilation.” Proceedings of the 29th ACM International Conference on Architectural Support for Programming Languages and Operating Systems, Volume 2, 929–47. https://doi.org/10.1145/3620665.3640366.
14 CUDA (compute unified device architecture): NVIDIA’s parallel computing platform, released in 2007, serving as the foundational layer between high-level Python operations and GPU silicon; when PyTorch executes torch.matmul(A, W), the call traverses the framework’s dispatcher, selects a cuBLAS kernel, and launches it on the GPU. Each launch adds the 5 μs kernel-launch share of the per-operation overhead on top of the framework’s Python dispatch. For small operations, this dispatch overhead \((\Latency)\) can exceed useful compute time. Fusing compatible groups of operations then reduces launch count as well as intermediate memory traffic; capturing the graph alone does not imply a single kernel.
Backends occupy different points on the flexibility-performance spectrum. A JIT compiler traces model execution at runtime to generate optimized kernels dynamically, incurring initial warmup latency during the first pass. An ahead-of-time (AOT) compiler instead compiles captured computation before deployment, shifting compilation out of the hot path and enabling a standalone runtime when the export target supports one. A general JIT backend optimizes ordinary training and serving workloads with moderate compilation cost. A specialized inference backend can apply deeper fusion, precision lowering, and autotuning when the deployment target is fixed. An ahead-of-time mobile or embedded runtime removes even more flexibility to gain footprint and predictability. The same rule governs all of them: the narrower the target and the more stable the graph, the more optimization the compiler can safely perform.
Compilation shortens the list of kernels; a second mechanism removes the per-launch cost of whatever list remains. CUDA Graphs record a fixed sequence of kernel launches, with their arguments and memory addresses, once, and then replay the whole sequence with a single submission from the host (NVIDIA Corporation 2026). Replay requires static shapes and fixed buffer addresses, which is why serving systems capture one graph per batch size. For the GPT-2 XL decoding step that opened the chapter, replay turns 576 separate launches into one submission, so the host’s launch rate no longer sets the step time. What remains is the weight read of about 0.9 ms plus the device-side cost of running those kernels back to back, which fusion attacks. Every later decode floor in this book assumes this kind of capture.
NVIDIA Corporation. 2026. CUDA Graphs: CUDA Programming Guide.
The resulting workflow is a systems decision. Rapid prototyping favors eager execution because architecture changes and guard failures make recompilation cost visible. Long training runs and high-volume inference amortize compilation cost over many executions, provided the model has stable shapes and limited graph breaks. Debugging usually starts in eager mode because errors map directly to source code and standard debuggers such as pdb work mid-execution; compilation is reintroduced after the model behavior is correct and the performance bottleneck is measurable.
↩︎ The cost that slow experiment cycles impose on how many candidate models a team can test is established in Where the Hours Go: Quantifying the ML Lifecycle.
Set side by side across six dimensions (table 2), the three execution models differ most in when the graph is built and how much of it a compiler can see. Each row highlights how a design choice at graph construction time propagates into control flow, debugging, and runtime throughput.
| Aspect | Eager + Autograd Tape (PyTorch default) | Static graph (TensorFlow 1.x) | JIT Compilation (torch.compile) |
|---|---|---|---|
| Execution Model | Immediate | Deferred | Hybrid |
| Graph Construction | During forward pass | Before execution | First execution (cached) |
| Optimization | Per-operation kernels | Ahead-of-time | JIT compilation |
| Dynamic Control Flow | Python control flow | Graph control flow | Captured regions or breaks |
| Debugging | Easy (standard Python) | Difficult (symbolic) | Moderate (mixed) |
| Performance | Baseline | High (optimized) | High (compiled regions) |
The same divide extends to memory planning, hardware specialization, research velocity, and integration with existing code (table 3). Where static capture invests upfront in planned buffer lifetimes and target-specific code generation, dynamic execution prioritizes rapid iteration and seamless composition with ordinary host code.
| Aspect | Static Graphs | Dynamic Graphs |
|---|---|---|
| Memory Management | Precise allocation planning, optimized memory usage | Flexible but potentially less efficient |
| Hardware Utilization | Can generate highly optimized hardware-specific code | May sacrifice hardware-specific optimizations |
| Research Velocity | Slower iteration due to define-then-run requirement | Faster prototyping and model experimentation |
| Integration with Legacy Code | More separation between definition and execution | Natural integration with imperative code |
These trade-offs are not binary choices. Modern frameworks offer a spectrum of execution options, which raises the quantitative question of where on this spectrum a given project should operate.
7.3.7 Compilation and dispatch costs
Two quantitative principles make the choice of execution model measurable. The compilation continuum principle asks when compilation gains justify development cost by comparing production executions with development iterations. The dispatch overhead law writes the dispatch overhead ratio in terms of operation count and per-operation cost, giving a threshold that says when a whole workload is overhead-bound.
The compilation continuum principle
Equation 1 orders the execution models from maximum flexibility to maximum optimization in four positions, and each labeled arrow names the mechanism that carries a project one step rightward toward hardware: \[ \text{Eager} \xrightarrow{\text{capture}} \text{Graph JIT} \xrightarrow{\text{export}} \text{AOT Runtime} \xrightarrow{\text{specialize}} \text{Hardware} \tag{1}\] Each step rightward sacrifices flexibility for performance. The practical question is where a given project should be placed on this continuum. The optimal compilation strategy depends on production executions, development recompilations, and their respective time costs, combined in equation 2:
\[ \text{Compilation Benefit} = \frac{\ProductionExecutionCount\cdot (\EagerExecutionTime- \CompiledExecutionTime)}{\CompilationTime+ \DevelopmentIterationCount\cdot \CompilationTime} \tag{2}\]
where:
- \(\ProductionExecutionCount\) = number of production executions (dimensionless count: inference requests, training steps)
- \(\DevelopmentIterationCount\) = number of development iterations requiring recompilation (dimensionless count)
- \(\EagerExecutionTime\) = time per execution in eager mode (seconds)
- \(\CompiledExecutionTime\) = time per execution in compiled mode (seconds)
- \(\CompilationTime\) = time per compilation or recompilation (seconds; assumed constant)
This model assumes that the compiled artifact remains valid between development changes and that the initial compilation and each recompilation have the same cost; under these assumptions, the decision rule is to compile when \(\text{Compilation Benefit} > 1\). The ratio is dimensionless.
Table 4 applies that decision rule to hypothetical throughputs and compilation times across execution modes and model architectures:
| Model | Eager (examples/sec) | torch.compile (examples/sec) | TensorRT (examples/sec) | JIT Setup (seconds) |
|---|---|---|---|---|
| ResNet-50 | 1,450 | 2,150 | 3,800 | 15–30 |
| BERT-Base | 380 | 520 | 890 | 30–60 |
| ViT-B/16 | 620 | 950 | 1,650 | 25–45 |
| GPT-2 (124M) | 180 | 260 | 420 | 45–90 |
Three cases illustrate how reuse changes the compilation decision. In research prototyping (\(\DevelopmentIterationCount\gg \ProductionExecutionCount\)), teams should stay eager. If the architecture changes every few minutes, compilation overhead can dominate. Under the scenario’s 30 s compilation assumption, 10 compilations per hour consume 5 min.
For repeated execution (\(\ProductionExecutionCount\gg \DevelopmentIterationCount\)), compilation can pay off because its one-time cost is amortized across many calls. In the hypothetical ResNet-50 inference scenario in table 4, torch.compile provides 48.3 percent higher throughput (2,150 img/s vs. 1,450 img/s). Using the scenario’s 30 s compile cost, this pays off after the breakeven point in equation 3:
\[ \CompilationBreakevenCount= \frac{\CompilationTime}{\EagerExecutionTime- \CompiledExecutionTime} \tag{3}\]
Evaluating equation 3 with the hypothetical ResNet-50 values gives approximately 134,000 images. The same amortization principle applies to long training runs, using training throughput and compilation costs measured for that workload.
Long-lived production inference (\(\DevelopmentIterationCount\approx 0\), \(\ProductionExecutionCount\rightarrow \infty\)) extends this reuse further, providing more opportunity to amortize compilation. Aggressive autotuning can be worthwhile even when setup takes much longer, provided the model converts correctly, meets numerical requirements, and improves measured performance over the deployment lifetime.
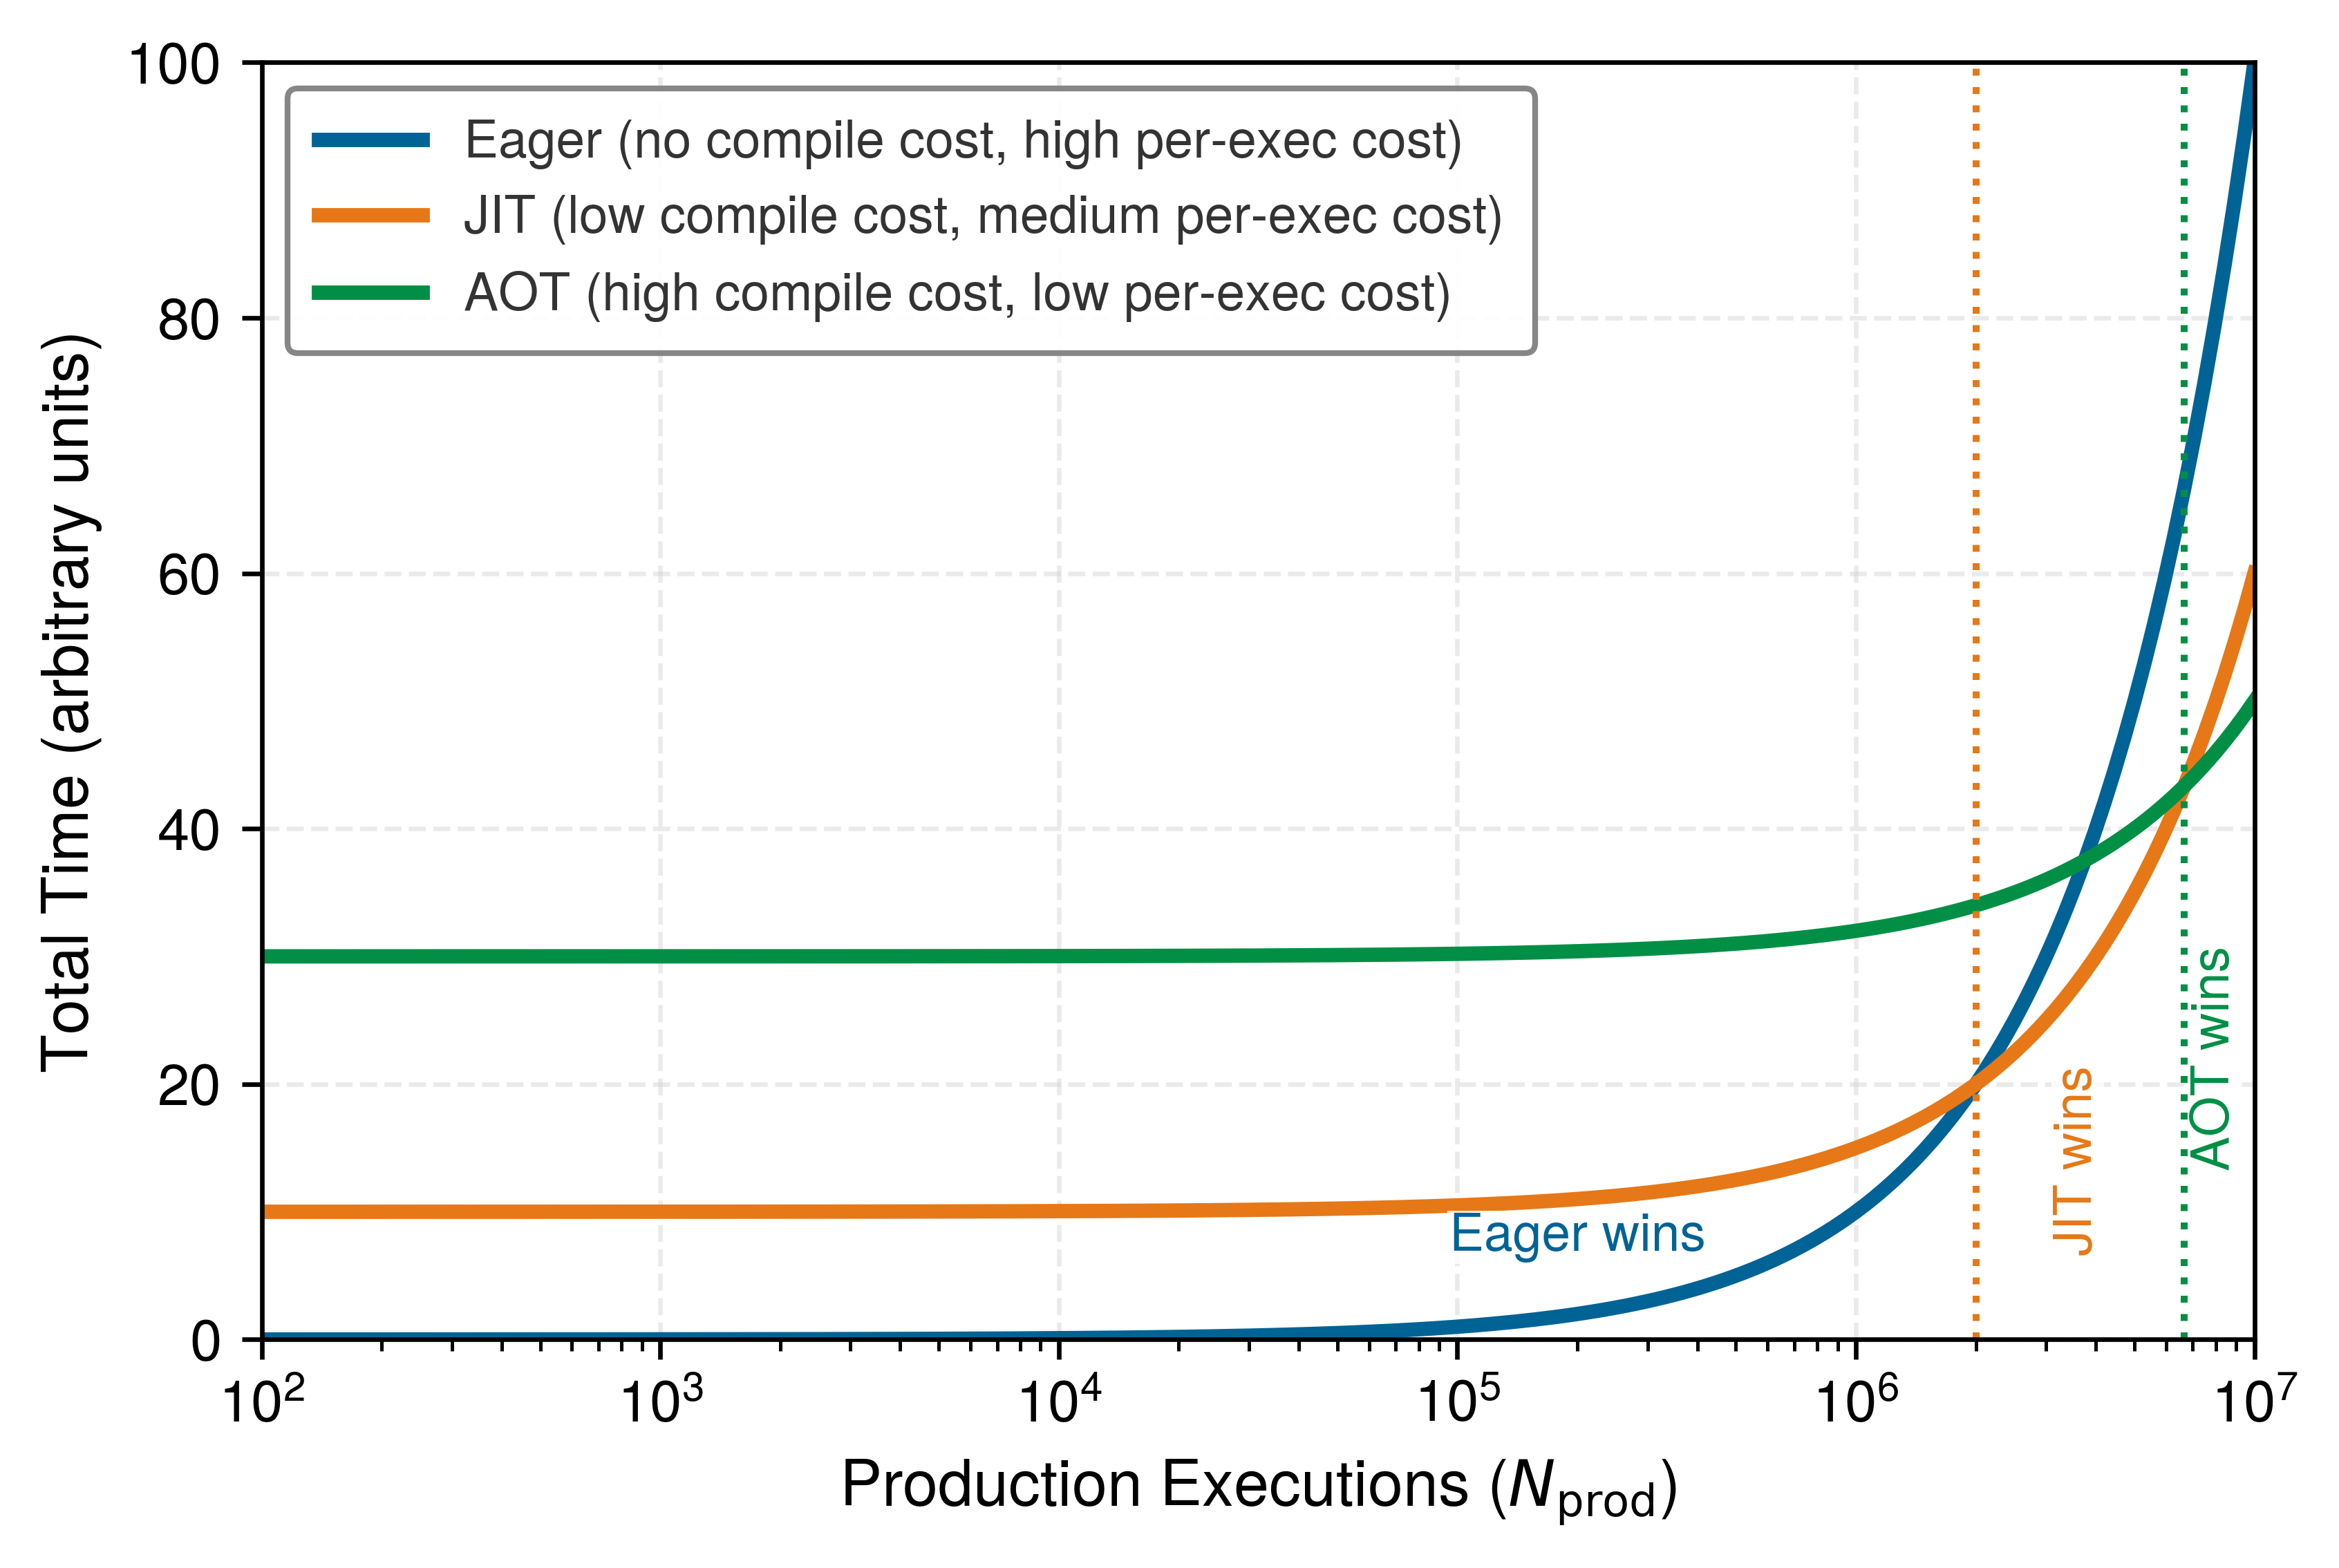
The cases form a continuum of increasing reuse (figure 8). Each strategy’s total time starts at its one-time compilation cost and grows at its per-execution cost. Eager therefore wins at low execution counts, JIT wins once its compilation is amortized, and AOT wins only at the largest counts, where its higher upfront cost is fully repaid. The figure’s crossovers (near \(2 \times 10^{6}\) and \(6.7 \times 10^{6}\) executions) come from an illustrative cost model in arbitrary units, not from the ResNet-50 scenario, whose eager-to-compiled breakeven sits near 134,000 images. What carries over is the order of the regions, not their positions.
These throughput differences are not uniform across workloads, so the execution strategy must align with the operational regime of each workload archetype. The appropriate strategy depends on the computational phase, the target backend, and the dominant iron law term. In batched prefill, transformers have high arithmetic intensity that benefits from dense matrix compilation; in small-batch autoregressive decoding, however, the workload shifts into a bandwidth-bound regime where memory transfers dominate. Table 5 maps each recurring archetype to a candidate execution strategy based on these primary physical constraints.
↩︎ The workload archetypes and the iron law term that dominates each are established in Workload archetypes.
| Archetype | Dominant Iron Law Term | Candidate Framework Strategy | Rationale |
|---|---|---|---|
| ResNet-50 (compute-bound) | \(\frac{\Operations}{\PeakRate \cdot \EfficiencyHw}\) (Compute) | Compiled dense kernels | Regular dense kernels benefit from layout selection, precision lowering, and backend specialization; fusion helps most in surrounding memory- or launch-bound regions |
| GPT-2 (bandwidth-bound) | \(\frac{\DataVolume}{\Bandwidth}\) (Memory Bandwidth) | Fused attention + graph compilation | Fused attention eliminates intermediate activation round-trips, while compilation removes kernel launch overhead; streaming parameter and KV-cache traffic remain bandwidth-limited |
| DLRM (capacity-bound) | Capacity first, then \(\frac{\DataVolume}{\Bandwidth}+\Latency\) (gathers) | Specialized lookup kernels and measured capture | Irregular gathers limit some optimizations; measure compilation benefits in dense regions and surrounding dispatch |
| DS-CNN (power-bound) | Energy and memory capacity (feasibility gates) | Static-arena microcontroller runtime | Fixed memory and a small native runtime must fit the target before latency can be optimized |
The rows differ in what a compiler can reach. Dense convolution exposes most of its work to fusion and layout selection, while embedding gathers and a microcontroller’s fixed memory sit largely outside the graph a compiler optimizes.
Lighthouse 7.1: Framework strategy by archetype
The four recurring archetypes in table 5 trace one principle across the framework: compilation benefits scale with how much of the workload is optimizable.
Systems insight: In the illustrative scenario, compute-bound workloads such as the ResNet-50 row in table 4 benefit because their dense kernels expose substantial surface for layout selection, precision lowering, and fusion. Bandwidth-bound workloads such as small-batch GPT-2 generation require distinguishing intermediate activation traffic from parameter streaming. Fusing attention kernels eliminates round-trips for transient activation tensors and removes dispatch latency, but memory bandwidth continues to bind on streaming model weights and key-value caches unless batching increases arithmetic intensity. Capacity-bound workloads such as DLRM can gain less when irregular embedding lookups leave limited compiler scope.
The dispatch overhead law
Whereas the compilation continuum asks whether enough executions will run to repay compilation setup, the dispatch overhead law asks whether a single execution is stalled on the host in the first place. Let \(\DispatchedOperationCount\) be the number of operations (count), \(\OperationDispatchOverhead\) the per-operation dispatch overhead (seconds), and \(\IronLawComputeTime\) and \(\IronLawMemoryTime\) the total compute and memory times (seconds). Under the additive, no-overlap approximation \(\DeviceHardwareTime\approx \IronLawComputeTime + \IronLawMemoryTime\) (when execution overlaps those costs, measured hardware time should replace their sum), equation 4 identifies when framework overhead dominates compute and memory:
\[ \text{Overhead Ratio} = \frac{\DispatchedOperationCount\cdot \OperationDispatchOverhead}{\IronLawComputeTime + \IronLawMemoryTime} \tag{4}\]
When Overhead Ratio \(> 1\), the model is overhead-bound. This is the dispatch overhead ratio \(\HostSoftwareTime/\DeviceHardwareTime\) of section 7.3.4, written with \(\HostSoftwareTime= \DispatchedOperationCount\cdot \OperationDispatchOverhead\) so that operation count and per-operation cost appear explicitly. The fraction of step time spent in dispatch is \(\text{Overhead Ratio}/(1+\text{Overhead Ratio})\), so a ratio above 1 means dispatch takes more than half of the step. Compilation can provide its largest gains for overhead-bound workloads because fusion reduces the number of dispatches. The training-step trace in section 7.7 works this effect through end to end, previewed by the numbers that follow.
Applying equation 4 means comparing the software overhead \(\HostSoftwareTime= \DispatchedOperationCount\cdot \OperationDispatchOverhead\) with the hardware execution time \(\DeviceHardwareTime\) (both in seconds). The regime depends on the size of individual operations rather than on the model’s parameter count. Notebook 7.2 contrasts a small multilayer perceptron with a large transformer layer to quantify when host overhead or device arithmetic bounds the system.
Napkin Math 7.2: Dispatch overhead at two scales
Problem: Determine the threshold where host-side Python interpreter dispatch overhead bounds end-to-end execution time relative to accelerator hardware execution.
Scenario one: Small multilayer perceptron (overhead bound)
- Compute: 6 ops across small matrix/element-wise operations.
- Hardware time: \(\DeviceHardwareTime\approx\) 2.6 μs (mostly memory latency).
- Software overhead: \(\HostSoftwareTime\approx\) 6 ops \(\times\) 15 μs/op = 90 μs.
- Ratio: 90 μs/2.6 μs ≈ 34.6.
- Small-model outcome: The system spends 97 percent of time in host-side dispatch and kernel-launch overhead. Eliminating all modeled dispatch overhead would give an upper-bound speedup of 35.6×.
Scenario two: GPT-3 layer (device bound)
- Compute: Huge matrix multiplications.
- Assumptions: Both times below are illustrative round values for one GPT-3-scale layer over a large batch, not derived from a specific accelerator. The conclusion does not hinge on them, because at the chapter’s 15 μs/op the ratio would reach 1 only if the layer issued thousands of separately dispatched kernels.
- Hardware time: \(\DeviceHardwareTime\approx\) 100 ms = 100000 μs.
- Software overhead: \(\HostSoftwareTime \approx 180 \, \MicroUnitPrefix\text{s}\), one transformer block’s 12 eager kernels at 15 μs/op.
- Ratio: 180 μs/100000 μs ≈ 0.0018.
- Large-model outcome: Modeled Python overhead is negligible. Compilation may still improve fusion, layout, or backend specialization; dispatch elimination contributes little.
Systems insight: Dispatch overhead is regime-dependent. Compilation can reduce host-side overhead for small-operation workloads by fusing operations into fewer launches, while large models benefit mainly from fused kernels and memory movement reductions.
7.3.8 Static runtimes for microcontrollers
The compilation continuum ends at the far edge, where the binding cost on a microcontroller is not each dispatch but the runtime itself, whose memory and latency footprint exceeds the device. While cloud frameworks such as PyTorch and TensorFlow 2.x prioritize flexibility through eager execution, TinyML15 systems operating on microcontrollers (MCUs) with kilobytes of memory cannot afford the overhead of a Python interpreter or a fully dynamic runtime.
15 TinyML: Systems designed for MCUs cannot afford a Python interpreter. Micro-runtimes instead use small C/C++ runtimes, fixed memory planning, and model-specific operators. TensorFlow Lite Micro remains interpreter-based: the application supplies a tensor arena whose buffers are planned and reused without heap allocation after setup. Predictable memory is mandatory because exceeding a 256 KB device budget can prevent initialization or inference.
Lighthouse 7.2: Lighthouse example: KWS on TinyML
Scenario: Deploying the keyword spotting (KWS) lighthouse, a DS-CNN and the book’s power-bound workload, to an Nordic nRF52840 (Cortex-M4F) microcontroller with 256 KB RAM and 1 MB Flash. This is a smaller target than the ESP32-S3 of the earlier smart-doorbell scenario, chosen to show the runtime at its tightest.
Constraint: A full PyTorch and Python runtime exceeds the device’s memory budget by orders of magnitude.
Framework solution: Micro-frameworks such as TensorFlow Lite Micro (TFLM) (David et al. 2021) solve this through a tiny interpreter-based runtime with a fixed memory discipline:
- Fixed memory arena: The application supplies a contiguous tensor arena, and the framework plans and reuses buffers from that arena rather than relying on dynamic allocation during inference.
- Kernel selection: Only the specific kernels used by the model (for example, Conv2D, DepthwiseConv) need to be linked or registered with the runtime.
- Compact interpreter execution: The MCU runs a small C/C++ interpreter over a flat model representation, with the model and arena bound at initialization rather than assembled dynamically at runtime.
Binding constraint: The power budget makes keyword spotting a power-bound workload, but the first gate the framework must pass is memory capacity, not bandwidth or dispatch overhead, which is why table 5 treats it as a feasibility gate. The framework’s primary job is to ensure the model’s intermediate activations (the “working set”) fit within the MCU’s tiny SRAM.
David, Robert, Jared Duke, Advait Jain, Vijay Janapa Reddi, Nat Jeffries, Jian Li, Nick Kreeger, et al. 2021. “TensorFlow Lite Micro: Embedded Machine Learning for TinyML Systems.” Proceedings of Machine Learning and Systems 3: 800–811.
These micro-runtimes sacrifice dynamic flexibility to reduce footprint and make memory predictable. With compact models, low-power hardware, and duty cycling, that discipline enables milliwatt-scale inference with mostly on-chip data movement. Across the full spectrum from dynamic eager execution to static graph compilation and specialized micro-runtimes, developers must therefore match the execution strategy to the binding constraint of the target.
Checkpoint 7.1: Execution models
The choice of execution mode determines both developer velocity and model performance.
Debuggability vs. speed
Modern compromise
The execution problem determines when computation happens and what optimizations are possible. Neural network training, however, requires a capability that no amount of clever scheduling can provide: the ability to compute gradients automatically.
Self-Check: Question
A GPU performance profile reveals that a sequence of LayerNorm, dropout, and GELU activation operations spends over 80% of its execution time reading and writing intermediate tensors to High Bandwidth Memory (HBM) with very low arithmetic intensity. Why is operator fusion the primary framework optimization for this workload?
- It replaces 16-bit floating-point arithmetic with 8-bit integer arithmetic
- It changes the model architecture to eliminate all non-linear activation functions
- It converts compute-bound matrix multiplications into memory-bound operations
- It fuses multiple sequential element-wise operations into a single GPU kernel, keeping intermediate values in on-chip SRAM/registers and eliminating redundant round trips to HBM
A developer traces a PyTorch model containing data-dependent control flow such as
if tensor.sum() > 0: ...usingtorch.jit.trace, then later runs inputs that should take the other branch. What is the most accurate description of the tracing risk and the modern graph-capture behavior described in the section?- Tracing always crashes immediately on tensor-dependent branches, whereas modern graph capture always compiles the entire program without fallback
- Tracing converts the Python conditional into a fully general static graph branch, whereas modern graph capture removes the need for any control-flow assumptions
- Tracing records the branch taken by the example input and may emit a
TracerWarning, while modern graph capture can compile supported regions and, when eager fallback is enabled, return to eager execution at unsupported boundaries - Tracing silently succeeds for all future inputs, whereas modern graph capture fails only when the GPU lacks enough memory
State the dispatch overhead law and explain why a workload composed of many small tensor operations on a fast GPU can be severely underutilized in eager mode even when the hardware has high peak throughput.
True or False: When eager fallback is enabled in
torch.compile, encountering a graph break necessarily halts execution with a runtime error because the unsupported Python code cannot be represented in the captured graph.Order the stages of a generic graph-capture compilation pipeline from the first Python call to repeated execution of optimized code: (1) an intermediate representation is built for the captured region, (2) optimized executable code is cached for reuse under the same guards, (3) the frontend captures a region of tensor computation from the eager program, (4) the compiled region executes on the target hardware, (5) optimization and lowering transform the captured region toward hardware-specific execution.
In graph-capture JIT compilation systems like TorchDynamo, an event where the compiler encounters an unsupported dynamic Python construct (such as an unhandled C-extension call or dynamic side effect) and must pause graph capture to yield control to the Python interpreter is called a ____.
7.4 Differentiation: Automatic Gradient Computation
A framework that executes graphs efficiently but cannot compute gradients16 can run inference, yet it cannot learn. Training requires the derivative of a scalar loss \(\LossFunction\) with respect to every parameter: doing this manually for even a three-layer network demands dozens of hand-derived partial derivatives, and for a billion-parameter transformer it is intractable. The differentiation problem is the task of mechanizing that derivative computation automatically. During the forward pass, the runtime records an execution tape and saves intermediate activation buffers for subsequent derivative evaluations. As backpropagation already showed, reverse-mode automatic differentiation (AD)17 matches this regime because a single reverse traversal from a scalar loss yields every parameter gradient (Baydin et al. 2018).
16 Gradients: A gradient holds one value for every parameter it differentiates, so each weight tensor acquires a gradient tensor of the same shape. Computing gradients automatically therefore doubles the parameter-sized state before any optimizer runs, which is why training-memory accounts, such as the one in Worked example: Training vs. inference memory, list gradients as a full copy of the weights.
17 Reverse-mode AD: Reverse mode’s single backward pass has a concrete memory cost, because the operation-dependent values that derivative rules read must be retained until the backward traversal reaches them. Activation checkpointing changes this saved set by omitting selected values and recomputing them during the backward pass.
Baydin, Atilim Gunes, Barak A. Pearlmutter, Alexey Andreyevich Radul, and Jeffrey Mark Siskind. 2018. “Automatic Differentiation in Machine Learning: A Survey.” Journal of Machine Learning Research 18 (153): 1–43.
The systems engineering of differentiation extends the backpropagation algorithm. It addresses how frameworks represent computation graphs, manage memory for intermediate values, and orchestrate the backward pass efficiently across accelerators. The framework mechanizes the chain rule as large-scale systems bookkeeping: tracking operator dependencies, staging activation buffers, and dispatching backward kernels. The function in listing 4 reduces the core idea to three elementary operations.
↪ The optimization algorithms that consume these gradients are developed in Optimizers and their memory.
def f(x):
    a = x * x  # Square
    b = sin(x)  # Sine
    c = a * b  # Product
    return c
Frameworks decompose this function into elementary operations, each with a known local derivative, and then combine these local derivatives via the chain rule to compute gradients through supported compositions. The systems challenge is executing this transformation under physical hardware constraints: the framework must represent the computation graph, make necessary forward values available, and schedule backward kernels without exhausting accelerator HBM. Production runtimes address these challenges through structured graph recording, caching allocators, and reverse-mode traversal.
7.4.1 Forward and reverse mode
Computing the gradient of a scalar loss across millions of model weights one weight at a time would require millions of separate passes through the network, whereas sweeping backward from the single scalar loss recovers every weight gradient in one reverse pass. Automatic differentiation operates in these two traversal directions: forward mode, whose cost scales with the number of inputs, and reverse mode, whose cost scales with the number of outputs. Because deep learning objectives reduce a large parameter set to a single scalar loss, this asymmetry dictates both the memory footprint and the execution schedule of the underlying framework.
Forward mode
Forward mode automatic differentiation computes directional derivatives alongside the forward calculation itself. For each intermediate variable \(\TraceIntermediateVariable_i\), the runtime evaluates both the value \(\TraceIntermediateVariable_i\) and its directional derivative (tangent) \(\TraceIntermediateTangent_i = \sum_j \frac{\partial \TraceIntermediateVariable_i}{\partial \FunctionInputVariable_j} \FunctionInputTangent_j\). Because tangents flow forward alongside the values, forward mode requires no execution tape and never retains forward activations for a later backward pass.
To see the mechanism concretely, consider computing both the value and derivative of \(\IllustrativeFunction(\FunctionInputVariable) = \FunctionInputVariable^2 \sin(\FunctionInputVariable)\). Listing 5 shows how forward mode evaluates local derivative rules alongside each elementary operation, applying the chain and product rules at every step:
def f(x):  # Computing both value and derivative
    # Step 1: x -> x²
    a = x * x  # Value: x²
    da = 2 * x  # Derivative: 2x

    # Step 2: x -> sin(x)
    b = sin(x)  # Value: sin(x)
    db = cos(x)  # Derivative: cos(x)

    # Step 3: Combine using product rule
    result = a * b  # Value: x² * sin(x)
    dresult = a * db + b * da  # Derivative: x²*cos(x) + sin(x)*2x

    return result, dresult
Forward mode mechanizes this paired tracking through dual numbers, values of the form \(\TraceIntermediateVariable+ \TraceIntermediateTangent\DualNumberInfinitesimal\) where \(\DualNumberInfinitesimal^2 = 0\), so each operator updates the value and its tangent together without retaining a graph. Seeding \(\FunctionInputTangent= 1.0\) carries the derivative through the trace (listing 6).
x, dx = 2.0, 1.0  # seed: track the derivative with respect to x

a = x * x  # value:      4.0
da = 2 * x  # derivative: 4.0
b = sin(x)  # value:      0.9093
db = cos(x)  # derivative: -0.4161
c = a * b  # value:      3.637
dc = a * db + b * da  # derivative: 1.973
A single forward pass with a seeded tangent vector \(\TangentSeedVector\) evaluates a Jacobian-vector product (JVP), \(\FunctionJacobian\TangentSeedVector\), where \(\FunctionJacobian\in \mathbb{R}^{\FunctionOutputDimension\times \Parameters}\) is the Jacobian matrix. When an objective maps \(\Parameters\) parameter inputs to a single scalar loss (\(\FunctionOutputDimension= 1\)), recovering the full gradient \(\nabla_{\ModelParameters}\LossFunction \in \mathbb{R}^{\Parameters}\) requires setting \(\TangentSeedVector\) to each of the \(\Parameters\) standard basis vectors in turn. Recovering gradients with forward mode therefore requires \(\Parameters\) distinct forward evaluations (or propagating \(\Parameters\)-wide tangent bundles), scaling compute and memory traffic as \(\mathcal{O}(\Parameters)\) with parameter count. For networks with millions or billions of parameters, this scaling makes forward-mode gradient calculation intractable, although forward JVPs remain effective when input dimensions are small or when evaluating directional derivatives and Hessian-vector products.
Reverse mode
An intermediate layer that maps an input vector \(\FunctionInputVector\in \mathbb{R}^\FunctionInputDimension\) to an output \(\FunctionOutputVector\in \mathbb{R}^\FunctionOutputDimension\) of width \(\FunctionInputDimension= \FunctionOutputDimension= 100{,}000\) has a full Jacobian \(\FunctionJacobian\in \mathbb{R}^{\FunctionOutputDimension\times \FunctionInputDimension}\) of \(10^{10}\) elements, which would require 40 GB of memory in FP32 to store one layer’s derivatives. Reverse-mode automatic differentiation avoids materializing this matrix and matches the many-parameters-to-one-loss shape of neural network training. Instead of propagating tangents forward from inputs, reverse mode propagates adjoints \(\TraceIntermediateAdjoint_i = \partial \LossFunction / \partial \TraceIntermediateVariable_i\) backward from the single scalar loss \(\LossFunction\) to all parameters.
While forward mode computes Jacobian-vector products (\(\FunctionJacobian\TangentSeedVector\)), reverse mode evaluates vector-Jacobian products (VJPs), \(\UpstreamGradientVector^T \FunctionJacobian= \sum_{j=1}^\FunctionOutputDimension \UpstreamGradientElement_j \, \partial \FunctionOutputElement_j / \partial \FunctionInputVector\), where \(\UpstreamGradientElement_j = \partial \LossFunction / \partial \FunctionOutputElement_j\) is one element of the upstream gradient vector \(\UpstreamGradientVector= \frac{\partial \LossFunction}{\partial \FunctionOutputVector} \in \mathbb{R}^{\FunctionOutputDimension}\). Because training optimizes a single scalar loss \(\LossFunction\), the backward pass only ever needs to multiply this upstream gradient vector by each local operation’s derivative rule, never the 40 GB full Jacobian matrix.
To see how VJPs sidestep the full matrix, consider a simple element-wise operation such as \(\FunctionOutputVector= \text{ReLU}(\FunctionInputVector)\) with an input vector \(\FunctionInputVector= [-1.0, 2.0, 3.0]\) and an upstream gradient \(\UpstreamGradientVector= [0.5, 0.5, 0.5]\) flowing backward from the loss. Because the derivative of ReLU is \(1\) when \(\FunctionInputVariable> 0\) and \(0\) otherwise, the local gradient vector is \(\frac{\partial \FunctionOutputVector}{\partial \FunctionInputVector} = [0, 1, 1]\). Instead of building a \(3{\times}3\) diagonal matrix and executing a matrix multiplication, the VJP computes the element-wise product \(\UpstreamGradientVector\odot \frac{\partial \FunctionOutputVector}{\partial \FunctionInputVector} = [0.0, 0.5, 0.5]\) directly. It streams vectors without ever materializing the full \(\FunctionOutputDimension\times \FunctionInputDimension\) matrix in memory. Seeding the reverse sweep with \(\LossAdjointSeed = 1\) yields the complete parameter gradient vector \(\nabla_{\ModelParameters}\LossFunction\) in a single backward pass, regardless of whether the model contains ten parameters or ten billion.
Reverse mode operates on the same three-operation function \(\IllustrativeFunction(\FunctionInputVariable) = \FunctionInputVariable^2\sin(\FunctionInputVariable)\) from listing 4, where \(\FunctionInputVariable\) reaches the output through two distinct computational paths: the square and the sine. Algorithm 1 defines the reverse-mode traversal algorithm over a directed acyclic graph before tracing this concrete evaluation.
The algorithmic structure of algorithm 1 reveals its systems cost. The forward pass records operator dependencies and buffers intermediate values required by backward derivative rules until the reverse sweep consumes them. Reverse mode trades activation storage and graph bookkeeping for a single backward pass, whose cost is a small constant multiple of the forward pass regardless of parameter count (Baur and Strassen 1983; Griewank and Walther 2008).
Baur, Walter, and Volker Strassen. 1983. “The Complexity of Partial Derivatives.” Theoretical Computer Science 22 (3): 317–30. https://doi.org/10.1016/0304-3975(83)90110-x.
Griewank, Andreas, and Andrea Walther. 2008. Evaluating Derivatives: Principles and Techniques of Algorithmic Differentiation. 2nd ed. SIAM. https://doi.org/10.1137/1.9780898717761.
For the concrete function in listing 4 evaluated at \(\FunctionInputVariable=2.0\), the forward pass records \(\WorkedTraceSquare=\FunctionInputVariable^2=4.0\), \(\WorkedTraceSine=\sin(\FunctionInputVariable)\approx0.9093\), and \(\WorkedTraceProduct=\WorkedTraceSquare \WorkedTraceSine\approx3.637\). Seeding \(\WorkedTraceProductAdjoint=1.0\), the product rule yields adjoints \(\WorkedTraceSquareAdjoint=0.9093\) and \(\WorkedTraceSineAdjoint=4.0\). The square branch contributes \(0.9093\cdot4.0\approx3.6372\) to \(\FunctionInputAdjoint\), while the sine branch contributes \(4.0\cos(2.0)\approx-1.6646\). Accumulating both paths gives the exact derivative \(\partial \WorkedTraceProduct/\partial \FunctionInputVariable= \FunctionInputAdjoint\approx 1.973\).
This single backward traversal computes \(\partial \WorkedTraceProduct/\partial \FunctionInputVariable\) regardless of how many fan-out paths connect \(\FunctionInputVariable\) to \(\WorkedTraceProduct\). In a deep neural network, every weight tensor influences the scalar loss through thousands of divergent paths across successive layers; reverse mode aggregates all incoming adjoints in one reverse sweep. That one sweep, rather than one pass per parameter, is what keeps training a 175B-parameter model such as GPT-3 computationally tractable.
Executing this traversal in hardware exposes a physical constraint: evaluating local derivatives during the backward pass requires the operating point established during forward execution. The framework must therefore determine which forward tensors to persist in device memory, when to allocate them, and when to free them. The recorded graph answers the “when to free” question, because each saved tensor can be released as soon as the last backward rule that reads it has run. The peak itself is bounded separately, by splitting a large batch into micro-batches whose saved activations are freed before the next one starts while their gradients sum into the same buffers (gradient accumulation).18
18 Gradient accumulation: The framework processes a large logical batch as smaller micro-batches, freeing each micro-batch’s saved activations after backward while accumulating parameter-sized gradients. Processing 4,096 samples in 64-sample micro-batches can reduce the batch-dependent activation peak by up to 64\(\times\) when activation memory scales linearly with batch size; weights, gradients, optimizer state, and other fixed costs do not shrink. The trade-off is more sequential work before each optimizer update.
A two-layer network makes these requirements concrete (listing 7). Tracing both passes explicitly shows which forward activations must survive until the reverse sweep consumes them.
def simple_network(x, w1, w2):
    hidden = x * w1  # First layer
    activated = max(0, hidden)  # ReLU activation
    output = activated * w2  # Second layer
    return output


# --- Forward pass stores intermediates ---
x, w1, w2 = 1.0, 2.0, 3.0
hidden = x * w1
activated = max(0, hidden)
output = activated * w2

# --- Backward pass consumes them ---
d_output = 1.0  # Seed gradient
d_w2 = activated  # = 2.0
d_activated = w2  # = 3.0
d_hidden = d_activated * (1 if hidden > 0 else 0)  # ReLU gate: 3.0
d_w1 = x * d_hidden  # = 3.0
d_x = w1 * d_hidden  # = 6.0
Three implementation requirements emerge from this example. First, the framework must track dependencies between operations to determine the correct reverse traversal order. Second, the information needed by each backward rule must be available, either saved during the forward pass or regenerated. The chain rule evaluates local derivatives at the forward operating point. For example, evaluating \(\frac{\partial}{\partial \NeuronPreactivation}\text{ReLU}(\NeuronPreactivation) = \IndicatorFunction(\NeuronPreactivation> 0)\) requires the sign of the pre-activation \(\NeuronPreactivation\), which can be recovered from a saved value or mask. Computing a dense layer’s weight gradient \(\frac{\partial \LossFunction}{\partial \WeightMatrix} = \LayerInputMatrix^T \frac{\partial \LossFunction}{\partial \PreactivationMatrix}\), where \(\PreactivationMatrix\) is the layer’s pre-activation output, requires the forward input activation tensor \(\LayerInputMatrix\). Third, every differentiated operation needs both a forward implementation and a corresponding backward rule. These requirements define the engineering surface of automatic differentiation, where retaining forward values can consume much of the training memory budget.
7.4.2 Activation memory
Retaining those forward values turns device memory capacity, rather than raw floating-point throughput, into the feasibility boundary of training. A 175B-parameter model in FP16 already requires 350 GB for weights alone, exceeding the physical memory of any single accelerator before a single forward activation is saved, and reverse-mode AD compounds that pressure by retaining operation-dependent activations for backward derivative rules. Saved activations weigh just as heavily on models whose weights fit easily: in a batch-64 ResNet-50 (worked in section 7.4.3.2), saved activations exceed the FP32 weights by roughly two orders of magnitude, on top of weights, gradients, and optimizer states.
This saved-activation footprint accumulates across successive layers, because each forward layer adds tensors that must persist until the backward sweep unwinds to that layer (listing 8). For a batch of \(\BatchSize\) sequences of length \(\SequenceLength\) passing through \(\LayerCount\) layers of width \(\HiddenDimension\), each saving \(\LayerSavedTensorCount\) tensors of \(\ElementStorageSize\) bytes per element, the saved state is approximately \[ \ActivationMemory \approx \BatchSize \times \LayerCount \times \SequenceLength \times \HiddenDimension \times \LayerSavedTensorCount\times \ElementStorageSize \] This total grows linearly in both batch size and network depth. Consequently, the batch size that fits on an accelerator during training is far smaller than the batch size that fits during inference, where intermediate activations can be discarded as soon as the next layer consumes them.
def deep_network(x, w1, w2, w3):
    # Forward pass - must store intermediates
    hidden1 = x * w1
    activated1 = max(0, hidden1)  # Store for backward
    hidden2 = activated1 * w2
    activated2 = max(0, hidden2)  # Store for backward
    output = activated2 * w3
    return output
This is a capacity limit rather than the bandwidth gap of the memory wall, and frameworks relieve it through two primary architectural strategies. The first is activation checkpointing (or gradient checkpointing), a reverse-mode technique (Griewank and Walther 2000) that deep learning frameworks adopted to train deep networks in sublinear memory (Chen et al. 2016). Rather than buffering every intermediate activation, the runtime stores only selected segment boundary tensors and recomputes dropped intermediates on demand during the backward pass. In listing 9, the backward pass re-executes each forward segment to regenerate its activations rather than loading them from global memory.
Griewank, Andreas, and Andrea Walther. 2000. “Algorithm 799: Revolve: An Implementation of Checkpointing for the Reverse or Adjoint Mode of Computational Differentiation.” ACM Transactions on Mathematical Software 26 (1): 19–45. https://doi.org/10.1145/347837.347846.
Chen, Tianqi, Bing Xu, Chiyuan Zhang, and Carlos Guestrin. 2016. “Training Deep Nets with Sublinear Memory Cost.” arXiv Preprint arXiv:1604.06174.
↪ Activation checkpointing schedules and their recomputation cost are developed in Optimal checkpoint placement strategy.
# Standard backward: every forward activation stays resident
h1 = layer1(x)  # kept for backward
h2 = layer2(h1)  # kept for backward
out = layer3(h2)  # kept for backward

# Checkpointed: keep only the boundary h1 and drop h2. The
# backward pass re-runs the wrapped segment to regenerate
# h2 on demand instead of holding it in memory.
h1 = layer1(x)  # boundary: kept
out = checkpoint(
    lambda a: layer3(layer2(a)), h1
)  # h2 recomputed in backward
The second strategy is the kernel fusion that the memory wall motivated in section 7.3.2, applied here to the body of a layer. Its capacity benefit is narrower than its traffic benefit. Temporaries that pass only between the fused operators are never allocated in HBM, so they add nothing to peak memory, while any value a backward rule reads must still be stored.19 Rather than executing matrix multiplication, bias addition, and activation functions as separate kernels that serialize intermediate tensors to accelerator global memory (HBM), compilers fuse compatible operators into a single kernel that passes intermediate values through registers or on-chip shared memory.
19 Fusion and saved state: Fusion removes the forward round-trip of an intermediate through HBM, but it does not remove the backward pass’s need for that value. If a derivative rule reads a fused intermediate, such as the pre-activation whose sign forms the ReLU mask, the fused kernel must still write that value (or a compact mask) to memory, or the backward pass must recompute it. Fusion and checkpointing therefore interact, because the compiler decides which intermediates to materialize from what the backward graph will read.
Chetlur, Sharan, Cliff Woolley, Philippe Vandermersch, Jonathan Cohen, John Tran, Bryan Catanzaro, and Evan Shelhamer. 2014. “cuDNN: Efficient Primitives for Deep Learning.” arXiv Preprint arXiv:1410.0759.
The backward pass itself relies on specialized hardware-optimized kernels. Rather than synthesizing backward passes from naive elementary operations, frameworks invoke tuned backward kernels (such as cuDNN primitives) that optimize memory access strides and register usage on accelerator hardware (Chetlur et al. 2014). Combining checkpointing, kernel fusion, and specialized backward kernels enables large architectures to train within physical accelerator memory limits without incurring out-of-memory faults.
7.4.3 Autograd internals
Checkpointing, fusion, and specialized kernels address the physical bottlenecks of automatic differentiation, but production frameworks hide these mechanisms beneath a training loop of four calls. These calls clear the gradients, run the forward pass, call backward on the loss, and step the optimizer. Behind those calls, the runtime builds and traverses a dynamic computation graph, allocates and frees intermediate buffers, schedules backward kernels on device streams, and applies a numerical-precision policy.
Recording the backward graph
If a forward operation discards its inputs and leaves no record of what function produced its output, calling loss.backward() has no path back to the model weights and no saved activations to plug into the chain rule. To make reverse traversal possible without ahead-of-time graph compilation, the autograd system dynamically constructs a directed acyclic graph of Node (or Function) objects during the forward pass. Each node stores an operator’s backward differentiation rule and holds references to the tensors needed to evaluate its vector-Jacobian products. Because edges point backward from outputs toward inputs, the engine can walk the graph in reverse topological order as soon as it receives the initial gradient from the scalar loss. The memory that those node references keep alive is examined in section 7.4.3.2.
When gradient recording is enabled and an operation has inputs requiring gradients, its output carries a grad_fn referencing the backward Function. Each Function links to antecedent nodes through its next_functions list, forming a chain from the scalar loss back to leaf parameter tensors. Listing 10 inspects this pointer chain for a simple composite computation:
grad_fn to backward functions, forming a reverse chain from output to leaf parameters. One backward traversal computes the scalar loss gradient; its work grows with the graph.
import torch

x = torch.tensor([2.0], requires_grad=True)
y = x * 3
z = y.pow(2)


# Traverse the reverse-linked graph
print(z.grad_fn)  # PowBackward0
print(z.grad_fn.next_functions)  # -> MulBackward0
print(
    z.grad_fn.next_functions[0][0].next_functions
)  # -> AccumulateGrad (leaf)
The inspection exposes the traversal path: PowBackward0 (from z = y.pow(2)) links to MulBackward0 (from y = x * 3), which terminates at AccumulateGrad on the leaf parameter tensor x. Leaf tensors are graph sinks where accumulated gradients write directly into the .grad buffer rather than propagating further. The tuple format (Function, index) tracks the specific output index for multi-output operations.
This reverse-linked graph imposes a lifetime constraint: the topology and the forward information required by each backward rule must remain available until that rule executes. Host-side graph metadata (pointers and node descriptors) is distinct from the device tensor buffers it references. Retaining those buffers can consume gigabytes of accelerator capacity as model depth and batch size grow; recomputation or offloading changes where and how the required values are made available.
Production training also needs control over gradient propagation beyond a standard backward sweep, in three forms. Selective gradient computation freezes layers during transfer learning via requires_grad=False or .detach(). Gradient inspection and modification supports clipping, debugging, or logging intermediate adjoints via runtime hooks. Custom differentiation rules cover non-standard operations such as specialized CUDA kernels or novel activation functions. These extension points operate via callbacks invoked during graph construction and reverse traversal, preserving the core engine’s execution path. In PyTorch, these capabilities map to five runtime mechanisms, each with its own memory or correctness hazard (table 6).
| Mechanism | What it controls | Cost or hazard |
|---|---|---|
retain_graph=True |
Keeps saved graph state available for another backward traversal | Retains memory that would otherwise be released; the amount depends on the graph and saved values |
| Gradient accumulation | Successive backward passes sum into .grad until zero_grad() resets them, enabling large effective batches |
Forgetting the reset silently mixes gradients across optimization steps |
Custom autograd.Function |
User-defined forward and backward rules for operations outside the built-in library | Makes the implementer decide what to save and how to differentiate |
| Gradient hooks | Inspecting or modifying gradients mid-traversal (clipping, logging, debugging) | Runs arbitrary Python per registered tensor on every backward pass |
.detach() |
Cuts gradient flow at a chosen boundary (frozen layers, inference outputs) | The legacy .data attribute bypasses autograd and silently corrupts gradients; clone before in-place mutation |
Custom autograd functions move two decisions from the engine to the programmer, what to save and how to differentiate. The implementation explicitly defines which forward tensors to preserve in ctx.save_for_backward() and evaluates the corresponding vector-Jacobian products in backward(). Listing 11 demonstrates this interface for a custom multiply-add operation:
ctx.save_for_backward().
import torch


class MultiplyAdd(torch.autograd.Function):
    @staticmethod
    def forward(ctx, x, y, z):
        # Save tensors needed for backward
        ctx.save_for_backward(x, y)
        return x * y + z

    @staticmethod
    def backward(ctx, grad_output):
        # Retrieve saved tensors
        x, y = ctx.saved_tensors

        # Compute gradients using chain rule
        grad_x = grad_output * y  # dL/dx = dL/dout * dout/dx
        grad_y = grad_output * x  # dL/dy = dL/dout * dout/dy
        grad_z = grad_output  # dL/dz = dL/dout * 1

        return grad_x, grad_y, grad_z


# Usage
x = torch.tensor([2.0], requires_grad=True)
y = torch.tensor([3.0], requires_grad=True)
z = torch.tensor([1.0], requires_grad=True)

output = MultiplyAdd.apply(x, y, z)
output.backward()

print(
    x.grad, y.grad, z.grad
)  # tensor([3.]), tensor([2.]), tensor([1.])
Saved tensors and the memory-compute trade-off
Every call to save_for_backward in the backward graph keeps a device tensor live from the forward pass until its backward consumer finishes. Because different operations require different forward information (a matrix multiplication weight gradient requires the full input activation tensor, whereas elementwise ReLU needs only the pre-activation sign), the resulting memory profile depends on each operator’s backward rule and dwarfs the model weights even on modest architectures.
The training memory sum dwarfs FP32 weight storage alone.
Consider an illustrative ResNet-50 training scenario with 25.6M parameters (~102.2 MB of FP32 weights), batch size 64, and \(224{\times}224\) images. With 8 GB–12 GB of saved activations, gradients add ~102.2 MB, and two Adaptive Moment Estimation (Adam) FP32 moment buffers add ~204.5 MB. Summing those four components gives an 8.4 GB–12.4 GB training scenario, roughly 82.3–121.4× the FP32 weight storage alone. This is a capacity-planning sum; actual peak memory depends on which components are live together. Inference requires no optimizer states, gradients, or saved backward buffers, but still has live activations and runtime workspace.
Parameter count alone therefore does not tell an engineer whether training fits. Total training memory obeys the four-component formulation (\(\TotalMemoryFootprint = \WeightMemory + \GradientMemory + \OptimizerStateMemory + \ActivationMemory\)) plus allocator overhead, as stated in Training memory.
Frameworks provide three graph-level controls to manage this trade-off. Activation checkpointing, whose mechanism listing 9 showed, alters what the graph retains: the engine stores selected segment boundaries and regenerates intermediate activations during the backward pass. In iron law terms, checkpointing increases the arithmetic operation count (\(\Operations\)) to reduce peak activation storage; its effect on transfer volume (\(\DataVolume\)) depends on the recomputation path. Tensor detachment sets a gradient boundary: calling .detach() makes subsequent operations treat that tensor as independent of its prior computation. It does not retroactively free all previously saved state, and cutting a path changes which gradients are computed. Transfer learning shows the payoff. When a frozen feature extractor runs with gradient recording disabled and its output enters the trainable head as a constant, autograd saves none of the extractor’s activations, so only the head pays the activation-storage cost. Mixed-precision training provides a third lever: representing eligible activations and weights in 16-bit formats halves their bytes relative to FP32, reducing tensor volume (\(\DataVolume\)) and enabling higher arithmetic throughput on supported Tensor Cores (\(\PeakRate\)).
↪ The decision of when these single-machine levers stop being enough and training must scale beyond one machine is developed in When to scale: The physical ceiling.
The recorded graph fixes which backward kernels the device must execute (the \(\Operations\) term), and the saved-tensor policy fixes how many bytes stay resident and move through the memory hierarchy (the \(\DataVolume\) term). Mixed precision acts on the second directly, because it shrinks every saved value and every operand a kernel reads.
Mixed-precision training support
Mixed precision (Micikevicius et al. 2018) improves two iron law terms at once. Tensor Cores run 16-bit matrix multiplications faster than FP32 units, raising \(\PeakRate\), and eligible 16-bit activations halve the bytes stored and moved, reducing \(\DataVolume\).
Micikevicius, Paulius, Sharan Narang, Jonah Alben, Gregory Diamos, Erich Elsen, David Garcia, Boris Ginsburg, et al. 2018. “Mixed Precision Training.” International Conference on Learning Representations (ICLR).
Automatic mixed-precision APIs implement this as a dispatch policy rather than a change to model code. Inside an autocast region, the dispatcher consults a per-operator precision list before selecting a kernel. Compute-intensive operations such as convolutions and linear projections run in FP16 or BF16, while numerically sensitive operations such as softmax, reductions, and loss calculations run in FP32. The second framework component, GradScaler, compensates for FP16’s narrow exponent range (5 bits, with normal values bounded below by \(\approx 6.10 \times 10^{-5}\)). It multiplies the scalar loss by a loss-scale factor \(\LossScaleFactor\) before backward traversal so that small gradients remain representable, divides the parameter gradients by \(\LossScaleFactor\) before the optimizer update, and skips any step whose gradients overflow. BF16 keeps FP32’s 8-bit exponent, so BF16 recipes usually run under autocast with the scaler disabled. The framework therefore supplies the dispatch and scaling machinery. The choice among FP16, BF16, TF32 (an Ampere-class matrix-multiply format pairing FP32’s exponent with FP16’s mantissa), and FP8, and the way the loss scale adapts during training, are policy decisions that Mixed-precision training develops. The scaling mechanism itself appears in Loss scaling. Listing 12 shows the two framework components working together in the FP16 path.
import torch
from torch.amp import autocast, GradScaler

model = MyModel().cuda()
optimizer = torch.optim.Adam(model.parameters())
scaler = GradScaler("cuda")

for inputs, targets in dataloader:
    inputs, targets = inputs.cuda(), targets.cuda()
    optimizer.zero_grad()

    # Framework automatically selects precision per operation
    with autocast(device_type="cuda", dtype=torch.float16):
        outputs = model(inputs)
        loss = criterion(outputs, targets)

    # GradScaler handles gradient scaling for numerical stability
    scaler.scale(loss).backward()
    scaler.step(optimizer)
    scaler.update()
Operation precision and weight storage are separate choices, so mixed precision also changes how many copies of each parameter training keeps. A small learning-rate-scaled update is often several orders of magnitude smaller than the weight it modifies, so adding that update directly in 16-bit floating point would round the increment to zero and stall learning. Under autocast the parameters therefore stay in FP32 for the optimizer update and are cast to 16 bits on the fly for eligible operations, while recipes that store persistent 16-bit working weights still keep an FP32 master copy where updates accumulate accurately. Either way, the optimizer’s FP32 moment buffers sit on top of gradients and saved activations. The per-parameter accounting, and the gap it opens between a model’s weight file and its training footprint, is worked in Worked example: Training vs. inference memory. Budgeting and reducing optimizer memory is developed in Reducing optimizer memory. The training checkpoints that write this state to storage, so a run can resume after a failure, appear in Training state and checkpoints.
Tensor lifetimes and the caching allocator
Checkpointing, fusion (section 7.4.2), and mixed precision decide which tensors exist during a training step and how many bytes each one occupies. The runtime still has to decide when each tensor’s memory is reclaimed and how fresh device memory is obtained. Where tensors live and how they move between host and device are the subject of section 7.5.2; the question here is narrower, namely when a value saved for the backward pass can be freed. In the retained-activation scheme of listing 8, forward layers add saved tensors that remain live until backward traversal consumes them. This saved-activation footprint peaks at the onset of backpropagation and recedes as intermediate buffers are released. Total training memory can peak later as gradients and temporary workspaces become live. Modern runtimes reclaim saved tensors once their backward consumers and other references no longer need them.
Allocation itself is also slow. Invoking device memory allocation and release (cudaMalloc and cudaFree) incurs substantial driver overhead, and cudaFree can block the host until all previously queued device work completes, draining accelerator command queues (Paszke et al. 2019). To eliminate this latency, modern frameworks intercept allocations with caching allocators that maintain pools of pre-reserved device memory blocks across training iterations. Suballocating from these pools amortizes device allocation costs and avoids the synchronizations that these calls can force, though varying tensor lifetimes can still induce memory fragmentation.
The snapshots in figure 9 distinguish tensor lifetime from allocator reservation. They assume a fixed pool with no additional segment growth, compaction, or virtual-address remapping, so the free-block geometry determines whether a request fits.
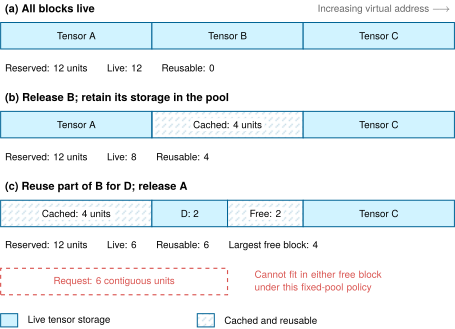
The failed request needs one contiguous virtual-address range, not physically contiguous DRAM. A real allocator may obtain another segment or use a different reuse policy, so this snapshot explains a possible failure under the stated policy rather than predicting every out-of-memory error. Device usage also includes allocations outside this pool.
Systems Perspective 7.1: Caching allocator and utilization
Caching allocators primarily reduce allocation overhead and improve block reuse. Two considerations remain:
- Allocation latency: Reusing a cached block avoids repeated device-allocation calls, whose cost and synchronization behavior depend on the allocator and runtime.
- Fragmentation: Size classes and block splitting improve reuse but can leave free capacity in blocks that do not satisfy a request. Because each tensor requires a contiguous address range, external fragmentation occurs when variable tensor lifetimes leave small, non-contiguous free blocks in the pool. A large allocation can trigger an out-of-memory (OOM) error even when the total aggregate free memory across all blocks exceeds the requested size.
An out-of-memory error can reflect live allocations, allocator-reserved blocks, fragmentation, or another process. nvidia-smi reports device-level usage and is not sufficient by itself to diagnose the framework allocator; allocator-specific memory statistics are needed.
7.4.4 Tape-based and transform-based differentiation
A training iteration can run more slowly in production than in an isolated profile because the full step coordinates the allocator, the device manager, the scheduler, the data pipeline, and the optimizer, work that an operator microbenchmark does not measure. How heavy that coordination is depends on how the AD system records computation in the first place. A framework that builds a dynamic trace at runtime pays per-operation bookkeeping on every forward pass, and its caching allocator must accommodate allocation patterns that can vary with execution. A framework that captures a stable computation, by contrast, may pre-plan buffers and reuse storage across the forward and backward graphs because it can reason about lifetimes before execution. The gain depends on capture coverage, tensor lifetimes, shapes, and backend support.
The execution models of section 7.3 dictate these designs. PyTorch (Paszke et al. 2019) builds its tape during forward execution, which grants unconstrained Python control flow and direct debugging but retains tape metadata and saved tensors until backward traversal completes. Early TensorFlow (Abadi et al. 2016) differentiated symbolically during graph construction, producing a fixed backward graph amenable to whole-graph dead-code elimination and memory reuse before execution. TensorFlow 2.x executes eagerly by default and compiles differentiation graphs through tf.function when throughput requires it (TensorFlow Developers 2024). JAX20 (Frostig et al. 2018) treats differentiation as a transformation that turns one function into its derivative function, which composes with vectorization (jax.vmap()) and compilation (jax.jit()) at the cost of requiring pure functions.
Abadi, Martı́n, Paul Barham, Jianmin Chen, Zhifeng Chen, Andy Davis, Jeffrey Dean, Matthieu Devin, et al. 2016. “TensorFlow: A System for Large-Scale Machine Learning.” Proceedings of the 12th USENIX Symposium on Operating Systems Design and Implementation (OSDI), 265–83.
20 JAX: JAX exposes grad, jit, and vmap as transformations on functions; they can be composed when one transformation’s outputs match what the next expects as inputs, but order matters: vectorizing gradients is not generally the same operation as differentiating a vector-valued result. Compilation can produce fused regions, library calls, and multiple kernels rather than one universal kernel. Transformed functions should be pure; Python side effects may occur during tracing but are not represented in the compiled program, while supported callbacks express intentional runtime effects.
Frostig, Roy, Matthew James Johnson, and Chris Leary. 2018. “Compiling Machine Learning Programs via High-Level Tracing.” Systems for Machine Learning.
These implementation differences determine how much debugging visibility, compiler optimization, and deployment portability a team can expect from each framework. Each design also resolves a tension common to all of them. Backward rules need forward information, while device memory limits how much of it can be kept, so every framework must choose which activations to save, which operations to fuse, and how much recomputation to accept. Those choices decide which models can train on a given accelerator.
Checkpoint 7.2: The systems cost of gradients
Training is inherently more expensive than inference because of automatic differentiation.
Computational reality
Optimization mechanics
The execution and differentiation problems together define the logical training loop: the execution model determines when operations run, and automatic differentiation constructs the backward pass that computes parameter gradients. Both layers, however, stop at the boundary where values must occupy physical memory and operations must map onto hardware-specific kernels across very different machines. Crossing that boundary is the third framework problem.
Self-Check: Question
For a neural network with \(N = 10^7\) parameters and a single scalar loss output \(M = 1\), why is reverse-mode automatic differentiation the standard training choice in deep learning frameworks?
- Reverse mode gets all parameter gradients from one reverse traversal whose work is proportional to the recorded graph, whereas forward mode would need one seeded direction per parameter to recover the full gradient
- Forward-mode differentiation cannot compute exact gradients and therefore is unusable for neural networks
- Reverse-mode differentiation requires no saved forward information, so it is always the lowest-memory choice
- Forward mode can differentiate only scalar element-wise functions, not matrix multiplications or network layers
A PyTorch user modifies an intermediate activation tensor using an in-place operation (
x.relu_()orx += 1) during the forward pass. Duringloss.backward(), autograd raises a runtime error: “one of the variables needed for gradient computation has been modified by an inplace operation”. What is the systems mechanism causing this failure?- In-place operations convert 32-bit floating point numbers to integers, corrupting floating-point precision
- The autograd tape recorded a reference to the forward tensor whose underlying storage was overwritten, destroying the original activation values required by the operation’s derivative formula
- In-place operations automatically set
requires_grad=Falseon all ancestor nodes in the computational graph - The GPU caching allocator prohibits in-place memory modifications during forward execution
Explain the difference between accumulating gradients in a tensor’s
.gradattribute across batches and retaining the autograd computational graph usingloss.backward(retain_graph=True).True or False: Because reverse-mode automatic differentiation computes exact gradients in a single backward pass, its peak memory consumption during training is identical to that of inference.
Order the sequence of events executed during reverse-mode automatic differentiation for a single training step:
Initialize the backward pass by seeding the output gradient adjoint with \(d\mathcal{L}/d\mathcal{L} = 1.0\)
Execute the forward pass while registering operations and saving required activation tensors on the autograd tape
Accumulate calculated parameter gradients into the
.gradattributes of leaf parametersCompute the scalar loss \(\mathcal{L}\) from model outputs and ground truth targets
Traverse the
GradFnDAG backward, applying operation-specific Vector-Jacobian Products (chain rule)To reduce GPU memory pressure from saved activations during long forward passes, frameworks can save only selected boundary tensors and recompute dropped intermediates during the backward pass. This memory-saving technique is called activation ____ (or rematerialization).
7.5 Abstraction: Tensors, Devices, and Operations
A model trained on data-center GPUs such as an NVIDIA H100 with tens of gigabytes of high-bandwidth memory must often deploy on a mobile phone’s ARM CPU, an Apple neural engine, a Google TPU, or an ARM microcontroller with 256 KB of SRAM, where the same torch.matmul call must dispatch to cuBLAS on one device and a hand-tuned ARM NEON kernel on another. The abstraction problem requires frameworks to hide this underlying hardware diversity behind a uniform programming interface without sacrificing the specialized instruction sets, memory layouts, and compute pipelines of each target. GPUs expose abundant throughput-oriented parallelism but have different memory and execution semantics from CPUs. TPUs favor regular tensor programs and compiler-visible shapes. A microcontroller has kilobytes where a server has gigabytes. Frameworks must therefore balance unified developer ergonomics against target-specific performance tuning.
The problem decomposes into two interacting dimensions. The first is data representation: how frameworks encode tensors, parameters, and computational state in forms that work across hardware. The second is execution mapping: how high-level operations translate into hardware-specific implementations. These dimensions are not independent concerns. The way data is represented (memory layout, precision, device placement) directly affects what execution strategies are possible. A tensor stored in row-major format on a GPU requires different kernels than one in column-major format on a CPU. A model quantized to INT8 enables entirely different execution paths than FP32.
Solving the abstraction problem requires tensor representations that encode both mathematical semantics and hardware constraints, intermediate representations that enable hardware-specific compilation, and runtime systems that manage data movement across the memory hierarchy. To make this concrete, trace what must happen when a programmer writes model(input). The framework must resolve four decisions in rapid succession. The rest of this section takes them in order: data representation (tensor shape, memory layout, numeric precision), device placement and movement (the bandwidth hierarchy connecting host memory, accelerator memory, and other accelerators), input delivery (data pipelines that keep the accelerator fed), and kernel execution (dispatch, scheduling, and resource management). Organizing thousands of tensors back into one model follows in section 7.6.
7.5.1 Tensors
In the ResNet-50 workload from section 7.4.3.2, a single forward pass touches 25.6M parameters, produces intermediate activations at every layer, and coordinates memory across CPU and GPU address spaces. Computational graphs specify the logical flow of those operations, while data structures determine how they access and manipulate data in physical memory. That physical layout can change throughput by an order of magnitude, depending on whether buffers are contiguous in cache, pinned for direct memory access (DMA) transfer, or scattered across pages.
What a tensor carries
To sustain terabytes per second of memory bandwidth across shapes from 1D sequences to 5D video while hiding device management behind a uniform API, every framework represents data with a single abstraction: the tensor. A tensor is an n-dimensional array that pairs a raw data pointer with a small metadata header tracking shape, stride, element type, target device, and differentiation state, allowing operators to dispatch the right kernel without copying the underlying buffer.
Every computation in a neural network operates on this single structure,21 which formalizes the boundary between mathematical array semantics and hardware storage.
21 Tensor: In mathematics, tensors obey coordinate-transformation laws; ML frameworks use the term more broadly for multidimensional arrays carrying shape, dtype, strides, device placement, and often automatic-differentiation metadata. A transpose commonly creates a strided view, while reshape may return either a view or a copy depending on the layout. These storage semantics make layout relevant to kernel selection and data movement.
Definition 7.2: Tensor
Tensors are \(\TensorAxisCount\)-dimensional arrays with shape, data type, stride, and device metadata. Framework runtimes use this information to select compatible operations and hardware kernels.
- Significance: A contiguous FP32 tensor of shape \([1024, 1024]\) occupies \(1024{\times}1024{\times}4\) = 4,194,304 bytes (about 4.2 MB). A noncontiguous view may be accepted directly by a strided kernel or may require materialization when an operation demands a supported contiguous layout.
- Distinction: NumPy arrays also carry shape, dtype, and stride metadata. Framework tensors additionally integrate device placement, automatic differentiation, and accelerator dispatch.
- Common pitfall: Tensor operations may return a new allocation, a view sharing existing storage, or an in-place update, depending on the operation and API variant. Memory accounting must distinguish these cases.
Because weights, gradients, master copies, optimizer moments, and saved activations are all tensors, they draw on the same device allocator and differ only in shape, dtype, device, and lifetime. That uniformity lets one caching allocator and one placement mechanism serve every role. It is also why a parameter count underestimates memory, since each weight tensor brings several companion tensors with it, as the training-versus-inference accounting of Worked example: Training vs. inference memory showed.
Rank, layout, and data type
Physical computer memory is a 1D array of linear byte addresses, whereas model inputs are 2D matrices, 3D RGB images, or 4D image batches. Tensors bridge this mismatch by pairing linear storage with coordinate axes whose count is the tensor’s rank. Figure 10 traces this rank expansion from left to right, progressing from a Rank 0 scalar cell and Rank 1 column vector (\(1, 3, 5, \dots, 3\)) to a Rank 2 matrix grid and Rank 3 isometric volume tensor.
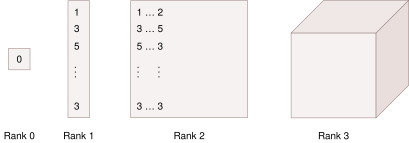
In vision applications, raw pixel arrays map directly onto multi-dimensional tensor layouts. For a \(3{\times}3\) pixel patch (figure 11), planar grids for height (3 pixels vertically) and width (3 pixels horizontally) stack along depth into three color channels (red, green, and blue), forming a rank-3 coordinate space.
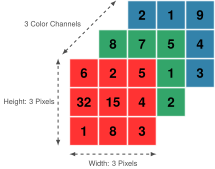
Scaling that \(3{\times}3{\times}3\) image patch to a training batch populates the header’s tensor metadata: a shape tuple (for example, [64, 3, 224, 224] for 64 RGB images), a dtype (framework literals such as float32, float16, or int8), and a device tag (cpu or cuda:0). At dispatch time, an operation such as matrix multiplication checks shape and device compatibility from this header and uses the dtype to route to the matching hardware kernel, whether a standard FP32 GEMM or a Tensor Core FP16 path.
Memory layout implementation introduces distinct challenges in tensor design. While tensors provide an abstraction of multi-dimensional data, physical computer memory remains linear. Stride patterns address this disparity by creating mappings between multi-dimensional tensor indices and linear memory addresses. Strides therefore fix the memory access pattern of every tensor operation and, with it, much of the operation’s performance. Figure 12 contrasts how a \(2{\times}3\) logical matrix maps into contiguous physical memory. Row-major ordering (top right, pink) packs elements sequentially along rows (\([1.0, 2.0, 3.0, 4.0, 5.0, 6.0]\)) using strides \([3, 1]\), whereas column-major ordering (bottom right, green) serializes along columns (\([1, 4, 2, 5, 3, 6]\)) using strides \([1, 2]\). In both schemes, the framework computes element offsets via \(\MatrixRowIndex\times \text{stride}[0] + \MatrixColumnIndex\times \text{stride}[1]\).
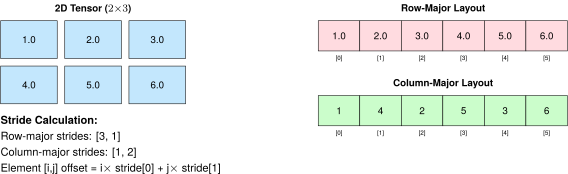
Stride choices become performance choices. Row-major layout (used by NumPy, PyTorch) stores elements row by row, making row-wise operations more cache-friendly. Column-major layout (used by some BLAS libraries) stores elements column by column, optimizing column-wise access patterns. The stride values encode this layout information: in row-major layout for a \(2{\times}3\) tensor, moving to the next row requires skipping three elements (stride[0] = 3), while moving to the next column requires skipping one element (stride[1] = 1).
These memory layout details have direct performance implications, but no ordering is universally superior. Efficient access depends on which dimension an operation traverses, the kernel’s supported layouts, vectorization, and the target memory hierarchy. A mismatched layout may require strided access or a conversion, while a kernel designed for that layout can access it efficiently. PyTorch’s .transpose() creates a view by swapping the shape and stride metadata while sharing the underlying storage. On the \(2{\times}3\) row-major tensor with strides [3, 1], transposing produces a \(3{\times}2\) view with strides [1, 3] without moving a single byte. Walking that transposed view row by row, however, visits elements out of sequential memory order, so a later reshape that expects a single uniform stride across the flattened elements cannot reuse the buffer as a view. Calling .contiguous() allocates a new buffer and copies the elements into sequential order whenever the existing strides do not already match the requested layout.
The dtype is the tensor-level lever that trades numerical range against data movement. The standard choice in machine learning has been FP32 precision, exposed in frameworks through dtype literals such as float32, offering a balance of precision and efficiency. Modern frameworks extend this with specialized numeric types: integers for indexing and embedding lookups, reduced-precision floating point such as FP16 for memory-efficient training and deployment, and narrow integers such as INT8 for high-throughput inference on specialized hardware. The choice of numeric type affects both model behavior and computational efficiency. Neural network training typically requires FP32 precision for accumulations to maintain stable gradient computations. Inference tasks can often use lower precision (framework dtype literals such as int8 or even int4, corresponding to INT8 and INT4), which reduces memory usage and increases processing speed. The autocast policy of section 7.4.3.3 combines these benefits per operation, running most computations at 16-bit precision while keeping accumulations and numerically sensitive operations in FP32. When operations mix tensors of different types, explicit casting rules must preserve numerical correctness without hiding the memory traffic and precision loss that each conversion introduces.
Tensors answer the data-representation problem by encoding shape, layout, and precision into a single abstraction. A perfectly shaped tensor on the wrong device, however, or one that must cross the PCIe-to-HBM bandwidth gap to reach the GPU, can erase every layout optimization. The next problem is placement: where data lives and how it moves.
7.5.2 Devices and memory
On an H100, the PCIe Gen5 x16 host link delivers 64 GB/s between CPU and GPU while on-package HBM3 provides 3.35 TB/s inside the GPU, a 52.3× bandwidth gap that lets a single misplaced tensor copy erase the entire speedup of GPU acceleration. Where tensor data physically resides, and how it moves between host and accelerator memory, therefore determines whether computation runs at HBM speed or stalls on the host interconnect.
Frameworks as the operating system interface
While the high-level API focuses on math, the framework backend plays the role that an operating system plays for a single machine. It schedules compute and moves data, building on the CUDA runtime’s primitives for launching kernels and managing device memory.
↩︎ The single-node stack, in which the operating system moves data between host memory and accelerator memory, is established in Inside one machine: The single-node stack.
On the data-movement side, the framework coordinates with this runtime to implement DMA over the PCIe bus. The bandwidth gap between the host (CPU) and device (GPU) is the first bottleneck a data-loading pipeline meets, and Bandwidth versus latency models this transfer, separating the two constraints, \(\Time= \Latency + \DataVolume/\Bandwidth\), that determine whether a given data-loading strategy is limited by per-transfer latency or by sustained bandwidth. Frameworks mitigate this through pinned memory (page-locked host memory), which enables DMA transfers without pageable-memory staging. This host-device interface is what makes high-throughput training loops possible on a single machine.
On the H100, on-device HBM3 outruns the host PCIe link by 52.3×.
Because cross-device operations cross that 52.3× gap, the framework tracks where every tensor lives and requires that operations combine only tensors on the same device. When data must move, the framework must decide whether to block execution or overlap the transfer with other work. These decisions, invisible to most users, can move a training loop from transfer-bound execution toward substantially higher hardware utilization.
Three principles govern device and memory management: respect the bandwidth hierarchy, overlap unavoidable transfers with computation, and synchronize only where correctness requires it. The bandwidth hierarchy comes first, because the cost of moving data between devices varies by orders of magnitude with the interconnect.22 For a \(1000{\times}1000\) float32 tensor (4 MB), roughly the size of an activation tensor in a moderately sized model, the transfer times in table 7 separate the on-device path from every host link by more than an order of magnitude.
22 NVLink: NVIDIA’s high-bandwidth GPU-to-GPU interconnect, providing 900 GB/s bidirectional bandwidth (NVLink 4.0 on the H100) compared to 128 GB/s for its PCIe Gen5 x16 host link. This 7.0× bandwidth advantage determines whether tensor parallelism, splitting one large tensor computation across multiple GPUs, is practical for a given model size: GPUs connected only by PCIe can make the \(\DataVolume/\Bandwidth\) communication term dominate total training time, erasing the benefit of additional compute.
| Interconnect | Bandwidth | Transfer Time | Path |
|---|---|---|---|
| PCIe Gen5 x16 | 64 GB/s | 62.5 μs | Host to device |
| NVLink 4.0 | 450 GB/s per direction (900 GB/s bidirectional) | 8.9 μs | GPU to GPU |
| HBM3 | 3,350 GB/s | 1.2 μs | On device |
These numbers connect directly to the iron law of ML systems. Every cross-device transfer contributes to \((\DataVolume/\Bandwidth)\) at a fraction of on-device bandwidth. Dividing 1 GB by the stated PCIe Gen5 x16 peak gives 15.6 ms, a bandwidth-only lower bound that omits protocol, launch, synchronization, topology, and contention overhead. Transfers can dominate lightweight or small-batch workloads, so deployed latency must be measured rather than inferred from peak bandwidth alone.
Device placement discipline protects the bandwidth hierarchy from accidental PCIe traffic. Every tensor carries a device attribute, and frameworks enforce a strict invariant: operations can only combine tensors on the same device, raising a RuntimeError when cuda:0 and cuda:1 tensors mix so that cross-device transfers remain explicit. Calling .to() on a tensor returns the original tensor when its data type and device already match the request (unless copy=True forces a copy) and otherwise returns a converted copy; in contrast, nn.Module.to() modifies registered parameters and buffers in place and returns the module.
The performance discipline follows directly from this bandwidth gap. Allocate tensors on the target device from the start rather than creating them on the host and transferring them. Reuse GPU memory across iterations rather than reallocating it. Colocate inputs, labels, and model parameters on the same device to eliminate implicit transfers. At 64 GB/s, violating any of these principles inserts PCIe transfers into the critical path that can dominate a training iteration that otherwise runs at 3.35 TB/s on-device.
When transfers are unavoidable, the next optimization is to hide their latency by executing them concurrently with computation. GPUs contain separate hardware units for computation (streaming multiprocessors) and data transfer (copy engines), and the framework exposes them through the CUDA stream, an execution queue whose operations run in order within the stream but concurrently with other streams. When copies and computation share one stream, they execute serially. Placing the next batch’s transfer on one stream while the current batch computes on another can make the steady-state batch interval approach \(\max(\IronLawComputeTime, \BatchTransferTime)\), the larger stage time rather than their sum. Each batch still requires its own transfer to finish before its consumer runs. With sufficient independent work and hardware resources, stream-based overlap can hide much of the \(\DataVolume/\Bandwidth\) penalty when computation is the longer stage (see listing 13).

Overlap pays the longer stage, not the sum.
The non_blocking=True flag requests a copy that is asynchronous with respect to the host, but real overlap also requires pinned memory. Ordinary host memory is pageable: the operating system may relocate or swap its pages at any time, and a DMA engine, which copies across PCIe without involving CPU cores, cannot handle a page fault. A copy from pageable memory therefore first stages the data synchronously into a temporary pinned buffer. Tensors placed in pinned (page-locked) host memory skip that staging, so their transfers can overlap accelerator computation. In listing 13 the two streams are separate; a complete pipeline must also hand each transferred batch to its consumer only after the copy completes, using the synchronization mechanisms that follow.
compute_stream = torch.cuda.Stream()
transfer_stream = torch.cuda.Stream()

# Transfer next batch while computing
# current batch
with torch.cuda.stream(transfer_stream):
    next_batch = next_batch_cpu.to("cuda", non_blocking=True)

with torch.cuda.stream(compute_stream):
    output = model(current_batch)
    loss = criterion(output, labels)

# Pinned host memory can enable transfer overlap
x_pinned = torch.randn(1000, 1000).pin_memory()
x_gpu = x_pinned.to("cuda", non_blocking=True)  # Asynchronous

# A pageable source may require staging and
# should not be assumed to overlap
y_regular = torch.randn(1000, 1000)
y_gpu = y_regular.to("cuda", non_blocking=True)
Concurrent execution introduces ordering constraints: when one stream’s output becomes another stream’s input, the system must enforce a happens-before relationship without unnecessarily serializing independent work. Two synchronization mechanisms exist, and their performance consequences differ sharply. Full device synchronization (torch.cuda.synchronize()) blocks all streams and the CPU until every queued operation completes, creating a global serialization point that eliminates overlap. CUDA events provide the alternative: fine-grained synchronization that blocks only the dependent stream, allowing other streams and the CPU to continue execution (see listing 14).
# Create streams and event
stream1 = torch.cuda.Stream()
stream2 = torch.cuda.Stream()
event = torch.cuda.Event()

# Stream 1: producer
with torch.cuda.stream(stream1):
    result1 = expensive_computation(data1)
    event.record()  # Mark completion point

# Stream 2: consumer (waits only for stream1's event)
with torch.cuda.stream(stream2):
    event.wait()  # Block stream2 until event is recorded
    result2 = dependent_computation(result1)  # Safe to use result1
Full synchronization after every operation converts a concurrent pipeline into a sequential one, negating the hardware parallelism that streams expose, whereas event-based synchronization enforces only the dependencies that correctness requires. That difference creates a common operational trap: debug code left with torch.cuda.synchronize() in the hot path turns an overlapped pipeline into a serialized one. A timeline profiler shows the resulting gaps between kernels, while the kernel profilers and hardware counters that explain why an individual kernel underperforms belong to the profiling method of Identifying Bottlenecks.
Placement across accelerators
The same placement machinery extends to the one to eight accelerators of a single machine across three alternative placement choices. In data parallelism, each device holds a complete replica of the model and processes a different slice of the batch, summing every replica’s gradients after the backward pass through an AllReduce collective. In pipeline parallelism, devices hold different groups of layers and pass activations between them; in tensor parallelism, individual tensor operations split across devices. Frameworks express device ownership, transfers, and synchronization through named device groups, such as ProcessGroup in PyTorch or Mesh in JAX, while preserving the model’s semantics as the hardware path underneath changes. NVLink delivers 900 GB/s of bidirectional bandwidth per H100 inside one node (table 7), while devices joined only by PCIe pay the slower path for every exchange. Parameter state multiplies with each arrangement, because every weight brings a gradient, optimizer moments, and often a second copy at another precision, and each replica or partition must own its share. Which arrangement to choose, and what its communication costs, is developed in Scaling Training Systems; on a single machine, however, even well-placed accelerators sit idle if the host data pipeline cannot feed them fast enough.
↪ The AllReduce collective and its communication cost are developed in Data parallelism.
7.5.3 Data loading
Streams and events hide transfers behind computation, but scheduling cannot help if input data arrives too slowly in the first place. The data pipeline must sustain the accelerator’s consumption rate. An accelerator processing 1,000 images per second at 224 by 224 resolution needs about 150.5 MB/s of sustained raw uint8 image throughput. Any shortfall idles the accelerator and lowers the effective utilization term in the iron law. The framework’s contribution to this feeding problem is an abstraction that separates what a sample is from how samples reach the device. A Dataset defines access to individual samples, and a DataLoader (Paszke et al. 2019) turns that definition into a pipeline built from parallel worker processes, prefetching, and pinned staging memory.
Paszke, Adam, Sam Gross, Francisco Massa, Adam Lerer, James Bradbury, Gregory Chanan, Trevor Killeen, et al. 2019. “PyTorch: An Imperative Style, High-Performance Deep Learning Library.” Advances in Neural Information Processing Systems (NeurIPS) 32: 8024–35.
↩︎ The feeding problem, in which data delivery must keep pace with accelerator consumption, is established in The feeding problem.
Worker processes come first. With num_workers > 0, the DataLoader spawns CPU processes that load and preprocess samples independently, distributes sample indices to them through a shared queue, and assembles their completed samples into batches in the main process. Multiple workers overlap I/O wait with decoding and augmentation when one process is too slow to feed the accelerator; once the pipeline meets demand, extra workers add overhead rather than throughput.

Four workers fill eight prefetched batches, which drain through pinned memory to the GPU.
Prefetching sets pipeline depth. The prefetch_factor parameter controls how many batches each worker prepares in advance, so four workers with prefetch_factor=2 keep up to eight batches in flight, at a cost in host memory proportional to the queued data. Prefetching raises the chance that input work overlaps accelerator computation but cannot prevent stalls when storage, decoding, or contention makes production slower than consumption.
Pinned memory completes the path to the device. The pin_memory=True option places batches in the page-locked host memory of section 7.5.2, so their host-to-device copies skip pageable-memory staging and can overlap device work. For a batch of 64 FP32 images at \(224{\times}224{\times}3\) (38.5 MB), dividing by the H100’s PCIe Gen5 x16 peak gives 0.6 ms; this is a bandwidth-only lower bound, not a measured pinned-transfer latency. The realized benefit over pageable memory depends on the platform, batch size, pipeline, and overlap. Pinned pages also reduce pageable system memory.
The DataLoader configuration in listing 15 is useful only when each parameter is tied to a bottleneck: num_workers sets loading parallelism, prefetch_factor sets pipeline depth, and pin_memory enables DMA transfers. Each worker also holds its own copy of the Dataset object and its own Python state, so the worker count trades throughput against host memory. Changes one worker makes to that state do not reach the others or the main process unless the state lives in explicitly shared or memory-mapped storage. PyTorch seeds each worker’s own generator separately, but augmentation code that draws from NumPy or Python’s random module still needs a worker_init_fn such as seed_worker.
import random

import numpy as np
import torch
from torch.utils.data import DataLoader


def seed_worker(worker_id):
    worker_seed = torch.initial_seed() % 2**32
    np.random.seed(worker_seed)
    random.seed(worker_seed)


loader = DataLoader(
    dataset,
    batch_size=64,
    shuffle=True,
    num_workers=4,  # Parallel worker processes (mechanism 1)
    prefetch_factor=2,  # Batches prepared ahead per worker (mechanism 2)
    pin_memory=True,  # Page-locked memory for DMA (mechanism 3)
    worker_init_fn=seed_worker,  # Reproducible augmentation per worker
)

# Pipeline effect: while GPU processes batch N,
# 4 workers load batches N+1..N+8 into pinned memory,
# ready for DMA transfer when the GPU finishes.
↪ Sizing worker count and prefetch depth against measured throughput and memory is developed in Practical considerations.
The Dataset interface decides how samples can be scheduled. A map-style dataset implements __len__ and __getitem__, so a sampler can shuffle by index, which suits data that fits in memory or supports efficient random access on disk. An iterable-style dataset implements __iter__ and yields samples sequentially from a stream where random access is impractical, so any shuffling must be buffered inside the iterator. Batch collation through the collate_fn parameter then combines samples into a batch. The default stacks tensors along a new batch dimension, which requires identical shapes; variable-length data such as text needs custom collation that pads, sorts by length, or builds attention masks, and those choices change both memory use and throughput.
With input delivered at the rate the accelerator consumes it, the remaining abstraction problem is execution, the translation of each operation into work that runs on the target hardware.
7.5.4 Core operations
Calling y = torch.matmul(x, w) without selecting a kernel matched to x and w’s device, data type, stride layout, and tile dimensions either fails at runtime or leaves Tensor Cores idle while a generic loop crawls through memory. Bridging that single Python call to thousands of parallel accelerator threads traverses three coordinated functional tiers. From left to right in figure 13, system-level operations (scheduling, memory management, and resource optimization) organize graph execution. Basic numerical operations (GEMM, BLAS, and element-wise kernels) execute algebraic routines. Hardware operations (compute kernel management, memory abstraction, and execution control) bind the workload directly to device streams and physical silicon, starting at the bottom of the stack with the hardware primitives themselves.
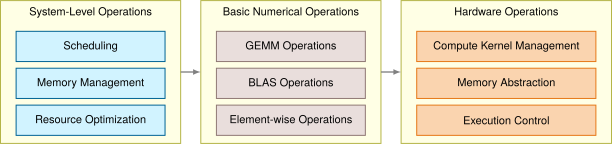
Hardware abstraction operations
The hardware abstraction layer isolates framework code from platform-specific details. It solves three concrete problems: selecting the right compute kernel, moving data through the memory hierarchy, and coordinating execution across processing units.
The kernel manager dispatches each supported operation to an implementation for the current backend. For matrix multiplication, this may be a CPU BLAS backend such as Intel oneMKL or OpenBLAS (Intel Corporation 2026; OpenBLAS Project 2026), cuBLAS on NVIDIA GPUs (NVIDIA 2024), or accelerator-specific tensor instructions. Selection depends on dimensions, dtype, layout, backend, and library heuristics. A \(4096{\times}4096\) FP16 GEMM on an H100 may use a Tensor Core path whose published dense peak is 989 TFLOP/s (Choquette 2023; NVIDIA Corporation 2022). If the backend has no implementation for an operator, execution may fall back, be partitioned, or fail, depending on the framework and runtime.
Choquette, Jack. 2023. “NVIDIA Hopper H100 GPU: Scaling Performance.” IEEE Micro 43 (3): 9–17. https://doi.org/10.1109/mm.2023.3256796.
NVIDIA Corporation. 2022. NVIDIA H100 Tensor Core GPU Architecture. NVIDIA Corporation.
The memory abstraction layer moves tensors among pageable or pinned host memory, device memory, and unified memory, and transforms data layouts to match hardware preferences. Because physical memory is the one-dimensional byte array of section 7.5.1.2, layout formats dictate how 4D image dimensions map to linear addresses: channels-first NCHW places all spatial pixels of one channel contiguously before storing the next channel, whereas channels-last NHWC groups all channel values for a single spatial coordinate consecutively. Accelerator matrix units often prefer NHWC because loading all channels for a pixel aligns with a single, contiguous 128-byte memory transaction (a coalesced access). A framework may therefore execute kernels in NHWC for peak hardware utilization while preserving NCHW for user-facing APIs. Alignment requirements vary from 4 bytes on CPUs to 128 bytes on high-bandwidth accelerators; misaligned or strided accesses split requests across multiple memory transactions and can cut effective bandwidth substantially. The runtime also preserves dependency ordering when multiple execution units access the same tensor, preventing races during concurrent operations.
The execution controller coordinates work across multiple processing units and memory spaces. On a modern GPU, graph runtimes or explicit stream use can overlap independent kernels when dependency analysis proves they are ready and the kernels leave enough resources unused to run concurrently. Eager default-stream execution often serializes this work instead. The controller inserts synchronization barriers where data dependencies require them, tracks event completions to trigger dependent operations, and routes hardware errors (ECC failures, timeout watchdogs) to the framework’s error handling path.
Basic numerical operations
With hardware abstraction managing the platform-specific details, frameworks build a layer of mathematical operations on top. GEMM dominates ML computation. The operation \(\GemmOutputMatrix= \GemmProductScale\ActivationMatrix\WeightMatrix+ \GemmAccumulatorScale\GemmOutputMatrix\) accounts for the vast majority of arithmetic in neural networks: a single ResNet-50 forward pass performs approximately 8.2 GFLOP, nearly all of which reduce to GEMM. General matrix multiply (GEMM) derives how GEMM arithmetic intensity scales with matrix dimension, predicting whether a given layer is compute bound or memory bound before any profiler runs. Frameworks optimize GEMM through cache-aware tiling (splitting matrices into blocks that fit in L1/L2 cache), loop unrolling for instruction-level parallelism, and shape-specific kernels. Fully connected layers use standard dense GEMM, while convolutional layers use im2col transformations that reshape input patches into matrix columns, converting convolution into GEMM.
↪ Tiling on an accelerator, where on-chip storage and the compute array fix the tile size and a dimension one element past a tile boundary can halve utilization, is developed in Tiling.
Beyond GEMM, frameworks implement BLAS operations (AXPY for vector addition, GEMV for matrix-vector products) and element-wise operations (activation functions, normalization). Element-wise operations are individually cheap but collectively expensive, because each one reads and writes its full tensor; they are the fusion targets of section 7.3.2.
Each of these numerical operation families requires separate kernel implementations for every supported precision format. Storing weights and activations in FP32 uses 4 bytes per value, whereas quantizing to INT8 reduces this to 1 byte, cutting memory traffic by 4× and enabling 2–4\(\times\) throughput gains on hardware with INT8 matrix units. Because a single forward pass often mixes narrow-precision GEMMs with higher-precision accumulations and norms, the kernel library must dispatch per-precision routines layer by layer.
System-level operations
Hardware abstraction and numerical operations provide the building blocks; system-level operations orchestrate them. The scheduler orders operations by their graph dependencies and overlaps independent work through the streams and events of section 7.5.2. The memory manager reuses freed blocks through the caching allocator of section 7.4.3.4 and, when a model exceeds device memory, executes the activation-checkpointing policy of section 7.4.2. The resource optimizer ties these decisions to the kernel selection described earlier. Its failures are the ones those mechanisms predict, since a poor schedule leaves resources idle and fragmentation or excessive live state can cause an out-of-memory error even when aggregate device capacity appears sufficient.
Checkpoint 7.3: Hardware abstraction
The abstraction problem is the bridge between portable code and efficient execution.
Tensors, streams, and kernel dispatch complete the descent to the hardware, but they operate at the granularity of individual buffers and operations. Model development needs the opposite direction, composing thousands of low-level operations, together with the parameters that automatic differentiation tracks, into reusable, nestable building blocks called modules.
Self-Check: Question
In framework tensor implementations such as PyTorch
Tensoror NumPyndarray, what distinguishes a tensor view from a tensor copy?- A view converts the underlying data from floating-point to integer representation
- A view changes only tensor metadata while sharing the same storage, though reshape can do this only when the existing strides permit the requested layout
- A view duplicates the tensor into host CPU memory while leaving device memory unchanged
- A view guarantees the tensor is stored in contiguous C-order memory
A training loop shows GPU idle time because batches arrive late from the input pipeline. How can
pin_memory=Truetogether withtensor.to(device, non_blocking=True)help, and what does it not guarantee by itself?- It automatically quantizes all host tensors to 8-bit precision so the GPU receives less data
- It bypasses the data loader by executing preprocessing directly inside GPU kernels
- It places batches in page-locked host memory so eligible host-to-device copies can use DMA and potentially overlap with device work, but actual overlap still depends on having independent batches, streams, and correct dependency ordering
- It forces every CUDA kernel to run on the default stream so transfer and compute become easier to coordinate
Why can an accidental synchronous CPU-GPU tensor transfer (such as calling
.item()or printing a tensor inside a training loop) degrade throughput far more than the raw byte transfer time would suggest?
7.6 Modules: From Operations to Models
Coordinating those same 25.6M ResNet-50 parameters across fifty layers requires registering weights with optimizers, moving buffers across devices, toggling training and evaluation modes, and serializing checkpoints. Managing that state tensor by tensor would drown model development in error-prone bookkeeping. Frameworks resolve this through hierarchical composition, packaging layers into modules that compose into full models.
Every major framework implements this through a module abstraction that binds parameter tensors, forward computation, and lifecycle hooks into a unified interface. PyTorch’s nn.Module23 provides an instructive case study because its design patterns recur across frameworks. Keras uses similar layer abstractions (Chollet 2018), JAX’s Flax employs analogous module structures, and TensorFlow’s functional API shares conceptual parallels. Three enduring design principles recur regardless of syntax or programming paradigm.
23 nn.Module: The pattern recurs across frameworks because the organizational problem is universal. nn.Module automatically registers any assigned submodule or parameter into a hierarchical tree, enabling a single .to('cuda') call to recursively place millions of parameters onto a GPU. Keras layers, JAX Flax modules, and TensorFlow’s tf.Module all implement the same tree-walking pattern. Without it, managing model state would require manual bookkeeping that scales linearly with architectural depth, a cost that grows prohibitive for models with hundreds of layers.
Chollet, François. 2018. Deep Learning with Python. Manning Publications.
7.6.1 Automatic parameter discovery
Passing each of ResNet-50’s weight and bias tensors to an optimizer by hand would break the moment a layer is added or renamed. Frameworks eliminate that manual wiring through automatic parameter discovery: the system walks the module tree, collecting every parameter tensor so the optimizer can update them in a single call.
This is a tree traversal problem at its core. PyTorch’s Module.__setattr__ registers an assigned nn.Parameter or child nn.Module in the module’s internal mappings. A call to .parameters() recursively traverses registered submodules and yields registered parameters. Other frameworks expose analogous parameter trees or collections, though their mechanisms differ.
Automatic parameter discovery gives the optimizer a complete parameter set or parameter groups, enabling grouped or fused multi-tensor update kernels when the framework and backend support them. The immediate win is correctness and composability: newly attached submodules participate in device moves, serialization, and optimizer construction without a separate manual registry. It also lets optimized update paths operate over parameter collections without per-parameter user code. Listing 16 demonstrates the core mechanism: attribute assignment triggers registration, and .parameters() returns all discovered tensors.
The distinction between parameters and buffers illustrates a subtlety of discovery. Registered parameters appear in .parameters() whether trainable or frozen; requires_grad separately controls whether autograd accumulates a gradient for them. Registered buffers move with the module and can appear in its state dictionary but are excluded from .parameters() and ordinary optimizer discovery. Batch-normalization running statistics are a common buffer use case.
import torch
import torch.nn as nn


class CustomLayer(nn.Module):
    def __init__(self, input_size, output_size):
        super().__init__()
        self.weight = nn.Parameter(
            torch.randn(output_size, input_size)
        )
        self.bias = nn.Parameter(torch.randn(output_size))
        self.register_buffer("running_mean", torch.zeros(output_size))

    def forward(self, x):
        return torch.matmul(x, self.weight.t()) + self.bias


layer = CustomLayer(10, 20)
# Framework discovers both parameters automatically:
for name, param in layer.named_parameters():
    print(f"{name}: shape {param.shape}")
The other major frameworks draw the same line between trainable parameters and nontrainable state through different accessors (table 8). Regardless of syntax, each API separates tensors that the optimizer should update from persistent buffers that merely ride along in checkpoints and device transfers.
| Framework | Parameter Access | Nontrainable State |
|---|---|---|
| PyTorch | model.parameters() |
register_buffer() |
| Keras | layer.trainable_weights |
layer.non_trainable_weights |
| JAX/Flax | variables["params"] after variables = model.init(key, x) |
Separate variable collections (for example, batch_stats) |
| TensorFlow | module.trainable_variables |
module.non_trainable_variables |
7.6.2 Mode-dependent behavior
The same module tree that distinguishes trainable parameters from running-statistic buffers also governs layers whose forward computation changes between training and inference. During training, dropout layers randomly zero elements with probability \(\DropoutProbability= \Pr(\text{drop})\) to regularize the network, while during inference those same layers must perform identity mapping to produce deterministic outputs. Batch normalization uses per-batch statistics during training but switches to accumulated running statistics during inference. If these behavioral changes are left to the programmer, forgetting a single mode switch produces silently incorrect predictions in production.
Frameworks solve this with a state flag that propagates through the module hierarchy. A single call to .eval() on the root module recursively sets self.training = False on every descendant, and each layer queries this flag to select its behavior. This is an instance of a broader systems principle: the same computation graph must produce different execution behavior depending on context. Compilers face the same challenge when the same source code must produce debug builds (with bounds checking and symbol tables) vs. release builds (with aggressive optimization). The flag-propagation pattern ensures correctness by centralizing the mode decision at the root rather than requiring per-layer coordination.
Evaluation mode and gradient recording are separate controls. Calling .eval() changes mode-dependent layer behavior but leaves autograd recording enabled. For inference that needs no gradients, torch.no_grad() disables that recording, avoiding the associated saved backward state while .eval() selects the appropriate layer behavior.
Per-parameter gradient control works alongside torch.no_grad() during transfer learning through parameter freezing. Setting requires_grad=False on a submodule’s parameters prevents autograd from accumulating gradients in those parameters and removes their gradient storage, although gradients may still need to pass through the layer’s operations to reach trainable inputs or earlier parameters. Because both mode propagation and subtree freezing operate on nested modules, they rely on how the framework composes layers into a hierarchy and serializes that hierarchy’s state.
7.6.3 Hierarchical composition and serialization
Complex models compose from reusable submodules, creating a tree structure. A ResNet is not implemented as a monolithic block of operations but as a hierarchy: the root module contains a sequence of residual blocks, each block contains convolution layers and normalization layers, and each layer contains parameter tensors. This hierarchical composition must support two operations, made concrete in listing 17: recursive parameter collection for training and state serialization for checkpointing and deployment.
import torch
import torch.nn as nn


class ResidualBlock(nn.Module):
    def __init__(self, channels):
        super().__init__()
        self.conv1 = nn.Conv2d(channels, channels, 3, padding=1)
        self.bn1 = nn.BatchNorm2d(channels)
        self.conv2 = nn.Conv2d(channels, channels, 3, padding=1)
        self.bn2 = nn.BatchNorm2d(channels)

    def forward(self, x):
        residual = x
        x = torch.relu(self.bn1(self.conv1(x)))
        x = self.bn2(self.conv2(x))
        return torch.relu(x + residual)


class ResNet(nn.Module):
    def __init__(self, num_blocks, channels=64):
        super().__init__()
        self.conv_in = nn.Conv2d(3, channels, 7, padding=3)
        self.blocks = nn.ModuleList(
            [ResidualBlock(channels) for _ in range(num_blocks)]
        )
        self.fc = nn.Linear(channels, 10)

    def forward(self, x):
        x = self.conv_in(x)
        for block in self.blocks:
            x = block(x)
        x = x.mean(dim=[2, 3])  # Global average pooling
        return self.fc(x)


model = ResNet(num_blocks=4)
total = sum(p.numel() for p in model.parameters())
print(f"Total parameters: {total}")
# state_dict() flattens the tree: 'blocks.0.conv1.weight', etc.
print(list(model.state_dict().keys())[:4])
Hierarchical composition mirrors the hardware memory hierarchy in a systems-relevant way: each submodule’s parameters can be loaded independently, enabling placement across devices. When a model is too large for a single GPU, the framework can assign different subtrees of the module hierarchy to different devices, with the tree structure providing natural partition boundaries.
The state_dict() method produces an ordered mapping whose dotted keys (for example, blocks.0.conv1.weight) encode locations in the module hierarchy. A checkpoint for 7 billion FP16 parameters contains approximately 14 GB of weight payload before metadata or additional state, but the file format and storage path determine how those bytes are serialized. Resuming training needs more than the model’s state: optimizers expose their moment buffers and step counts through their own state_dict(), and a training checkpoint saves both so that the run continues with the same optimizer state. load_state_dict() copies matching parameter and buffer values into an already-constructed module and reports missing or unexpected keys according to its strictness setting; it does not reconstruct the module hierarchy. Cross-framework exchange requires a compatible graph and operator representation in addition to weights.
The hierarchical structure also enables module-level traversal for systematic operations. Methods such as .named_modules() iterate the entire tree, supporting bulk transformations such as replacing all BatchNorm layers with GroupNorm or applying Xavier initialization to every Linear layer. These traversal operations depend on the same tree structure that enables parameter discovery, illustrating how a single design decision propagates benefits across multiple use cases.
None of these three principles is specific to PyTorch. Keras layers, Flax modules, and functional approaches address the same problems of parameter management, state tracking, and composition, and differ in how they prioritize among competing solutions rather than in which problems they solve. Two practical patterns show how the principles become system controls: selective parameter freezing reduces unnecessary gradient work for transfer learning (listing 18), and module hooks provide noninvasive inspection (listing 19).
requires_grad=False on a pretrained backbone keeps it fixed while a newly attached head trains, and the optimizer receives only the trainable parameters.
import torch
import torch.nn as nn
from torchvision.models import ResNet18_Weights, resnet18

# Freeze all parameters in a pretrained
# model
pretrained_model = resnet18(weights=ResNet18_Weights.DEFAULT)

for param in pretrained_model.parameters():
    param.requires_grad = False

# Replace final layer with trainable parameters
pretrained_model.fc = nn.Linear(512, 10)  # New layer is trainable

# Only fc.parameters() will receive
# gradients during training
optimizer = torch.optim.Adam(
    filter(lambda p: p.requires_grad, pretrained_model.parameters()),
    lr=0.001,
)
Module hooks are the inspection counterpart to parameter freezing. They intercept intermediate computations without modifying model code, enabling gradient flow diagnosis and activation monitoring (listing 19).
import torch
import torch.nn as nn

model = nn.Sequential(nn.Linear(10, 20), nn.ReLU(), nn.Linear(20, 5))


# Forward hook to inspect activations
def forward_hook(module, input, output):
    print(
        f"Layer: {module.__class__.__name__}, "
        f"Output shape: {output.shape}, "
        f"mean={output.mean():.3f}, "
        f"std={output.std():.3f}"
    )


# Backward hook to inspect gradients
def backward_hook(module, grad_input, grad_output):
    print(f"Gradient norm: {grad_output[0].norm():.3f}")


# Register hooks on specific layer
handle_fwd = model[0].register_forward_hook(forward_hook)
handle_bwd = model[0].register_full_backward_hook(backward_hook)

# Execute forward and backward pass
x = torch.randn(32, 10)
y = model(x)
loss = y.sum()
loss.backward()

# Remove hooks when done
handle_fwd.remove()
handle_bwd.remove()
Parameter discovery, freezing, and hooks are how the module abstraction turns thousands of tensors, each with its own shape, dtype, device, and lifetime, into one object that an optimizer can update, a serializer can save, and a profiler can inspect. With execution, differentiation, and abstraction each examined on its own, the remaining step is to watch them operate together: a single training step exercises every mechanism of this chapter at once.
Self-Check: Question
In framework module abstractions like PyTorch’s
nn.Module, what systems mechanism enablesoptimizer = torch.optim.Adam(model.parameters())to find all registered model weights without the developer manually listing every tensor?- Python automatically compiles all local variables into an optimization graph
- The GPU driver scans VRAM at runtime to detect all floating-point matrices
- The autograd engine injects global hooks into Python’s garbage collector
- Overridden attribute assignment registers
nn.Parameterobjects in the module tree, andparameters()recursively walks that registered structure
Explain why setting
model.eval()is necessary for numerically correct inference in models containing BatchNorm or Dropout, and clarify whymodel.eval()is not a substitute for disabling gradient recording.In PyTorch’s
nn.Module, the dictionary data structure returned bymodel.____()serializes all learnable parameters and persistent non-parameter buffers (such as BatchNorm running statistics) into named tensor mappings for checkpointing.What does
load_state_dict()fundamentally do in the module serialization pattern described in the section?- It loads parameter and buffer values into an already constructed matching module rather than reconstructing the architecture from scratch
- It automatically quantizes all stored tensors before loading them into the model
- It discovers the model architecture from weights alone and rebuilds any missing layers
- It guarantees cross-framework portability as long as the tensor shapes match
7.7 Anatomy of a Training Step
In every iteration of a training loop, millions of floating-point operations, dynamic memory allocations, and hardware kernel launches must complete within a step that lasts anywhere from microseconds to seconds. For the small network below, as the analysis shows, host dispatch takes most of that time. Execution, differentiation, and hardware abstraction operate simultaneously during model training. In listing 20, a minimal two-layer multilayer perceptron illustrates this convergence across eight executable statements. Tracing each statement through the runtime stack connects the quantitative principles developed in section 7.3.7 to physical execution.
The network is a two-layer version of the MNIST digit classifier from Neural Computation, with 784 inputs, 128 hidden units, and 10 outputs, trained at batch size 32. The example assumes trainable CUDA tensors W1 and W2 with shapes (784, 128) and (128, 10), matching bias vectors b1 and b2, and an optimizer already constructed over these parameters. The listing shows one iteration after that setup.
# Single training step for a 2-layer MLP
x = torch.randn(32, 784, device="cuda")  # Input batch
y = torch.randint(0, 10, (32,), device="cuda")  # Labels

# Forward pass
optimizer.zero_grad()
h = torch.relu(x @ W1 + b1)  # Hidden layer
logits = h @ W2 + b2  # Output layer
loss = F.cross_entropy(logits, y)

# Backward pass
loss.backward()

# Parameter update
optimizer.step()
7.7.1 Forward pass
During the forward pass, executing h = torch.relu(x @ W1 + b1) triggers an eager execution sequence:
- Python dispatch: The Python interpreter invokes
torch.matmul, which routes through PyTorch’s C++ dispatcher to select the CUDA backend, incurring the Python-dispatch share of the per-operation overhead (about 10 μs in this chapter’s model) before issuing work to the device. - Kernel selection: cuBLAS selects a GEMM kernel configured for dimensions 32 \(\times\) 784 \(\times\) 128, partitioning the computation into thread blocks sized to fit the streaming multiprocessor shared memory and L2 cache tiles.
- Kernel launch: The host thread enqueues the launch descriptor into the GPU command stream, consuming driver launch latency while asynchronous execution allows host execution to proceed without blocking on completion.
- GPU execution: The streaming multiprocessors stream
W1from HBM24 through L2 cache into registers and the FP32 arithmetic units (Tensor Cores engage only when TF32 or a 16-bit data type is enabled), evaluate the matrix product, and write the output activations back to HBM. - Autograd recording: Concurrently on the host, PyTorch’s autograd engine instantiates an
MmBackwardnode on the dynamic tape, saving references to the device tensors needed for the requested gradients. Here the weight gradient requiresx; no input gradient is requested.
24 HBM (high bandwidth memory): Provides 3.35 TB/s on the H100, making it the memory tier that most directly feeds accelerator arithmetic; HBM bandwidth determines whether operations are memory bound or compute bound, and its 80 GB capacity sets the hard ceiling on total live training state. Weights, activations, gradients, optimizer state, and temporary workspace must fit during execution. When they do not, the framework must resort to offloading, selective recomputation, or placement across devices, each adding complexity to what the programmer perceives as a single loss.backward() call.
The subsequent bias addition (+ b1) and activation (torch.relu) follow an identical eager path, with each operation dispatching a separate kernel, executing round-trips to HBM, and appending a node to the tape. By the time the forward pass reaches the loss function, the autograd graph holds a complete chain of backward functions and saved activation pointers ready for reverse traversal.
7.7.2 Backward pass
Calling loss.backward() executes reverse-mode automatic differentiation in four stages:
- Tape traversal: The autograd engine traverses the recorded computational graph in reverse topological order, starting from the scalar loss node.
- Gradient computation: The engine executes the backward kernel registered to each node. Traversing backward,
CrossEntropyBackwardevaluates \(\frac{\partial \LossFunction}{\partial \text{logits}}\) using the combined softmax-cross-entropy derivative. TheMmBackwardnode for \(\WeightMatrix_2\) computes \(\frac{\partial \LossFunction}{\partial \WeightMatrix_2} = \HiddenActivationMatrix^T \cdot \frac{\partial \LossFunction}{\partial \text{logits}}\) and \(\frac{\partial \LossFunction}{\partial \HiddenActivationMatrix}\), where \(\HiddenActivationMatrix\) is the batch of hidden activations (h). TheReluBackwardnode evaluates the activation mask, zeroing gradients where forward activations satisfy \(\HiddenActivationMatrix \leq 0\). TheMmBackwardnode for \(\WeightMatrix_1\) computes \(\frac{\partial \LossFunction}{\partial \WeightMatrix_1} = \LayerInputMatrix^T \cdot \frac{\partial \LossFunction}{\partial \PreactivationMatrix_1}\), where \(\PreactivationMatrix_1 = \LayerInputMatrix\WeightMatrix_1 + \BiasVector_1\) is the pre-activation. Because the input batch \(\LayerInputMatrix\) (x) does not setrequires_grad=True, traversal terminates without evaluating \(\frac{\partial \LossFunction}{\partial \LayerInputMatrix}\). - Gradient accumulation: Computed parameter gradients accumulate in-place into the
.gradfields of leaf tensors (\(\WeightMatrix_1\), \(\BiasVector_1\), \(\WeightMatrix_2\), \(\BiasVector_2\)). - Saved-state release: As each backward node completes, the framework releases the saved tensor references that it no longer needs. Storage becomes reusable only when no other live reference retains it; in this listing, Python variables such as
hcan keep tensors alive after backward. The caching allocator can reuse released regions for subsequent operations without returning them immediately to the device.
After backward fills the parameter .grad buffers, optimizer.step() reads those gradients, updates the parameters, and advances any optimizer state. Backward itself computes gradients without applying that update, and the optimizer state the update reads is part of training memory, not of the backward pass.
7.7.3 Memory traffic
Knowing which forward and backward kernels run lets us count the arithmetic work and memory traffic of the step to test whether it is bound by compute, HBM bandwidth, or host dispatch. To isolate the core forward and backward operators from section 7.7.1 and section 7.7.2, the count excludes input generation, bias additions and reductions, optimizer updates, and allocator bookkeeping. Within that boundary, each matrix multiplication reads two operands and writes one result, while loss and activation kernels follow the simplified operation-equivalent models stated next.
The traffic model assumes FP32 values occupying 4 bytes each. For x @ W1, it counts one read of the input matrix with shape (32, 784), one read of the weight matrix with shape (784, 128), and one write of the result with shape (32, 128). Multiplying each shape’s dimensions, summing the three element counts, and multiplying by the element width gives the table’s 0.52 MB. The second matrix multiplication uses the same operand rule with its own shapes.
ReLU instead reads and writes each element of its (32, 128) tensor once, so its modeled traffic is twice that tensor’s element count times 4 bytes, yielding 32.8 KB. These counts describe the modeled operator-buffer boundary. They assume full operand reuse within each matrix multiplication and exclude extra layout copies, workspace, and repeated tile loads; cached operands can also reduce actual HBM reads. Saving a reference for backward does not itself copy a tensor. A physical layout conversion, when required, adds its own read and write traffic to these counts.
The backward products use the same read/read/write rule. The weight gradient h.T @ dlogits multiplies (128, 32) by (32, 10); the hidden gradient dlogits @ W2.T multiplies (32, 10) by (10, 128); and x.T @ dz1 multiplies (784, 32) by (32, 128). The first two each cost as much arithmetic as the second forward GEMM, while the third matches the first forward GEMM. No (32, 128) by (128, 784) product is needed because the raw input requests no gradient. The total dense matrix work is therefore 2.013× the forward dense work. This applies the input-gradient exception derived in Derivative calculation process to this two-layer network.
The forward cross-entropy model assigns one operation-equivalent each to exponentiation, accumulation, and normalization per logit, and counts the logit read and saved-score write. For the nonlinear backward work, the ReLU model reads the saved activation and upstream gradient and writes a masked gradient. The simplified combined cross-entropy model reads saved probabilities and integer labels, then subtracts the target and scales by the batch mean to write the logit gradient. Actual loss implementations may split these operations across kernels. The resulting estimates, collected in table 9, make the arithmetic-intensity comparison reproducible without substituting for a measured memory-traffic profile.
| Component | Modeled Work | Memory Traffic | Arithmetic Intensity |
|---|---|---|---|
| MatMul (x @ W1) | \(2 \times 32 \times 784 \times 128\) = 6.42 MFLOP | 0.52 MB | 12.4 FLOP/byte |
| ReLU | \(32{\times}128\) = 4.1 KFLOP | 32.8 KB | 0.125 FLOP/byte |
| MatMul (h @ W2) | \(2 \times 32 \times 128 \times 10\) = 81.9 KFLOP | 22.8 KB | 3.6 FLOP/byte |
| Cross-entropy (simplified) | ~0.96 KFLOP | 2.6 KB | 0.375 FLOP/byte |
Backward dW2 |
81.9 KFLOP | 22.8 KB | 3.6 FLOP/byte |
Backward dh |
81.9 KFLOP | 22.8 KB | 3.6 FLOP/byte |
Backward dW1 |
6.42 MFLOP | 0.52 MB | 12.4 FLOP/byte |
| Backward nonlinear (simplified) | 4.7 KFLOP | 52.0 KB | 0.091 FLOP/byte |
The arithmetic-intensity column helps predict each layer’s regime when compared with the target machine’s compute-to-bandwidth ratio. Matrix multiplications reuse operands far more than element-wise operations, but their shapes still determine whether they reach the compute roofline. Conversely, the forward ReLU and cross-entropy estimates perform negligible compute per byte transferred (0.125 FLOP/byte and 0.375 FLOP/byte), making them sensitive to memory bandwidth and, at small sizes, launch latency. In un-fused eager execution, each element-wise operation incurs a separate kernel dispatch and writes intermediate tensors to global-memory buffers between kernels; actual HBM traffic depends on caching.
The analytical model yields ~13.1 MFLOP of arithmetic work and ~1.2 MB of memory traffic for the operations included in the table. Dividing these quantities by peak H100 hardware rates determines the idealized lower bounds:
- \(\IronLawComputeTime \approx\) 13.1 MFLOP/67 TFLOP/s FP32 ≈ 0.2 μs
- \(\IronLawMemoryTime \approx\) 1.2 MB/3.35 TB/s ≈ 0.4 μs
- Under a one-kernel-per-modeled-operator assumption, the 4 selected forward operators and 5 backward operators require 9 driver launches. Python dispatches each of the 4 forward operations individually, whereas
backward()enters the C++ autograd engine once and launches all 5 backward kernels without returning to the Python interpreter between them, giving 5 Python entries in total. The illustrative host cost is therefore 5 \(\times\) 10 μs plus 9 \(\times\) 5 μs, or 95 μs. - The excluded optimizer step is not small. An FP32 Adam update reads each parameter, its gradient, and two moments and writes three of them, 28 bytes per parameter, so the 101,770 parameters of this network move about 2.85 MB, more than the whole modeled forward and backward traffic. Counting its launches and the omitted Python calls only raises the host cost above this lower bound.
This dispatch model excludes autograd traversal overhead, allocation, and the operations omitted from the table. A profile must still establish the actual launch count, particularly for loss kernels. Host costs are added without overlap here. In this model, \(\HostSoftwareTime\) exceeds the ideal lower bounds \(\IronLawComputeTime\) and \(\IronLawMemoryTime\) by more than an order of magnitude, so the overhead ratio of equation 4 sits far above 1 and the step is overhead-bound under these assumptions. This is the small multilayer perceptron (MLP) regime of notebook 7.2, now reached from a real training loop. Profiling has a specific job here, which is to confirm that measured kernel times, achieved bandwidth, and host-device overlap match the model before acting on it. When dispatch dominates, three mechanisms attack the launch overhead from different angles. Kernel fusion via torch.compile merges consecutive memory-bound operations into a single kernel, which avoids intermediate round-trips to HBM and collapses launch boundaries. Batch size scaling grows the arithmetic payload linearly while keeping dispatch overhead constant, which amortizes fixed launch latency across more compute work. Graph capture removes repeated Python work in captured regions and allows CUDA Graph replay to submit a captured launch sequence with less host overhead, without requiring the entire step to become one fused kernel.
7.7.4 Dispatch to hardware
The timing analysis in section 7.7.3 followed the script’s device="cuda" placement on an H100, but the same eight lines of Python can target a CPU, a TPU, or Apple Silicon by changing the device placement to a supported backend (table 10). Each backend maps common tensor semantics to silicon-specific primitives, so a single loss.backward() invocation routes to different execution pipelines depending on where its tensors live. Because differences in floating-point summation order, reduction trees, and non-deterministic atomic operations introduce numerical variation across backends, equivalence must be validated against explicit numerical tolerances rather than bitwise identity.
| Hardware | Backend library | Execution mechanism |
|---|---|---|
| CUDA GPU | cuBLAS (NVIDIA 2024; Choquette et al. 2021) | GEMM kernels and CUDA streams for async execution |
| CPU | Intel oneMKL or OpenBLAS (Intel Corporation 2026; OpenBLAS Project 2026) | Thread-level parallelism around optimized kernels |
| TPU | XLA (Google 2025) | Compilation to TPU-specific HLO operations |
| Apple Silicon | Metal Performance Shaders | MPS backend |
Choquette, Jack, Wishwesh Gandhi, Olivier Giroux, Nick Stam, and Ronny Krashinsky. 2021. “NVIDIA A100 Tensor Core GPU: Performance and Innovation.” IEEE Micro 41 (2): 29–35. https://doi.org/10.1109/mm.2021.3061394.
Intel Corporation. 2026. Intel oneAPI Math Kernel Library.
OpenBLAS Project. 2026. OpenBLAS: An Optimized BLAS Library.
Google. 2025. XLA: Optimizing Compiler for Machine Learning.
Implementation decisions such as device placement, batch size, and compilation mode cascade through execution, differentiation, and abstraction layers simultaneously. Treating the framework as an opaque mathematical interpreter rather than a hardware-aware scheduler hides these interactions until they surface as an idle accelerator or an out-of-memory failure.
Systems Perspective 7.2: The three problems in action
In D·A·M terms, the single training step exposes how the framework balances algorithm and machine:
- Execution: Eager mode preserves imperative line-by-line debugging at the cost of per-kernel launch and dispatch latency.
- Differentiation: Reverse-mode automatic differentiation retains intermediate forward activations in HBM to compute exact vector-Jacobian products in reverse topological order.
- Abstraction: Unified tensor APIs decouple model code from heterogeneous silicon, dispatching identical operations to cuBLAS, oneMKL, or XLA-compiled HLO programs.
Resolving the friction among these dimensions requires matching operator granularity to hardware rooflines: fusing operations to eliminate memory round-trips, scaling batches to amortize launch latency, and structuring tensors to saturate accelerator execution pipelines.
The step’s costs reduce to a handful of counting rules derived earlier in the chapter and collected in the chapter summary. These rules let a training or inference step be estimated on paper before it is profiled. Count dispatched operations and compare their overhead with device time. Count the passes an unfused elementwise chain makes over memory. Check whether a compiled artifact will run often enough to repay its compilation. Size the activations that backward must keep. Time every host-to-device copy. Applied to the two-layer MLP, the dispatch rule gives the overhead-bound verdict reached above. The elementwise-traffic rule explains why fusing its bias and ReLU kernels removes a round trip. The saved-activation rule bounds what activation checkpointing could save. Every one of these costs exists whichever framework runs the step; frameworks differ in which of them they make easy to see and to reduce. TensorFlow, PyTorch, and JAX each answer the three framework problems in a different way.
Self-Check: Question
During the forward execution of an MLP layer
h = torch.relu(x @ W1 + b1)withrequires_grad=True, what two operations occur concurrently inside the framework?- It computes the forward output and immediately updates the weights
W1using gradient descent - It executes the matrix multiplication on the GPU and transmits the gradients back to the host CPU
- It computes the forward numerical activations on the hardware accelerator and constructs a dynamic autograd tape recording the operations and caching required intermediate tensors for the backward pass
- It compiles the entire Python script into a native standalone mobile application
- It computes the forward output and immediately updates the weights
In the chapter’s two-layer MLP training-step analysis, suppose a hypothetical profiler showed many short kernels separated by host-side dispatch gaps. Why could the total eager-mode step time greatly exceed the idealized compute and memory lower bounds even on a very fast GPU?
- Because network communication across multiple machines dominates every training step in the example
- Because thermal throttling is the main bottleneck for small matrix operations in the scenario
- Because the dynamic class hierarchy in the framework leaks memory between layers
- Because repeated host-side dispatch and kernel-launch overhead for many small operations can dominate when the device kernels themselves are short
Contrast the arithmetic intensity of a matrix multiplication (
MatMul) with an element-wise activation such asReLU, and explain how their performance bottlenecks can differ on modern GPUs depending on shape and execution conditions.Order the complete sequence of computational and system phases occurring inside a framework during a single standard training iteration:
Loss calculation: The criterion function evaluates the scalar training loss \(\mathcal{L}\)
Backward pass: Autograd traverses the reverse tape, executing Vector-Jacobian Products and populating
.gradbuffersOptimizer step: The optimizer reads
.gradvalues and updates parameter tensors in-place using the optimization algorithmForward pass: The model executes layer operations and records the dynamic autograd tape
Gradient reset:
optimizer.zero_grad()clears or sets.gradbuffers toNoneDuring the backward pass of a training step, why is memory traffic often higher than in the forward pass even when the amount of arithmetic work is of the same order?
7.8 Major Frameworks: TensorFlow, PyTorch, and JAX
A team that prototypes quickly but cannot deploy the resulting model, or deploys reliably but cannot debug training failures, has run into a framework design trade-off rather than a missing API call. Each major framework solves all three core problems but emphasizes a different path through them. TensorFlow couples eager development to graph capture and a broad deployment ecosystem. PyTorch begins with eager execution and adds capture, compilation, and export paths. JAX organizes differentiation, vectorization, and compilation as composable function transformations. These are architectural emphases, not exclusive capabilities, and their value depends on the workload and deployment target.
7.8.1 TensorFlow
TensorFlow’s architecture spans eager development and graph-based optimization across hardware from cloud TPUs to microcontrollers. TensorFlow 2 executes eagerly by default. Performance-sensitive functions can be captured with tf.function, and deployment formats route captured computation to server, mobile, and browser runtimes. This dual path preserves the production graph capabilities inherited from TensorFlow 1.x without requiring every TensorFlow 2 program to build a complete graph before it runs.
Within a captured tf.function, TensorFlow can apply graph optimizations such as constant folding, kernel fusion, and layout planning. The SavedModel serialization format is the boundary that separates training from deployment (figure 14). Training workflows on the left, including tf.data preprocessing, the Keras modeling API, and distribution strategies across CPUs, GPUs, and TPUs, serialize into one SavedModel artifact. From this central interface, graph definitions pass through supported serving or target-specific conversion paths into deployment runtimes on the right (TensorFlow Serving, TensorFlow Lite, TensorFlow.js, and native language bindings) without retaining Python runtime dependencies.
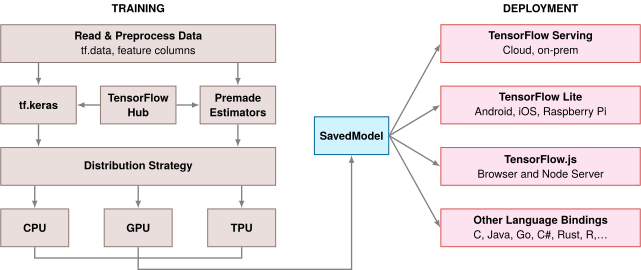
TensorFlow’s answer to the execution problem is therefore two-sided: eager by default for development, with tf.function as the graph-conversion path for performance-sensitive code (TensorFlow Developers 2024). Its strength is the compiled path from a captured graph to many deployment runtimes.
TensorFlow Developers. 2024. Better Performance with tf.function.
7.8.2 PyTorch
Where TensorFlow’s design centers the path from captured graph to deployment runtime, PyTorch centers developer experience. PyTorch was built from the start on dynamic graphs (or “Define-by-Run”). Instead of building a graph before execution, PyTorch builds the computational graph as the code runs, because researchers need immediate feedback when experimenting with novel architectures and a define-then-run cycle slows that loop. Python loops, conditionals, and debuggers work directly inside a model’s forward pass, with no special syntax and no separate compilation step, which matters most while architectures and training objectives are still changing.
PyTorch’s answer to the differentiation problem is tape-based autograd (section 7.4.3.1): flexible and debuggable, but harder to optimize globally because the tape is rebuilt each iteration. Its answer to the abstraction problem is more pragmatic than comprehensive: strong GPU support through cuBLAS and cuDNN, with deployment paths including torch.export, edge-targeted ExecuTorch, ONNX, and specialized runtimes.
The trade-off is therefore a more fragmented deployment path. Because the graph is dynamic, the framework cannot easily perform global optimizations before execution. A model that works perfectly in development may hit performance walls in production when dispatch overhead dominates small operations. To bridge this research-to-production gap, PyTorch added graph-capture and compilation paths (torch.compile and export workflows) that capture a dynamic model and turn it into an optimized representation for deployment. This evolution shows how an eager framework can move toward the production end of the compilation continuum while preserving the interactive experience that motivated the design.
7.8.3 JAX
PyTorch’s eager execution and TensorFlow’s graph compilation represent two points on a spectrum, yet both share an imperative programming heritage where computation proceeds as a sequence of stateful operations. JAX takes a different user-facing approach, built on functional programming principles and composable program transformations rather than object-level tapes or user-authored graph APIs (Bradbury et al. 2018). Developed at Google, JAX is especially useful for work requiring custom differentiation, advanced optimization research, and large-scale distributed training.
Bradbury, James, Roy Frostig, Peter Hawkins, Matthew James Johnson, Chris Leary, Dougal Maclaurin, George Necula, et al. 2018. JAX: Composable Transformations of Python+NumPy Programs.
Where PyTorch and TensorFlow track state through objects and expose autograd through dynamic tapes or graph-capture paths, JAX asks users to write pure Python functions and treats differentiation, vectorization, and compilation as composable program transformations (listing 21). The jax.grad function returns a new function that computes gradients, which can then be transformed again when the interfaces are compatible: vmap(grad(f)) computes per-example gradients, and jit(vmap(grad(f))) compiles that batched computation. Transformation order is semantically meaningful rather than arbitrary.
grad, then vmap, then jit yields per-example gradients compiled through XLA.
import jax
import jax.numpy as jnp


def loss_fn(params, x, y):
    pred = jnp.dot(x, params["w"]) + params["b"]
    return jnp.mean((pred - y) ** 2)


# Transform: compute gradients
grad_fn = jax.grad(loss_fn)

# Transform: vectorize over batch dimension
batched_grad = jax.vmap(grad_fn, in_axes=(None, 0, 0))

# Transform: compile to XLA
fast_batched_grad = jax.jit(batched_grad)

# Compose all three: fast, batched gradient computation
This functional approach requires pure functions (no side effects) and immutable data (arrays cannot be modified in place). These constraints are stricter than PyTorch’s mutable object model, and they are what make the transformations safe. Because function outputs depend only on inputs, the compiler can reorder, fuse, and parallelize operations without changing results, and one transformation can be applied to the output of another.
Each transformation does one job. jax.grad returns a gradient function; jax.vmap can vectorize a compatible function over mapped axes; and jax.jit can trace and compile a stable transformed function for a particular argument signature. Unlike an iterative Python loop that issues individual operations sequentially with repeated dispatch overhead, jax.vmap pushes the batch dimension directly into the underlying primitives, allowing compatible per-sample matrix-vector operations to become batched matrix-matrix multiplications (GEMM). The compiled program can contain multiple kernels and library calls. Across devices, JAX shards arrays over a device Mesh and compiles with jax.jit, or maps explicitly with jax.shard_map (the successor to the older jax.pmap); gradient aggregation is expressed with collectives such as lax.psum or lax.pmean. These transformations compose according to their types and semantics, and different orders can compute different quantities.
The same minimalist core delegates neural network abstractions to companion libraries (Flax and Equinox) and optimization to Optax. This separation reflects the functional philosophy: the core provides transformations, while libraries build conventional abstractions on top. The trade-off is that production readiness depends on both the transformation model and the maturity of the surrounding libraries, export paths, and operational tooling for the target environment.
The functional constraints pay off where gradient computation is itself the object of study. Custom differentiation, including higher-order gradients and custom vector-Jacobian product (VJP) and Jacobian-vector product (JVP) rules, composes cleanly because pure functions make differentiation rules predictable, which serves optimization research and scientific computing with AD. Compilation-heavy accelerator workloads gain utilization from XLA when the program fits the functional style. In exchange, JAX demands more upfront investment than PyTorch, with explicit state management, a learning curve for the functional paradigm, and compiled code that is harder to debug than eager execution. It fits teams whose requirements match these strengths rather than serving as a default.
7.8.4 Design trade-offs compared
Comparing TensorFlow, PyTorch, and JAX by asking which framework is fastest in the abstract asks the wrong question, because raw speed changes with model shape, batch size, hardware backend, and compiler configuration. The durable difference among the three designs (graph-first vs. eager-first, stateful vs. functional) is what each one lets the system see and optimize. Table 11 therefore maps TensorFlow, PyTorch, and JAX back to the three framework problems: execution visibility, differentiation model, and hardware abstraction path.
| Aspect | TensorFlow | PyTorch | JAX |
|---|---|---|---|
| Graph Type | Static roots, dynamic front end in 2.x | Dynamic | Functional transformations |
| Programming Model | Imperative front end, graph capture path | Imperative | Functional |
| Core Data Structure | Tensor with framework-managed state | Tensor with framework-managed state | Immutable array |
| Execution Mode | Eager by default, graph for optimization | Eager by default | Trace and just-in-time compilation |
| Automatic Differentiation | Reverse mode over captured computation | Reverse mode over an eager tape | Forward and reverse transformations |
| Hardware Abstraction | Broad deployment runtimes and XLA paths | Native GPU path plus export/compile runtimes | XLA-centered accelerator compilation |
| Optimization Risk | Graph capture and operator coverage | Graph breaks after eager development | Purity, shape stability, and tracing |
The comparison therefore tells an engineer which constraint to profile first. In PyTorch, check whether eager dispatch or graph breaks dominate. In TensorFlow, check whether the captured graph covers the operators and deployment target. In JAX, check whether shapes and purity let XLA compile the program actually executed. A framework-level comparison or leaderboard can orient a decision, but it cannot replace profiling the specific workload on the target hardware.
The same simple network exposes how each design philosophy shapes the code. Listing 22 implements one neural network, a single linear layer mapping ten inputs to one output, across all three frameworks.
# PyTorch - Dynamic, Pythonic
import torch.nn as nn


class SimpleNet(nn.Module):
    def __init__(self):
        super().__init__()
        self.fc = nn.Linear(10, 1)

    def forward(self, x):
        return self.fc(x)


# TensorFlow/Keras - High-level API
import tensorflow as tf

model = tf.keras.Sequential(
    [tf.keras.layers.Dense(1, input_shape=(10,))]
)

# JAX - Functional approach
import jax.numpy as jnp
from jax import random


def simple_net(params, x):
    return jnp.dot(x, params["w"]) + params["b"]


key = random.PRNGKey(0)
key_w, key_b = random.split(key)
params = {
    "w": random.normal(key_w, (10, 1)),
    "b": random.normal(key_b, (1,)),
}
These three implementations solve the same mathematical problem, yet each reveals where its framework keeps state and when its computation graph comes into existence. PyTorch binds state and computation together through class inheritance (nn.Module) and evaluates eagerly, building the graph as Python runs. Standard debuggers and control flow therefore work naturally, at the cost of hiding the full computation from an optimizer unless a graph-capture pass is invoked. TensorFlow and Keras also execute eagerly by default in TensorFlow 2, whereas structured models can be captured with tf.function and exported to supported deployment runtimes whenever operator coverage and target conversion allow. By contrast, JAX treats the model as a pure function25 over immutable arrays with no internal object state. It turns grad, vmap (automatic vectorization), and jit (just-in-time compilation26) into composable transformations on stateless functions, in exchange for explicit parameter passing.
25 Pure function: Returns outputs determined by its inputs without relying on untracked side effects; JAX transformations are designed for pure functions. Ordinary Python effects may run during tracing but are not represented in the compiled computation, and impure code can fail or behave unexpectedly. Runtime printing or external effects require supported mechanisms such as jax.debug.print or callbacks; random draws require explicitly managed keys.
26 Just-in-time (JIT) compilation: Traces a function for an argument signature and lowers it to backend-specific executable code; the first call pays tracing and compilation costs; compatible later calls can reuse the cached executable. New shapes, dtypes, devices, or static arguments may trigger another compilation. Both compilation time and cached-call overhead depend on the program, backend, and hardware.
No framework maximizes all three goals simultaneously, and the ten-line program makes the trade visible in source code rather than buried in compiler internals: where state lives, when the graph exists, and what the compiler is allowed to see. Each design trades what the compiler can see against how quickly a person can iterate. Graph capture and ahead-of-time compilation can reduce runtime overhead and intermediate data movement. Eager evaluation shortens the human iteration loop, outside the iron-law runtime equation, at the cost of compiler visibility until a graph-capture path is used. Functional purity gives XLA more freedom to transform a stable traced program. Each philosophy also shapes code syntax, team workflows, debugging practices, and deployment pipelines, so migration costs grow with project-specific integrations and assumptions.

Eager defaults favor iteration; JAX’s traced functions favor the compiler.
Self-Check: Question
Which framework ecosystem in the section is organized around
SavedModelas a central boundary between Python-side development and multiple deployment paths such as server serving, mobile conversion, and browser execution?- PyTorch eager execution as originally presented
- TensorFlow ecosystem with SavedModel feeding Serving, Lite conversion, and TensorFlow.js paths
- Pure NumPy with custom Python socket servers
- Scikit-learn with standard pickle deserialization
What core programming-model commitment distinguishes JAX from both PyTorch and TensorFlow in the chapter’s comparison, enabling transformations like
jax.grad,jax.vmap, andjax.jitto compose when their contracts align?- Dynamic class inheritance with mutable object references for all layer parameters
- Global state mutation across all forward and backward passes
- Pure functions over immutable array-like data, with transformations applied to functions rather than hidden mutable objects
- Graph capture via AST string parsing of Python source files
Compare the workflow and deployment trade-offs that led PyTorch to dominate academic research while TensorFlow established strong early dominance in enterprise production serving during the late 2010s.
Explain how JAX’s requirement that functions must be pure and free of side effects enables the XLA compiler to generate highly optimized accelerator kernels through
jax.jit.
7.9 Choosing a Framework
Those differences in where state lives and what the compiler sees become concrete obligations once a team commits to one framework for a project that must ship to a particular device. Framework selection decides which framework a team develops in, given the model it must express, the team that must maintain it, and the targets it must eventually run on. Development framework and deployment runtime need not be the same system: a model can be developed in PyTorch or TensorFlow and exported to a compact runtime for the device. The choice of that inference runtime is a serving decision, developed in Inference Runtime Selection. The development framework still has to reach it, so the deployment target acts as a filter on which frameworks are viable.
Suppose a team deploys a fixed-shape vision model to a CPU-only embedded Linux device, with a 20 ms p99 (99th-percentile, Latency and tail latency) inference-latency target under a specified load and a 256 MB model-and-runtime memory budget. Assume target-device trials with matching inputs, batch size, precision, and numerical tolerances establish two viable paths. PyTorch development with ONNX Runtime has 18 ms p99 latency and 140 MB peak memory use, while TensorFlow development with TensorFlow Lite has 15 ms p99 latency and 90 MB peak memory use. A path that depends on a GPU-only runtime fails the hardware filter even if its latency elsewhere is lower. These are hypothetical project measurements, not general performance rankings. The selection must now distinguish a feasible path from a worthwhile migration.
The embedded project has already fixed the deployment target, but it leaves two choices open: which development environment the team can maintain and which compatible export path meets its budget. Eager development and compiled deployment can coexist along either path, so the team need not trade away its debugging workflow to obtain a compact inference runtime.
Systems Perspective 7.3: Framework selection constraints
Rather than seeking the “best” framework, effective selection first eliminates candidates that cannot satisfy hard constraints: deployment target, required operations, compiler path, and team expertise. Only then should soft preferences such as performance, development speed, and ecosystem rank the survivors.
7.9.1 Framework selection criteria
The two hypothetical measurements establish latency and memory feasibility only for the tested model and inputs. A defensible choice also checks operator semantics, software dependencies, and hardware coverage. The three TensorFlow variants in table 12 make those filters visible within one ecosystem; the same questions apply to the PyTorch-to-ONNX path.
| TensorFlow | TensorFlow Lite | TensorFlow Lite for Microcontrollers | |
|---|---|---|---|
| Training | Yes | Limited | No |
| Inference | Yes | Yes | Yes |
| Operator Coverage | Broad | Inference-focused | Model-selected subset |
| Native Lower-Precision Tooling | Yes | Yes | Yes |
| Needs an OS | Yes | Yes | No |
| Model Access | Filesystem or service | Platform-specific storage mapping | Platform-specific compiled or mapped storage |
| Accelerator Support | Yes | Delegates | Optimized kernels and integrations |
| Base Binary Size | Build- and package-dependent | Build- and delegate-dependent | Model- and operator-selection-dependent |
| Base Memory Footprint | Model-, runtime-, and allocator-dependent | Model-, delegate-, and allocator-dependent | Fixed arena plus runtime state |
| Optimized Architectures | x86, TPUs, GPUs | Arm Cortex-A, x86 | Arm Cortex-M, DSPs, MCUs |
Model requirements
For the fixed-shape vision model, the first filter is successful conversion of every required operation with acceptable numerical results. Training support is needed in the development framework but not in the deployed runtime. TensorFlow, TensorFlow Lite, and TensorFlow Lite Micro expose different operator and training capabilities. A missing inference operator, by contrast, can invalidate the deployment path even when the rest of the graph fits, which is why operator coverage is the discriminating row among the capabilities in table 12.
Systems Perspective 7.4: Dynamic vs. static computational graphs
The static-vs.-dynamic graph distinction (examined in section 7.3) has direct implications for model requirements analysis. Static graphs require control flow and dynamic behavior to be represented in forms understood by the graph runtime, which enables ahead-of-time optimization for deployment. Eager execution follows ordinary Python control flow directly, while graph-capture paths such as
torch.compile and tf.function recover optimization opportunities when they can represent the executed program.
Software dependencies
Embedded Linux supplies operating-system services, so an OS dependency does not eliminate either candidate in this project. A bare-metal microcontroller would impose a different filter. The platform rows of table 12 separate that requirement from model access and accelerator integration; availability of a runtime on one tier does not imply availability on another.
The CPU-only project needs a supported CPU implementation of every required operator; it cannot count on a mobile NPU delegate or a server GPU backend. TensorFlow Lite Micro instead links a selected operator set into a small C/C++ application and can read a model FlatBuffer compiled into flash. That design removes the need for a POSIX filesystem or heap allocation during inference, but those savings do not by themselves justify selecting a microcontroller runtime for a Linux device.
Hardware constraints
A runtime that supports the operating system still has to fit alongside the model, working buffers, and application. The hardware rows of table 12 separate supported processor families from footprint, which depends on the actual build. The project must compare peak memory for the deployed configuration, not the size of its weight file or an empty runtime package.
The supplied trials already include model-and-runtime peak memory, so both candidates pass the project’s capacity filter. That conclusion must be revisited when input shapes, selected operators, delegates, or runtime versions change. On a fixed-arena target, the analogous check is whether the planned tensor and scratch buffers fit with the rest of the application.
Production-ready evaluation factors
Satisfying model requirements, software dependencies, and hardware constraints establishes technical feasibility; production viability also depends on what the development framework’s toolchain supports. If the deployment uses reduced precision, the framework must support the chosen path. The options are post-training quantization (PTQ), which converts an already-trained model using a small representative calibration dataset to set value ranges, or quantization-aware training (QAT), which simulates low-precision arithmetic during training to recover accuracy before deployment. Toolchain stability matters as much: whether saved models remain loadable across framework and runtime updates, and whether the framework exposes the profiling hooks needed to confirm that the deployed model still meets its latency target.
↪ Post-training quantization, its calibration, and quantization-aware training are developed in Quantization methods.
7.9.2 Development support and long-term viability assessment
Once both paths pass the technical filters, the remaining decision concerns the team’s ability to maintain them. The project already has PyTorch models and an ONNX export pipeline. Adopting another development stack would add conversion validation, new debugging practices, and another set of runtime dependencies even though both candidates meet the deployment limits.
Custom C++ or CUDA operators, specialized serialization, and vendor compiler passes increase the cost of later migration. Preserving an exit path means isolating framework-specific ingestion and operator code and testing the intended export format throughout development. These commitments belong in the selection decision because the shortest inference time does not account for the work needed to keep the model deployable.
Both surviving paths meet the stated runtime limits. The team already maintains PyTorch models and an ONNX export pipeline, so it selects PyTorch with ONNX Runtime. The measured path satisfies deployment requirements without introducing a second development stack. The faster TensorFlow Lite path remains viable, but its unused latency and memory advantage does not by itself justify migration. The decision depends on retaining that headroom as the model changes. Before committing, the team must check export coverage and numerical tolerances across representative inputs and repeat the latency check under expected contention; a later operator change or tighter latency target can invalidate the choice. The choice follows the project’s constraints and maintenance costs; a different team or deployment envelope can favor the other viable path.
The worked selection turned on constraints that no benchmark table records: export coverage, numerical tolerance, the team’s existing pipeline, and the cost of a second stack. Engineers who reason from benchmark headlines or general-purpose programming habits fall into predictable traps.
Self-Check: Question
An engineering team is architecting a new commercial computer vision system. In the chapter’s decision framework, why must deployment constraints (e.g. target mobile NPU delegates and memory budgets) act as hard filters evaluated before selecting the training framework?
- If a training framework cannot export or compile the required model operators to the target deployment runtime, the model cannot run in production regardless of its training speed or developer ergonomics
- Training frameworks automatically alter target hardware specifications to match model requirements
- Hard deployment filters guarantee that the model achieves 100% classification accuracy
- Research iteration speed is the only metric that matters in commercial system design
When evaluating framework viability for a production system expected to operate for 5+ years, which factor is the strongest warning sign of long-term maintenance risk?
- Using Python instead of Fortran for high-level model definitions
- Adopting a niche or fading framework whose maintenance signals, compatibility path, and future hardware support are weak
- Selecting an open-source framework that continues to receive broad ecosystem and vendor support
- Training on GPU clusters rather than single CPU workstations
Describe the three fundamental tensions in the framework selection trade-off space (velocity vs. performance, flexibility vs. optimization depth, ecosystem breadth vs. specialization).
True or False: Because model weights are stored as floating-point arrays, an engineering team can choose any training framework for research and assume that converting to a production embedded runtime is a trivial format conversion step.
7.10 Fallacies and Pitfalls
Framework selection involves subtle trade-offs where intuitions from conventional software engineering fail. The memory wall, kernel fusion constraints, and deployment target diversity create pitfalls that waste engineering effort and cause production systems to miss latency targets.
Fallacy: All frameworks provide equivalent performance for the same model architecture.
Engineers assume that a model performs the same in every framework because the mathematics is the same. The GPT-2 XL decoding step that opened this chapter refutes this. The identical step spends about 8.6 ms on the host when an eager framework issues its 576 kernels one at a time, against a weight read of about 0.9 ms once the launches are captured and replayed. In the hypothetical ResNet-50 scenario of table 4, compilation raises throughput by 48.3 percent and a specialized inference engine by 2.6× over eager mode. Fusion depth, graph capture, and backend libraries differ between frameworks, so organizations that assume equivalence can miss latency targets and face late framework migrations.
Pitfall: Choosing frameworks based on popularity rather than project requirements.
Engineers assume the most popular framework works for any project. In reality, deployment constraints dominate. A mobile runtime such as ExecuTorch or TensorFlow Lite and a microcontroller runtime such as TensorFlow Lite Micro make different assumptions about memory allocation, operator coverage, and hardware delegates. The former targets phones with GB-scale memory, while the latter often targets devices with hundreds of KB of RAM, commonly below 256 KB for small TinyML deployments. Teams that prototype edge applications without checking the final runtime can face memory bloat that exceeds device capacity or a late framework migration after development completes. Check the deployment runtime (Inference Runtime Selection) before selecting a training framework.
Fallacy: Framework abstractions eliminate the need for systems knowledge.
Engineers assume high-level APIs handle all optimization automatically. The training step of section 7.7 shows otherwise. Its ReLU has an arithmetic intensity of 0.125 FLOP/byte, about 160× below the H100’s FP32 ridge of roughly 20 FLOP/byte, and the whole step spends about 95 μs in host dispatch against well under a microsecond of ideal device time. No API call reveals either fact. Engineers must identify the limiting resource before choosing fusion, batching, layout, or precision optimizations.
Pitfall: Ignoring vendor lock-in from framework-specific formats.
Engineers assume framework migration is straightforward since models are “just math.” Converting TensorFlow SavedModel to PyTorch can require rewriting custom operations, validating numerical equivalence across large test suites, and retraining when operations lack exact equivalents. The ONNX interchange format (Inference Runtime Selection) improves portability, but custom operators, dynamic shapes, and backend-specific optimizations can still require manual work. Organizations that ignore this during initial framework selection face costly migrations when deployment requirements change or better frameworks emerge.
Pitfall: Increasing batch size without modeling activation memory.
Engineers assume that if memory is available, larger batches always improve throughput. Larger mini-batches amortize fixed dispatch overhead, but they also scale the activation memory that must stay live until the backward pass consumes it. In the illustrative ResNet-50 scenario of section 7.4.3.2, batch 64 already holds 8 GB–12 GB of saved activations. Batch 256 holds 32 GB–48 GB, and batch 512 holds 64 GB–96 GB, which on an 80 GB H100 forces activation checkpointing. Recomputation then adds roughly one extra forward pass per step, which can cost more throughput than the larger batch gained, and materialized attention scores make the effect sharper for transformers because they grow with the square of sequence length. Teams that blindly maximize batch size can achieve lower throughput than smaller batches that avoid recomputation.
↪ How activation memory grows linearly with batch size and caps the batch that fits in accelerator memory is developed in Mini-batch processing.
Fallacy: Compilation overhead is negligible.
Engineers assume compilation overhead is a one-time cost that pays off quickly. The hypothetical values in table 4 assign ResNet-50 higher compiled throughput and a compile window of 15 s to 30 s per graph change. Under those assumptions, timed with the table’s inference throughputs (a training loop would add backward work but pay the same recompilation cost), a 10,000-image experiment with 10 code changes completes in 6.9 s in eager mode and 304.7 s in compiled mode, including recompilation overhead. The compiled workflow is therefore about 44.2× slower in this illustrative rapid-prototyping scenario. Teams that enable compilation during rapid prototyping can waste time waiting for recompilations that negate throughput gains.
Pitfall: Using one execution policy for exploration and production.
The right framework mode depends on the loop. During exploration, eager execution and small tests shorten feedback by avoiding repeated graph captures and recompilations. During production serving or long training runs, compilation can amortize setup across many requests or samples. The deciding factors are workload duration and stability: compilation pays when graph structure and shapes recur, whereas changing control flow or input shapes can invalidate cached artifacts and restart the amortization. In the hypothetical ResNet-50 scenario, one 30 s compilation pays for itself only after about 134,000 images. A prototyping loop that recompiles every few minutes never reaches that point, while a serving system passes it within minutes of steady traffic. One policy for both phases either slows research iteration or leaves production throughput unused.
Self-Check: Question
A research team exploring architecture modifications runs experiments where model code changes every 10 training steps. When they enable JIT graph compilation (
torch.compile), total training time increases by 5\(\times\) compared to standard eager mode. What systems principle explains this performance degradation?- Compilation incurs a large upfront compilation latency (\(T_{\text{compile}}\)); if graph structures or tensor shapes change frequently, the compilation cost cannot be amortized across executions (\(N_{\text{steps}} \times (T_{\text{eager}} - T_{\text{compiled}}) < T_{\text{compile}}\)), making repeated recompilation slower than eager execution
- Compiled kernels run at half the floating-point clock frequency of eager kernels on NVIDIA GPUs
- JIT compilers disable GPU hardware acceleration when running short training scripts
- Dynamic graph compilation automatically converts all FP32 operations to 64-bit double precision
Explain why choosing a framework based on community popularity or GitHub stars rather than binding deployment constraints is a severe engineering pitfall for edge and embedded ML projects.
True or False: Because standard neural network architectures (like ResNet-50 or Transformers) have identical mathematical definitions, any two frameworks running the same model on identical GPU hardware will produce identical throughput.
7.11 Summary
Machine learning frameworks solve three core systems challenges that make deep learning tractable on modern hardware. The first is execution: deciding when and how operations run. Frameworks balance the trade-off between eager evaluation for interactive debugging and graph execution for whole-program compilation, while modern hybrid approaches such as torch.compile capture graphs dynamically without sacrificing the Python control loop. The second is differentiation: computing gradients automatically. Frameworks implement reverse-mode automatic differentiation that applies the chain rule across compositions of operations, constructing an autograd tape or backward graph of vector-Jacobian products while making the required forward values available through retention or recomputation. This primitive makes training large models feasible through a single loss.backward() call. The third is abstraction: targeting heterogeneous hardware from a unified interface. Frameworks provide multi-dimensional tensor abstractions, intermediate representations, and runtime dispatch systems that bridge high-level model definitions to optimized device kernels across CPUs, GPUs, TPUs, and custom accelerators.
These challenges are linked through the iron law of ML systems (Iron Law of ML Systems): execution strategy affects dispatch latency \((\Latency)\), differentiation adds arithmetic and memory traffic \((\DataVolume)\), and abstraction influences hardware utilization efficiency \((\EfficiencyHw)\). These are diagnostic emphases, not exclusive assignments, since fusion changes both launches and traffic while differentiation changes both work and live storage. Workloads with little reuse are frequently memory-bandwidth bound (\(\DataVolume/\Bandwidth\)). Frameworks mitigate this memory wall through kernel fusion, which merges compatible element-wise operations to keep intermediates in registers or on-chip SRAM instead of round-tripping through global memory. The separate capacity limit yields to selective recomputation, which trades additional floating-point operations \((\Operations)\) for lower peak activation memory.
The counting rules developed across the chapter fit on one page (table 13). Together they let an engineer estimate, before profiling, whether a step is bound by dispatch, by memory traffic, or by arithmetic.
| Cost | Formula | Where derived |
|---|---|---|
| Dispatch overhead ratio | \(\frac{\DispatchedOperationCount\cdot \OperationDispatchOverhead}{\IronLawComputeTime + \IronLawMemoryTime}\); overhead-bound above 1 | equation 4 |
| Elementwise chain traffic | \(2\ChainedOperationCount\TensorElementCount\ElementStorageSize\) bytes unfused; \(2\TensorElementCount\ElementStorageSize\) bytes fused | section 7.3.2 |
| Compilation breakeven | \(\CompilationBreakevenCount= \frac{\CompilationTime}{\EagerExecutionTime- \CompiledExecutionTime}\) executions | equation 3 |
| Saved activation bytes | \(\ActivationMemory \approx \BatchSize \times \LayerCount \times \SequenceLength \times \HiddenDimension \times \LayerSavedTensorCount\times \ElementStorageSize\) | section 7.4.2 |
| Host-to-device transfer time | \(\Time= \Latency + \DataVolume/\Bandwidth\) | section 7.5.2 |
Key Takeaways: The layer between math and hardware
- Every framework solves three problems: Execution dictates runtime dispatch, differentiation computes gradients, and abstraction targets heterogeneous hardware. TensorFlow, PyTorch, and JAX give different answers on each axis, from graph capture to eager tapes to functional transformations, and those answers fix what a team can debug, compile, and deploy long after the API syntax has changed.
- The memory wall drives optimization: Accelerator compute capacity has outpaced memory bandwidth, making off-chip data movement a recurring bottleneck. Kernel fusion and lower-precision formats can reduce the memory traffic term (\(\DataVolume/\Bandwidth\)), while selective recomputation primarily reduces peak activation storage by adding work.
- Compilation must amortize setup cost: The compilation continuum principle in equation 2 quantifies when runtime speedup offsets compilation overhead. While dynamic workloads favor eager execution, repeatedly executed graphs benefit from JIT or ahead-of-time compilation, where the dispatch overhead law (equation 4) demonstrates that small operations gain disproportionately when host launch overhead (\(\Latency\)) is reduced.
- Gradients cost memory as well as arithmetic: Reverse-mode differentiation keeps the forward values that backward rules read, so saved activations grow with batch size and depth and often dominate training memory; activation checkpointing trades recomputation for that storage.
- Where a tensor lives sets what it costs: A host-to-device copy runs at a small fraction of on-device bandwidth, so placement, pinned memory, and stream overlap decide whether transfers hide behind computation, while layout and data type decide which kernel runs.
- Module abstractions automate state management: Automatic parameter registration, mode flags that propagate from the root, hierarchical serialization, and hooks let one object be updated, saved, switched between training and evaluation, and inspected without per-tensor bookkeeping.
- A step can be estimated before it is profiled: The chapter’s cost formulas (dispatch overhead ratio, fused traffic, compilation breakeven, saved activations, transfer time) show that a small MLP training step is overhead-bound on a data-center accelerator before any profiler runs.
- Deployment targets filter the development framework: A framework is viable only if it can export every required operator to a runtime that fits the target device; among the viable paths, team expertise and migration cost decide.
A framework presents itself as an ergonomic programming interface, yet its true role is translating mathematical graphs into physical hardware operations. That translation determines the work, traffic, and overhead paid under the iron law of ML systems (principle 3). Eager execution prioritizes developer iteration at the cost of host dispatch latency (\(\Latency\)), while graph compilation trades upfront optimization time to reduce avoidable global memory traffic (\(\DataVolume/\Bandwidth\)) through fused kernels. Automatic differentiation adds backward work and traffic (\(\DataVolume\)), with checkpointing trading retained activation storage against recomputed arithmetic (\(\Operations\)). What appears to be an API convenience therefore decides, for as long as a project uses it, how much avoidable work and data movement the implementation performs within physical limits that no framework can remove.
What’s Next: From one training step to a training run
Frameworks translate architectures into executable kernels, and their computational graphs, autograd tapes, and dispatch pipelines are what let engineers see and control each step of training. This chapter traced a single training step through that machinery. A training run repeats that step many thousands or millions of times. Every budget decision the machinery exposes is still unmade, including which activations to checkpoint when memory runs short, how large a batch the hardware allows, and at what point a single device stops being enough. Model Training makes those decisions. It opens with why training costs orders of magnitude more than inference, then budgets memory, time, and cost for real training runs and shows how far one machine can go before scaling out.
7.12 Self-Check Answers
Self-Check: Answer
A team reports that their model executes correctly on CPU but produces mismatched tensor shapes and silent numerical corruption when switched to a GPU backend because some operators silently default to a different memory layout (such as NCHW versus NHWC). Which of the three fundamental framework problems does this failure most directly expose?
- The hardware abstraction problem, because one unified model interface must preserve consistent semantic behavior, memory layouts, and numerical behavior across diverse hardware backends
- The execution problem, because the operators were evaluated eagerly instead of being captured into a static graph
- The differentiation problem, because the backward pass failed to propagate gradients through non-contiguous strides
- A data engineering pipeline defect unrelated to framework runtime responsibilities
Answer: The correct answer is A. The hardware abstraction problem requires providing a unified interface across diverse hardware backends (CPUs, GPUs, TPUs) while ensuring consistent semantics, memory layouts, and numerical behaviors; a silent layout mismatch between backends is a direct failure of this abstraction. Blaming the execution problem confuses when operations are dispatched with how backends interpret tensor memory layouts. Attributing the issue to differentiation is incorrect because forward shape and layout divergences break before gradient propagation occurs. Dismissing it as a data pipeline defect overlooks that tensor layout conversion across backends is a core runtime responsibility.
Learning Objective: Classify a concrete framework failure into the execution, differentiation, or hardware abstraction problem
Explain how viewing an ML framework as a compiler that lowers a model graph to hardware, rather than merely a numerical library like NumPy, changes an engineer’s expectations regarding framework selection and optimization under the systems iron law.
Answer: An ML framework does more than provide convenient tensor syntax: it can capture or defer execution, organize computational graphs, and expose whole regions of work to compiler optimizations such as fusion, memory planning, and hardware-specific lowering. Numerical libraries also rely on optimized kernels, but framework choice additionally determines how much larger-scale structure is visible for reducing avoidable data movement and launch overhead. For example, two frameworks may both call fast GEMM kernels yet differ substantially in whether they can optimize a chain of surrounding operations together. The practical consequence is that framework selection affects achievable efficiency under the iron law, not just coding style.
Learning Objective: Explain how the compiler analogy changes an engineer’s expectations of what framework choice determines
True or False: Two frameworks that expose nearly identical user-facing Python tensor APIs and target the same GPU hardware will necessarily provide equivalent graph-level operator fusion and ahead-of-time compilation capabilities.
Answer: False. Syntactic API similarity does not imply compiler equivalence: one framework may support aggressive whole-graph intermediate representation lowering and kernel fusion via JIT/AOT compilers, whereas another may only perform eager single-kernel dispatch on the same GPU backend, resulting in substantial workload-dependent throughput gaps.
Learning Objective: Evaluate the misconception that matching tensor APIs imply matching compiler optimization capabilities
An engineering organization chose a specialized research framework for rapid prototyping, only to discover later that the framework lacks export paths to their production edge accelerators, requiring months of manual re-implementation. Applying the chapter’s infrastructure-commitment principle, what is the key systems insight?
- Framework choice is easily reversible because weight arrays can be loaded into any runtime with zero engineering overhead
- Framework selection functions as a durable infrastructure commitment whose reversal cost compounds across model checkpoints, serving runtimes, CI/CD pipelines, and hardware access
- The primary failure was selecting an overly compact model architecture that failed to saturate edge accelerator memory
- Hardware abstraction layers eliminate all differences between training frameworks and production inference engines
Answer: The correct answer is B. Framework decisions constrain reachable hardware targets, optimization passes, and deployment toolchains, meaning migration costs extend far beyond model code to include checkpoints, serving systems, CI/CD pipelines, and team expertise. Treating framework choice as freely reversible ignores the substantial engineering friction of cross-runtime translation. Blaming model capacity misidentifies the root cause, which is export toolchain incompatibility. Claiming hardware abstraction eliminates all deployment differences ignores real-world operator coverage gaps and runtime constraints.
Learning Objective: Analyze why framework selection functions as a long-term infrastructure commitment rather than a reversible tooling choice
Self-Check: Answer
While NumPy provided high-performance linear algebra by wrapping BLAS in Python, what critical scaling bottleneck did it leave unaddressed that motivated the development of deep learning frameworks such as Theano, TensorFlow, and PyTorch?
- Inability to execute matrix multiplications on single-core CPU architectures
- Lack of an \(n\)-dimensional array data structure in scientific computing
- The requirement for manual gradient derivation and hand-written backpropagation passes for multi-layer neural networks
- Inability to run compiled Fortran and C routines through high-level scripting languages
Answer: The correct answer is C. NumPy provided high-level array ergonomics and BLAS-backed performance, but practitioners still had to manually derive and implement analytical backpropagation gradients, creating an error-prone bottleneck for deep networks that automatic differentiation frameworks solved. Single-core CPU matrix multiplication was already solved at the BLAS layer. The \(n\)-dimensional array abstraction was NumPy’s primary feature rather than a missing capability. Python-to-C/Fortran bindings were the core mechanism of NumPy’s vectorization model rather than an unsolved problem.
Learning Objective: Analyze which scaling bottleneck NumPy left open for subsequent deep learning frameworks to solve
Explain why the relationship between rungs on the ladder of abstraction (such as BLAS/LAPACK, NumPy, and modern deep learning frameworks) is characterized by inheritance rather than replacement.
Answer: Higher rungs on the ladder do not replace the numerical primitives of lower rungs; instead, they wrap and orchestrate them while automating higher-level concerns such as automatic differentiation, memory planning, and graph compilation. For instance, a high-level PyTorch matrix multiplication
torch.matmul(A, B)ultimately delegates to vendor-optimized BLAS kernels (such as cuBLAS on NVIDIA GPUs), meaning an inefficient low-level primitive establishes a performance ceiling for all frameworks built above it.Learning Objective: Explain how successive ladder rungs inherit low-level primitives rather than replacing them
**Order the following historical computing milestones in the evolution of numerical and machine learning software abstractions, from earliest (1979) to most recent (2018):
JAX introduces functional composable transformations and XLA compilation
BLAS standardizes reusable low-level linear algebra primitives
Theano introduces compiled Python computational graphs for GPUs
NumPy establishes Python’s unified \(n\)-dimensional array and vectorization standard
PyTorch introduces dynamic define-by-run execution graphs
LAPACK extends BLAS with higher-level numerical routines (e.g., SVD, factorizations)**
Answer: The correct sequence is 2 -> 6 -> 4 -> 3 -> 5 -> 1:
- BLAS (1979): Standardized low-level linear algebra primitives.
- LAPACK (1992): Extended BLAS with higher-level matrix factorizations and numerical solvers.
- NumPy (2006): Unified Python scientific array abstractions and vectorized dispatch.
- Theano (2007): Introduced Python-defined symbolic computational graphs compiled to GPU code.
- PyTorch (2016): Popularized dynamic define-by-run computational graphs.
- JAX (2018): Introduced functional composable transformations (
grad,vmap,jit) backed by XLA.
- JAX (2018): Introduced functional composable transformations (
The architectural design pattern established by NumPy, where high-level control logic is written in an expressive interpreted language (such as Python) while inner numerical loops are delegated to compiled C/Fortran libraries, is known as ____.
Answer: The correct answer is vectorization (or vectorized execution). Vectorization allows developers to write clean array-level expressions in Python while delegating repetitive element-wise and matrix loops to optimized native code.
Learning Objective: Identify the vectorization design pattern that connects interpreted frontends to compiled numerical backends
Self-Check: Answer
A GPU performance profile reveals that a sequence of LayerNorm, dropout, and GELU activation operations spends over 80% of its execution time reading and writing intermediate tensors to High Bandwidth Memory (HBM) with very low arithmetic intensity. Why is operator fusion the primary framework optimization for this workload?
- It replaces 16-bit floating-point arithmetic with 8-bit integer arithmetic
- It changes the model architecture to eliminate all non-linear activation functions
- It converts compute-bound matrix multiplications into memory-bound operations
- It fuses multiple sequential element-wise operations into a single GPU kernel, keeping intermediate values in on-chip SRAM/registers and eliminating redundant round trips to HBM
Answer: The correct answer is D. Element-wise and normalization layers have low arithmetic intensity and are memory-bandwidth-bound; operator fusion combines these sequential passes into a single GPU kernel that passes intermediate values through fast on-chip registers and SRAM, drastically reducing global HBM memory traffic. Precision quantization changes numerical representation rather than performing fusion. Modifying network architecture mischaracterizes a compiler optimization as a model alteration. Converting operations to memory-bound would degrade rather than improve arithmetic efficiency.
Learning Objective: Analyze why operator fusion mitigates memory-wall bottlenecks for low arithmetic intensity layers
A developer traces a PyTorch model containing data-dependent control flow such as
if tensor.sum() > 0: ...usingtorch.jit.trace, then later runs inputs that should take the other branch. What is the most accurate description of the tracing risk and the modern graph-capture behavior described in the section?- Tracing always crashes immediately on tensor-dependent branches, whereas modern graph capture always compiles the entire program without fallback
- Tracing converts the Python conditional into a fully general static graph branch, whereas modern graph capture removes the need for any control-flow assumptions
- Tracing records the branch taken by the example input and may emit a
TracerWarning, while modern graph capture can compile supported regions and, when eager fallback is enabled, return to eager execution at unsupported boundaries - Tracing silently succeeds for all future inputs, whereas modern graph capture fails only when the GPU lacks enough memory
Answer: The correct answer is C. Tracing records the execution path actually observed for the example input, so a tensor-dependent Python branch can be baked in for that path and PyTorch commonly emits a
TracerWarningabout the resulting lack of generality. Modern graph capture is more flexible because it can compile supported regions and, with eager fallback enabled, return to eager execution at graph breaks rather than requiring the whole program to stay captured. The claim that tracing always crashes is too strong, and the idea that tracing creates a fully general branch-preserving graph misstates what trace-based capture records.Learning Objective: Compare trace-based capture with modern graph capture for data-dependent control flow
State the dispatch overhead law and explain why a workload composed of many small tensor operations on a fast GPU can be severely underutilized in eager mode even when the hardware has high peak throughput.
Answer: The dispatch overhead law states that overhead dominates when the software dispatch time becomes large relative to hardware execution time, modeled in the chapter as \(\frac{N_{\text{ops}} \cdot t_{\text{dispatch}}}{T_{\text{compute}} + T_{\text{memory}}} > 1\) under a no-overlap approximation. In the chapter’s small-operation scenario, each eager op pays host dispatch and launch work while the device kernels themselves are very short, so end-to-end time is driven more by repeated host overhead than by arithmetic or memory throughput. For example, a small MLP can spend most of its step time in dispatch even on an A100-class GPU. The practical implication is that fusion or graph capture helps not by changing the math, but by reducing how often the host must launch tiny pieces of work.
Learning Objective: Explain how the dispatch overhead law causes GPU underutilization on small eager-mode operations
True or False: When eager fallback is enabled in
torch.compile, encountering a graph break necessarily halts execution with a runtime error because the unsupported Python code cannot be represented in the captured graph.Answer: False. With eager fallback enabled, a graph break ends the current captured region, executes the unsupported portion in eager mode, and can resume capture later. A full-graph requirement is the configuration that can turn such a break into an error.
Learning Objective: Evaluate the operational behavior and performance impact of graph breaks in graph-capture JIT compilers
Order the stages of a generic graph-capture compilation pipeline from the first Python call to repeated execution of optimized code: (1) an intermediate representation is built for the captured region, (2) optimized executable code is cached for reuse under the same guards, (3) the frontend captures a region of tensor computation from the eager program, (4) the compiled region executes on the target hardware, (5) optimization and lowering transform the captured region toward hardware-specific execution.
Answer: The correct order is: (3) the frontend captures a region of tensor computation from the eager program, (1) an intermediate representation is built for the captured region, (5) optimization and lowering transform the captured region toward hardware-specific execution, (2) optimized executable code is cached for reuse under the same guards, (4) the compiled region executes on the target hardware. Capture has to happen before any IR exists; optimization and lowering require that representation; caching happens only after code has been produced; and execution uses the resulting cached artifact when the same assumptions still hold. Swapping capture with optimization would leave nothing to optimize, and swapping caching with execution would remove the compiled object that later calls are supposed to reuse.
Learning Objective: Order the stages of a graph-capture compilation pipeline from eager program capture to cached hardware execution
In graph-capture JIT compilation systems like TorchDynamo, an event where the compiler encounters an unsupported dynamic Python construct (such as an unhandled C-extension call or dynamic side effect) and must pause graph capture to yield control to the Python interpreter is called a ____.
Answer: The correct answer is graph break. A graph break splits the computational graph into multiple subgraphs separated by interpreted Python execution, which can increase kernel dispatch overhead.
Learning Objective: Identify the concept of a graph break in graph-capturing execution systems
Self-Check: Answer
For a neural network with \(N = 10^7\) parameters and a single scalar loss output \(M = 1\), why is reverse-mode automatic differentiation the standard training choice in deep learning frameworks?
- Reverse mode gets all parameter gradients from one reverse traversal whose work is proportional to the recorded graph, whereas forward mode would need one seeded direction per parameter to recover the full gradient
- Forward-mode differentiation cannot compute exact gradients and therefore is unusable for neural networks
- Reverse-mode differentiation requires no saved forward information, so it is always the lowest-memory choice
- Forward mode can differentiate only scalar element-wise functions, not matrix multiplications or network layers
Answer: The correct answer is A. Training has a many-parameters-to-one-loss structure, so reverse mode is efficient because one reverse traversal can accumulate gradients for all parameters with work proportional to the forward graph up to a small constant factor. Forward mode computes exact derivatives too, but recovering the full gradient for \(10^7\) parameters would require one seeded direction per parameter. The “no saved forward information” claim is backwards: reverse mode’s main systems cost is retaining or regenerating the forward information backward rules need. Matrix multiplies and other network operations are differentiable in forward mode as well, so the restriction claim is false.
Learning Objective: Compare the scaling of forward-mode and reverse-mode automatic differentiation for many-parameter scalar-loss training
A PyTorch user modifies an intermediate activation tensor using an in-place operation (
x.relu_()orx += 1) during the forward pass. Duringloss.backward(), autograd raises a runtime error: “one of the variables needed for gradient computation has been modified by an inplace operation”. What is the systems mechanism causing this failure?- In-place operations convert 32-bit floating point numbers to integers, corrupting floating-point precision
- The autograd tape recorded a reference to the forward tensor whose underlying storage was overwritten, destroying the original activation values required by the operation’s derivative formula
- In-place operations automatically set
requires_grad=Falseon all ancestor nodes in the computational graph - The GPU caching allocator prohibits in-place memory modifications during forward execution
Answer: The correct answer is B. Autograd saves pointers to intermediate activations during the forward pass via functions like
ctx.save_for_backward(); modifying those buffers in-place overwrites the numerical values needed to evaluate derivative formulas during the backward pass, triggering version-counter mismatch errors. In-place operations preserve data types and do not convert floats to integers. In-place operations do not alter therequires_gradflags of ancestor nodes. The hardware memory allocator does not restrict in-place buffer mutations; the error is enforced by framework autograd version tracking.Learning Objective: Analyze why in-place tensor mutations break autograd tape integrity during reverse-mode differentiation
Explain the difference between accumulating gradients in a tensor’s
.gradattribute across batches and retaining the autograd computational graph usingloss.backward(retain_graph=True).Answer: Gradient accumulation adds successive backward results into parameter
.gradbuffers until those buffers are reset; each batch can use a fresh graph. By contrast,retain_graph=Truekeeps saved graph state available for another traversal of the same computation, which can retain additional device memory. Releasing that saved state does not reclaim tensor storage that other live references still retain, and graph retention is distinct from page-locked host memory.Learning Objective: Distinguish gradient accumulation in tensor buffers from computational graph retention across backward passes
True or False: Because reverse-mode automatic differentiation computes exact gradients in a single backward pass, its peak memory consumption during training is identical to that of inference.
Answer: False. Training usually keeps additional forward information needed by backward rules, and what must be saved depends on the operation and implementation. Inference avoids optimizer state and gradient storage, but it still has live activations, workspaces, and other runtime tensors rather than only the current layer in all cases.
Learning Objective: Evaluate the memory footprint differences between forward-only inference and reverse-mode training passes
**Order the sequence of events executed during reverse-mode automatic differentiation for a single training step:
Initialize the backward pass by seeding the output gradient adjoint with \(d\mathcal{L}/d\mathcal{L} = 1.0\)
Execute the forward pass while registering operations and saving required activation tensors on the autograd tape
Accumulate calculated parameter gradients into the
.gradattributes of leaf parametersCompute the scalar loss \(\mathcal{L}\) from model outputs and ground truth targets
Traverse the
GradFnDAG backward, applying operation-specific Vector-Jacobian Products (chain rule)**Answer: The correct sequence is 2 -> 4 -> 1 -> 5 -> 3:
- Forward pass & autograd tape recording: Evaluates operations and caches intermediate activations.
- Loss calculation: Produces the scalar objective value \(\mathcal{L}\).
- Gradient seed initialization: Sets the root adjoint \(d\mathcal{L}/d\mathcal{L} = 1.0\).
- Backward DAG traversal: Evaluates Vector-Jacobian Products along reverse-linked nodes.
- Gradient accumulation: Writes computed gradients to leaf parameter
.gradbuffers.
- Gradient accumulation: Writes computed gradients to leaf parameter
To reduce GPU memory pressure from saved activations during long forward passes, frameworks can save only selected boundary tensors and recompute dropped intermediates during the backward pass. This memory-saving technique is called activation ____ (or rematerialization).
Answer: checkpointing. Activation checkpointing reduces peak saved-activation memory by storing only selected boundaries and recomputing omitted intermediates later, trading additional backward-time work for lower memory capacity pressure.
Learning Objective: Identify activation checkpointing as a compute-memory trade-off mechanism
Self-Check: Answer
In framework tensor implementations such as PyTorch
Tensoror NumPyndarray, what distinguishes a tensor view from a tensor copy?- A view converts the underlying data from floating-point to integer representation
- A view changes only tensor metadata while sharing the same storage, though reshape can do this only when the existing strides permit the requested layout
- A view duplicates the tensor into host CPU memory while leaving device memory unchanged
- A view guarantees the tensor is stored in contiguous C-order memory
Answer: The correct answer is B. A view reinterprets existing storage through metadata such as shape, strides, and offset rather than allocating a new data buffer. The chapter emphasizes that transpose commonly creates a strided view, while reshape may return either a view or a copy depending on layout and stride compatibility. The datatype does not change just because something is a view, and a view is often noncontiguous rather than guaranteed to be C-contiguous. The host-copy answer also confuses storage sharing with device transfer, which is a separate operation.
Learning Objective: Distinguish tensor views from tensor copies in terms of metadata, storage sharing, and layout constraints
A training loop shows GPU idle time because batches arrive late from the input pipeline. How can
pin_memory=Truetogether withtensor.to(device, non_blocking=True)help, and what does it not guarantee by itself?- It automatically quantizes all host tensors to 8-bit precision so the GPU receives less data
- It bypasses the data loader by executing preprocessing directly inside GPU kernels
- It places batches in page-locked host memory so eligible host-to-device copies can use DMA and potentially overlap with device work, but actual overlap still depends on having independent batches, streams, and correct dependency ordering
- It forces every CUDA kernel to run on the default stream so transfer and compute become easier to coordinate
Answer: The correct answer is C. Pinned host memory enables DMA-friendly transfers from page-locked RAM, and
non_blocking=Truecan let those copies proceed asynchronously with respect to the host when the backend supports it. But the chapter is explicit that real overlap also requires enough independent work and correct stream synchronization; pinned memory is not a substitute for fixing a slow CPU loading pipeline with workers and prefetching. The quantization answer invents a mechanism unrelated topin_memory, and the default-stream answer would reduce rather than create overlap opportunities.Learning Objective: Analyze how pinned memory and non-blocking copies can help data movement, and distinguish transfer overlap from CPU data-loading bottlenecks
Why can an accidental synchronous CPU-GPU tensor transfer (such as calling
.item()or printing a tensor inside a training loop) degrade throughput far more than the raw byte transfer time would suggest?Answer: Host-device synchronization calls like
.item()force the CPU thread to block until all previously queued GPU operations on the stream complete. This eliminates CPU-GPU execution concurrency, flushes the GPU work queue, exposes host dispatch latency, and prevents the framework from pipelining subsequent kernel launches.Learning Objective: Explain how host-device synchronization calls destroy execution concurrency and pipeline overlap
Self-Check: Answer
In framework module abstractions like PyTorch’s
nn.Module, what systems mechanism enablesoptimizer = torch.optim.Adam(model.parameters())to find all registered model weights without the developer manually listing every tensor?- Python automatically compiles all local variables into an optimization graph
- The GPU driver scans VRAM at runtime to detect all floating-point matrices
- The autograd engine injects global hooks into Python’s garbage collector
- Overridden attribute assignment registers
nn.Parameterobjects in the module tree, andparameters()recursively walks that registered structure
Answer: The correct answer is D.
nn.Moduleintercepts attribute assignment so that assignednn.Parameterobjects and child modules are registered into the module’s internal structure. Callingparameters()then recursively traverses that tree to yield registered parameters. A key subtlety from the section is that registration and trainability are separate: frozen registered parameters can still appear in the accessor, while buffers are tracked separately and excluded from ordinary parameter discovery. The GPU driver and Python runtime do not understand model semantics at that level, and garbage-collector hooks are unrelated to module registration.Learning Objective: Explain the parameter registration and recursive discovery mechanism in module abstractions like nn.Module
Explain why setting
model.eval()is necessary for numerically correct inference in models containing BatchNorm or Dropout, and clarify whymodel.eval()is not a substitute for disabling gradient recording.Answer:
model.eval()is needed because some layers change behavior between training and inference: Dropout should stop randomly zeroing activations, and BatchNorm should use stored running statistics rather than current batch statistics. That makes inference numerically consistent with the model’s intended deployment behavior. But evaluation mode does not itself turn off autograd recording, so a separate gradient-disabling context is still useful when gradients are enabled and you want to avoid unnecessary graph recording and saved state. The practical implication is that correct inference behavior and lower autograd overhead are related but separate controls.Learning Objective: Distinguish the systems role of module evaluation mode from gradient-recording controls
In PyTorch’s
nn.Module, the dictionary data structure returned bymodel.____()serializes all learnable parameters and persistent non-parameter buffers (such as BatchNorm running statistics) into named tensor mappings for checkpointing.Answer: The correct answer is state_dict (or state_dict()). The state_dict maps string parameter/buffer names to tensor data, decoupling the saved weights from the Python class definition.
Learning Objective: Identify the state_dict abstraction used for model parameter and buffer serialization
What does
load_state_dict()fundamentally do in the module serialization pattern described in the section?- It loads parameter and buffer values into an already constructed matching module rather than reconstructing the architecture from scratch
- It automatically quantizes all stored tensors before loading them into the model
- It discovers the model architecture from weights alone and rebuilds any missing layers
- It guarantees cross-framework portability as long as the tensor shapes match
Answer: The correct answer is A. The section explains that
state_dict()stores a flat mapping of parameter and buffer values keyed by their location in the module hierarchy, andload_state_dict()copies matching values into an already constructed module. That means serialization preserves state, not an architecture inference procedure. The “weights alone rebuild the model” idea confuses state loading with model definition, and cross-framework exchange needs compatible graph and operator representations in addition to compatible tensor shapes. Automatic quantization is also unrelated to ordinarystate_dictloading.Learning Objective: Explain how state_dict loading restores module state without reconstructing architecture or guaranteeing cross-framework portability
Self-Check: Answer
During the forward execution of an MLP layer
h = torch.relu(x @ W1 + b1)withrequires_grad=True, what two operations occur concurrently inside the framework?- It computes the forward output and immediately updates the weights
W1using gradient descent - It executes the matrix multiplication on the GPU and transmits the gradients back to the host CPU
- It computes the forward numerical activations on the hardware accelerator and constructs a dynamic autograd tape recording the operations and caching required intermediate tensors for the backward pass
- It compiles the entire Python script into a native standalone mobile application
Answer: The correct answer is C. The forward pass has a dual responsibility: computing the mathematical output tensors on the accelerator device, and recording the computational graph (
GradFnnodes) while saving necessary forward activations (such asxand intermediate pre-activations) on the autograd tape for use during backpropagation. Weight updates happen during the optimizer step after the backward pass, not during the forward pass. Gradients are computed during the backward pass, not during forward execution. Forward execution does not compile the script into mobile binaries.Learning Objective: Analyze the dual computational and autograd-recording responsibilities of a framework forward pass
- It computes the forward output and immediately updates the weights
In the chapter’s two-layer MLP training-step analysis, suppose a hypothetical profiler showed many short kernels separated by host-side dispatch gaps. Why could the total eager-mode step time greatly exceed the idealized compute and memory lower bounds even on a very fast GPU?
- Because network communication across multiple machines dominates every training step in the example
- Because thermal throttling is the main bottleneck for small matrix operations in the scenario
- Because the dynamic class hierarchy in the framework leaks memory between layers
- Because repeated host-side dispatch and kernel-launch overhead for many small operations can dominate when the device kernels themselves are short
Answer: The correct answer is D. In that hypothetical profile, many short kernels separated by host dispatch gaps would support an overhead-bound diagnosis: even if compute and memory lower bounds are small, eager execution can still spend substantial time issuing many separate operations. The chapter’s peak-rate lower bounds and dispatch-cost assumptions motivate this explanation, but by themselves they do not constitute an observed profile. The network answer does not fit a single-device step, and the thermal-throttling and memory-leak explanations are not the chapter’s modeled source of overhead.
Learning Objective: Analyze why small model training steps on fast accelerators can be overhead-bound rather than limited by raw compute or memory bandwidth
Contrast the arithmetic intensity of a matrix multiplication (
MatMul) with an element-wise activation such asReLU, and explain how their performance bottlenecks can differ on modern GPUs depending on shape and execution conditions.Answer: A matrix multiplication typically reuses its operands many times, so it performs much more arithmetic per byte moved than an element-wise activation does. By contrast, ReLU does very little computation for each value it reads and writes; in the chapter’s simplified example it is about \(0.125\) FLOP/byte, which makes bandwidth and launch overhead loom large. A MatMul can therefore move toward a compute-bound regime when its shapes are favorable, while ReLU often stays memory- or overhead-sensitive because there is so little work per byte. The practical implication is that compilers often target ReLU-like chains with fusion, whereas large matrix multiplies are more often optimized through kernel quality, layout, and precision choices.
Learning Objective: Compare the arithmetic intensity and likely bottlenecks of matrix multiplication versus element-wise activation under the roofline model
**Order the complete sequence of computational and system phases occurring inside a framework during a single standard training iteration:
Loss calculation: The criterion function evaluates the scalar training loss \(\mathcal{L}\)
Backward pass: Autograd traverses the reverse tape, executing Vector-Jacobian Products and populating
.gradbuffersOptimizer step: The optimizer reads
.gradvalues and updates parameter tensors in-place using the optimization algorithmForward pass: The model executes layer operations and records the dynamic autograd tape
Gradient reset:
optimizer.zero_grad()clears or sets.gradbuffers toNone**Answer: The correct sequence is 5 -> 4 -> 1 -> 2 -> 3:
- Gradient reset: Clears accumulated gradients from previous iteration (
zero_grad()).
- Gradient reset: Clears accumulated gradients from previous iteration (
- Forward pass: Evaluates layer activations and builds the autograd tape.
- Loss calculation: Computes scalar objective \(\mathcal{L}\).
- Backward pass: Traverses tape backward to compute parameter gradients.
- Optimizer step: Updates model weights using computed gradients and momentum/decay state.
During the backward pass of a training step, why is memory traffic often higher than in the forward pass even when the amount of arithmetic work is of the same order?
Answer: Backward computation often has to revisit saved forward values, combine them with upstream gradients, and write out new gradients, so more tensors are read and written during the pass. For example, a layer may need the saved forward input plus the incoming gradient to produce both weight gradients and propagated gradients. In the chapter’s two-layer MLP, backward evaluates three GEMMs because the raw input needs no gradient; its traffic follows the operands and results of those products plus the activation and loss derivatives, rather than a universal multiplier of forward traffic.
Learning Objective: Analyze why the backward pass often incurs higher memory traffic than the forward pass
Self-Check: Answer
Which framework ecosystem in the section is organized around
SavedModelas a central boundary between Python-side development and multiple deployment paths such as server serving, mobile conversion, and browser execution?- PyTorch eager execution as originally presented
- TensorFlow ecosystem with SavedModel feeding Serving, Lite conversion, and TensorFlow.js paths
- Pure NumPy with custom Python socket servers
- Scikit-learn with standard pickle deserialization
Answer: The correct answer is B. The section presents TensorFlow’s architecture as centered on the SavedModel boundary: training-time Python workflows can serialize graph structure, weights, and signatures into an artifact that supports direct serving or target-specific conversion paths such as TensorFlow Lite and TensorFlow.js. That design emphasis is broader than just one runtime and is exactly what distinguishes TensorFlow in the chapter’s platform comparison. The NumPy and scikit-learn answers do not provide the same graph-centered deployment architecture, and the PyTorch option misses that the chapter describes PyTorch as eager-first with a more fragmented deployment path rather than SavedModel-centered deployment.
Learning Objective: Classify TensorFlow by its SavedModel-centered training-to-deployment architecture
What core programming-model commitment distinguishes JAX from both PyTorch and TensorFlow in the chapter’s comparison, enabling transformations like
jax.grad,jax.vmap, andjax.jitto compose when their contracts align?- Dynamic class inheritance with mutable object references for all layer parameters
- Global state mutation across all forward and backward passes
- Pure functions over immutable array-like data, with transformations applied to functions rather than hidden mutable objects
- Graph capture via AST string parsing of Python source files
Answer: The correct answer is C. JAX is presented as a functional transformation system: users write pure functions, arrays are treated immutably, and transformations such as
grad,vmap, andjitact on those functions when each one’s outputs match what the next expects as inputs. The section is careful that composition is powerful but not arbitrary, since order still matters semantically. The mutable-object and global-state answers describe the opposite design direction, and the AST-parsing answer invents a mechanism not used in the chapter’s explanation of JAX tracing and compilation.Learning Objective: Explain the pure functional transformation model that distinguishes JAX architecturally
Compare the workflow and deployment trade-offs that led PyTorch to dominate academic research while TensorFlow established strong early dominance in enterprise production serving during the late 2010s.
Answer: PyTorch’s eager define-by-run execution model allowed researchers to write standard Python code, inspect intermediate tensors with standard debuggers (
pdb), and iterate rapidly on dynamic architectures without upfront graph compilation friction. In contrast, TensorFlow’s static graph architecture andSavedModelexport pipeline provided production-grade deployment infrastructure (TensorFlow Serving, C++ deployment, robust mobile runtimes) that enterprises prioritized for stable, high-throughput serving pipelines.Learning Objective: Compare the developer velocity and production deployment trade-offs that shaped PyTorch and TensorFlow adoption
Explain how JAX’s requirement that functions must be pure and free of side effects enables the XLA compiler to generate highly optimized accelerator kernels through
jax.jit.Answer: Because pure functions guarantee that outputs depend solely on explicit inputs with no hidden state mutations or side effects, the XLA compiler can safely trace the entire computation, reorder operations, eliminate common subexpressions, fuse entire subgraphs into single hardware kernels, and allocate static memory buffers without risk of altering observable program behavior.
Learning Objective: Analyze how functional purity enables aggressive whole-program compiler optimizations in JAX and XLA
Self-Check: Answer
An engineering team is architecting a new commercial computer vision system. In the chapter’s decision framework, why must deployment constraints (e.g. target mobile NPU delegates and memory budgets) act as hard filters evaluated before selecting the training framework?
- If a training framework cannot export or compile the required model operators to the target deployment runtime, the model cannot run in production regardless of its training speed or developer ergonomics
- Training frameworks automatically alter target hardware specifications to match model requirements
- Hard deployment filters guarantee that the model achieves 100% classification accuracy
- Research iteration speed is the only metric that matters in commercial system design
Answer: The correct answer is A. Deployment constraints represent hard feasibility boundaries: if the target hardware or runtime cannot execute the operators exported by the framework, the project fails at deployment time, incurring catastrophic rewriting costs; soft preferences like developer ergonomics only matter among viable paths. Frameworks cannot change physical hardware specifications. Deployment feasibility filters govern system execution capability, not statistical model accuracy. Prioritizing iteration speed while ignoring deployment feasibility leads to un-deployable research artifacts.
Learning Objective: Apply the hard-filter-then-soft-preference principle to framework selection decisions
When evaluating framework viability for a production system expected to operate for 5+ years, which factor is the strongest warning sign of long-term maintenance risk?
- Using Python instead of Fortran for high-level model definitions
- Adopting a niche or fading framework whose maintenance signals, compatibility path, and future hardware support are weak
- Selecting an open-source framework that continues to receive broad ecosystem and vendor support
- Training on GPU clusters rather than single CPU workstations
Answer: The correct answer is B. The section frames framework choice as a multi-year infrastructure commitment, so the biggest architectural risk is weak long-term support: if maintainers disappear, compiler paths stagnate, compatibility erodes, and future hardware or deployment tooling may never be supported well enough for production needs. A framework does not become risky merely because it is less mainstream in some abstract sense; the real concern is whether its maintenance and support signals indicate decay. By contrast, active ecosystem support usually lowers migration and tooling risk, and the Python-versus-Fortran or GPU-versus-CPU answers do not address the chapter’s actual long-horizon framework viability criteria.
Learning Objective: Evaluate long-term maintenance and ecosystem health risks in framework selection
Describe the three fundamental tensions in the framework selection trade-off space (velocity vs. performance, flexibility vs. optimization depth, ecosystem breadth vs. specialization).
Answer: The first tension balances development velocity (rapid eager prototyping and debugging) against production performance (compiled, high-throughput execution). The second balances programming flexibility (arbitrary Python dynamic control flow) against compiler optimization depth (whole-graph visibility enabling deep operator fusion and memory planning). The third balances ecosystem breadth (broad operator coverage across many tasks) against specialization (narrow runtimes like TensorRT that achieve peak throughput on specific hardware).
Learning Objective: Analyze the three fundamental trade-off axes in framework selection
True or False: Because model weights are stored as floating-point arrays, an engineering team can choose any training framework for research and assume that converting to a production embedded runtime is a trivial format conversion step.
Answer: False. Converting between frameworks and deployment runtimes frequently encounters severe operator coverage gaps, custom kernel incompatibilities, unsupported dynamic control flow, and divergent numerical behaviors, making late-stage conversion a frequent source of project delays.
Learning Objective: Evaluate the fallacy that cross-framework model conversion is a frictionless post-training step
Self-Check: Answer
A research team exploring architecture modifications runs experiments where model code changes every 10 training steps. When they enable JIT graph compilation (
torch.compile), total training time increases by 5\(\times\) compared to standard eager mode. What systems principle explains this performance degradation?- Compilation incurs a large upfront compilation latency (\(T_{\text{compile}}\)); if graph structures or tensor shapes change frequently, the compilation cost cannot be amortized across executions (\(N_{\text{steps}} \times (T_{\text{eager}} - T_{\text{compiled}}) < T_{\text{compile}}\)), making repeated recompilation slower than eager execution
- Compiled kernels run at half the floating-point clock frequency of eager kernels on NVIDIA GPUs
- JIT compilers disable GPU hardware acceleration when running short training scripts
- Dynamic graph compilation automatically converts all FP32 operations to 64-bit double precision
Answer: The correct answer is A. Compilation provides execution speedups by generating optimized fused kernels, but compiling incurs an upfront cost (\(T_{\text{compile}}\), often seconds to minutes); if frequent code or shape changes trigger continuous recompilation without sufficient execution steps to amortize the setup overhead, total runtime will be significantly worse than eager mode. GPU clock frequency is identical for compiled and eager kernels. JIT compilers do not disable GPU acceleration. JIT compilers preserve data types and do not convert FP32 to double precision.
Learning Objective: Calculate and analyze compilation break-even thresholds under frequent model recompilation
Explain why choosing a framework based on community popularity or GitHub stars rather than binding deployment constraints is a severe engineering pitfall for edge and embedded ML projects.
Answer: Popularity says little about whether a runtime fits the deployment target. Edge phones, embedded Linux devices, and microcontrollers impose very different limits on memory allocation, operator support, packaging, and hardware acceleration, so a framework that is convenient for cloud training may still be a poor fit for the target runtime. For example, a mobile runtime such as ExecuTorch is solving a different deployment problem from TensorFlow Lite Micro, which is built for far tighter memory budgets and fixed-allocation execution. The practical consequence is that teams who optimize for ecosystem buzz instead of target constraints can reach the end of development with a model that cannot run acceptably on the actual device.
Learning Objective: Explain why popularity is an insufficient criterion for framework selection in constrained deployment environments
True or False: Because standard neural network architectures (like ResNet-50 or Transformers) have identical mathematical definitions, any two frameworks running the same model on identical GPU hardware will produce identical throughput.
Answer: False. Execution throughput depends on framework compiler quality, kernel fusion depth, memory layout decisions (NCHW vs. NHWC), dispatch overhead efficiency, and backend library optimizations (e.g. cuBLAS vs custom Triton kernels), leading to substantial performance variations across frameworks for identical mathematical architectures.
Learning Objective: Critique the fallacy that identical model mathematics implies identical framework runtime performance