15 Sustainable AI
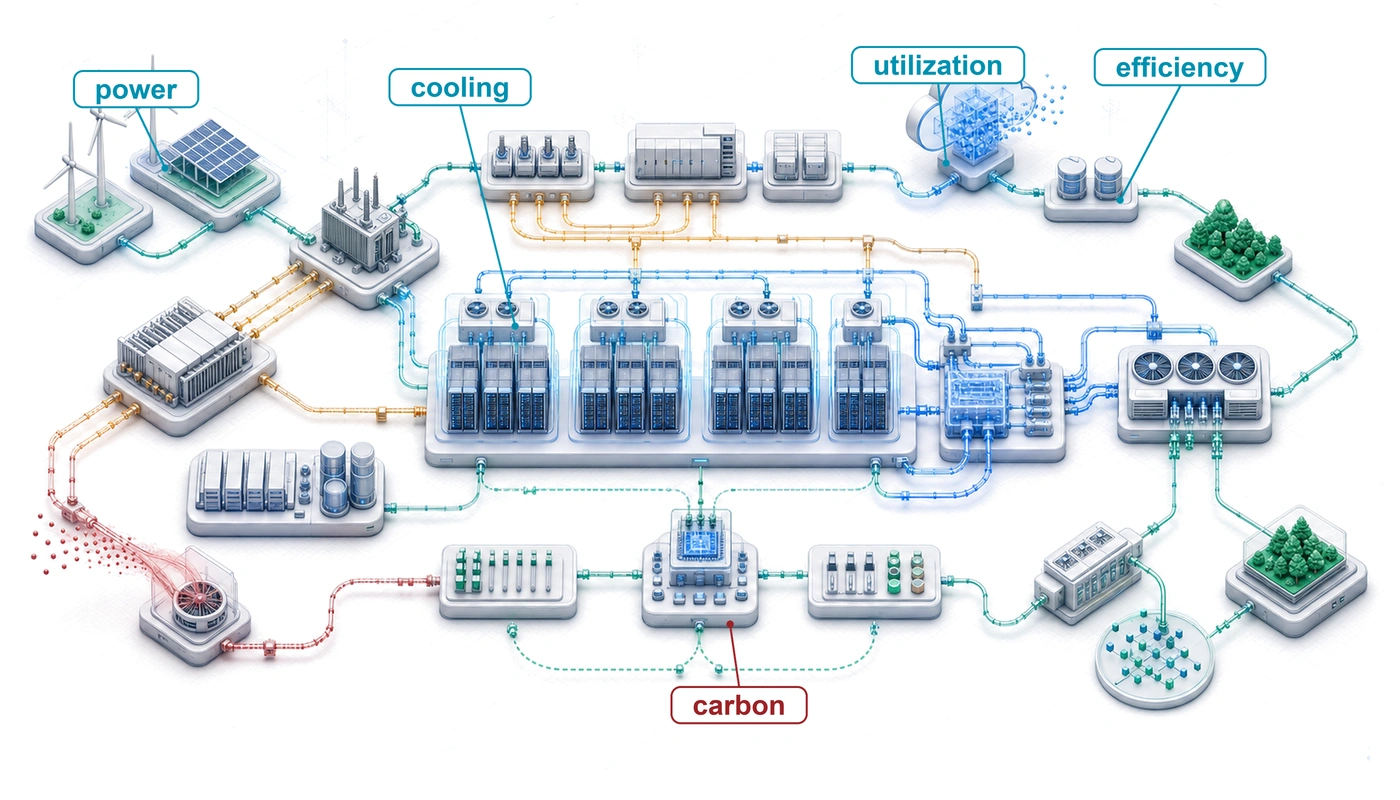
Purpose
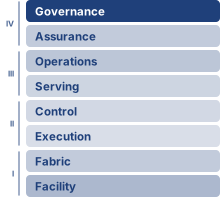
Fleet stack focus for this chapter.
Why do power limits determine what machine learning systems can exist, not just what they cost to operate?
Power is an operational expense and a physical constraint on what can be built. A data center has a power budget determined by electrical infrastructure and cooling capacity; a training run that exceeds it cannot proceed at the intended scale regardless of its financial budget. Adding accelerators only helps if the site can supply their electricity and remove their heat. A design that runs efficiently on one machine can therefore become infeasible when replicated across a fleet. The consequences reach beyond a delayed training run. Power reserved for training may be unavailable to serving, while equipment kept ready for failures consumes resources even when it performs no useful work. Moving work to another location can relieve one constraint while changing its emissions, access to data, or ability to meet deadlines. Efficiency improves these choices, but lower energy per request does not ensure lower total consumption when demand grows. Nor does a clean electricity supply erase the environmental cost of manufacturing and replacing equipment. Engineers must judge feasible designs over their useful lives and account for the communities sharing their water and electricity supplies. Sustainability therefore belongs alongside accuracy, latency, and reliability in system design: a fleet must deliver useful service within resource limits that its performance targets cannot override. In C³ terms, compute, communication, and coordination draw on a shared physical budget, so their combined resource demand determines whether the fleet can operate at all.
Learning Objectives
- Explain why facility power and cooling limits constrain which ML systems can physically exist
- Analyze how scaling-driven compute growth, hardware efficiency, and demand rebound shape fleet resource demand
- Calculate operational, embodied, and lifecycle carbon from energy use, power usage effectiveness, manufacturing, and grid intensity
- Analyze how computation, memory movement, power delivery, cooling, and water availability constrain sustainable fleet operation
- Compare training, inference, edge, and federated workloads by energy, carbon, and battery budgets
- Design mitigation strategies across algorithms, infrastructure, scheduling, hardware lifetime, and carbon-aware operations
- Evaluate sustainability claims against a measurement contract that fixes functional unit, system boundary, and carbon signal
15.1 The Energy Ceiling
The robustness of Robust AI was bought in compute, and every operation that compute performs draws power and sheds heat. A model can be secure against adversaries and robust under distribution shift yet still fail if the available grid cannot power its accelerators or the facility cannot cool them. Sustainability begins at that boundary, where accuracy, latency, and reliability are no longer enough because the system must also fit within power, cooling, water, carbon, and hardware lifetime budgets. Every operation a model performs is paid for in energy, and power density sets the ceiling on data-center computational capacity.1
1 Joule energy scale: An A100 modeled at its rated thermal design power consumes 400 J every second (400 W); actual workload power requires measurement. Large-model training has no single defensible joule range: model size, hardware count, realized power, utilization, and run duration can each shift total energy by orders of magnitude. The engineering lesson lies in the conversion from repeated per-operation costs to facility energy, so this chapter reports measured or modeled workload energy rather than assigning every large run to one fixed range.
When an engineer optimizes a database query to save 100 ms, that is ordinary performance tuning. At fleet scale, the same saving repeated billions of times per day can reduce electrical demand, cooling load, and carbon emissions if it reduces measured energy per completed query (Lacoste et al. 2019). A system that exceeds its operating envelope has failed operationally in the same sense as one that crashes, because it cannot be deployed at the intended scale.
That ceiling makes sustainability a design constraint, not a reporting category. The same engineering discipline that budgets memory, bandwidth, and fault tolerance must also budget joules, cooling load, embodied carbon, and hardware replacement cycles.
Physical feasibility establishes which fleets can run. Sustainability then compares the environmental cost of feasible designs over their useful lives, starting from workload energy at a declared measurement boundary, extending the account to carbon, water, and manufacturing, and letting the dominant lifecycle term decide among efficiency, placement, and hardware reuse. Communication and coordination belong in that account alongside compute, because transfers, synchronization stalls, and recovery keep equipment powered even when useful computation stops. Under the Fleet Law, a distributed step costs its average fleet power multiplied by its step time, so every second of exposed communication or synchronization is also a block of joules; equation 13 writes that account out where the chapter turns to distributed training.
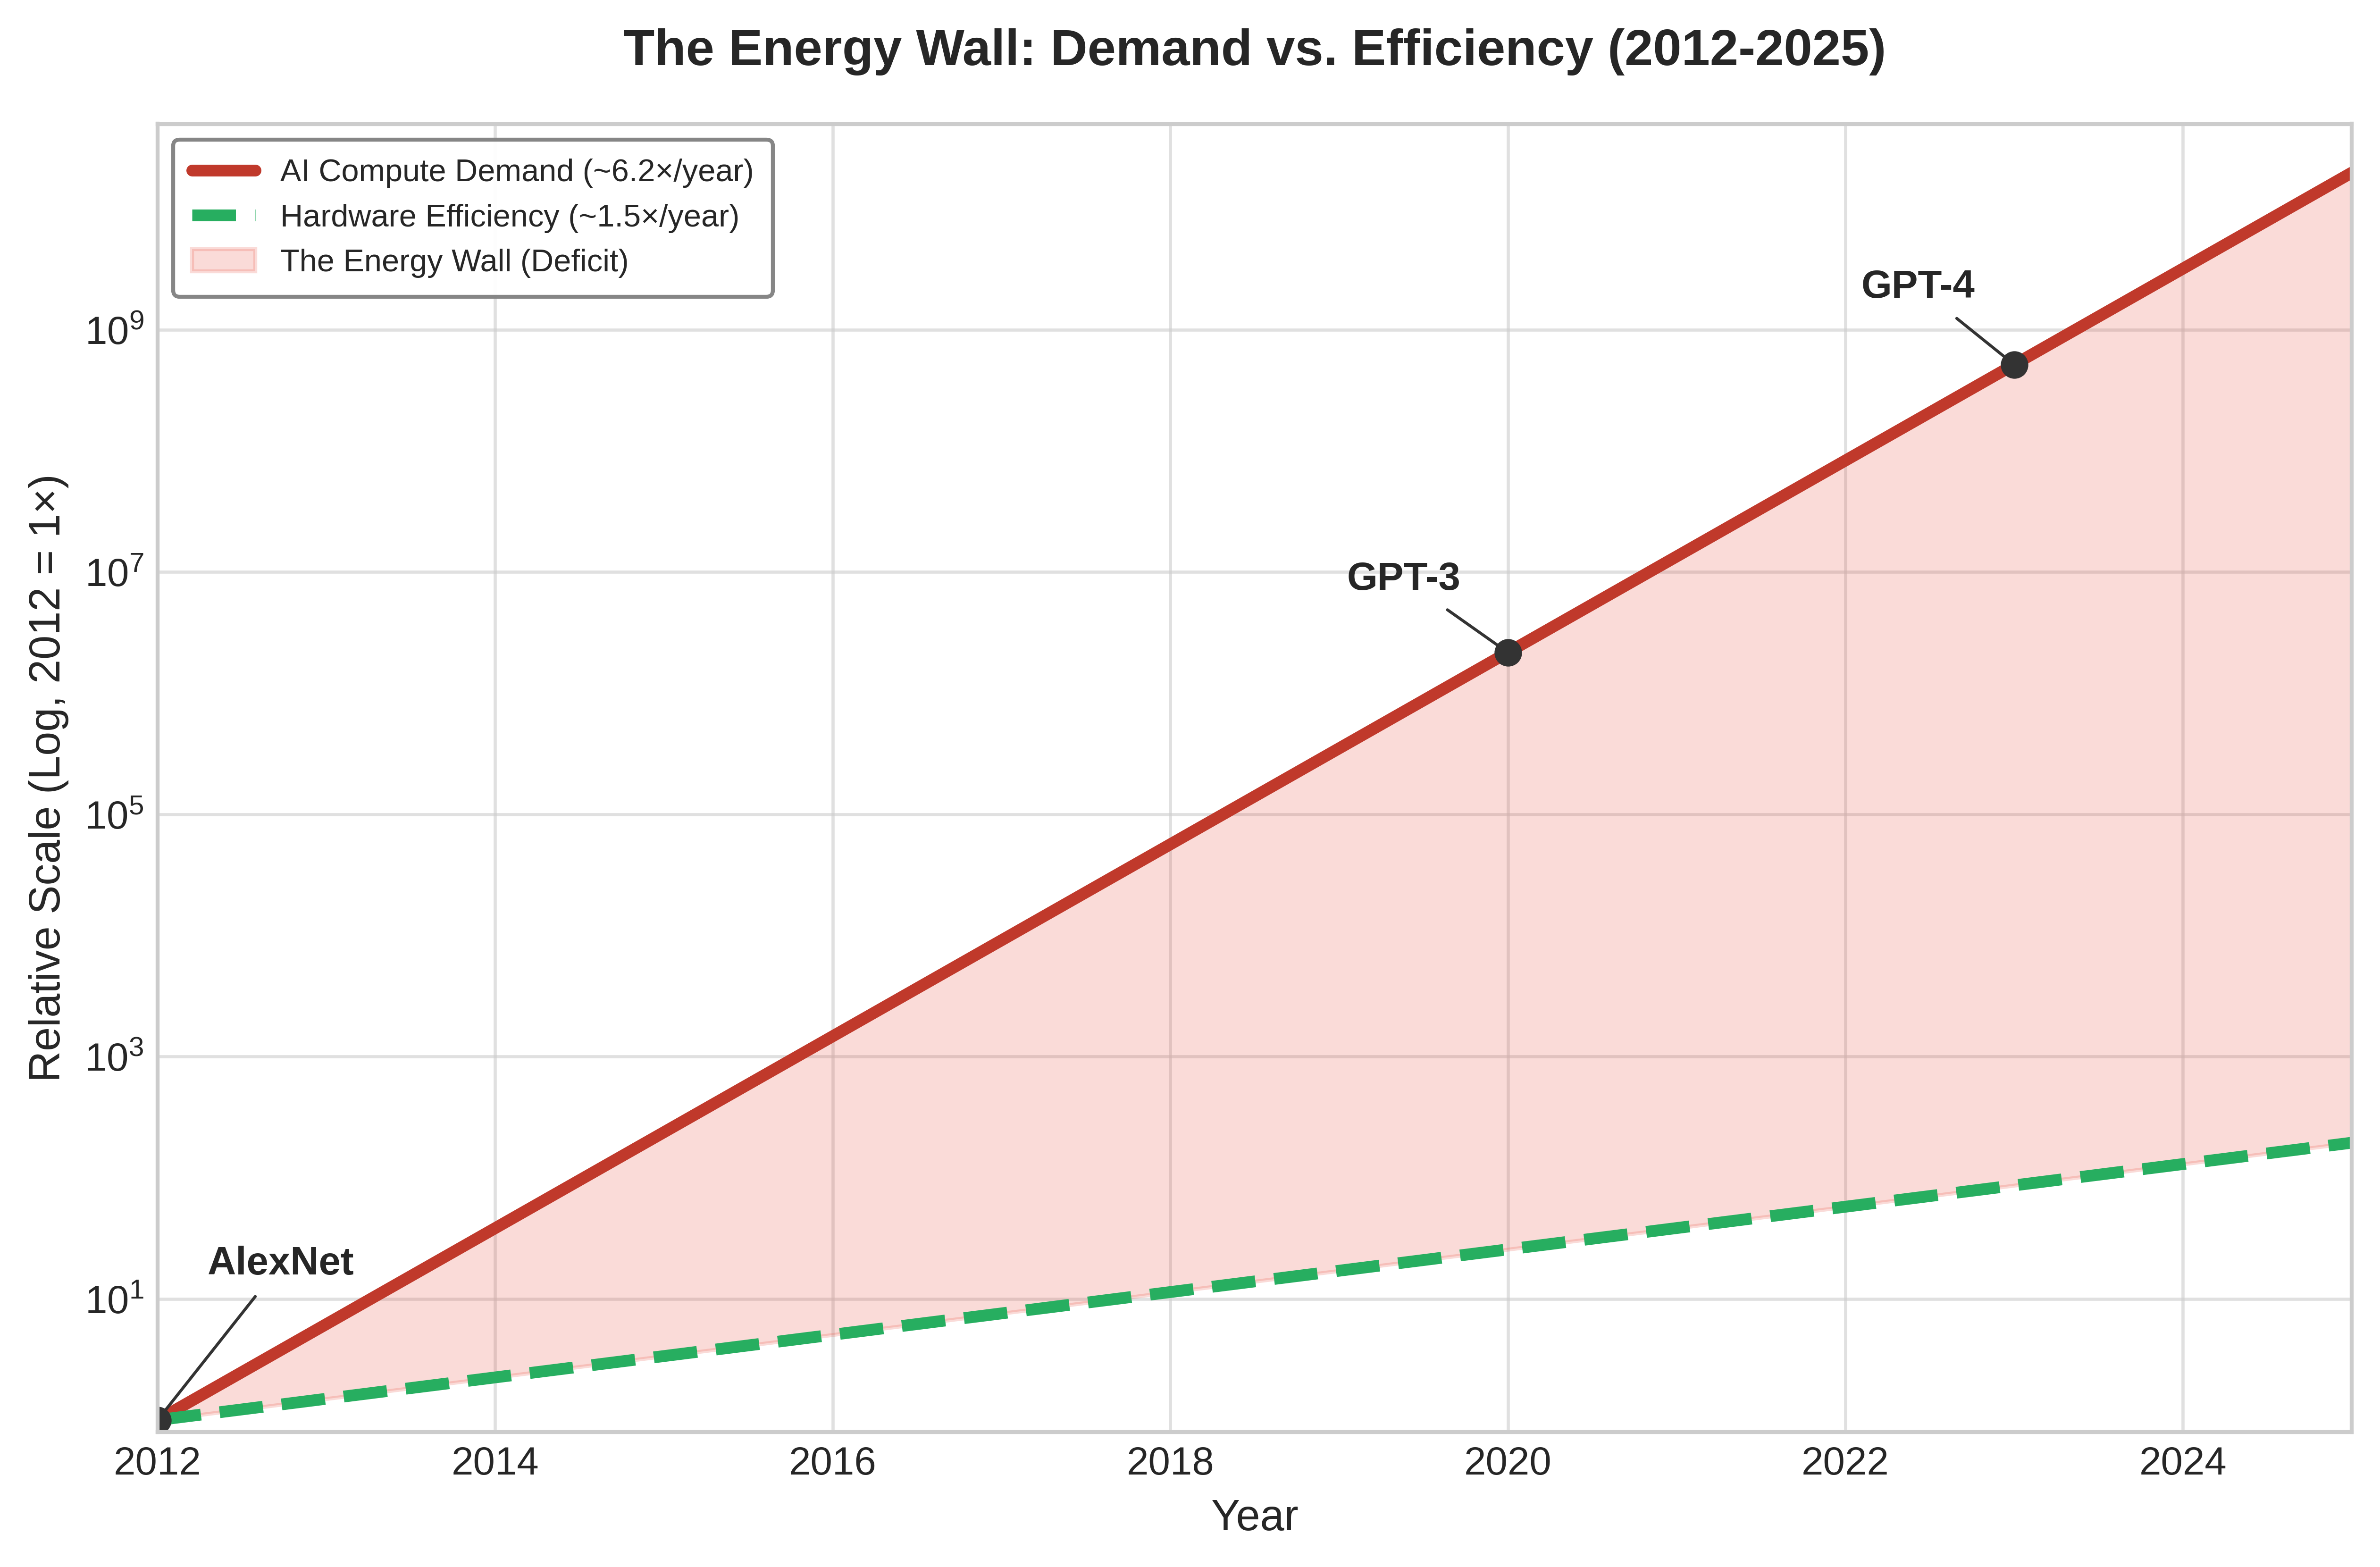
Contemporary machine learning applications operate at industrial scale, with individual campuses drawing power at the level of heavy industrial plants. Training a single large AI model can consume as much electricity as roughly 120 US homes do in an entire year. The scaling laws that motivate fleet-scale training (principle 9) price each further loss reduction in additional compute, data, and parameters, so compute demand has grown faster than hardware efficiency (Sevilla et al. 2022). That scaling-driven growth is the first way demand outruns efficiency, and sustainable AI treats it as a first-class systems problem rather than an externality to be managed after deployment.
↩︎ The power-law scaling of loss with compute, data, and parameters, and the compute-optimal allocation that follows from it, are established in AI Scaling Laws.
Definition 15.1: Sustainable AI
Sustainable AI is the systems engineering practice of measuring and optimizing the full environmental cost of ML systems (energy, water, and embodied carbon across training, inference, and hardware manufacturing) and incorporating those costs as explicit constraints in architecture decisions alongside performance and accuracy objectives (Wynsberghe 2021; Lannelongue et al. 2021; Henderson et al. 2020).
- Significance: Training GPT-3 consumed approximately 1,287 MWh of energy (Li 2020), equivalent to roughly 120 US household-years of electricity. The same lifecycle logic applies after training: pretrained models can often be adapted with far less work than training from scratch, and high-volume inference can eventually dominate total energy. Sustainable AI therefore tracks both one-time training runs and recurring serving workloads rather than treating model training as the whole footprint.
- Distinction: Unlike corporate sustainability reporting (which aggregates energy usage into annual CO2 disclosures), sustainable AI engineering operates at the individual workload level, selecting hardware based on FLOP/s per watt efficiency, scheduling training during periods of high renewable availability, and choosing model architectures that minimize inference FLOPs rather than maximizing accuracy alone.
- Common pitfall: A frequent misconception is that switching to renewable energy solves the sustainability problem. For hardware-intensive ML, embodied carbon (the carbon emitted manufacturing the chips, servers, and cooling equipment before they ever run a training job) can rival operational carbon on clean grids or at low utilization, and for battery-powered consumer devices manufacturing can account for most of the lifecycle footprint (Gupta et al. 2022), making hardware longevity and utilization rate as important as energy source.
Li, Chengwei. 2020. Estimating the Training Cost of GPT-3.
Lannelongue, Loı̈c, Jason Grealey, and Michael Inouye. 2021. “Green Algorithms: Quantifying the Carbon Footprint of Computation.” Advanced Science 8 (12): 2100707. https://doi.org/10.1002/advs.202100707.
Wynsberghe, Aimee van. 2021. “Sustainable AI: AI for Sustainability and the Sustainability of AI.” AI and Ethics 1: 213–18. https://doi.org/10.1007/s43681-021-00043-6.
The environmental impact of AI systems spans the complete lifecycle: from semiconductor manufacturing and data center construction to model training, inference deployment, and electronic waste (Wynsberghe 2021; Gupta et al. 2022; Luccioni et al. 2023). Treating this full lifecycle as an engineering problem rather than a corporate responsibility exercise transforms sustainability from a vague objective into a measurable engineering requirement. Optimizing this footprint requires first grounding intuition in the raw physical energy of a single large-model training run.
Any such calculation first has to fix what the energy measurement includes. This is the accounting discipline that the energy accounting boundary (equation 1.5) imposes on fleet comparisons, applied here to a single run. Accelerator energy excludes host processors, host memory, networking, and storage. IT energy includes those supporting systems; facility energy additionally includes cooling and facility-side power losses. Power usage effectiveness (PUE) is the ratio of facility energy to IT energy over the same interval (equation 2); section 15.4.1.3 gives its formal definition and what it leaves out. Dividing useful training FLOPs by the run’s fleet energy productivity, its useful FLOPs per joule, gives energy at the boundary over which that productivity was measured. If that boundary is IT equipment, multiplying by PUE gives facility energy; if it already includes the facility, applying PUE again double counts overhead. The opening calculations use one completed training run as their unit of work and account for operational electricity. Manufacturing and other lifecycle terms enter separately.
Checkpoint 15.1: The energy of intelligence
A 175B parameter model requires approximately \(3.14 \times 10^{23}\) FLOPs to train. Assuming a data center PUE of 1.1 and a realized training efficiency of 50 GFLOP/J measured across the IT equipment, including support systems but excluding facility overhead:
That household-year figure is the stake; it is also only the electricity entering the building. The next question is where that energy physically goes: how much reaches the accelerators, how much the cooling and power-delivery overhead consumes, and how the grid behind the meter converts those kilowatts into carbon.
Self-Check: Question
A hyperscaler plans a 500 MW campus for a new foundation model cluster, but the local utility interconnect approval is capped at 320 MW for the next three years. The organization’s capital reserves could cover the electricity cost multiple times over. Which framing best captures why sustainable AI treats energy as a first-class engineering constraint rather than a financial or reporting concern?
- Carbon accounting frameworks mandate disclosing total planned capacity upfront, creating an administrative filing hurdle before training begins.
- Electricity price fluctuations create budget volatility, so the primary engineering intervention is financial hedging.
- Corporate sustainability reporting requires purchasing voluntary offsets for unapproved megawatts, adding financial cost without altering physical infrastructure.
- Power delivery and grid interconnect capacity impose a hard physical ceiling that capital cannot bypass on deployment timescales, making power an operational constraint that model architectures and cluster sizing must fit within.
A research team plans a 10,000 MWh training run, measured as facility electricity. Quebec and Poland both meet its capacity, data-access, quality, and deadline requirements, and transfer overhead is negligible. The stated grid factors are approximately 20 and 820 grams of CO2 per kWh, respectively, on a common boundary. An algorithmic change would reduce facility energy in Poland by 15 percent at unchanged quality. Calculate the emissions under these alternatives and justify which offers the larger reduction in this scenario.
True or False: Because successive generations of specialized AI accelerators deliver substantial improvements in energy efficiency (FLOP/s per watt), organizations can rely on hardware innovation alone to keep total data center power consumption flat while scaling model parameters.
Thousands of GPUs alternate between dense computation and collective communication, producing correlated changes in device power. Explain how bidirectional energy storage can buffer the change at a protected electrical boundary, and what measurements determine its timing and capacity.
15.2 The Scale of Environmental Impact
A training run measured in megawatt-hours is hard to reason about, because few engineers carry an intuition for what a megawatt-hour of grid electricity costs the atmosphere. The introduction quoted GPT-3’s training emissions as one of the costs that scaling imposes (Sustainability and cost implications). The derivation behind that figure converts the run’s energy into emissions with a grid factor and then into a familiar anchor, the CO2 of a trans-Atlantic flight, which turns an abstract number into one with physical stakes.
Napkin Math 15.1: The carbon cost of training
Problem: A team trains a large model (GPT-3 size), treating 1,287 MWh as facility electricity for this comparison. How much CO2 is emitted under the stated grid factor, and how does that compare to a trans-Atlantic flight?
Math:
- Energy: Training energy consumption is 1,287 MWh = 1,287,000 kWh.
- Carbon intensity (US average): \(\approx\) 0.429 kg/kWh.
- Total Emissions: Training emissions are 1,287,000 kWh \(\times\) 0.429 kg/kWh \(\approx\) 552,123 kg.
- Comparison:
- One passenger, NY to London (round trip): \(\approx\) 1000 kg.
- Ratio: 552,123 kg / 1000 kg = 552.1.
Systems insight: Under these assumptions, a single training run emits as much carbon as hundreds of trans-Atlantic passenger round trips. The calculation holds facility energy fixed, so changing the grid factor changes the attributed emissions. The same energy on a hydro-heavy grid would emit a small fraction as much, the placement lever that notebook 15.2 quantifies.
The same run’s emissions depend on where its electricity comes from. For a fixed workload, the grid emissions factor and the facility overhead together determine the attributed carbon, and the placement calculations separate those effects, starting with the grid factor alone.
The introduction previewed this geographic factor as a spread of roughly 41× between hydro- and coal-dominated grids. Notebook 15.2 derives that spread by holding facility energy constant and varying only the grid factor.

The same job’s carbon emissions depend on where it runs.
Napkin Math 15.2: The geography of carbon
Problem: A team is choosing a data center for a 10,000 MWh training run, comparing Site A in Quebec (hydropower, 20 g/kWh \(\text{CO}_2\)) against Site B in Poland (coal-heavy, 820 g/kWh \(\text{CO}_2\)). Both factors are rounded annual grid averages on the same emissions boundary, the values figure 6 later applies across nine regions; they are not hourly or marginal signals. How does the location affect a model’s carbon footprint?
Math: Carbon = Energy \(\times\) Grid Intensity.
- Site A emissions: 10,000,000 kWh \(\times\) 20 g/kWh = 200,000,000 g = 200 t \(\text{CO}_2\).
- Site B emissions: 10,000,000 kWh \(\times\) 820 g/kWh = 8,200,000,000 g = 8200 t \(\text{CO}_2\).
- Ratio: 8200 t / 200 t = 41× difference.
Systems insight: The Quebec-versus-Poland pair gives a 41× difference in attributed emissions at the same facility energy. This comparison isolates the grid factor; it does not rank placement against an unmeasured algorithmic change. A fleet decision must compare feasible sites and schedules using both workload energy and the emissions associated with supplying it.
The ratio holds only at equal facility electricity and these annual-average factors. A second gain from waiting for cleaner hours, the temporal lever of section 15.9.4, therefore cannot simply be multiplied onto it; the joint schedule must be evaluated as one decision.
The GPT-3 household-year calculation above anchors the workload scale. The fleet-scale consequence is larger. IEA projects global data-center electricity consumption to reach about 945 TWh by 2030, just under 3 percent of global electricity demand, with AI-accelerated servers driving much of the growth (International Energy Agency 2025).2 Historical studies document rapid growth in training compute (Sevilla et al. 2022), but a compute multiplier is not an energy multiplier without a matching efficiency measurement.
2 Data center industrial scale: The IEA projection is an electricity-demand metric, not directly comparable to aviation or cement shares of global emissions. AI infrastructure competes with other loads for deliverable power; expansion requires available capacity, additional supply, or a reduction or shift in competing demand, not necessarily new generation within the same region.
3 GPU manufacturing embodied carbon: NVIDIA’s HGX H100 product carbon footprint reports 1,312 kg CO2e (CO2-equivalent, which expresses other greenhouse gases as the mass of CO2 with the same warming effect) for an eight-H100 baseboard, or roughly 164 kg CO2e per H100 if allocated evenly across the eight GPUs (NVIDIA Corporation 2025). Advanced-node manufacturing also consumes ultrapure water, specialty gases, and chemicals that an energy-only account never sees, so a per-GPU carbon figure understates the full manufacturing footprint.
4 AI hardware e-waste: Retiring an accelerator does not necessarily create waste: equipment may be redeployed, resold, or recycled. Estimate disposal impacts from the actual equipment inventory, material composition, and end-of-life route. Extending useful service life can defer manufacturing and disposal, while certified handling limits exposure to hazardous materials in discarded electronics.
Beyond direct energy consumption, AI systems drive environmental impact through hardware manufacturing and resource consumption. Producing processors and their supporting equipment requires materials and industrial processes whose impacts precede the first training run.3 At the other end of the hardware’s life, retired equipment joins the electronic-waste stream whose scale section 15.8.5 quantifies. Rising workload requirements can motivate accelerator replacement before physical failure; whether replacement creates waste depends on the equipment’s reuse and disposal path.4
These environmental challenges are part of the energy ceiling, not an add-on to it, because the communities that host land, water, grid capacity, and waste streams also carry part of the system cost. These scale calculations turn sustainability into an allocation problem. AI progress creates benefits in one part of the system while assigning electricity, water, land, and disposal costs to another, so environmental responsibility must be treated as part of systems design rather than as postdeployment reporting. Section 15.10.4 examines how site selection distributes these burdens across communities.
Self-Check: Question
A 2,000 MWh training run can be placed at a site whose annual-average grid factor is 400 g CO2 per kWh or at one whose factor is 20 g CO2 per kWh, with facility electricity held equal. Which conclusion follows?
- The cleaner site also cuts the run’s energy twentyfold, because low-carbon grids deliver electricity more efficiently.
- Attributed emissions fall from about 800 tonnes to about 40 tonnes, a twentyfold difference that isolates the grid factor at equal facility energy.
- This comparison alone ranks placement against an algorithmic change, because both reduce emissions.
- Waiting for cleaner hours at the cleaner site would multiply the saving by a further twentyfold.
True or False: Because training compute for notable models has grown by many orders of magnitude, training energy has grown by the same multiplier.
An operator reports its AI fleet’s environmental footprint as metered electricity multiplied by the grid factor. What does this account leave out?
- Nothing, because operational electricity is the only environmental cost of AI hardware.
- Only facility overhead, because grid factors already include the cost of manufacturing.
- A fixed disposal charge per device, because retiring any accelerator necessarily creates e-waste.
- Manufacturing impacts that precede the first training run, such as embodied carbon, ultrapure water, and specialty gases, and the land, water, and grid capacity that host communities supply.
A Quebec-versus-Poland comparison shows a 41-fold emissions difference for the same 10,000 MWh run, and carbon-aware scheduling can also shift work to cleaner hours. Explain why the geographic and temporal gains cannot simply be multiplied, and how the decision should be evaluated.
15.3 Exponential Growth vs. Physical Constraints
Growth in computational demand can outpace improvements in realized efficiency. Sevilla et al. (2022) estimate that the training compute of notable machine learning models doubled roughly every six months after 2010, far faster than the two-year cadence historically associated with transistor scaling. The introduction traced this growth from AlexNet onward across seven to eight orders of magnitude (Where Training-Compute Growth Comes From); figure 1 extends the same series through Grok-3 in 2025, which carries the span to nearly nine orders of magnitude, against a fitted doubling cadence of roughly 5 months. In 2012, AlexNet required about \(4.7 \times 10^{17}\) FLOPs of training compute, whereas GPT-4-class systems in 2023 reached \(2 \times 10^{25}\), an expansion of roughly 45 million in 11 years. Larger models, longer training runs, and rising serving volume each add to that total work through a different mechanism. Energy per operation can fall while total fleet energy rises; the outcome depends on how much useful work the fleet performs and how efficiently it performs that work.
Sevilla, Jaime, Lennart Heim, Anson Ho, Tamay Besiroglu, Marius Hobbhahn, and Pablo Villalobos. 2022. “Compute Trends Across Three Eras of Machine Learning.” 2022 International Joint Conference on Neural Networks (IJCNN), 1–8. https://doi.org/10.1109/ijcnn55064.2022.9891914.
Epoch AI. 2026. Notable AI Models.
Historically, semiconductor scaling combined greater transistor density with lower switching energy. Moore’s Law described the growth in transistor count, while Dennard scaling explained how reducing dimensions and voltage together could preserve power density. Transistor count alone did not guarantee better energy efficiency. Once voltage scaling encountered leakage and other device limits, a denser chip could no longer assume proportional power savings.5 Further efficiency gains require improvements in devices, architecture, and the work performed by the application.
5 Dennard scaling: Robert Dennard observed in 1974 that smaller transistors could operate at constant power density by reducing voltage proportionally. This scaling pattern ended around 2005 when leakage current made further voltage reduction impractical. The discussion of Dennard scaling in Power and thermal envelopes drew the facility consequence, that every refresh must fit installed power and cooling. The consequence for AI sustainability is equally direct: without Dennard scaling, each process node no longer delivers proportional power savings, which pushes efficiency work toward specialized accelerators, such as GPUs and the Tensor Processing Unit (TPU), that exploit architectural parallelism rather than transistor physics alone.
At a fixed accounting boundary, energy depends on total work divided by realized work per joule. Improvements in execution efficiency reduce IT energy, and PUE then adds the facility overhead on top of that IT energy. Algorithmic changes can also reduce the work required to meet a quality target. These effects must be measured together rather than inferred from a historical compute curve.
Per-job efficiency and total demand can move in opposite directions. Fleet energy is the energy per completed job multiplied by the number of completed jobs, so a fleet forecast must state both factors, including the workload mix. Cheaper jobs can raise the job count faster than they lower the energy of each one. If energy per task falls tenfold while task volume rises a hundredfold, fleet energy rises tenfold. This rebound is a second way demand can outrun efficiency, distinct from the scaling-driven growth described at the start of the chapter. Scaling-driven growth concerns how much compute each frontier model requires as scaling laws push quality upward; rebound concerns how many tasks run once each task becomes cheaper. The mitigation strategies of section 15.9 treat rebound under its historical name, the Jevons paradox.
15.3.1 Power envelopes and the energy wall
A short training burst can trip substation breakers or overwhelm chillers even when its cumulative megawatt-hour budget is modest, whereas a month-long job on a smaller cluster may consume far more total energy while staying safely inside its power envelope. The energy account divides work by realized work per joule and applies facility overhead at the boundary, but physical infrastructure imposes a separate instantaneous power constraint: the grid connection, electrical distribution, and cooling system limit how much active fleet can operate safely at once.
The two limits obey different arithmetic (figure 2). The power limit is instantaneous. A facility cannot draw more than its grid feed (\(\FacilityPower\le \GridFeedCapacity\)), which caps the number of servers active at once (\(\PoweredServerCount\le \InformationTechnologyPower/ \ServerPower\)) regardless of how long a job runs. The energy account is cumulative, integrating average power over wall-clock time to give run energy (\(\TotalEnergy = \AveragePower\times \JobDuration\)). Exceeding electrical or thermal capacity can force power limiting, throttling, or protective shutdown. Cumulative energy instead enters the electricity and emissions accounts, which also depend on tariffs and the applicable grid emissions factors.
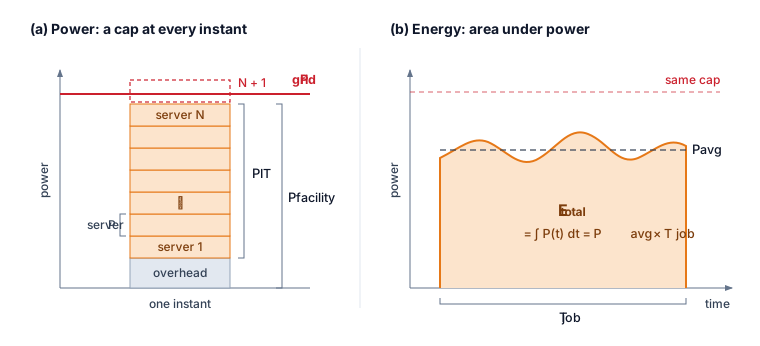
The energy wall is therefore a workload-specific feasibility problem, not a universal multiplier. Engineers must fit the required work, deadline, and quality target within available power and cooling, then calculate energy over the actual runtime. More efficient hardware helps only to the extent that the workload uses its efficiency and the resulting demand remains within those constraints; at frontier scale, the binding question is whether enough power can be delivered to the cluster at all.
Lighthouse 15.1: Archetype A (GPT-4/Llama-3): The energy wall
Training at the scale of Archetype A (GPT-4/Llama-3) exposes the power problem most sharply. At frontier scale, roughly 24 times the 1,024-GPU reference cluster used throughout this book, a single 25,000-GPU cluster drawing 700 W per chip requires 17.5 MW of accelerator power before server, network, and cooling overhead. The constraint is physical, not financial: it is a grid capacity problem. Organizations operating Archetype A workloads may need dedicated power infrastructure or regions with excess renewable energy, making carbon-aware scheduling (shifting nonurgent work toward cleaner grid hours) and geographic optimization (placing workloads where power, cooling, and carbon constraints fit the job) fleet decisions as consequential as capacity planning.
That accelerator draw alone, before server, network, and cooling overhead, makes grid capacity a condition of deployment. Even when the grid can supply that sustained average power, the synchronized execution of a training job swings the load up and down across the cluster in unison.
15.3.2 Data center grid dynamics
When thousands of accelerators enter a collective communication barrier simultaneously and then resume matrix multiplication together, their power draw steps down and up in lockstep across the data hall. Unlike conventional cloud workloads whose independent requests smooth out across racks, synchronized training phases correlate power swings and push those transients toward the electrical grid interface.
War Story 15.1: When the grid became the bottleneck (2022)
Context: In July 2022, the Government of Ireland published its Government Statement on the Role of Data Centres in Ireland’s Enterprise Strategy, addressing electricity constraints on further development in a country where data centers had become a substantial source of demand (Government of Ireland 2022; International Energy Agency 2024).
Mechanism: Demand growth outpaced grid expansion. The statement reported that Dublin needed significant transmission reinforcement before it could accommodate new data-center power requests.
Impact: Grid connection capacity became the gating input for proposed Dublin facilities. New requests had to wait for transmission reinforcement or look to other regions, while contracted projects and existing sites continued to operate.
Fix: The statement prioritized network reinforcement, suitable regional locations, and development aligned with additional renewable supply. These were proposed responses to the constraint, not evidence that operators had already resolved it.
Systems lesson: Sustainable AI is constrained by interconnection, geography, and power-system adequacy. Efficient accelerators help, but the fleet cannot scale faster than the grid that feeds it, moving the binding constraint from the chip to the substation.
International Energy Agency. 2024. Data Centre Electricity Demand Estimates as a Share of Total Electricity Demand in Ireland and Virginia, 2023. IEA chart.
Government of Ireland. 2022. Government Statement on the Role of Data Centres in Ireland’s Enterprise Strategy. Government policy statement.
Training phases can change accelerator demand rapidly, but a device-side load step does not propagate unchanged to the utility connection. Its amplitude depends on per-device power, the number of coordinated workers, and computation-communication overlap. Local regulators, decoupling, power converters, and UPS controls shape the upstream response. Energy buffering supplies or absorbs energy during a load change; its location, capacity, and control response must match the electrical boundary being protected.
15.3.3 Training-scale energy concentration
The grid and siting constraints become severe because large training campaigns concentrate energy demand into long, synchronized runs. The GPT-3 anchor established the total scale; the new systems concern is its temporal concentration and the additional energy from distributed-training communication.6
6 Training communication overhead: Distributed training adds network transfers, synchronization stalls, and checkpoint I/O to the energy account. The fraction is workload- and topology-dependent: parallelism strategy, tensor sizes, link technology, utilization loss, and any extra iterations determine whether communication is a secondary term or the binding energy cost. The measurement contract must therefore meter or model these terms for the actual run rather than apply a universal percentage.
Concentration in time is what separates a training campaign from the same energy spread across a year of ordinary load. A frontier run holds the 17.5 MW accelerator draw of the Archetype A cluster, before servers, network, and cooling, for the weeks or months the run lasts, and its synchronized computation and communication phases swing that draw together across the cluster (section 15.3.2). The facility must therefore provision for the sustained peak rather than for the annual average, and the grid sees one large, correlated load rather than many small independent ones. That concentration makes efficiency improvements an engineering imperative. Large generative models intensify the problem when successive generations increase parameter counts, token budgets, or both.
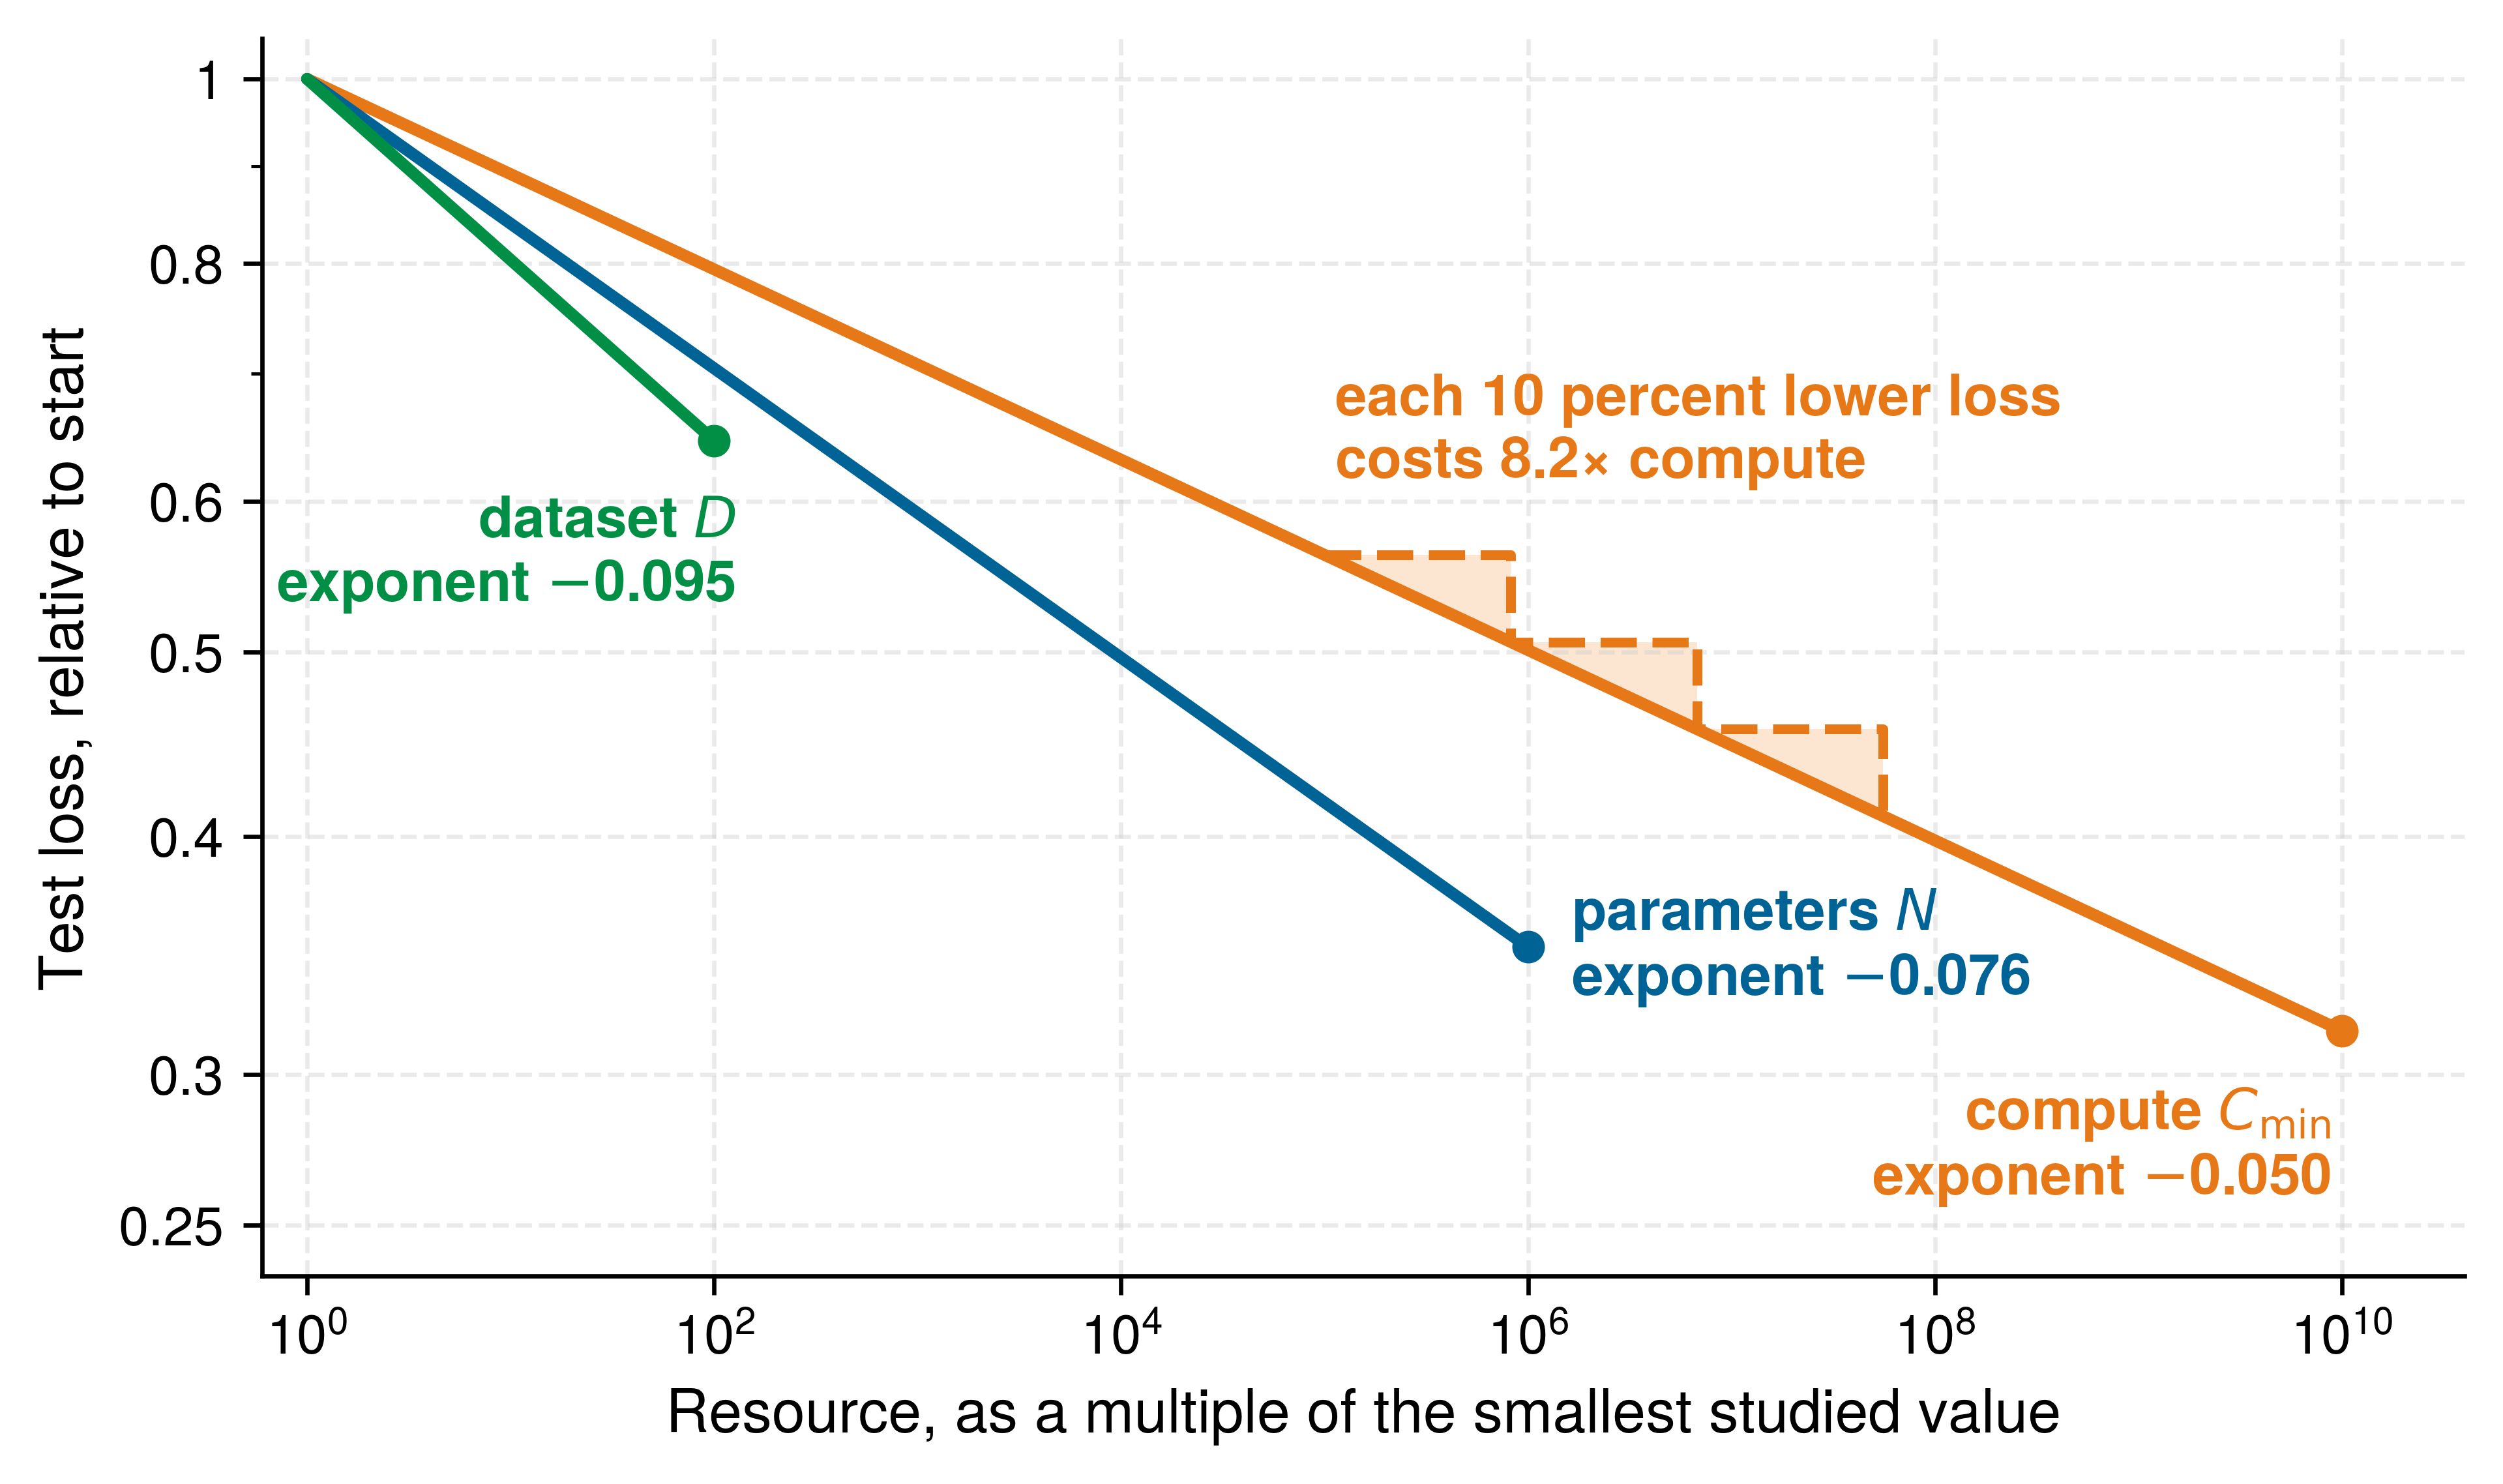
The scaling laws introduced in AI Scaling Laws explain why that concentration keeps growing. Within the ranges studied by Kaplan et al. (2020), test loss falls along smooth power laws in compute, dataset tokens, and parameters (figure 3), and for an energy account the small compute exponent is the quantity of interest. It means each fixed fractional reduction in loss costs a multiplicative increase in the resource. Because required compute scales as the loss ratio raised to the power 20, lowering compute-limited loss by 10 percent takes 8.2× the compute, and the next 10 percent costs the same multiple again. The diminishing return in principle 9 therefore arrives at the facility as a multiplicative increase in training energy unless realized FLOPs per joule improve at the same pace. Within these studied regimes, quality gains were purchasable with hardware and data, which is why compute demand has outrun hardware efficiency. Beyond training, high-volume deployed systems such as large-scale recommender systems and generative services require continuous inference at scale, consuming energy even after training completes. The cumulative energy burden therefore depends on both the one-time training run and the sustained query volume that follows deployment.
Kaplan, Jared, Sam McCandlish, Tom Henighan, Tom B. Brown, Benjamin Chess, Rewon Child, Scott Gray, Alec Radford, Jeffrey Wu, and Dario Amodei. 2020. “Scaling Laws for Neural Language Models.” ArXiv Preprint abs/2001.08361.
The production of AI chips adds emissions before the operator uses them, so expanding the fleet can add manufacturing impact even when each new device uses less energy per useful task. An operator’s inventory records that fabrication under Scope 3, the category for emissions in its supply chain rather than in its own operations or purchased electricity. Section 15.5.5 quantifies the manufacturing term, and section 15.5.2 assigns it to reporting scopes.
Self-Check: Question
An inference optimization cuts energy per task by a factor of 4, and the lower cost raises task volume by a factor of 20, with the workload mix unchanged. What happens to fleet energy?
- It falls by a factor of 4, because per-task efficiency sets fleet energy.
- It stays the same, because efficiency and demand cancel.
- It rises by a factor of 5, because fleet energy is energy per task multiplied by the number of tasks.
- It rises by a factor of 80, because the efficiency gain and the demand growth compound.
A team plans a three-day run that needs 120 MW of accelerator power at once in a facility with an 80 MW grid feed. They argue the run fits because its total energy is less than the facility uses in a month. What is wrong with the argument?
- The power limit is instantaneous, so the feed caps how many servers can be active at once regardless of run length; the plan must lower concurrency and accept a longer run, or obtain more deliverable power.
- Nothing, because over a month an energy budget and a power cap are interchangeable.
- The run fails only on cost, because energy drawn above the feed is billed at a peak tariff.
- The only error is omitting PUE; adding facility overhead would show that the run’s energy exceeds the monthly budget.
Synchronized training phases swing accelerator draw together across thousands of devices, and a battery or UPS stage that supplies or absorbs energy during each load change provides energy ____, whose location, capacity, and control response must match the electrical boundary being protected.
True or False: Because a frontier training run’s yearly energy is a modest share of a region’s consumption, the facility can be provisioned for that run’s annual-average power.
In the regime studied by Kaplan et al., each 10 percent reduction in compute-limited loss costs about 8.2 times the compute. Explain what two successive 10 percent reductions imply for training energy, and what would have to hold for energy not to grow by the same factor.
15.4 Energy Measurement and Modeling
A cluster drawing five megawatts during a large language model training run directs only a fraction of that power into matrix multiplications; host processors, memory, networking, power conversion, and cooling consume the rest. Engineers cannot optimize those losses from a single monthly utility bill: effective energy modeling requires decomposing facility power into granular, component-level metrics that engineers can target for optimization.
Power delivery networks and cooling systems establish hard physical constraints on data center compute capacity. Systematic measurement turns these constraints into numbers an engineer can act on, provided the measurement fixes what it records and which lifecycle phase it targets before any power model or instrument is applied. Just as performance engineering requires profiling before optimization, sustainable AI engineering requires measurement before mitigation.
↩︎ The power-delivery path, thermal design power, and cooling limits of accelerators are established in Power and thermal envelopes.
The decision procedure is the same throughout the chapter: measure the dominant lifecycle term, identify the physical bottleneck behind it, choose the intervention that changes that term, and check whether rebound effects erase the gain. Operational electricity, embodied carbon, cooling overhead, water use, and e-waste each call for different levers. Moving a job changes its operational setting without undoing emissions already incurred in manufacturing. Keeping hardware longer changes future procurement needs but also extends its operating energy account. Sustainable design therefore traces each intervention through the terms it changes before comparing the full result.
A sustainability claim is comparable only when it satisfies a sustainability measurement contract, which extends the reproducible measurement contract of The measurement contract. That contract already fixes the workload and its quality gate, the system state, the timing boundary, and a statistical report with its window and spread. A sustainability claim adds five fields that progressively close the remaining accounting degrees of freedom: the functional unit names the work being charged, such as one completed training run or 1,000 served requests at a specified output quality, while the system boundary states which compute, memory, network, facility, manufacturing, and end-of-life terms enter that account (International Organization for Standardization 2006a, 2006b). Because multiple workloads and hardware generations share a facility, an attribution rule must then allocate shared infrastructure and embodied emissions, a declared average or marginal carbon signal recorded with its time and location converts the resulting energy into emissions, and the statistical report extends to the sensitivity of the conclusion to those consequential assumptions. A result that omits any of these fields may still diagnose one component, but it cannot support an end-to-end comparison.
Present, Elaina, Pieter Gagnon, Eric J. H. Wilson, Noel Merket, Philip R. White, and Scott Horowitz. 2024. Choosing the Best Carbon Factor for the Job: Exploring Available Carbon Emissions Factors and the Impact of Factor Selection. NREL/CP-5500-86682. National Renewable Energy Laboratory.
This contract separates two questions that otherwise become conflated. Attributional accounting allocates an inventory of observed emissions to workloads for reporting, typically using average grid intensity and an explicit share of common infrastructure. Consequential accounting estimates how a decision changes emissions, for example by modeling the generator affected when a scheduler moves one megawatt-hour of demand. The former answers what share of an existing footprint belongs to a workload; the latter answers whether changing the workload changes the footprint (Present et al. 2024). Carbon-aware scheduling therefore needs a signal appropriate for consequential analysis even when the organization’s retrospective inventory uses attributional averages. The available marginal factors may be historical estimates, forecasts, or unavailable at the workload’s required time and location, so the contract must record the source, resolution, and uncertainty rather than treating “marginal” as a universally observable datum.
15.4.1 Power modeling fundamentals
Lowering numerical precision or pruning half the weights of a model does not automatically cut the data center’s electricity bill in half, because static leakage, memory traffic, and facility cooling each take their own share before power reaches the arithmetic units. Tracing where a watt goes requires a model that climbs three levels: the CMOS power equation at the chip level explains why voltage, precision, and switching activity matter; physical optimization mechanisms show how algorithms change those variables; and facility-level metrics reveal whether chip-level savings survive cooling and power-delivery overhead.
The CMOS power equation
Every digital circuit consumes power through two fundamental mechanisms. Dynamic power arises from switching transistors between states, while static power results from leakage current that flows even when transistors are nominally off. Equation 1 formalizes the total power consumption:
\[\TotalChipPower= \DynamicPower+ \LeakagePower = \SwitchingActivityFactor \SwitchedCapacitance \SupplyVoltage^2 \ClockFrequency+ \SupplyVoltage \LeakageCurrent \tag{1}\]
In the dynamic component \(\DynamicPower= \SwitchingActivityFactor \SwitchedCapacitance \SupplyVoltage^2 \ClockFrequency\), the switching activity factor \(\SwitchingActivityFactor\) summarizes capacitance-weighted switching per clock cycle and is not useful compute utilization, \(\SwitchedCapacitance\) is the effective load capacitance of the circuits and interconnect being switched, supply voltage \(\SupplyVoltage\) enters quadratically, and clock frequency \(\ClockFrequency\) sets the rate of switching opportunities. Useful work per joule depends on how much productive computation those transitions accomplish.
The static power component \(\LeakagePower = \SupplyVoltage\cdot \LeakageCurrent\) depends on leakage current, whose temperature sensitivity varies with device technology, voltage, and operating point. Rising temperature can increase leakage, adding heat that further raises temperature. Cooling and power control must keep this feedback within a stable operating range. A leakage model therefore needs parameters appropriate to the device rather than a universal temperature-doubling rule (Dayarathna et al. 2016).
Dayarathna, Miyuru, Yonggang Wen, and Rui Fan. 2016. “Data Center Energy Consumption Modeling: A Survey.” IEEE Communications Surveys & Tutorials 18 (1): 732–94. https://doi.org/10.1109/comst.2015.2481183.
The quadratic voltage dependence means that reducing voltage from 1 V to 0.8 V decreases dynamic power by 36 percent when activity, capacitance, and frequency stay fixed. The circuit must still complete its transitions within each clock period. A lower voltage may therefore require a lower frequency, which further reduces dynamic power but can lengthen execution. The energy benefit depends on both the resulting runtime and the static power consumed during it.
Physical mechanisms of energy optimization
The power equation illuminates why specific optimization techniques can improve efficiency. Quantization reduces numerical precision, which can shrink arithmetic units and reduce bytes moved through the memory hierarchy. The realized energy change depends on the implemented kernels, packing and conversion overhead, memory traffic, utilization, and the original bottleneck (Gholami et al. 2022). Lower precision does not by itself permit a lower supply voltage: voltage and frequency remain constrained by the physical implementation, process, and timing margins. Quantization therefore changes the operation and data-movement terms, but only measurement establishes the end-to-end reduction.
Gholami, Amir, Sehoon Kim, Zhen Dong, Zhewei Yao, Michael W. Mahoney, and Kurt Keutzer. 2022. “A Survey of Quantization Methods for Efficient Neural Network Inference.” In Low-Power Computer Vision: Improve the Efficiency of Artificial Intelligence. Chapman; Hall/CRC. https://doi.org/10.1201/9781003162810-13.
Pruning removes weights from neural networks, but it does not remove physical transistors from an existing accelerator. It saves dynamic energy when the resulting execution skips arithmetic or data movement. Structured pruning can map to smaller dense kernels; unstructured pruning needs an implementation that exploits the sparse pattern without spending the savings on indexing and irregular memory access. The power equation explains the benefit through reduced switching activity and powered execution time, not a change to the fabricated circuit capacitance \(\SwitchedCapacitance\).
Specialized accelerators can improve useful work per joule by reducing instruction-control overhead, reusing data locally, and mapping operations to suitable datapaths. Keeping arithmetic units productive can amortize static and support power, but raising switching activity without raising useful output only raises power.
Facility-level power metrics
The PUE ratio has carried every facility-energy estimate since the opening energy boundary; the chip-level model now explains what happens inside the IT term, so the ratio itself needs its precise definition and its blind spots. Equation 2 gives the ratio at this chapter’s facility boundary:
\[\text{PUE} = \frac{\FacilityPower}{\InformationTechnologyPower} \tag{2}\]
Definition 15.2: Power usage effectiveness (PUE)
Power usage effectiveness (PUE) is the data-center efficiency ratio ML system operators use to compare total facility power consumption against the power consumed specifically by IT equipment \((\FacilityPower/ \InformationTechnologyPower)\).
- Significance: It measures the infrastructure overhead of the data center. A PUE of 1.0 is the theoretical ideal; a PUE of 1.10 means that for every 100 watts consumed by IT equipment, an additional 10 watts are required for non-IT facility overhead, including cooling and facility-side power distribution.
- Distinction: Unlike computing efficiency (which focuses on FLOP/s per watt), PUE focuses on facility efficiency: it measures non-IT overhead relative to IT consumption. Idle equipment and power losses inside the IT measurement boundary remain in the denominator; PUE does not measure useful computation.
- Common pitfall: A frequent misconception is that a low PUE means a “green” data center. PUE measures only overhead efficiency, not the carbon intensity of the energy source; a coal-powered data center can have a better PUE than a solar-powered one while having a much higher environmental impact.

PUE measures facility overhead on top of IT energy.
Napkin Math 15.3: PUE: The cost of cooling
Problem: A team operates a 2 MW cluster. If the facility can be optimized from a legacy air-cooled PUE (1.58) to state-of-the-art (1.10), how much energy and money does that save annually?
Math: Energy saved is the difference in infrastructure overhead \((\text{PUE}-1)\) across the IT load.
- Overhead Reduction: 1.58 - 1.10 = 0.48.
- Annual energy savings: 2 MW \(\times\) 0.48 \(\times\) 8760 h/year \(\approx\) 8,409.6 MWh.
- Financial Savings: 8,409.6 MWh \(\times\) $70/MWh \(\approx\) $588,672. This facility-only saving leaves the model unchanged and scales with reducible non-IT overhead, so cooling optimization matters most in inefficient facilities.
A PUE of 1.0 would mean no measured non-IT overhead, not that all electricity produces useful computation. Idle servers and stalled accelerators remain inside the IT denominator. Surveyed data centers reported an average PUE near 1.55 in 2022, meaning that roughly 55 percent additional energy beyond IT consumption went to infrastructure, with older air-cooled sites higher still (Uptime Institute 2022). Leading hyperscale facilities achieve PUE between 1.1 and 1.2 through advanced cooling techniques including free-air cooling in cold climates, liquid cooling for high-density GPU clusters, and optimized power distribution.
Uptime Institute. 2022. Uptime Institute Global Data Center Survey 2022. Uptime Institute.
Equation 3 formalizes water usage effectiveness (WUE), capturing the water consumption that evaporative cooling and other processes require:
\[\text{WUE} = \frac{\FacilityWaterConsumption}{\InformationTechnologyEnergy} \tag{3}\]
The units are liters per kilowatt-hour, with typical values ranging from 0.5 to 2.0 L/kWh depending on climate and cooling technology. A data center with WUE of 1.8 L/kWh training a model requiring 10,000 MWh of IT energy would consume 18 million liters of water, equivalent to roughly 40–47 US household-years of water use under a 380,000–450,000 L/year household baseline. A facility-energy estimate must first be converted to the IT boundary before applying this WUE.
Serving has a water account too, and it is computed the same way. Google reports a fleet WUE of 1.15 L/kWh for the data centers that serve its Gemini assistant (Elsworth et al. 2025). Applied to the IT energy of the median prompt measured in section 15.7.3, which excludes facility overhead, that WUE gives the 0.26 mL of water per prompt that the study reports. A single prompt’s water is negligible; a service answering billions of prompts a day turns the same arithmetic into a facility-scale demand, which is why the cooling choice, and the watershed it draws on, belongs in the serving design rather than only in the training budget. Facility-level metrics therefore identify where engineering intervention yields the greatest returns, including in how a facility operates the cooling plant it already has.
DeepMind energy efficiency case study
Google’s cooling systems illustrate how operating settings affect PUE (2023). Server load, weather, and interactions among pumps and chillers complicate fixed operating heuristics (Buyya et al. 2010). Building on earlier work predicting PUE (Gao 2014), DeepMind trained neural networks from facility telemetry to predict future PUE and recommend settings. Additional models predicted temperature and pressure to check those recommendations against operating constraints.
Google. 2023. Power Usage Effectiveness: Google Data Centers.
Buyya, Rajkumar, Anton Beloglazov, and Jemal Abawajy. 2010. “Energy-Efficient Management of Data Center Resources for Cloud Computing: A Vision, Architectural Elements, and Open Challenges.” arXiv Preprint arXiv:1006.0308, 6–17. https://doi.org/10.48550/arXiv.1006.0308.
Gao, J. 2014. Machine Learning Applications for Data Center Optimization. Google; Google White Paper.
Barroso, Luiz André, Urs Hölzle, and Parthasarathy Ranganathan. 2019. The Datacenter as a Computer: Designing Warehouse-Scale Machines. Synthesis Lectures on Computer Architecture. Springer International Publishing. https://doi.org/10.1007/978-3-031-01761-2.
Evans, Richard, and Jim Gao. 2016. DeepMind AI Reduces Google Data Centre Cooling Bill by 40%. DeepMind Blog.
In the reported live-site test, the system reduced cooling energy consumption by 40 percent and overall PUE overhead by 15 percent (Barroso et al. 2019; Evans and Gao 2016). By equation 2, a 15 percent cut in overhead removes 15 percent of the non-IT term (PUE minus 1), not 15 percent of total facility energy. At equal IT energy, the same fractional overhead reduction saves more electricity where the initial overhead is larger. The reported result establishes a benefit for the tested facility, not an identical saving at every site.
The saving came from changing how the existing pumps, chillers, and cooling towers were operated rather than from installing new cooling equipment, which makes control software a lever available to a facility that cannot be rebuilt. The transferable lesson is to evaluate operating controls alongside equipment changes. Telemetry supports the prediction, operating limits constrain the recommendation, and metered energy establishes whether the change saves electricity.
15.4.2 Systematic energy metrics
Cutting a model’s FLOP count in half saves almost no energy when the workload spends nearly all of its joules shuttling weights between off-chip DRAM and the processor. Comparing hardware architectures and algorithmic changes therefore requires a systematic metric ladder that moves from energy per operation to energy per byte and then to the roofline relationship between arithmetic intensity and data movement.
Energy per operation
A basic metric for computational energy efficiency is energy consumed per operation, typically measured in picojoules. State the operation type and precision: a floating-point multiply-accumulate (MAC) is conventionally two FLOPs, whereas an integer MAC is two integer arithmetic operations.
Hardware architecture changes which overheads can be reduced. Each architecture class carries an effective energy coefficient in this chapter’s models, paired with the measurement needed to test it (table 1). The coefficients span three orders of magnitude, from 100 pJ/FLOP for a general-purpose core, where instruction fetch and control dominate each operation, to 0.1 pJ/FLOP for a fixed-function datapath. They fold local operand delivery and control into each operation, which is why the GPU coefficient of 10 pJ/FLOP sits well above the roughly 3.7 pJ of a bare FP32 multiply at 45 nm (Horowitz 2014). They are order-of-magnitude modeling inputs, not a ranking of products.
Horowitz, Mark. 2014. “1.1 Computing’s Energy Problem (and What We Can Do about It).” 2014 IEEE International Solid-State Circuits Conference Digest of Technical Papers (ISSCC), 10–14. https://doi.org/10.1109/isscc.2014.6757323.
| Architecture | Effective energy (model) | Potential energy advantage | Comparison must include |
|---|---|---|---|
| General-purpose CPU | 100 pJ/FLOP | Flexible execution for diverse workloads | Instruction overhead and achieved utilization |
| GPU | 10 pJ/FLOP | Parallel arithmetic and data reuse | Precision, occupancy, and memory traffic |
| Systolic accelerator | 1 pJ/FLOP | Local reuse across a regular datapath | Supported shapes, precision, and data movement |
| Edge accelerator or fixed-function ASIC | 0.1 pJ/FLOP | Specialized low-power execution | Host, memory, peripherals, and duty cycle |
| Analog or in-memory compute | Not modeled | Reduced movement for supported operations | Conversion, peripheral circuits, and achieved quality |
Precision affects energy per operation through implementation-specific arithmetic and data movement. Narrower formats can reduce circuit area, switched capacitance, and memory traffic, but bit width alone does not determine wall energy. The measurement contract requires a matched workload and quality target, with the same memory and supporting-system boundary.
Energy per byte
Data movement often dominates energy consumption in AI workloads with low arithmetic intensity. The following illustrative cost model assigns per-byte energy across storage and communication boundaries. These coefficients teach the cost of movement; they are not universal measurements of every platform:
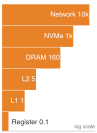
Fetching an FP32 operand from DRAM costs 64× the FLOP that uses it.
With the modeled coefficients of table 2, movement from DRAM can dominate the arithmetic it feeds. The rows trace the path from registers through L1 cache and L2 cache to DRAM, Non-Volatile Memory Express (NVMe), and network transfers. Under the GPU coefficient of 10 pJ/FLOP from table 1, accessing one FP32 operand from DRAM (4 bytes \(\times\) 160 pJ/byte = 640 pJ) costs 64× the energy of the operation that consumes it. These coefficients agree with the movement costs priced per bit in Energy cost of data movement once the units match. That section’s off-package DRAM figure of about 20 pJ per bit is this table’s 160 pJ/byte, so one 16-bit operand fetched from DRAM costs 320 pJ, where this example fetches a 4-byte FP32 operand. The bare FP16 multiply-accumulate of about 1.5 pJ quoted there sits below the effective GPU coefficient here because that coefficient folds control and local operand delivery into each operation. Transfers across the network fabric are priced per bit in The Physics of Data Movement, whose fabric-path figure of about 35 pJ/bit (280 pJ/byte) charges only the serializers, transceivers, and switches between endpoints; the network row here is a whole-system coefficient that also charges endpoint memory, host software, and idle network power, so the two differ by more than an order of magnitude.
| Memory level | Energy cost (pJ/byte) |
|---|---|
| Register | 0.1 pJ/byte |
| L1 Cache | 1 pJ/byte |
| L2 Cache | 5 pJ/byte |
| DRAM | 160 pJ/byte |
| NVMe SSD | 1000 pJ/byte |
| Network | > 10000 pJ/byte |
The resulting design levers target data movement as well as arithmetic. On-chip SRAM and registers support operand reuse, while systolic arrays pass operands and partial sums between neighboring processing elements instead of repeatedly returning to off-chip memory. Compression and sparse representations can reduce transferred data when saved payload exceeds metadata and conversion overhead. The energy benefit therefore depends on the implemented memory traffic, rather than solely on nominal model size or arithmetic throughput.
Arithmetic intensity and energy roofline
↩︎ The performance roofline and its ridge point are established in Roofline model.
Arithmetic intensity, the operations-per-byte ratio recalled in Arithmetic Intensity Boundary, connects the operation count to the data-movement volume. Combined with energy per operation and per byte, it identifies which contribution dominates this energy model; it does not by itself identify the resource limiting execution speed. Equation 4 defines the workload ratio. In these equations, \(\Operations\) is the operation count in FLOPs, \(\DataVolume\) is data volume in bytes, \(\EnergyPerOperation\) is energy per FLOP, and \(\EnergyPerByteMoved\) is energy per byte moved:
\[\ArithmeticIntensity= \frac{\Operations}{\DataVolume} \tag{4}\]
At fixed energy coefficients, arithmetic intensity measured in FLOP/byte determines the relative size of the compute and movement terms. Equation 5 expresses modeled energy \(\TotalEnergy\) at the chip-and-memory boundary as their sum (the facility total \(\FacilityEnergy\) appears later in equation 9), while equation 6 isolates the roofline-style dominant term. Static power and supporting systems require additional terms if the comparison includes them:
\[\TotalEnergy = \Operations\times \EnergyPerOperation + \DataVolume \times \EnergyPerByteMoved \tag{5}\]
\[\DominantComponentEnergy= \max\left(\Operations\times \EnergyPerOperation, \DataVolume \times \EnergyPerByteMoved\right) \tag{6}\]
The maximum identifies the larger energy contribution, not the sum. Near balance, omitting the other term substantially understates the modeled energy. Equation 7 defines the crossover arithmetic intensity where compute and memory energy balance:
\[\EnergyCrossoverIntensity= \frac{\EnergyPerByteMoved}{\EnergyPerOperation} \tag{7}\]
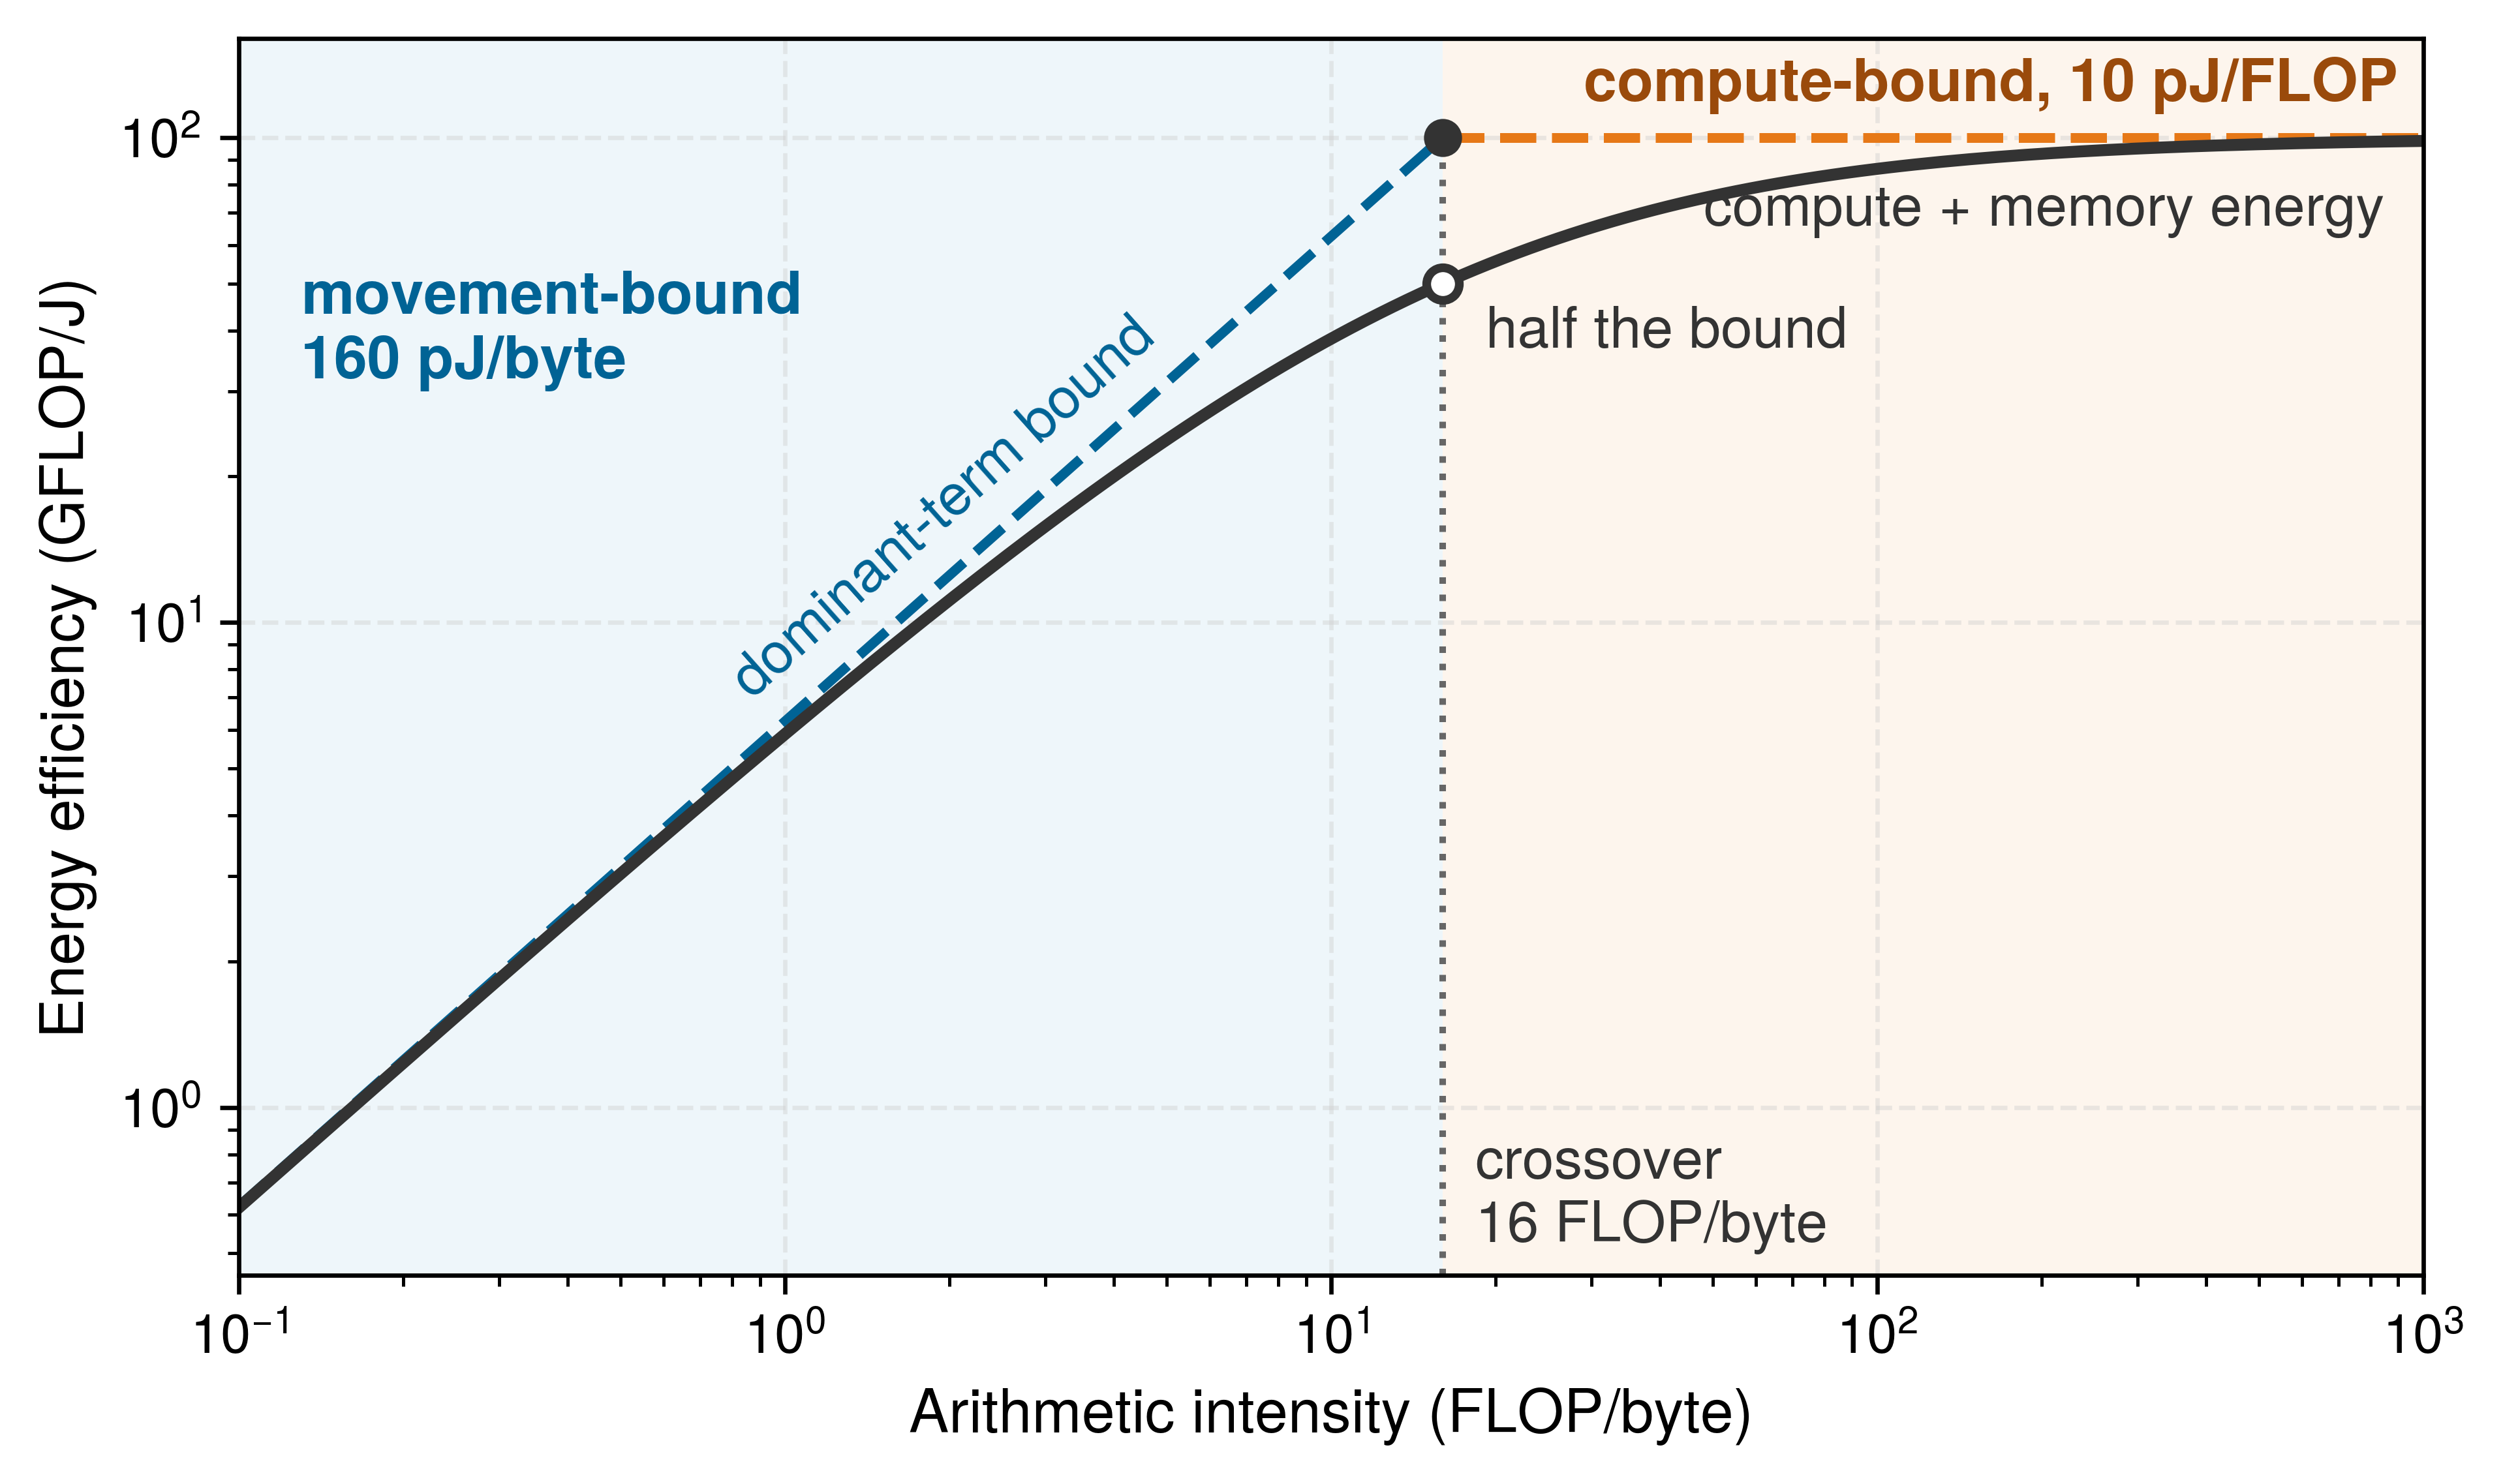
For a GPU with \(\EnergyPerOperation\) of 10 pJ/FLOP and \(\EnergyPerByteMoved\) of 160 pJ/byte (DRAM access):
\[\EnergyCrossoverIntensity = \frac{160 \text{ pJ/byte}}{10 \text{ pJ/FLOP}} = 16 \text{ FLOP/byte}\]
The energy roofline model in figure 4 bounds energy efficiency (GFLOP/J) against arithmetic intensity (FLOP/byte), with a 16 FLOP/byte crossover under the stated component costs. Below this point, the larger energy contribution is memory movement (160 pJ/byte); above it, arithmetic sets the horizontal upper bound of 100 GFLOP/J (10 pJ/FLOP). The piecewise bound keeps only the larger contribution, whereas actual energy includes both and any omitted system overhead. Its crossover therefore answers a different question from the performance ridge, which depends on peak throughput and memory bandwidth. A workload can be memory-bandwidth-bound in execution time while arithmetic contributes more of its modeled dynamic energy, and applying this crossover to matrix multiplication shows how problem dimension alone flips the dominant energy term.
Napkin Math 15.4: MatMul energy analysis
Problem: How do matrix dimensions \(\SquareGemmDimension\) dictate whether arithmetic energy \(\EnergyPerOperation\) or memory energy \(\EnergyPerByteMoved\) dominates matrix multiplication \(\GemmOutputMatrix= \GemmLeftOperand\GemmRightOperand\)?
Table 3: Energy Bottleneck Comparison: The same energy model classifies small dense work, large dense work, and element-wise work by their dominant energy term.
Math:
- Operation & byte count: \(2\SquareGemmDimension^3\) FLOPs and \(12\SquareGemmDimension^2\) bytes at FP32, assuming ideal reuse: read each input once and write the output once at the modeled memory boundary. Tiling and limited capacity can increase measured traffic.
- Arithmetic intensity: \(\ArithmeticIntensity= \frac{\SquareGemmDimension}{6}\) FLOP/byte, so the matrix sits exactly at the energy crossover when \(\SquareGemmDimension\) = 96 (\(\ArithmeticIntensity = 96/6 = 16\)), the small-matrix row below.
- Regime comparison: small dense work sits at the crossover, large dense work is dominated by arithmetic, and element-wise work by memory movement (table 3).
| Workload | Arithmetic intensity | Compute energy | Memory energy | Optimization priority |
|---|---|---|---|---|
| Small matrix (\(\SquareGemmDimension=\) 96) | \(\ArithmeticIntensity = 96/6 = 16\) FLOP/byte | \(2 \times 96^3 \times 10 \text{ pJ} = 17.69\,\MicroUnitPrefix\text{J} = 0.0177\text{ mJ}\) | \(3 \times 96^2 \times 4 \times 160 \text{ pJ} = 17.69\,\MicroUnitPrefix\text{J} = 0.0177\text{ mJ}\) | Balanced at the crossover |
| Large matrix (\(\SquareGemmDimension = 1000\)) | \(\ArithmeticIntensity = 1000/6 = 167\) FLOP/byte | \(2 \times 10^9 \times 10 \text{ pJ} = 20\text{ mJ}\) | \(3 \times 10^6 \times 4 \times 160 \text{ pJ} = 1.92\text{ mJ}\) | Improve compute efficiency |
| Vector addition (\(\VectorElementCount= 1000\)) | \(\ArithmeticIntensity = 1000/12000 = 0.083\) FLOP/byte | \(1000 \times 10 \text{ pJ} = 0.00001\text{ mJ}\) | \(12000 \times 160 \text{ pJ} = 0.00192\text{ mJ}\) | Reduce data movement through fusion |
Systems insight: Energy optimization follows the same bottleneck logic as latency optimization. Dense matrix multiply rewards efficient arithmetic; element-wise work rewards reducing memory movement.
The energy roofline model reveals why different optimization strategies suit different workloads. When arithmetic dominates the energy account, large dense matrix operations benefit from lower energy per executed operation. When data movement dominates, element-wise kernels benefit from data layout optimization, kernel fusion to reduce memory round-trips, and on-chip memory utilization. Faster execution alone does not establish either saving; average power and execution time must be measured together. This framework guides architectural and algorithmic choices for sustainable AI system design.
15.4.3 Energy measurement techniques
Reading nvidia-smi during a training step misses host DRAM, NVMe storage, network switches, and chiller pumps, whereas reading the substation utility meter lumps every co-located job into a single total. Quantifying AI system energy consumption therefore requires choosing measurement instruments across multiple levels of the hardware stack: on-chip counters provide fine attribution, mobile profilers expose platform-specific subsystems, external edge instruments capture duty-cycle behavior, and system-level tools connect component measurements to the facility overhead that device counters miss.
Hardware power counters
Modern processors expose manufacturer-provided power telemetry that software can query through device interfaces. These counters provide workload-correlated estimates within the rails and sampling windows the device reports; they are not universal ground truth for wall-plug energy, and their update rate, calibration, and component coverage vary by platform. External instruments remain necessary when a comparison requires traceable total energy or finer temporal resolution.
Intel’s running average power limit (RAPL) interface exposes cumulative energy counters for supported power domains, with coverage depending on the processor. A controlled measurement samples the relevant counter before and after the workload and divides the energy delta by elapsed time to recover average power. This makes RAPL useful for host-side work, provided the account identifies the domains actually reported and handles counter rollover. Package and subdomain counters must not be added when their coverage overlaps. RAPL does not measure discrete GPU energy, and access can require elevated permissions.
NVIDIA GPUs expose power information through the NVIDIA Management Library, accessible via the nvidia-smi command-line tool or programmatic bindings. GPU power monitoring must distinguish an instantaneous reading from a sensor-averaged value; the reported behavior depends on the device and query. Integrating samples requires a cadence and workload interval appropriate to that averaging window. Sampling an averaged signal more frequently does not recover short power spikes. Supported accumulated-energy counters can simplify interval accounting, but their scope and resolution still need checking, and neither method supplies full facility energy by itself.
Edge devices and microcontrollers often lack built-in power counters and require external instrumentation. Select current range, voltage measurement, sampling rate, and analog bandwidth to capture the workload’s active and sleep intervals. Board-level monitors can integrate inference energy; resolving shorter events requires adequate instrument bandwidth and careful treatment of filtering and aliasing. A fast sample rate alone cannot attribute energy to individual operations.
Mobile platform energy profiling
On mobile platforms, measurement depends on how much subsystem attribution the host operating system exposes. Some platforms report per-rail or per-component power for the CPU, GPU, neural processing unit, and radio, which lets a developer see which subsystem dominates total draw. Others expose only relative energy-impact scores or thermal states, which are useful for spotting regressions during development but cannot support an absolute energy claim. Vendor profilers that correlate power traces with kernel execution sit between these extremes. The design question is therefore not which tool to use but whether the reported quantity covers the electrical boundary the comparison needs; a relative score cannot be converted into joules per inference. When it cannot, external instrumentation is required. Edge power measurement instruments differ by measurement role, and each role requires its own checks (table 4).
| Instrument class | Measurement role | Required checks |
|---|---|---|
| Board current monitor | Integrate energy on selected rails | Voltage, sample interval, shunt losses, and event duration |
| Multi-rail monitor | Attribute energy among components | Channel synchronization and coverage |
| Wide-range external analyzer | Capture sleep and active intervals | Bandwidth, range transitions, and calibration |
| Automated power analyzer | Repeat duty-cycle and battery tests | Triggering, integration window, and supply behavior |
Edge measurement methodology
Edge energy measurements are useful only when they reflect the deployed duty cycle rather than an idealized active-only inference burst, so reproducible evaluation requires experimental controls matched to that workload. Simultaneous current and voltage logging must span both the active and quiescent states being measured to capture rail voltage fluctuations rather than inferring power from current alone, while thermal and frequency stabilization is necessary for sustained-load comparisons even as cold starts and periodic bursts must be measured across their actual state transitions. Because edge devices spend most of their deployment life waiting between events, realistic duty-cycle accounting records both peak inference draw and time-averaged power across typical idle intervals, and while component attribution may isolate or subtract peripheral loads to expose accelerator consumption, a deployment estimate must restore the radios, sensors, and other subsystems needed to deliver the service. For duty cycle accounting, equation 8 expresses this relationship between active and idle power:
\[\AveragePower= \ActiveInferencePower\times \InferenceDutyCycle + \StandbyPower\times (1 - \InferenceDutyCycle) \tag{8}\]
where \(\InferenceDutyCycle\) is the duty cycle (fraction of time performing inference).
System-level energy profiling
Comprehensive energy accounting requires combining chip-level measurements with infrastructure overhead. The component terms must be disjoint: GPU-board telemetry that already includes device memory must not be added to another measurement of that same memory. They must also cover the IT boundary, with storage and server support loads included in the relevant measured terms. Equation 9 formalizes total energy as the sum of those component contributions scaled by facility overhead:
\[\FacilityEnergy= (\CpuEnergy+ \GpuEnergy+ \MemorySubsystemEnergy+ \NetworkEnergy) \times \text{PUE} \tag{9}\]
No single counter spans the full energy path, so system-level profilers like Intel VTune, NVIDIA Nsight Systems, and open-source tools such as PowerJoular aggregate measurements across components. On-chip counters estimate device power and may differ in sampling rate, coverage, and calibration; a rack power distribution unit (PDU) provides an independent measurement of the downstream IT load. A rack PDU does not measure central chillers, pumps, lighting, or upstream conversion losses, so facility energy must instead come from facility meters or from an explicitly time-matched PUE applied to the measured IT load. The same rule holds for power: facility power is the measured IT power, the sum of server, network, and storage equipment power, multiplied by the PUE of equation 2, so the overhead enters once at the facility boundary.
Development-time carbon tracking matters when it feeds placement and complexity decisions rather than becoming a report after the fact. Tools such as CarbonTracker (Anthony et al. 2020) and CodeCarbon (Schmidt et al. 2021) wrap the workload boundary, estimate energy from hardware counters or utilization models, attach the local grid intensity, and record the resulting emissions alongside the experiment metadata. The important systems pattern is not the API call but the timing of the measurement: the estimate must appear while model size, training duration, region, and schedule are still adjustable, before the run has already consumed its energy. Even then, facility energy is still not a complete footprint, because converting it to emissions requires a grid factor and the hardware that drew it carries manufacturing emissions that no power meter records.
Anthony, L. F. W., B. Kanding, and R. Selvan. 2020. Carbontracker: Tracking and Predicting the Carbon Footprint of Training Deep Learning Models. ICML Workshop on Challenges in Deploying and monitoring Machine Learning Systems.
Self-Check: Question
An attention kernel has an arithmetic intensity of 3 FLOP/byte. An illustrative chip-and-memory energy model assigns 10 pJ per FLOP and 160 pJ per byte moved from DRAM, excluding static and facility energy. Which intervention directly targets the larger modeled energy contribution?
- Replacing the accelerator with one offering double the peak TFLOP/s while retaining the same memory bandwidth and memory technology.
- Increasing arithmetic precision from FP16 to FP32 to execute more FLOPs per memory transaction.
- Fusing normalization and attention operators and tiling intermediate activations to keep data in on-chip SRAM, reducing DRAM traffic.
- Lowering facility PUE from 1.5 to 1.1 to eliminate memory stall cycles.
A 2 MW IT load cluster improves its Power Usage Effectiveness (PUE) from 1.58 to 1.10 without altering any model weights or server SKUs. Calculate the annual electricity savings in megawatt-hours (MWh) assuming 24/7 continuous operation, and explain why facility optimization is considered a first-order sustainability lever.
In the CMOS dynamic power equation \(P_{\text{dynamic}}=\alpha_{\text{sw}}CV^2f\), the parameter \(\alpha_{\text{sw}}\) is the
____, summarizing capacitance-weighted switching per clock cycle under the chosen counting convention.An engineer needs to profile the energy consumption of a sub-watt microcontroller executing an on-device wake-word detection model that spends 98 percent of its time in deep sleep drawing 30 \(\mu\text{W}\). The microcontroller lacks on-chip energy counters. Which measurement approach is appropriate?
- Sampling the Linux RAPL interface at 100 Hz to capture CPU package power states.
- Querying NVML/nvidia-smi programmatic bindings to integrate instantaneous milliwatt metrics.
- Multiplying model parameter count by a theoretical constant of 5 pJ per parameter.
- Using a calibrated external analyzer with verified current range, analog bandwidth, synchronized voltage measurement, and integration windows covering sleep, active execution, and transitions.
True or False: To determine the total environmental energy impact of an AI workload, an engineering team can simply sum the measured energy of the GPUs, CPUs, DRAM, and network interface cards reported by hardware telemetry.
Explain how the Energy-Delay Product (\(\text{EDP} = E \times t\)) guides operating point selection in TinyML systems, and identify how voltage scaling interacts with clock frequency to minimize EDP.
15.5 Carbon Footprint Calculation
Consider a data center supplied by a hydro-heavy grid. Its operational carbon intensity can be far below a fossil-heavy grid, but hydroelectric generation is not lifecycle-zero, and the AI system is not carbon-free. Reservoir construction and operation have impacts, while mining the silicon, manufacturing the GPUs, and pouring the concrete for the data center emitted carbon before the servers were turned on. A complete footprint calculation must account for operational electricity, embodied carbon, and the ecological effects excluded from a carbon-only metric.
Building that footprint term by term starts with which lifecycle phase dominates the workload and then with whose inventory each emission belongs to, because the same physical emission can appear in more than one organization’s report. The grid factor, operational carbon, embodied carbon, and their lifecycle sum then each take an equation that generalizes across workloads, grids, and amortization assumptions.
15.5.1 Carbon accountability and lifecycle phases
Published estimates of the energy of a single chat prompt vary by about an order of magnitude because different studies count different components of the serving stack (Elsworth et al. 2025), and best-effort estimates stripped of their assumptions quickly circulate as facts (Luccioni et al. 2025). Without a workload-level accounting model that fixes those boundaries, teams cannot audit whether choosing a smaller model, lower-power hardware, a cleaner region, or deferred training actually reduces environmental impact.
Luccioni, Sasha, Boris Gamazaychikov, Theo Alves da Costa, and Emma Strubell. 2025. “Misinformation by Omission: The Need for More Environmental Transparency in AI.” arXiv Preprint arXiv:2506.15572.
Schwartz, Roy, Jesse Dodge, Noah A. Smith, and Oren Etzioni. 2020. “Green AI.” Communications of the ACM 63 (12): 54–63. https://doi.org/10.1145/3381831.
Carbon footprint analysis turns sustainability from a general obligation into an auditable design constraint by linking energy consumption, grid carbon intensity, and lifecycle resource demands to the same decisions that govern performance and efficiency (Schwartz et al. 2020; Patterson et al. 2021). Traceability is the technical bridge between measurement and accountability, and it is the engineering response to a transparency gap: the absence of per-model energy, carbon, and water records that would let anyone outside the team check a claim. A team should be able to connect a model version, training run, serving workload, region, energy source, and lifecycle estimate well enough that carbon and water claims can be verified.
For measurement to constrain design, reported metrics must expose workload-level cost rather than aggregate cloud-scale claims, which stay opaque when reporting holds at the company-total level. The production measurement in section 15.7.3 shows how far the boundary alone moves a reported figure. The practical standard is therefore accountability for resource usage across the full AI lifecycle, and it requires the same evidence chain used for latency, accuracy, and reliability: a claim should connect to logs, meters, model versions, and deployment decisions rather than to aggregate sustainability pledges alone. The footprint calculation makes that evidence chain explicit by combining workload energy, facility PUE, grid carbon intensity, and embodied carbon, and it starts from the lifecycle phase that dominates.
Three-phase lifecycle assessment framework
The practical question is which lifecycle phase dominates a given workload, because the answer determines the optimization lever. Effective carbon footprint measurement therefore separates three phases that collectively determine environmental impact: training, inference, and the manufacturing of the hardware both run on. Two other groupings appear later in the chapter, the reporting scopes of section 15.5.2 and the lifecycle stages of section 15.8. Both regroup these same emissions, by reporting organization and by time, rather than adding new ones; table 5 maps the three groupings onto one another.
For training-centric research workloads, the training phase often dominates operational emissions because mathematical optimization requires sustained parallel computation,7 and geographic placement then changes the operational result because an identical workload can encounter very different grid intensities.8 For high-volume production services, by contrast, the inference phase can dominate lifetime emissions because serving repeats continuously after training ends, so its cumulative impact scales with deployment breadth and usage frequency.
7 Optimizer memory as energy cost: Adaptive Moment Estimation (Adam) stores per-parameter first and second moment estimates, unlike plain stochastic gradient descent (SGD). For a 70B model in FP32, these two moment buffers total about 560 GB, bringing parameters plus moments to about 840 GB (excluding gradients). The sustainability implication is direct: larger optimizer state means more off-chip memory traffic per training step, and at roughly 160 pJ/byte for a DRAM access, memory movement can dominate the energy budget of parameter updates.
8 Carbon intensity variance: Regional averages and time-varying grid factors answer different questions. A generation technology’s lifecycle factor is neither a measured regional average nor the marginal emissions response to another job. Scheduling must choose the signal appropriate to its decision and retain the source, period, and boundary.
9 Embodied carbon break-even: Embodied carbon covers manufacturing, transport, and end-of-life treatment rather than use. Allocating NVIDIA’s HGX H100 baseboard product carbon footprint evenly across its eight GPUs gives roughly 164 kg CO2e per H100 (NVIDIA Corporation 2025); assuming continuous accelerator power of 700 W on the average U.S. grid, the modeled operational emissions match that allocation in roughly three to four weeks. This comparison omits host and facility overhead and uses rated power rather than a measured workload trace. A cleaner grid lengthens the modeled interval, but this equality alone does not decide whether replacing hardware reduces future emissions.
NVIDIA Corporation. 2025. Product Carbon Footprint Summary for NVIDIA HGX H100. NVIDIA Datasheet.
The manufacturing phase contributes embodied carbon from hardware production, including material extraction, semiconductor fabrication, and supply chain logistics.9 For a fixed manufacturing footprint, longer operation on a carbon-intensive grid increases operational emissions and lowers the embodied share of the total. Cleaner electricity or less operating time raises that relative share without changing the manufacturing emissions already incurred. Operational efficiency does not undo those emissions; procurement, design, reuse, and service-life decisions determine future embodied costs.
15.5.2 Emission scopes and the development boundary
When an AI organization rents a cloud GPU cluster, the electricity that powers the run appears on the cloud provider’s utility bill, the chip fabrication emissions appear in the foundry’s inventory, and neither registers as direct fuel or electricity on the renter’s own meters. Whereas the training, inference, and manufacturing account groups emissions by the physical activity that produces them, the three emission scopes defined by the Greenhouse Gas (GHG) Protocol (World Resources Institute and World Business Council for Sustainable Development 2023) classify that same footprint relative to a reporting organization. These are different views of the same emissions, not additional totals to add together, and connecting the workload account to an organizational inventory requires naming who owns the equipment, purchases the electricity, and buys the service.
Within an owned data-center facility boundary, Scope 1 emissions include direct combustion in owned generators and refrigerant leakage from cooling equipment, whereas purchased electricity used to run cooling or IT equipment belongs in Scope 2, not Scope 1. Scope 2 emissions represent indirect emissions from purchased electricity, steam, heat, and cooling consumed by the reporting organization. Purchased electricity is often the dominant category for an operator’s owned facility, and it varies dramatically by geographic location and grid energy mix. Electricity used by a cloud provider is Scope 2 for that provider, but a customer’s purchased cloud service is generally accounted for in the customer’s Scope 3 value chain. The physical electrons do not change; the reporting boundary does. The geography notebook in section 15.2 uses a declared pair of illustrative factors; actual accounting requires factors matched to the location, time, and method.
Scope 3 emissions constitute the most complex category, encompassing hardware manufacturing, cloud supply chains, transportation, disposal, and downstream use. Semiconductor manufacturing is carbon-intensive.10 The manufacturer reports the same fabrication emissions inside its own organizational boundary, so the two inventories describe one physical emission from two sides. How long operation takes to match that embodied term depends on how hard and on which grid the hardware runs; the H100 break-even worked with the lifecycle phases (section 15.5.1.1) stretches from a few weeks at rated power on the US-average grid to months or years at low utilization or on a clean grid. Under company-wide or value-chain AI accounting, Scope 3 can dominate even when Scope 2 dominates a single owned facility’s operational footprint.
10 Lithography and embodied energy: Advanced semiconductor fabrication can use energy-intensive lithography, including extreme ultraviolet (EUV) processes. Emissions per usable chip depend on the process sequence, facility energy mix, yield, die area, and allocation method. Neither transistor count nor a nominal process-node label alone determines the number of exposure steps or manufacturing footprint.
11 Edge AI energy trade-off: Edge inference can reduce network transfers and response latency, while distributing computation across devices with different duty cycles and power states. It does not eliminate network or cloud work, and distributed consumption, although harder to attribute, remains part of the accounting boundary; section 15.7.4 works through the comparison.
Downstream use can also enter Scope 3, including end-user smartphones, IoT devices, and edge computing.11 Companywide totals do not by themselves identify the footprint of a particular AI service; that attribution still requires workload-level accounting.
The operational emissions of a final training run and its deployed service omit the development that produced them, including failed experiments, hyperparameter searches, and the build and test infrastructure. Repeated experiments can exceed the cost of the final run. A search that trains \(\SweepCandidateCount\) candidates at a fraction \(\SweepCandidateCostFraction\) of the final run’s cost adds \(\SweepCandidateCount \SweepCandidateCostFraction\) final-run equivalents before the chosen model starts, so a sweep of 50 candidates at 10 percent of full scale costs 5× the run that gets reported. Continuous integration, compilation, and evaluation add further work whose contribution depends on run frequency and scale. The development boundary must record these activities before assigning their emissions to the reporting organization’s inventory; the phase of model development does not itself determine the emissions scope.
The GHG Protocol arranges these scopes as concentric reporting boundaries that widen outward from the operator’s direct control (figure 5). On-site diesel generators sit in Scope 1, purchased grid electricity for compute and cooling in Scope 2, and upstream semiconductor fabrication and end-of-life recycling in Scope 3.
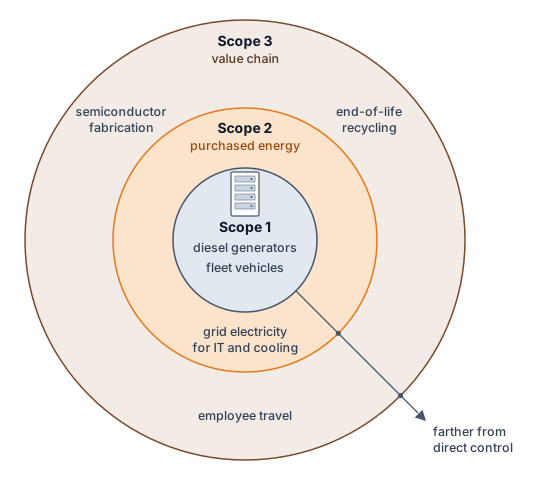
World Resources Institute, and World Business Council for Sustainable Development. 2023. Greenhouse Gas Protocol: Corporate Standard.
With the scopes and the development boundary defined, the activity phases of section 15.5.1.1, the lifecycle stages of section 15.8, and the scopes can be laid side by side (table 5). Each row is one set of emissions seen three ways, so a total built from one column must never be added to a total built from another.
| Activity phase | Lifecycle stage | Scope for an owner-operator | Scope for a cloud customer |
|---|---|---|---|
| Training (development runs and the final run) | Design and experimentation; use | Scope 2 for purchased electricity; Scope 1 for on-site generation | Scope 3 (purchased service) |
| Inference (serving) | Use | Scope 2 for purchased electricity; Scope 1 for on-site generation | Scope 3 (purchased service) |
| Manufacturing (embodied carbon) | Manufacture; disposal | Scope 3 (capital goods and end-of-life treatment) | Scope 3 (within the purchased service) |
Categorizing these emissions into Scope 1, 2, and 3 frameworks provides a standardized vocabulary for corporate environmental reporting. Correctly applying this framework in practice requires classifying the various hidden emission sources across a typical ML platform’s operational lifecycle.
Checkpoint 15.2: Accounting for invisible carbon
Audit the carbon footprint of a machine learning platform by classifying the following emission sources into Scope 1 (Direct), Scope 2 (Indirect Energy), or Scope 3 (Value Chain). State the reporting organization before assigning each scope:
15.5.3 Grid carbon intensity and regional variation
Two reports can price the exact same megawatt-hour of data-center electricity at carbon intensities that differ several-fold simply by choosing a different emissions factor or boundary. Generation-technology lifecycle factors include fuel supply, construction, operation, and decommissioning, whereas regional grid factors reflect an electricity mix over a stated place and period and may exclude upstream lifecycle emissions. Each type of factor must be identified before it enters the calculation (table 6).
| Factor | What it describes | Appropriate use |
|---|---|---|
| Generation lifecycle | Emissions across the lifecycle of an electricity technology | Comparing generation options under consistent lifecycle assumptions |
| Grid average | Emissions attributed to an electricity mix over a place and period | Attributing workload electricity emissions with a declared operational or lifecycle boundary |
| Grid marginal | Estimated change in emissions when demand changes | Evaluating a proposed shift or reduction in electricity demand |
For its 2024 data centers, Google reports a location-based grid factor of 345 g CO2e/kWh and a market-based factor of 94 g CO2e/kWh after crediting its purchases of carbon-free electricity, a 3.7× difference for the same electricity (Elsworth et al. 2025). The same median prompt therefore carries about 0.08 g CO2e or 0.023 g CO2e of electricity emissions depending on the factor, and only the second matches the figure the company publishes. Neither is wrong, but a comparison is meaningful only when both sides declare the same factor type, period, and boundary.
Applied to a fixed 10,000 MWh facility-energy account, regional electricity factors change operational carbon by nearly two orders of magnitude (figure 6). The assumed factors range from 10 g/kWh for Norway (100 t \(\text{CO}_2\) for the workload) to 820 g/kWh for Poland (8,200 t \(\text{CO}_2\)), producing a calculated 82× emissions ratio. These rounded annual-average factors (International Energy Agency 2023), the same ones notebook 15.2 used for Quebec and Poland, illustrate the effect of placement while holding facility energy constant; they are not measurements of the same job run at every site. Actual placement decisions require time-matched grid evidence and must include changes in facility overhead and the energy needed to move or resume the work.
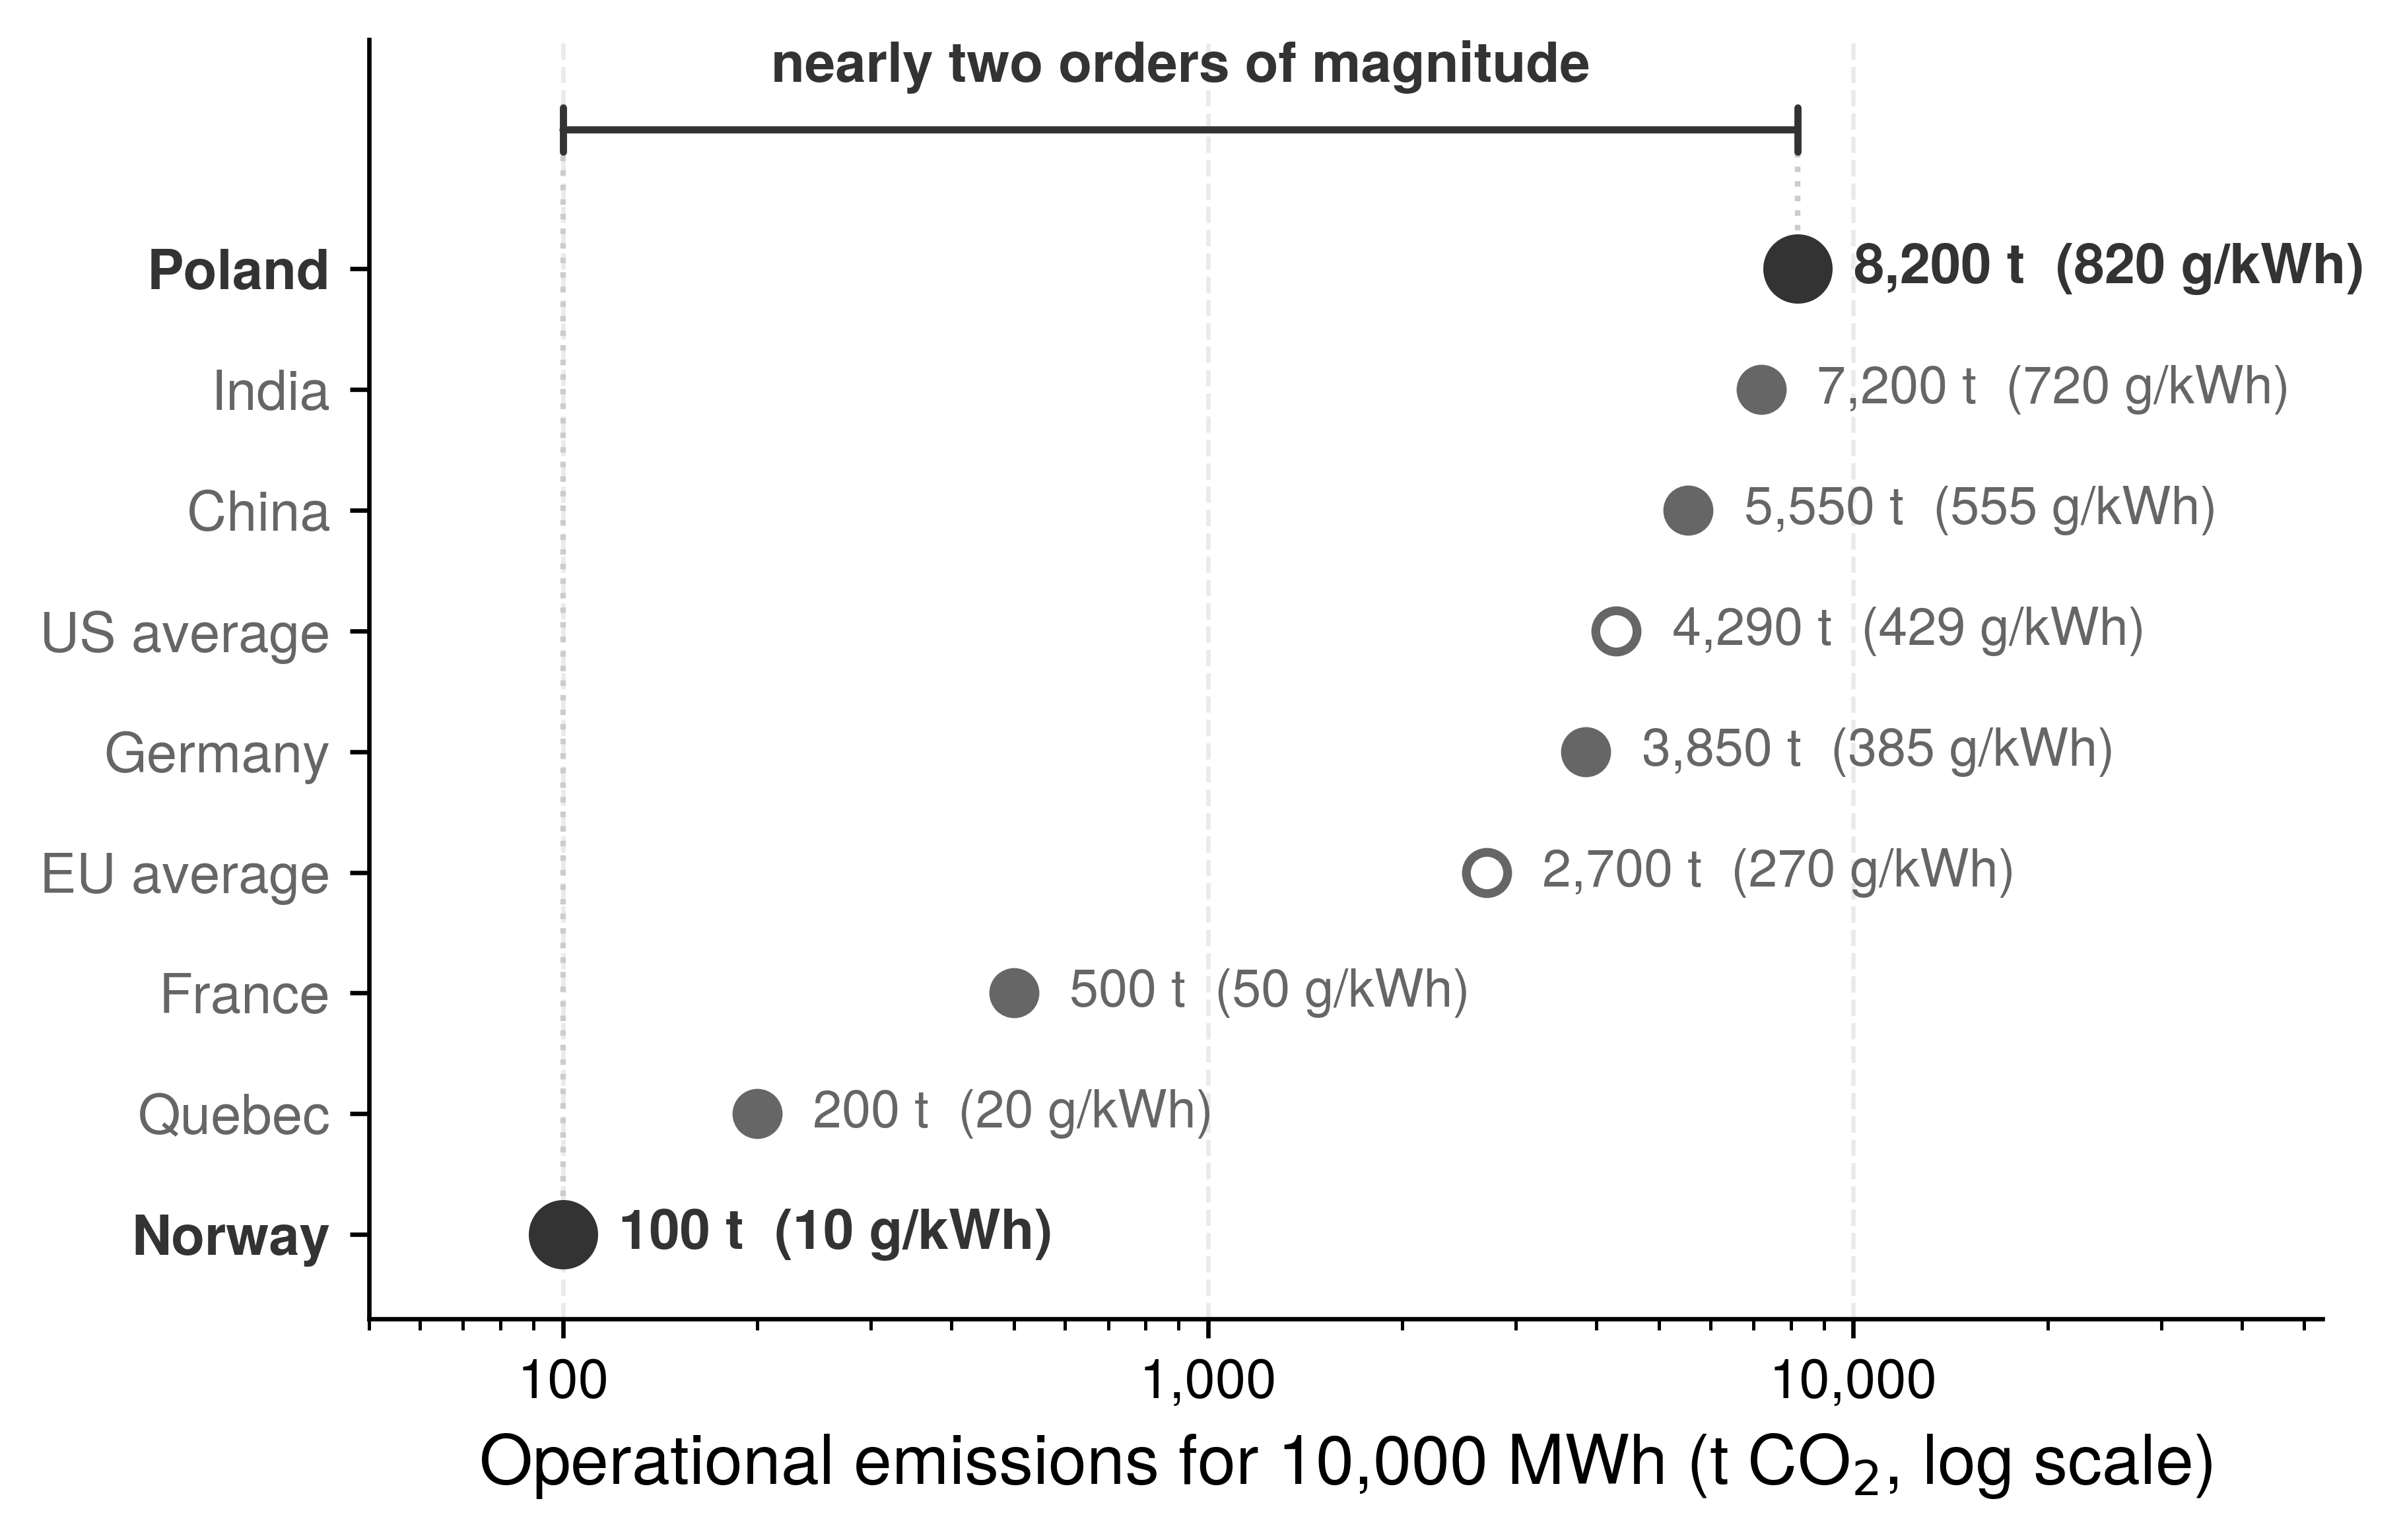
International Energy Agency. 2023. World Energy Outlook 2023. IEA. https://doi.org/10.1787/827374a6-en.
15.5.4 Operational carbon calculation
Multiplying raw GPU thermal design power by runtime and a regional grid factor understates a job’s operational carbon when it omits host servers and chiller power, or overstates it if facility overhead is accidentally applied a second time. Equation 10 computes operational carbon from the facility-level energy \(\FacilityEnergy\) of equation 9, which already includes IT support and \(\text{PUE}\) once, scaled by the electricity grid’s carbon intensity \(\text{CO}_{2,\text{grid}}\):
\[\text{CO}_{2,\text{operational}} = \FacilityEnergy\times \text{CO}_{2,\text{grid}} \tag{10}\]
Applied to a mid-scale training run, the equation separates the facility energy from the grid factor that converts it into emissions. The worked account below builds that facility energy step by step from accelerator draw, rack support, and PUE before comparing the resulting emissions across two regional grids.
Napkin Math 15.5: Training emissions calculation
Problem: Quantify the operational carbon footprint of training a 7B parameter model on 64 A100 GPUs for 14 days, assuming continuous accelerator draw at the rated power and the stated rack-support and facility overheads.
Math:
- Compute energy: 64 GPUs \(\times\) 400 W \(\times\) 336 hours = 8,601.6 kWh.
- Apply IT support and PUE: host processors, memory, and networking add to the accelerator load. This calculation borrows the ratio of IT power to accelerator power from the DGX H100 rack profile itemized later in table 7, a modeling proxy for an A100 server’s support load rather than a measurement of it, which scales accelerator energy by 1.38 to 11,827.2 kWh, so total facility energy = 11,827.2 kWh \(\times\) 1.12 = 13,246.5 kWh.
- Calculate emissions: On US average grid (429 g/kWh \(\text{CO}_2\)), emissions = 5.7 t. On Quebec hydro grid (20 g/kWh), emissions = 264.9 kg.
Systems insight: The grid factor alone produces a 21.5× difference in training emissions for this pairing, the same placement lever quantified in notebook 15.2. The model architecture is unchanged.
15.5.5 Embodied carbon assessment
The training-emissions notebook priced electricity only. At the same energy use, a lower grid emissions factor reduces operational carbon and increases the relative importance of chip fabrication and data center construction. For that same A100 run, the amortized manufacturing share derived at the end of this section is about 1.6 percent of total emissions on the US-average grid but about 25.8 percent on Quebec’s grid. Whether embodied carbon becomes the largest term depends on the manufacturing footprint, utilization, and service life, so those quantities must enter the comparison before an engineer can choose between reducing electricity use and extending hardware service.
Embodied carbon encompasses emissions from raw material extraction, semiconductor fabrication, assembly, transportation, and end-of-life disposal. For AI hardware, manufacturing emissions are dominated by the energy-intensive nature of advanced semiconductor processes: an NVIDIA A100 GPU carries an embodied footprint of approximately 150 kg CO2e per unit (Luccioni et al. 2023), and NVIDIA’s HGX H100 product carbon footprint implies roughly 164 kg CO2e per H100 when the baseboard footprint is allocated evenly across its eight GPUs (NVIDIA Corporation 2025), including wafer fabrication at advanced process nodes, high-bandwidth memory production, and packaging. Equation 11 amortizes this embodied carbon over the hardware lifetime to compute per-use emissions:
\[\text{CO}_{2,\text{embodied,daily}} = \frac{\text{CO}_{2,\text{manufacturing}}}{\HardwareServiceLife\times 365} \tag{11}\] with \(\HardwareServiceLife\) in years.
The manufacturing emissions have already occurred when the hardware enters service. Amortization allocates that burden over time; it does not describe additional manufacturing emissions accumulating each day. Utilization and service life determine how much useful work shares the initial burden.
Systems Perspective 15.1: Embodied carbon amortization
Renting a GPU for an hour uses hardware whose manufacturing emissions have already occurred. The workload account allocates a share of those emissions to the rental interval, regardless of whether the monetary fee explicitly prices carbon.
Expressing equation 11 per hour and multiplying by the job’s duration makes that allocation explicit: \[\text{CO}_{2,\text{total}} = \text{CO}_{2,\text{operational}} + \left( \frac{\text{CO}_{2,\text{manufacturing}}}{\HardwareServiceLife \times 365 \times 24} \times \JobDuration \right)\] with \(\HardwareServiceLife\) in years and \(\JobDuration\) in hours.
Scenario: Training a model for 10 hours on 8 NVIDIA H100s. This accelerator-only illustration uses thermal design power (TDP) as a constant-power assumption and excludes host, network, and facility energy. Its embodied share uses the allocated baseboard footprint; it is not a complete fleet lifecycle inventory.
- Operational: 8 \(\times\) 0.7 kW \(\times\) 10 hours = 56 kWh. At 0.429 kg/kWh (US-average grid) = 24 kg.
- Embodied: 8 \(\times\) 164 kg = 1312 kg.
- Amortization: Lifetime = 3 years, the standard service life (26280 hours).
- Hourly “Rent” = 1312 kg / 26280 hours \(\approx\) 0.050 kg/h.
- Job Cost = 0.050 kg/h \(\times\) 10 hours = 0.5 kg.
Systems insight: For long-lived hardware in dirty grids, electricity dominates (24 kg vs. 0.5 kg). However, in clean grids (hydro, 0.020 kg/kWh), operational drops to 1.1 kg, making embodied carbon a significant fraction (~30.8 percent) of the total footprint.
The perspective’s H100 job, like the lifecycle notebook later in this chapter, amortizes over the 3-year standard service life, whereas the A100 recap that follows keeps its own setup’s 4-year extended life, which spreads the same manufacturing carbon over more service. For an accelerator with 150 kg embodied carbon (the A100 estimate cited earlier) and that 4-year data center lifetime, the first step is daily amortization: 150 kg / (4 years \(\times\) 365 d/year) \(\approx\) 0.103 kg/day. The second step assigns that daily share to the job: a training run lasting 14 days on 64 accelerators carries 64 \(\times\) 14 days \(\times\) 0.103 kg \(\approx\) 92.1 kg CO2 of amortized embodied carbon.
Added to the 5,682.7 kg of operational emissions calculated earlier for the US average grid, the embodied contribution of 92.1 kg is approximately 1.6 percent of the run’s total emissions. If training occurred in Quebec’s low-carbon grid, where the same run produced 264.9 kg of operational emissions, the same embodied contribution would be about 25.8 percent of the total. The manufacturing term did not change; the cleaner grid shrank everything around it.
15.5.6 Lifecycle carbon accounting
Reporting only the final training run’s electricity and the serving cluster’s power bill leaves out the failed architecture sweeps that preceded the run and the manufacturing emissions of the racks that host it. A complete workload account (equation 12) groups operational emissions into training and inference, adds embodied emissions, and requires that development experiments and supporting services enter the inventory rather than disappear when accounting starts at the final run:
\[\text{CO}_{2,\text{lifecycle}} = \text{CO}_{2,\text{training}} + \text{CO}_{2,\text{inference}} + \text{CO}_{2,\text{embodied}} \tag{12}\]
Each term has its own physical drivers (figure 7). The embodied term \(\text{CO}_{2,\text{embodied}}\) is fixed before the hardware runs, at roughly 150 kg to 164 kg CO2e per accelerator for the devices priced above. The training term \(\text{CO}_{2,\text{training}}\) is a one-time cost set by cluster scale, PUE, and checkpoint I/O, while the inference term \(\text{CO}_{2,\text{inference}}\) recurs for as long as request traffic and KV-cache residency keep serving replicas powered. Their relative proportions therefore shift over the deployment lifetime, as the worked account in notebook 15.6 and the serving crossover in section 15.7.3 show.
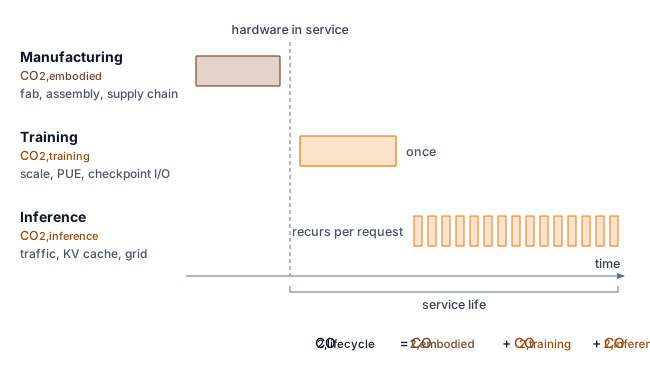
The equations become a decision tool once each factor is measured or declared. A worked account for a large training run shows how the operational and embodied terms combine, and which of them dominates.
Napkin Math 15.6: Partial lifecycle carbon estimation
Problem: Estimate facility operational emissions plus allocated accelerator-baseboard manufacturing emissions for training a 70B parameter model.
Variables: 2,048 H100 GPUs, 30 days, 700 W TDP, rack-profile support power, PUE 1.12, grid intensity 429 g \(\text{CO}_2\)/kWh.
Math: Accelerator power = 2,048 \(\times\) 0.7 kW \(\approx\) 1,433.6 kW. Applying the DGX H100 rack profile for host, memory, networking, and conversion support raises the IT load to 1,971.2 kW; facility power = 1,971.2 kW \(\times\) 1.12 \(\approx\) 2,207.7 kW. Energy = 2,207.7 kW \(\times\) 24 h/day \(\times\) 30 days \(\approx\) 1,589,575.7 kWh. Emissions \(\approx\) 681.9 t \(\text{CO}_2\).
Embodied: Assume manufacturing footprint is \(\approx\) 164 kg \(\text{CO}_2\) per H100 GPU, allocating NVIDIA’s HGX H100 baseboard product carbon footprint evenly across its eight GPUs (NVIDIA Corporation 2025). This worked account uses time-based allocation: it assigns the job the fraction of manufacturing emissions corresponding to its 1-month occupancy of a 3-year service life. Under that declared rule, (2,048 \(\times\) 164 kg) \(\times\) (1 month / 36 months) \(\approx\) 9.3 t \(\text{CO}_2\).
Result: 681.9 t + 9.3 t \(\approx\) 691.3 t \(\text{CO}_2\).
Systems insight: The operational term dominates this partial lifecycle account. It includes facility electricity and allocated HGX baseboard manufacturing, but omits manufacturing of host systems, networking, storage, and facility infrastructure, as well as other unmodeled lifecycle stages. A complete footprint must extend the inventory to those boundaries.
Schneider, Ian, and Taylor Mattia. 2024. “Carbon Accounting in the Cloud: A Methodology for Allocating Emissions Across Data Center Users.” arXiv Preprint arXiv:2406.09645.
Time is one defensible allocation basis, not a universal one. Shared fleets may instead allocate embodied emissions by accelerator-hours, reserved capacity, or a workload’s share of useful computation. Google’s cloud carbon reporting combines two of these bases, allocating the energy and emissions of shared machines by each customer’s resource reservations and hourly measured usage (Schneider and Mattia 2024). The chosen denominator must be reported and applied consistently; otherwise a low-utilization job can appear artificially inexpensive merely because another tenant absorbs the idle capacity. These workload shares support engineering comparisons; they do not determine the reporting year or category in a corporate emissions inventory. Procurement decisions need the unallocated fleet total as well as the workload-attributed share, because amortization changes ownership of an emission in the inventory but does not remove it from the atmosphere.
Every lifecycle estimate should therefore carry an uncertainty interval rather than a single authoritative total. Average workload power, PUE, grid intensity, hardware lifetime, utilization, and manufacturing footprint are measured or modeled with different errors. A sensitivity analysis varies the assumptions that could reverse the decision, including clean-grid versus carbon-intensive operation, three- versus five-year service life, and low versus high serving volume. It then reports whether the preferred design remains preferred. Precision in arithmetic cannot compensate for an unstable system boundary.
The balance among these terms changes with serving volume and duration. A high-volume service can exceed its entire training footprint within months, or within days at higher traffic, a crossover that section 15.7.3 works through for a deployed model.
The account becomes an engineering tool when it runs on every job rather than once after the fact. A partial lifecycle carbon calculator (listing 1) combines measured energy, the rack support multiplier, a declared facility PUE, an explicitly selected grid-intensity factor, and amortized embodied carbon. Its example reproduces the 64-A100 run, with each input drawn from the facility, grid, or hardware profile it describes; section 15.9.4.1 compares the sources of the grid factor.
from mlsysim import Hardware, Infrastructure, ReferenceStats, Systems


def calculate_carbon_footprint(
    gpu_power_watts: float,
    num_gpus: int,
    training_hours: float,
    it_power_multiplier: float,
    pue: float,
    grid_intensity_gco2_kwh: float,
    gpu_embodied_kg: float,
    gpu_lifetime_years: float,
) -> dict:
    """Estimate operational emissions plus allocated GPU manufacturing emissions."""

    # Operational emissions (plain floats: watts, hours, kWh, grams)
    gpu_energy_kwh = gpu_power_watts * num_gpus * training_hours / 1000
    it_energy_kwh = gpu_energy_kwh * it_power_multiplier  # + host, net
    facility_energy_kwh = it_energy_kwh * pue  # overhead, applied once
    operational_kg = (
        facility_energy_kwh * grid_intensity_gco2_kwh / 1000
    )

    # Embodied emissions (amortized by time over the service life)
    daily_embodied = gpu_embodied_kg / (gpu_lifetime_years * 365)
    training_days = training_hours / 24
    embodied_kg = num_gpus * training_days * daily_embodied

    return {
        "energy_kwh": facility_energy_kwh,
        "operational_carbon_kg": operational_kg,
        "embodied_carbon_kg": embodied_kg,
        "total_carbon_kg": operational_kg + embodied_kg,
        "embodied_fraction": embodied_kg
        / (operational_kg + embodied_kg),
    }


# Example: 7B model training on a 64-GPU A100 cluster for 14 days.
# Each input names its source: PUE is a facility property, the
# grid factor a property of the electricity supply.
_rack = Systems.Racks.DGX_H100_4Node  # proxy support-load profile
_facility = Infrastructure.FacilityCooling.BestAir  # PUE 1.12
_grid = Infrastructure.Grids.US_Avg  # annual-average factor
_run = ReferenceStats.MidScaleTrainingCarbonProfile
result = calculate_carbon_footprint(
    gpu_power_watts=Hardware.Cloud.A100.tdp.m_as("W"),  # 400 W
    num_gpus=Systems.Clusters.Lab_64_A100.total_accelerators,  # 64
    training_hours=_run.TrainingDays.m_as("h"),  # 336 h
    it_power_multiplier=(
        _rack.it_power / _rack.accelerator_power
    ).m_as(""),
    pue=_facility.pue,
    grid_intensity_gco2_kwh=_grid.carbon_intensity_g_kwh,
    gpu_embodied_kg=Hardware.Cloud.A100.embodied_carbon_kg,
    gpu_lifetime_years=(  # 4-year extended service life
        Infrastructure.Pricing.Capital
        .AcceleratorExtendedServiceLifeYears.rate
    ),
)
print(
    f"Total carbon footprint: {result['total_carbon_kg']:.0f} kg CO2"
)
print(f"Embodied fraction: {result['embodied_fraction']:.1%}")
Teams can integrate this partial carbon account directly into orchestration dashboards. Calculating operational and embodied emissions for individual training runs, however, captures only one dimension of fleet resource use. At campus scale, data centers introduce power-delivery and cooling constraints that individual run metrics leave invisible.
Self-Check: Question
Which equation pair correctly formalizes operational carbon emissions and daily amortized embodied carbon for AI hardware according to the chapter’s accounting methodology?
- \(C_{\text{operational}} = E_{\text{IT}} / \text{PUE}\) and \(C_{\text{embodied,daily}} = C_{\text{manufacturing}} \times T_{\text{lifetime}}\).
- \(C_{\text{operational}} = E_{\text{total}} + \text{CI}_{\text{grid}}\) and \(C_{\text{embodied,daily}} = C_{\text{manufacturing}} / 365\).
- \(C_{\text{operational}} = E_{\text{total}} \times \text{PUE} \times \text{CI}_{\text{grid}}\) and \(C_{\text{embodied,daily}} = C_{\text{manufacturing}} \times 365 / T_{\text{lifetime}}\).
- \(C_{\text{operational}} = E_{\text{total}} \times \text{CI}_{\text{grid}}\) (where \(E_{\text{total}} = E_{\text{IT}} \times \text{PUE}\)) and \(C_{\text{embodied,daily}} = \frac{C_{\text{manufacturing}}}{T_{\text{lifetime}} \times 365}\).
When a hyperscaler relocates a training cluster from a fossil-heavy grid (800 \(\text{gCO}_2/\text{kWh}\)) to a clean hydro grid (20 \(\text{gCO}_2/\text{kWh}\)), its sustainability dashboard reveals that embodied carbon becomes the dominant component of total lifecycle emissions. Explain the mechanism behind this inversion and its implications for hardware procurement.
An engineering team is auditing the greenhouse gas emissions of an AI platform. Which option correctly maps the five operational sources to their respective GHG Protocol scopes?
S1: Diesel fuel burned by backup generators during a power outage at an owned facility.
S2: Grid electricity purchased to power an owned GPU cluster.
S3: Grid electricity consumed by cooling chillers in the same owned facility.
S4: Embodied carbon from manufacturing the GPUs at an external foundry.
S5: Electrical energy consumed by end-user smartphones running the deployed mobile inference app.
- S1: Scope 1; S2: Scope 2; S3: Scope 2; S4: Scope 3; S5: Scope 3.
- S1: Scope 2; S2: Scope 1; S3: Scope 2; S4: Scope 3; S5: Scope 3.
- S1: Scope 1; S2: Scope 2; S3: Scope 1; S4: Scope 2; S5: Scope 3.
- S1: Scope 3; S2: Scope 2; S3: Scope 2; S4: Scope 1; S5: Scope 1.
The metric representing the mass of carbon dioxide emitted per unit of electricity generated, expressed in grams of \(\text{CO}_2\) per kilowatt-hour, is known as
____.A production language model consumed 1,200 MWh during its one-time training run. In production, it serves 8 million requests per day, consuming 0.0005 kWh per request. After how many days of continuous serving will the cumulative inference energy reach the one-time training energy?
- 120 days.
- 300 days.
- 600 days.
- 1,200 days.
Give one valid order for the following steps in computing the specified operational-plus-accelerator-manufacturing carbon subtotal of a model training workload: (1) multiply IT energy by facility PUE to obtain total facility energy consumption, (2) amortize accelerator manufacturing footprint over total operational lifetime to calculate the job’s embodied share, (3) measure or estimate raw IT electrical power and duration across GPUs, CPUs, and memory, (4) sum operational and embodied carbon to determine the accounted subtotal, (5) multiply total facility energy by regional grid carbon intensity to determine operational carbon.
15.6 Data Center Energy and Resource Consumption
A training cluster can fit its accelerator power budget yet exceed its facility budget once support systems and cooling enter the account. Whether a facility can host the cluster at all is a feasibility question; the sustainability question is whether a change in power delivery or cooling reduces lifecycle cost while preserving that feasible operating envelope. The relevant comparison includes annual energy, local water use, equipment lifetime, and the energy wasted when cooling failures interrupt useful work.
Facility sustainability therefore has to be read as a chain of constraints rather than as a single PUE number. Persistent megawatt demand sets the grid and emissions exposure, power delivery determines how much electricity becomes useful IT load, cooling sets the facility overhead and the water drawn to remove heat, and water use determines whether a technically efficient site is locally sustainable. The physical mechanisms below matter here because each assigns losses or resource use to a different accounting boundary.
15.6.1 Data center energy and AI workloads
Even when an engineer halves the energy of a single model, campus electricity demand still climbs if new data-center capacity and serving traffic expand faster than per-job efficiency. At facility scale, the optimization target is no longer a single model in isolation but the aggregate demand, facility overhead, and grid context surrounding every watt of IT power. The same IEA Energy and AI analysis behind the 2030 electricity projection cited at the chapter’s opening also tracks emissions, a different quantity. It estimated emissions from data-center electricity use at about 180 Mt at the time of the analysis and projected roughly 300 Mt by 2035 in its Base Case, still below 1.5 percent of total energy-sector emissions (International Energy Agency 2025).12 The energy burden grows with data-center capacity, training workloads, and inference demand (Patterson et al. 2021), so component efficiency must be evaluated against fleet expansion (Thompson et al. 2021; Dodge et al. 2022).
12 Data center emissions scale: Those emissions come from electricity demand that IEA’s 2025 Energy and AI analysis tracks separately. Data centers consumed about 1.5 percent of global electricity (415 TWh) in 2024, a share projected to approach 3 percent by 2030, with AI contributing to demand growth (International Energy Agency 2025). The largest hyperscale facilities can draw over 100 MW continuously, equivalent to powering tens of thousands of homes.
International Energy Agency. 2025. Energy and AI.
Thompson, N. C., K. Greenewald, K. Lee, and G. F. Manso. 2021. “Deep Learning’s Diminishing Returns: The Cost of Improvement Is Becoming Unsustainable.” IEEE Spectrum 58 (10): 50–55. https://doi.org/10.1109/mspec.2021.9563954.
Dodge, Jesse, Taylor Prewitt, Remi Tachet des Combes, Erika Odmark, Roy Schwartz, Emma Strubell, Alexandra Sasha Luccioni, Noah A. Smith, Nicole DeCario, and Will Buchanan. 2022. “Measuring the Carbon Intensity of AI in Cloud Instances.” 2022 ACM Conference on Fairness Accountability and Transparency, 1877–94. https://doi.org/10.1145/3531146.3533234.
13 Hyperscale data center footprint: A hyperscale campus makes long-lived investments in substations and transmission connections. Algorithmic improvements can reduce demand but do not remove the costs already incurred for that capacity. Supply contracts and operating schedules remain adjustable, subject to their terms and the physical connection.
The relevant facility quantity is persistent megawatt-class load, not the model name alone. Hyperscale campuses house large fleets of accelerator servers and hold loads of 100 MW or more for years at a time.13 A newer accelerator lowers a job’s energy only when that workload realizes the efficiency gain. Even then, lower energy per job need not reduce campus demand if the fleet uses the released capacity to perform more work.
Whether that demand keeps growing depends on the race between workload growth and efficiency. Masanet et al. (2020) show that efficiency gains held global data-center energy nearly flat through the 2010s even as computing output grew several-fold; sustained AI demand growth can erode that offset, which is why the IEA projection cited earlier rises rather than remaining flat.
Masanet, Eric, Arman Shehabi, Nuoa Lei, Sarah Smith, and Jonathan Koomey. 2020. “Recalibrating Global Data Center Energy-Use Estimates.” Science 367 (6481): 984–86. https://doi.org/10.1126/science.aba3758.
Beyond computational demands, cooling can account for 30–40 percent of facility energy in the conventional air-cooled data-center designs surveyed by Ebrahimi et al. (2014). This is a design-regime range, not a constant for modern hyperscale or liquid-cooled facilities; section 15.6.3 derives the site-specific overhead through PUE and the cooling architecture.
The United States alone illustrates how cloud and AI infrastructure can reshape national energy planning. US data center electricity consumption more than tripled from 58 TWh in 2014 to 192 TWh in 2024, reaching 4.7 percent of national supply, according to the Lawrence Berkeley National Laboratory (LBNL) estimates that figure 8 plots (Shehabi et al. 2024; Smith et al. 2026). LBNL’s reference case projects 649 TWh for 2030, about 11.8 percent of US electricity, inside a scenario range of 521 to 843 TWh (Smith et al. 2026). These scenarios describe possible demand, not a measured capacity ceiling. They motivate evaluating efficiency gains alongside the generation, transmission, and connection capacity needed to serve that demand.
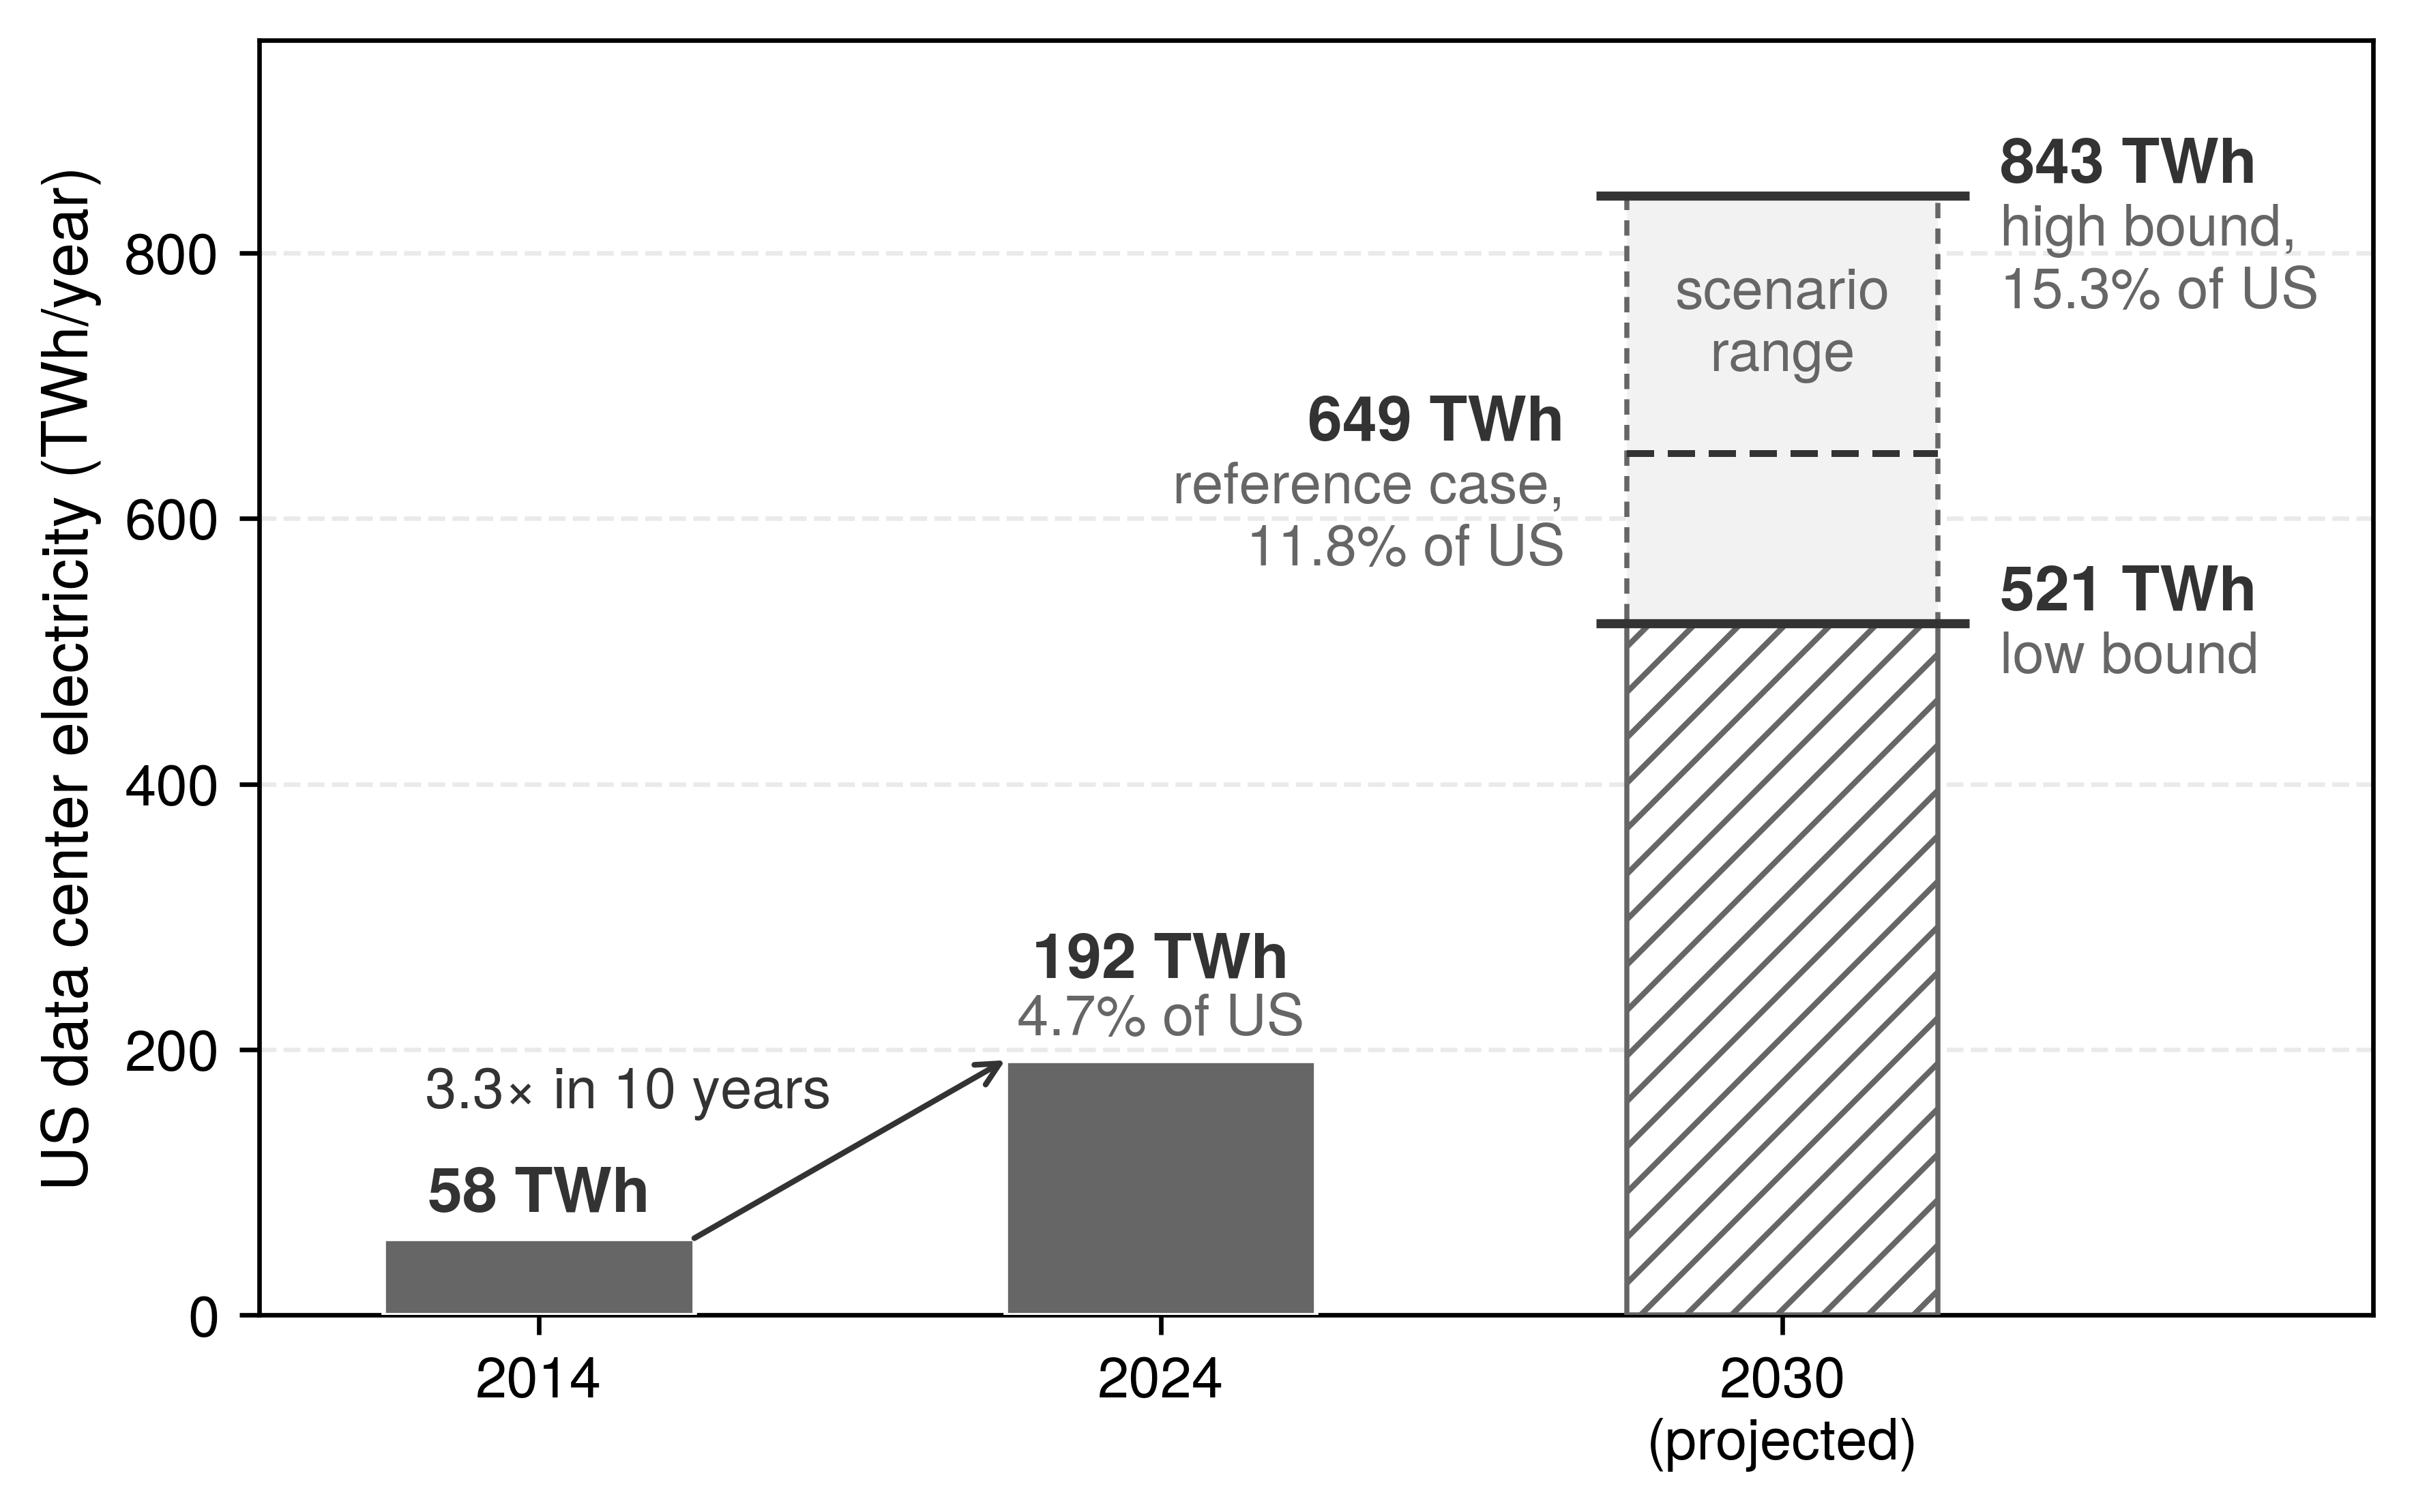
Shehabi, Arman, Sarah Josephine Smith, Alex Hubbard, Alexander Newkirk, Nuoa Lei, Md Abu Bakar Siddik, Billie Holecek, Jonathan G. Koomey, Eric R. Masanet, and Dale A. Sartor. 2024. 2024 United States Data Center Energy Usage Report. LBNL-2001637. Lawrence Berkeley National Laboratory. https://doi.org/10.71468/P1WC7Q.
Smith, Sarah J., Alexander Hubbard, Alex Newkirk, Mohan Ganeshalingam, Billie Holecek, Dale Sartor, Michael Mills, and Arman Shehabi. 2026. United States Data Center Energy Usage Report: 2025 Update. LBNL-2001758. Lawrence Berkeley National Laboratory. https://doi.org/10.71468/P1RP4F.
Every kilowatt-hour in those national totals begins as electricity delivered to a rack and leaves as heat that must be removed from it. Delivering 120 kW to a single cabinet (the rated draw of one GB200 NVL72 rack) starts at the substation, and every conversion stage between the grid and the chip takes its share along the way.
15.6.2 Power delivery
Capacity planning fails when engineers budget only accelerator TDP, because transformers, uninterruptible power supplies, rack distribution, and voltage regulators each dissipate part of the incoming grid power as heat before a single watt reaches the silicon. Power and thermal envelopes traced that electrical path from the utility feed to the voltage regulator, and equation 2 measures the facility overhead along it; for a sustainability account, the question is where along that path energy and reliability margin are lost, and which boundary carries each loss. The first constraint sits outside the building: large grid-supplied ML facilities need sufficient substation and utility-interconnection capacity. Internal distribution improvements cannot raise that import limit, and on-site generation or storage adds a separate supply whose capacity, duration, and reliability must enter the design.
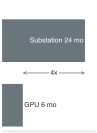
Substation lead time can run 4× longer than GPU procurement.
Systems Perspective 15.2: The interconnection queue
Deploying 10,000 GPUs and deploying the electrical substation required to power their IT load (9.6 MW, after the 7 MW GPU subtotal is expanded for rack support power) operate on different timelines. In this planning comparison, GPU procurement takes 6 months, while permitting, engineering, procurement, construction, and grid connection for a new 10+ MW substation take 24 months. The infrastructure path is therefore 4× longer than the accelerator path. Actual schedules depend on the site, utility, equipment availability, and approvals, so the ratio illustrates a dependency rather than a universal lead time.
Systems insight: In this comparison, power delivery determines when the fleet can begin useful work even if the accelerators arrive on schedule. The US generation-and-storage interconnection queue is distinct from a data center’s load-connection request; neither queue total directly measures available capacity for a new ML facility. Procurement must therefore follow a site-specific power-delivery schedule. Otherwise, delivered silicon can remain “electrically stranded” while the facility waits for its connection or transformer.
Inside the facility, every conversion stage turns part of the delivered power into heat. Along the path traced in Power and thermal envelopes (The Power Delivery Path), the utility transformer loses about 1–2 percent, an online double-conversion uninterruptible power supply (UPS) 3–5 percent (or 1–2 percent in eco mode), the power distribution unit (PDU) 2–3 percent, and baseboard voltage regulation 5–8 percent. Compounded, these stages dissipate roughly 9–17 percent of grid power before it reaches a transistor, and server power supplies add their own conversion loss on top. The accounting boundary decides where each loss appears. Losses upstream of the IT boundary, such as the transformer, UPS, and facility distribution, raise PUE; server power supplies and baseboard voltage regulators sit inside the measured IT load, and their heat must be removed by the same cooling system that serves the accelerators. Higher-voltage distribution is one of the few design changes that shrinks this overhead directly, because the same power at a higher voltage needs less current, and resistive distribution losses \(\ConductorCurrent^2\ElectricalResistance\) fall with the square of that current. The 48 V rack distribution of Power delivery networks and transient dynamics applies that principle, and its realized saving depends on conductor design and the added conversion stages.
At ML rack power densities, the difference between 95 percent and 98 percent distribution efficiency is meaningful. Using 33 kW as a reference rack load, a first-order estimate applies the difference between those efficiencies as 3 percent of that load, yielding approximately 0.99 kW per rack. Across 300 racks, the estimated reduction is 297 kW, equivalent to roughly 36 GPU nodes or 9 four-node racks under this power mix. Sustaining that reduction over a 3-year lifecycle at $0.07/kWh gives estimated electricity savings of ~$546,361. An exact fixed-load comparison divides delivered power by each efficiency before subtracting input powers. The released capacity can support more work or lower consumption; spending it on additional nodes does not preserve the same electricity saving.
The Rack sizes the power envelope of a four-node DGX H100 rack; the same rack also shows which parts of a budget are IT load and which are facility overhead. A rack-attributed power budget itemizes more than GPU TDP (table 7). In this scenario, host, fabric, and equipment-side conversion losses belong to the IT load and sum to the IT subtotal; the row below it is an illustrative non-IT allocation at the stated PUE. A facility calculation multiplies the IT subtotal by its own PUE rather than reusing that allocation, and facility-side conversion losses are covered by PUE and must not be added again.
| Component | Power (kW) | % of rack total |
|---|---|---|
| GPU compute | 22.4 kW | 67% |
| Host CPUs and DRAM | 3.2 kW | 10% |
| NVSwitch fabric | 1.6 kW | 5% |
| InfiniBand HCAs | 0.8 kW | 2% |
| IT-equipment conversion losses | 2.8 kW | 8% |
| IT subtotal | 30.8 kW | |
| Allocated non-IT overhead (PUE ~1.09) | 2.7 kW | 8% |
| Total | 33.5 kW | 100% |
Evaluating DGX H100 power allocation (table 7) reveals that 32 GPUs at 700 W each deliver 22.4 kW, but host, fabric, and conversion losses raise the IT subtotal to 30.8 kW, about 38 percent above the GPU subtotal. That IT subtotal is the load to multiply by a facility’s PUE; the table’s final row is one such allocation, which brings the rack-attributed total to about 50 percent above the GPU subtotal. Infrastructure planners who size their facility based on GPU TDP alone will underestimate the electrical load and may discover during commissioning that their power capacity is insufficient.
Synchronized training also changes the shape of the load. The correlated power swings introduced with grid dynamics (section 15.3.2) now appear inside the delivery chain, where coordinated computation and communication phases align across thousands of accelerators; Power delivery networks and transient dynamics analyzes how local decoupling, voltage regulators, and UPS controls filter these synchronous transients before they reach the utility connection. The same section estimates the aggregate ramp, in gigawatts per second, when a training cluster steps from communication to computation in unison. That estimate describes a load-side scenario rather than a measured utility input, and its sustainability consequence appears at the interconnection. Rack- or facility-level energy buffering (section 15.3.2), sized to the measured energy deficit rather than to a fixed allowance per rack, lets the grid see a smoother load, and a well-characterized, controllable load is easier both to connect and to schedule against grid conditions.
Checkpoint 15.3: Power delivery physics
Verify the data center power path:
At the largest scales, the data center’s power draw represents a significant fraction of the local electrical grid’s capacity. A 100,000-GPU cluster, roughly a hundred times the book’s 1,024-GPU reference cluster, at 700 W per GPU has a 70 MW accelerator subtotal, but rack-profile support power raises the IT load to 96.2 MW before PUE. With PUE, the total facility draw approaches 107.8 MW, the load of a small city. Such installations require dedicated feeds from the electrical grid, often with purpose-built substations and transmission lines. The substation lead time of 24 months in the interconnection-queue perspective above makes power availability one of the longest-lead-time constraints in building ML infrastructure.
At large-cluster scale, the same delivery limit becomes a grid-procurement problem rather than an electricity bill. Later large systems often lack energy disclosures comparable to the chapter’s opening anchor, which is precisely why the measurement contract requires workload telemetry instead of relying on published model documentation alone. This grid-procurement problem worsens because compute-optimal allocation (Compute-optimal resource allocation) grows parameters and training tokens together, so training work grows roughly with the square of model size, and energy follows it unless realized FLOPs per joule improve.
The electricity consumed by a single large-model training campaign can become nonnegligible relative to the output of a power plant. A 100 MW training facility operating at full capacity for one year consumes 876 GWh, which a 100 MW wind farm cannot match (at 30 percent capacity factor, a wind farm produces about 262.8 GWh per year, so the training facility would require the equivalent of approximately 3.3 large wind farms). Once power is available, its carbon intensity determines the emissions attributed to each megawatt-hour under the chosen accounting method, and at facility scale that factor becomes a siting decision that persists for the life of the building. Low-carbon electricity can coincide with favorable prices, but price and emissions factor are separate tests that a siting comparison must evaluate alongside power availability and the workload’s location constraints.
15.6.3 Cooling energy, heat rejection, and water
Nearly every watt of electrical power that enters a server cabinet leaves as heat, so a dense rack acts as a continuous heater whose thermal output must be removed at the rate it consumes electricity or the silicon throttles and shuts down. Cooling class and heat removal established how air and liquid loops carry that heat and which cooling class a given rack density requires; for a sustainability account, the question is what rejecting that heat to the outside environment costs in additional facility electricity and local water.
PUE (equation 2) captures facility fans, chillers, and facility-side conversion losses as overhead on top of the IT load. If facility cooling consumes 3–8 percent of IT power, that contribution alone adds 0.03–0.08 to PUE, and facility-side electrical losses and other non-IT loads add to it. Server fans, by contrast, lie within the IT load itself, so their energy sits in the denominator as well as the facility total, and reducing server-fan power changes the IT load rather than producing the same PUE reduction. Cooling choices must therefore be compared using total facility energy for the same useful work, not PUE alone.
The cooling class of Cooling class and heat removal settles thermodynamic feasibility, that the proposed cooling medium maintains die temperatures and component serviceability under peak workload. Lifecycle economics then compares installed capital expenditure, pumping and fan parasitics, water consumption, maintenance overhead, and equipment lifespan under the same computational load. A higher-density liquid-cooled installation may reduce operational energy, but its capital payback period cannot be inferred from rack power alone.
Napkin Math 15.7: The cooling overhead
Consider a 1,024-GPU cluster of H100s at 700 W each. To isolate the cooling choice, this simplified calculation treats accelerator power as the entire IT load and assigns all non-IT overhead to cooling; a procurement estimate must restore host, memory, network, and storage support before applying PUE.
- IT power: 1,024 \(\times\) 700 W = 716.8 kW
- Overhead removed: with the \((\text{PUE}-1)\) overhead arithmetic of notebook 15.3, moving from air cooling (PUE 1.55) to liquid cooling (PUE 1.08) removes 716.8 kW \(\times\) 0.47 = 336.9 kW of continuous power.
Savings: At $0.07/kWh, the annual savings are approximately $206,585. Over a 3-year hardware lifecycle, the cooling savings alone total $619,754, which is the figure to set against the installed capital cost of the liquid-cooling system when computing its payback period.
The final link in the cooling chain is heat rejection: getting heat from the facility water loop to the outside environment. A cooling tower sprays warm water over a fill medium, packing that spreads the water into thin films to enlarge its contact with the air, and uses evaporation to carry heat into the atmosphere. Evaporating a kilogram of water removes its latent heat of vaporization, 2,260 kJ/kg. Sensible heating instead depends on both the specific heat capacity, 4.18 kJ/kg/K, and the permitted temperature rise. Evaporation can therefore carry substantial heat with a small mass flow, but the evaporated water must be replaced.
A 10 MW data center with evaporative cooling towers can consume well over 100 million liters of water per year, depending on climate and cooling design, which has become a significant concern in water-stressed regions. At the evaporative WUE of 1.8 L/kWh used earlier, continuous operation consumes about 158 million liters per year, roughly 350–415 household-years of water use under the earlier annual household baseline. As ML data centers grow to 100 MW and beyond, their water footprint becomes a meaningful factor in local resource planning.
Dry coolers use fans to blow air over a radiator without evaporating cooling water. They avoid that direct water consumption, but the added fan electricity carries its own water burden at the generating plant, in a different watershed from the facility (figure 9). Heat rejection depends on the temperature difference between coolant and ambient air, so hot weather can reduce capacity or require more fan power. Hybrid designs use dry cooling when conditions permit and evaporative assistance when needed, trading water consumption against electrical demand and thermal margin.
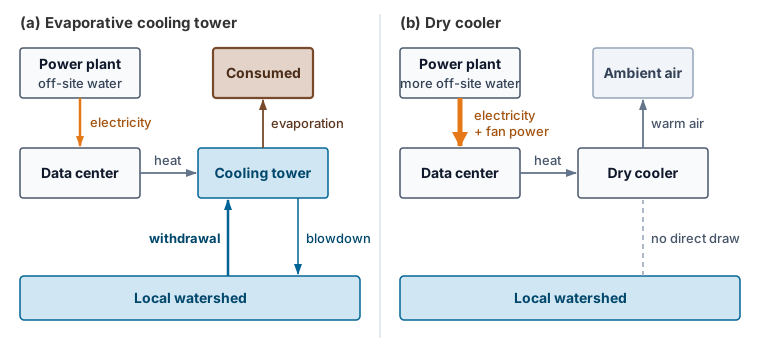
Waste heat reuse treats thermal output as a resource. A district heating connection supplies a municipal heat network, while industrial coupling directs recoverable heat toward a compatible process. The benefit depends on the temperature, timing, and distance of the receiving demand, along with any pumping or heat-pump energy needed to supply it. Useful recovery can displace another heat source; it does not eliminate the fleet’s electrical consumption14 (Ebrahimi et al. 2014). A liquid-cooling loop returning water at 50–65 degrees Celsius supplies low-grade heat that may serve nearby district heating, greenhouses, or other suitable sinks. Usability depends on the required supply temperature, seasonal demand, and transport losses; a heat pump may be needed. If an illustrative 10 MW thermal stream has an 80–90 percent recovery fraction, 8–9 MW is recovered before accounting for heat-pump electricity. Heat-pump output includes that electrical input and must be accounted for separately. Crediting useful heat does not reduce PUE below 1.0. Exported heat is instead reported through energy reuse effectiveness (ERE), which subtracts the reused energy from total facility energy before dividing by IT energy, or through a separate net-energy balance.
14 PUE boundary: The facility-to-IT ratio glossed with the opening energy boundary (The Green Grid 2007), formalized in section 15.4.1.3, says nothing about where recovered heat goes. Lowering non-IT overhead improves facility efficiency, but the metric does not capture the carbon intensity of electricity or the water consumed for cooling. Carbon usage effectiveness and water usage effectiveness therefore expose constraints that PUE alone leaves invisible.
The Green Grid. 2007. Green Grid Data Center Power Efficiency Metrics: PUE and DCIE. The Green Grid.
Ebrahimi, K., G. F. Jones, and A. S. Fleischer. 2014. “A Review of Data Center Cooling Technology, Operating Conditions and the Corresponding Low-Grade Waste Heat Recovery Opportunities.” Renewable and Sustainable Energy Reviews 31: 622–38. https://doi.org/10.1016/j.rser.2013.12.007.
The viability of waste heat reuse depends on the proximity of heat consumers. Urban data centers, despite their higher land and electricity costs, are often better positioned for waste heat reuse than remote facilities because they are close to residential and commercial heating loads. The result is a counterintuitive economic optimization: a data center in a Nordic city may have higher electricity costs but lower net operating costs after waste heat revenues, compared to a remote facility with cheaper electricity but no heat consumers nearby.
A cooling failure also costs energy, because the run repeats the work done since its last checkpoint. Rerunning 30 to 60 minutes on all 10,000 accelerators of a training cluster at rated power repeats about 3.5–7 MWh of accelerator energy, before host and facility overhead, and power drawn by idle accelerators during the outage adds to that total. ML goodput discounts the repeated work, but the energy account still pays for it. The cooling failure modes and their blast radius are developed in Facility reliability and environmental controls, and the checkpoint recovery that bounds the rollback in Checkpointing and Progress Preservation.
Self-Check: Question
A cloud provider can procure and install 10,000 GPUs within six months, but building the required electrical substation and securing utility interconnect approval takes 24 months. Explain why electrical power delivery represents the binding bottleneck for data center expansion, and state the systems consequence of this lead-time disparity.
A facility audit lists conversion losses in five places: the utility transformer, the online UPS, the facility power distribution units, the server power supplies, and the baseboard voltage regulators. Which losses raise the facility’s PUE?
- The transformer, UPS, and facility distribution losses, because they lie upstream of the IT boundary; server power supplies and voltage regulators sit inside the measured IT load.
- All five, because every conversion loss turns delivered power into heat that the cooling system must remove.
- Only the server power supplies and voltage regulators, because they sit closest to the accelerators that do the useful work.
- None of them, because PUE measures cooling overhead and conversion losses are electrical rather than thermal.
Facility A reports a Power Usage Effectiveness (PUE) of 1.08 on an electrical grid with carbon intensity of \(450\text{ g CO}_2/\text{kWh}\). Facility B reports PUE 1.35 on a grid with \(50\text{ g CO}_2/\text{kWh}\). For a \(10\text{ MW}\) IT compute load, calculate the total hourly electrical power drawn and carbon emissions for both facilities, and explain the limitation of using PUE as a sole environmental metric.
A 10 MW facility in a water-stressed region can reject heat through evaporative cooling towers or through dry coolers. Explain the water and energy trade-off between the two, and why the operator might accept higher fan energy.
15.7 Training vs. Inference Energy Analysis
The facility account sets the overhead on every kilowatt-hour, but the total magnitude of the load depends on whether the fleet is executing a concentrated training run or a globally distributed inference workload. Training a large language model is a concentrated, highly visible energy event that consumes thousands of megawatt-hours over weeks or months. Serving the same model to a billion daily queries is the opposite shape of load: energy spent continuously, query by query, year after year. Understanding where the majority of the energy budget goes dictates where optimization efforts must concentrate.
Training and inference share opportunities to reduce computation, data movement, and idle power, but their success criteria differ. Training must reach the target model quality within its completion budget; inference must serve the required demand at the agreed quality and latency. The lifecycle energy account identifies which phase contributes most, while those constraints determine which interventions can reduce its cost without sacrificing useful work.
15.7.1 Carbon benchmarks across AI workloads
Two published carbon estimates for the same neural architecture search can differ by orders of magnitude when one assumes older GPUs, an average facility PUE, and a fossil-heavy grid (Strubell et al. 2019) while the other measures specialized accelerators in an efficient, low-carbon facility (Patterson et al. 2021).15 Even though the IEA estimate cited earlier puts emissions from data-center electricity use at about 180 Mt—below 1.5 percent of total energy-sector emissions—workload-level carbon benchmarks have become a central engineering concern, and they are only as reliable as the boundary assumptions behind them.
15 Neural architecture search (NAS) carbon cost: The ~284,000 kg CO2e figure from Strubell et al. (2019) represents an unoptimized Evolved Transformer search that drops sharply when accounting for TPU hardware, grid mix, and proxy tasks (Patterson et al. 2021). The systems lesson is boundary discipline: search, tuning, and failed trials belong inside the carbon accounting boundary, but reusable architecture search should be amortized across all downstream deployments.
Strubell, Emma, Ananya Ganesh, and Andrew McCallum. 2019. “Energy and Policy Considerations for Deep Learning in NLP.” Proceedings of the 57th Annual Meeting of the Association for Computational Linguistics, 3645–50. https://doi.org/10.18653/v1/p19-1355.
Patterson, David, Joseph Gonzalez, Quoc Le, Chen Liang, Lluis-Miquel Munguia, Daniel Rothchild, David So, Maud Texier, and Jeff Dean. 2021. “Carbon Emissions and Large Neural Network Training.” arXiv Preprint arXiv:2104.10350.
The GPT-3 calculation in notebook 15.1 put one training run at hundreds of trans-Atlantic passenger round trips. Such run-level comparisons convey scale, but they do not by themselves describe the footprint of a deployed service; the operational lesson is that carbon accounting must distinguish training from recurring inference over a declared observation period. Meta’s recommendation workloads (RM-1 through RM-5) split operational emissions roughly evenly between training and inference, while inference dominates its language-model example (figure 10). The public baselines, including GPT-3 and BERT-NAS, report training only; their bars do not establish a lifetime training-to-inference ratio. For high-traffic Archetype B deployments (Archetype B (DLRM at Scale)), both recurring serving and model updates belong in the account before deciding which phase offers the larger reduction.
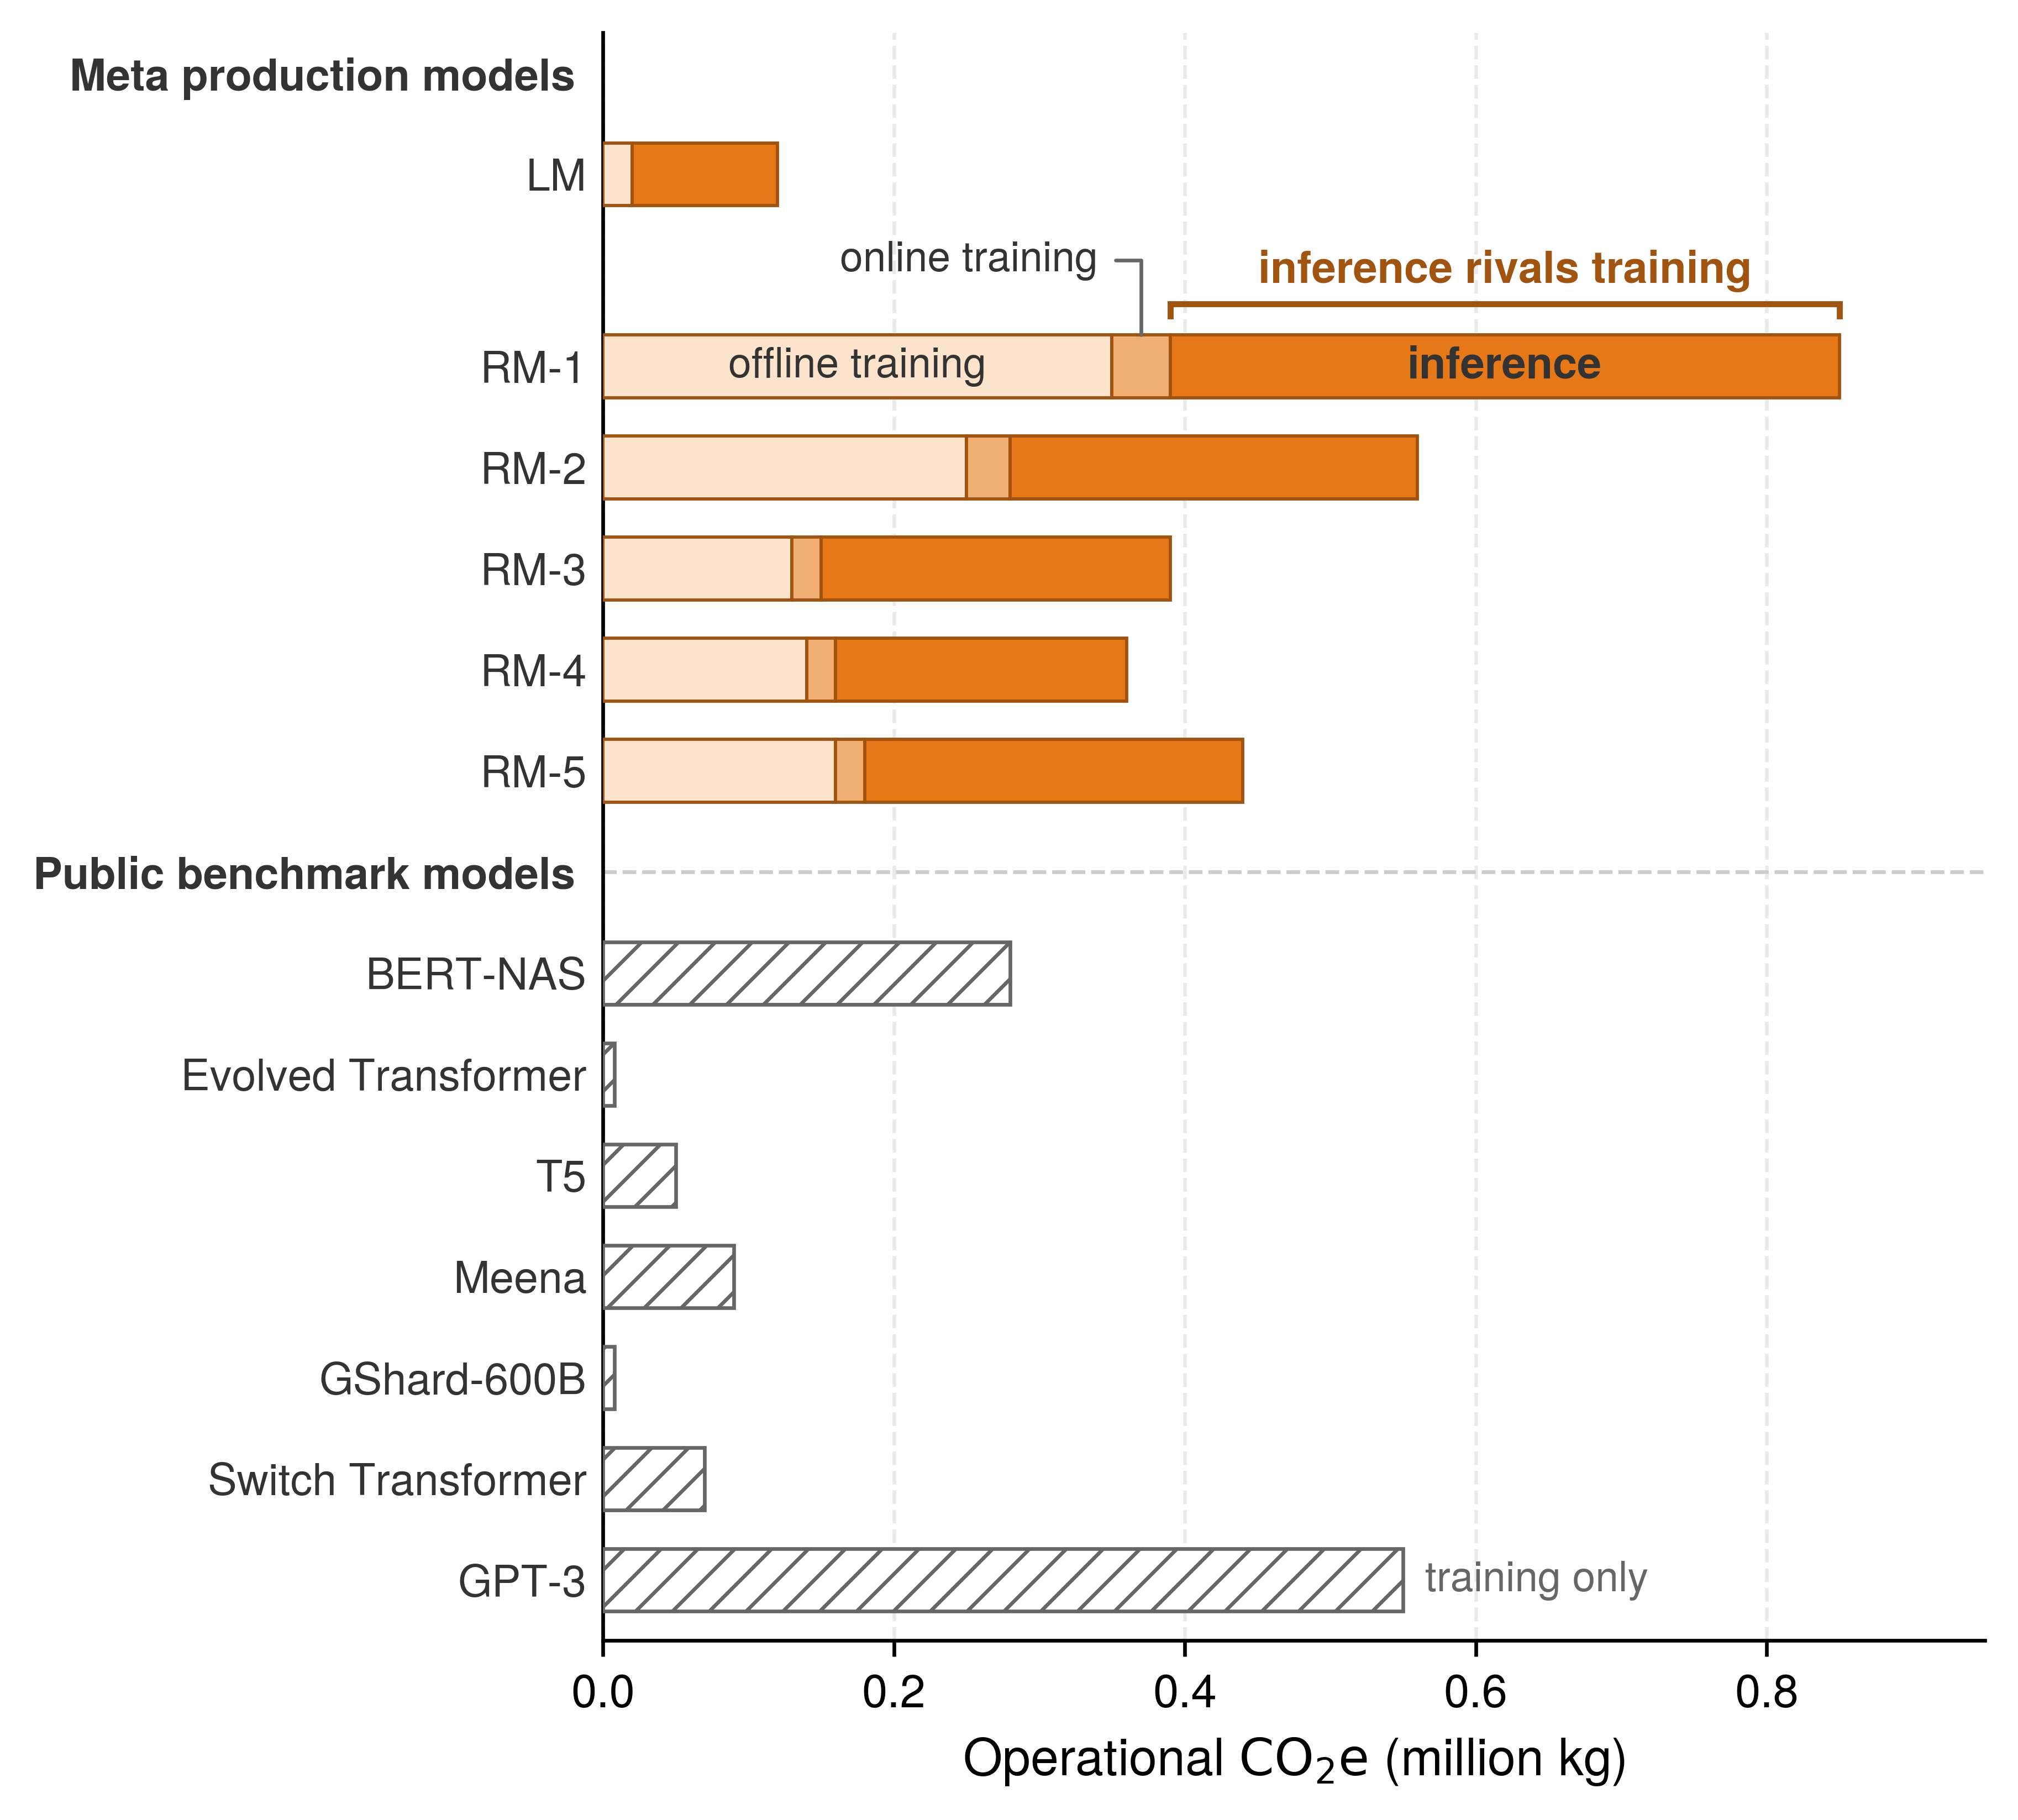
15.7.2 Training energy demands
Training large AI models can require hundreds of thousands of cores and specialized accelerators operating continuously for months; Microsoft’s 2020 disclosure of the supercomputer it built for OpenAI, with 285,000 CPU cores and 10,000 GPUs (Langston 2020), is a dated reference point for that scale rather than a claim about later systems. The intensive computational loads generate heat that cooling infrastructure must continuously remove, the facility overhead quantified in section 15.6.3, and reducing it requires co-optimization of hardware architecture, parallelism strategy, and algorithmic efficiency. Every training account in this chapter, from the GPT-3 run to the 70B model of notebook 15.6, describes a single final run, and development multiplies each one, by 5× for the sweep in section 15.5.2, while retraining during service repeats part of that cost. Training energy is therefore paid once per completed run but recurs across the model’s development and update cycle.
Langston, Jennifer. 2020. Microsoft Announces New Supercomputer, Lays Out Vision for Future AI Work. Microsoft Source.
Distributed systems energy optimization
Distributing a training job across accelerators introduces coordination costs alongside the energy spent on computation. Distributed parallelism strategies exchange gradients, parameters, or activations while synchronization stalls leave idle accelerators drawing baseline power.16 The resulting energy share cannot be inferred from cluster size alone because topology, collective algorithm, message volume, overlap, and utilization determine the account. Some AllToAll patterns also increase traffic faster than aggregate useful work as the participating set grows.
16 Parallelism energy overhead: Data, model, and pipeline parallelism impose distinct communication and idle-power costs. Data parallelism reduces gradients, tensor parallelism exchanges partial activations, and pipeline parallelism introduces bubbles. A valid comparison reaches the same model-quality target under the same completion constraint, then measures each strategy’s runtime and system energy, including communication and waiting. Fixing time-to-train by assumption would hide one of the effects the comparison needs to expose.
↩︎ Parallelism strategy selection and the communication cost of each strategy are established in Parallelism strategy selection and engineering trade-offs.
The Fleet Law (equation 1.3) turns this overhead into an energy account. If the fleet draws average power \(\AveragePower\) while executing one step on \(\DeviceCount\) accelerators, the energy of that step is approximately
\[\TrainingStepEnergy\approx \AveragePower\times \DistributedStepTime(\DeviceCount) = \AveragePower\left( \frac{\IronLawComputeTime}{\DeviceCount} + \CommunicationTime(\DeviceCount) + \SynchronizationTime(\DeviceCount) - \OverlappedTime \right) \tag{13}\]
The compute term accounts for local mathematical work; communication and synchronization make the distributed update possible. When these costs remain exposed, they extend the step while accelerators, hosts, and the fabric continue drawing power, adding powered time on the communication and coordination axes of C³. Their energy share depends on power during those intervals as well as on their duration. A quarter of the step spent in unhidden communication accounts for a quarter of its energy only if average fleet power during that interval equals the average over the whole step; accelerators stalled at a collective can draw less than at full arithmetic load, so the share must be read from a power trace. Overlap, smaller messages, and fewer stragglers shorten the step, and they save energy to the extent that the shorter powered interval is not offset by higher average power or by extra work to reach the same model quality. The parallelism choices of Distributed Training are therefore sustainability choices as well.
↩︎ The data-movement boundaries that set what each transferred byte costs, from on-package links through intra-node crossbars to inter-node switches, are established in The Physics of Data Movement.
Beyond the communication term, coordinated resource management offers four levers with distinct effects on energy and emissions. At the cluster level, dynamic workload placement consolidates compatible jobs so genuinely unused hardware can enter lower-power sleep states, with true savings verified at the facility meter rather than inferred from idle node counts, while carbon-aware scheduling (section 15.9.4) shifts flexible runs toward cleaner grid windows even when total energy use is unchanged, subject to data-movement overhead, completion deadlines, and reliability bounds. Inside active nodes, multi-tenant sharing raises accelerator compute and memory occupancy across concurrent tasks, though contention can lengthen execution and increase energy per completed job, whereas adaptive inference batching groups compatible requests to improve throughput within their latency limits (and changing training batch size instead requires checking the total work needed to reach the target model quality). Each lever must therefore be evaluated against completed useful work and its service constraints rather than occupancy alone, because energy spent on work that ML goodput discounts, the scheduling, runtime, and program losses of ML Goodput, still enters the energy account.
Energy-aware training frameworks reduce step energy directly rather than shifting where it is spent. Zeus improved training energy efficiency by 15.3–75.8 percent across its evaluated workloads by automatically finding energy-performance trade-offs (You et al. 2023), while Perseus reduced large-model training energy consumption by up to 30 percent by mitigating energy bloat (Chung et al. 2023). These tools make energy optimization available beyond hyperscale companies, yet all of these training costs stop accruing when the run stops. For high-volume services, the larger term is often the deployment that follows, as the crossover calculation in section 15.7.3 shows.
You, Jie, Jae-Won Chung, and Mosharaf Chowdhury. 2023. “Zeus: Understanding and Optimizing GPU Energy Consumption of DNN Training.” 20th USENIX Symposium on Networked Systems Design and Implementation (NSDI 23), 119–39.
Chung, Jae-Won, Yile Gu, Insu Jang, Luoxi Meng, Nikhil Bansal, and Mosharaf Chowdhury. 2023. “Reducing Energy Bloat in Large Model Training.” Proceedings of the ACM SIGOPS 30th Symposium on Operating Systems Principles abs/2312.06902: 144–59. https://doi.org/10.1145/3694715.3695970.
15.7.3 Inference energy costs
A model trained once can draw far more electricity over a year of high-volume serving than it ever consumed during training (Wu et al. 2022). Although a single inference request costs only a fraction of a watt-hour, serving executes every time the model answers a query, classifies an image, or scores a recommendation, scaling continuously with user traffic across search engines, recommendation systems, and generative AI services.

Cumulative inference emissions overtake the one-time training cost.
Consider a model serving 10 million queries per day at 0.001 kWh of attributed facility electricity per query, including its share of idle capacity and support systems. At this serving rate, daily energy consumption reaches 10,000 kWh (10 million queries \(\times\) 0.001 kWh), which accumulates to 3,650,000 kWh over a year of continuous service. Evaluated against the average US grid carbon intensity of 0.429 kg/kWh, this electricity demand produces 1,565.9 t (1,565,850 kg) of greenhouse gas emissions annually.
Compared with the earlier 7B/64-A100 training example (5.7 t), the smallest of the three training accounts and therefore the fastest to overtake, cumulative inference emissions exceed training emissions after approximately 1.3 days of deployment at this scale. The serving scenario and the training run describe different models, so the comparison does not trace one model’s lifecycle; it shows how quickly this serving volume would overtake a training run of that size. For larger training runs, the crossover can shift to weeks or months depending on query volume, per-query energy, and grid intensity. The lifecycle perspective therefore sets the priority: optimize inference efficiency for widely deployed models, and focus training efficiency efforts on models that undergo frequent retraining or experimental iteration.
Production measurements in figure 10 show why this crossover must remain workload-specific. Inference dominates the language-model account, while training and inference contribute roughly equally for the recommendation models. Training FLOPs alone omit serving costs, but the larger phase must be established from the service’s measured workload and observation period.
Inference workloads, like other software services, scale with demand. An always-available service consumes energy both while processing requests and while maintaining capacity for expected latency and availability. The sustainability account must include query volume, workload mix, and idle provisioned resources.
A production measurement shows how large that account is. Google instrumented the fleet serving its Gemini assistant and attributed energy to the median text prompt in May 2025 across every component of the serving stack (Elsworth et al. 2025). The full-stack figure is 0.24 Wh per prompt (figure 11), of which the active accelerators account for only 58 percent. The host processors and memory that feed them add 25 percent, and idle machines held for latency and availability together with facility overhead add another 17 percent. Counting only active accelerators on the most efficiently used machines, the boundary many published estimates use, yields 0.10 Wh, a 2.4× understatement of the same workload. The measured prompt also sits at about a quarter of the 1 Wh per query assumed in the worked example above, a reminder that per-query energy is a property of a specific model, serving stack, and utilization rather than a constant. The same study reports that software and utilization improvements cut the median prompt’s energy 33× in a single year, so a per-query figure also carries a date.
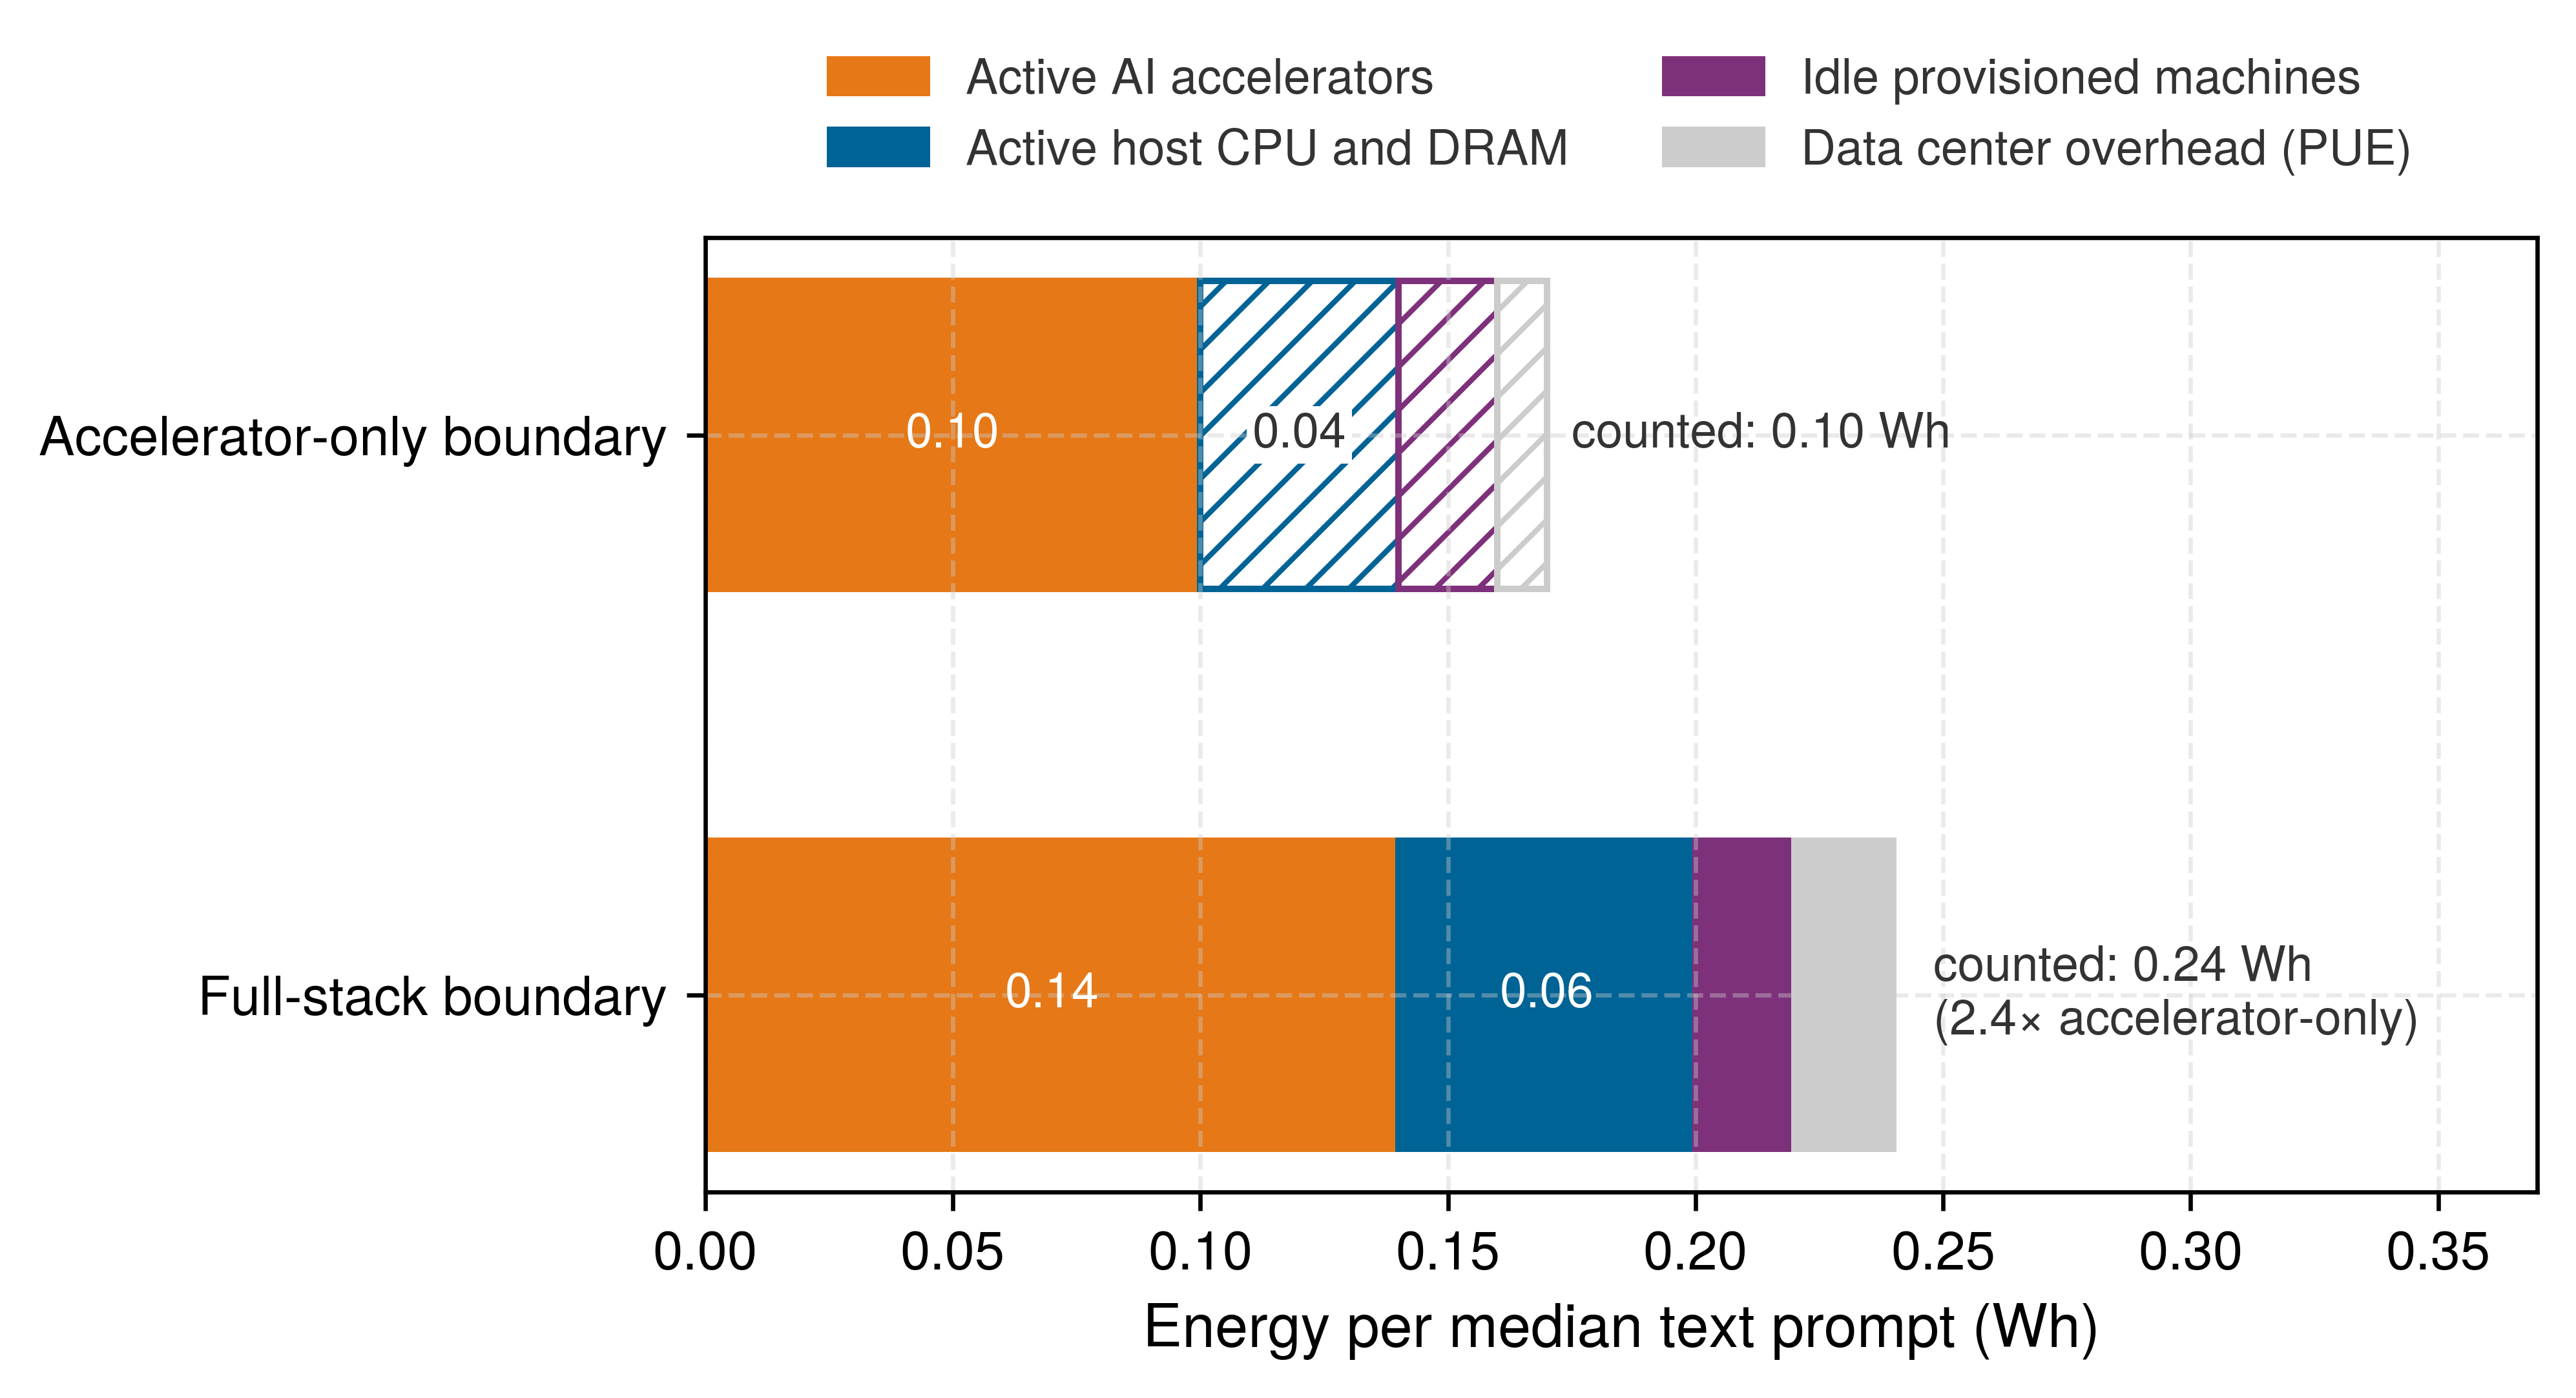
Elsworth, Cooper, Keguo Huang, David Patterson, Ian Schneider, Robert Sedivy, Savannah Goodman, Ben Townsend, et al. 2025. “Measuring the Environmental Impact of Delivering AI at Google Scale.” arXiv Preprint arXiv:2508.15734.
Checkpoint 15.4: The training-inference flip
Consider a vision model where training requires 2,000 GPU-hours at an average accelerator power draw of 300 W. Once deployed, the model serves 1 million requests per day for 730 days, with each request occupying an accelerator for 50 ms at an average draw of 100 W. Assume requests do not overlap on an accelerator. This active-only account excludes idle capacity, host systems, networking, and facility overhead.
The energy inefficiency of the decode phase
Prefill and decode stress distinct memory and arithmetic pathways, so meaningful energy comparisons require a declared serving workload. Prefill amortizes loaded weights across all prompt positions simultaneously, whereas each autoregressive decode iteration reuses weights only across active sequence batch slots to emit one token at a time (figure 12). Batch size, context length, precision, and the latency target dictate whether memory bandwidth or arithmetic execution limits realized utilization.
↩︎ Why small-batch decode is bound by memory bandwidth, and how batching reuses each weight load, is established in Batching across model architectures.
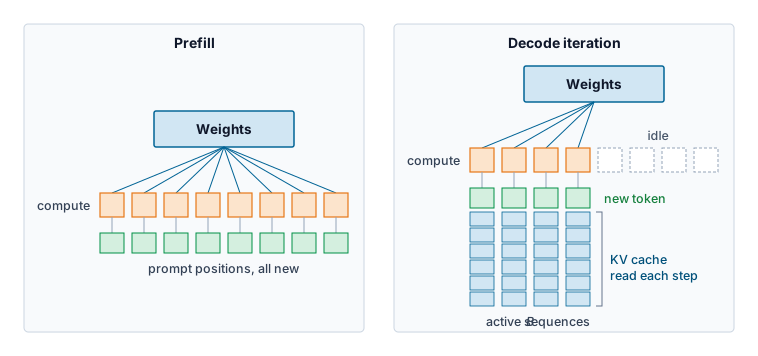
That split in dataflow governs per-token energy through data movement and arithmetic intensity. During prefill, parallel matrix operations reuse weights across prompt positions and can achieve high compute utilization when the workload exposes enough parallel work. During decode, each iteration produces one token per active sequence while accessing model parameters and an expanding KV cache. At small batches, this traffic can leave arithmetic units underused; batching improves weight reuse, subject to memory capacity and latency constraints.
The energy roofline of section 15.4.2.3 puts a number on that underuse. At batch size one, each decode step reads every FP16 weight (2 bytes) to perform two FLOPs with it, an arithmetic intensity of 1 FLOP/byte against an energy crossover of 16 FLOP/byte (equation 7). Under the chapter’s modeled coefficients, moving each parameter’s bytes from DRAM costs 320 pJ while the arithmetic on it costs 20 pJ, so movement is 16× the arithmetic and about 94 percent of the modeled dynamic energy per generated token, before any KV-cache traffic is counted. The coefficient is the table’s off-package DRAM value; the high-bandwidth memory that feeds an accelerator costs less per byte (Energy cost of data movement), which narrows the ratio without reversing it at batch one. Batching \(\BatchSize\) sequences reuses each weight load \(\BatchSize\) times and raises the intensity to \(\BatchSize\) FLOP/byte, so the two terms balance only near a batch of 16. Batching is therefore the first energy lever for decode, bounded by memory capacity for the KV cache and by the latency target.
Static power waste occurs when powered circuitry waits rather than producing useful outputs. Reducing that waiting can improve energy efficiency, but a comparison must meter the same hardware boundary and preserve output quality, context, latency, and serving load. Prompt processing and autoregressive generation perform different work; equal token counts alone do not establish a fair energy ratio.
15.7.4 Edge execution and the fleet energy account
Moving inference from a cloud data center onto a billion phones or vehicles does not make its energy cost disappear; it shifts the draw into device batteries, local thermals, and handset manufacturing. Edge intelligence runs models on user devices or nearby computing nodes, avoiding raw-input transfers to a central facility while adding or extending computation at the edge. Local processing and duty cycling reduce total energy only when the communication and remote work they avoid exceed the device’s added computation and idle power, together with device manufacturing when deployment requires new hardware, at the same task quality and service availability.
↩︎ The power, memory, and compute budgets of edge devices, and how on-device training amplifies them, are established in Design Constraints.
Sudhakar, Soumya, Vivienne Sze, and Sertac Karaman. 2023. “Data Centers on Wheels: Emissions from Computing Onboard Autonomous Vehicles.” IEEE Micro 43 (1): 29–39. https://doi.org/10.1109/mm.2022.3219803.
Running inference at the edge does not eliminate energy concerns. In autonomous vehicles, time-critical perception and control must meet response deadlines despite variable network connectivity, so onboard computation remains part of the operating budget. Sudhakar et al. (2023) model the potential emissions of a widely deployed autonomous-vehicle fleet, showing how device power and operating time can accumulate at global scale; their comparison concerns fleet-level scenarios, not an assertion that each vehicle consumes as much energy as a data center.
Smartphones, wearables, and sensors follow the same accounting. Aggregate operational energy depends on the number of devices, their power states, and the time spent in each state, so a small average draw per device can still produce a large fleet total, and attributing that total to AI requires separating the additional workload from the device’s other functions. Device power budgets constrain both local inference and learning, so the comparison must also account for duty cycling, selective cloud escalation, and the repeated computation and model transfers that federated training requires.
Edge and mobile power budgets
Edge devices operate within battery, thermal, and supply limits that differ from those of data center accelerators. These limits follow from the deployment rather than the processor’s instruction set. The engineering choice is to match each inference workload to a device that meets latency and accuracy requirements within its sustained power and energy budgets.
Power budgets reflect the physical constraints of battery capacity, thermal dissipation, and deployment environment. These constraints propagate differently across the edge AI power budget categories, from microcontrollers to vehicles (table 8). TinyML devices (microcontrollers that run small models in kilobytes of memory) must fit average demand to battery-life or harvesting targets while also supporting peak draw. Mobile devices must balance user experience with battery life, and automotive systems face thermal constraints within enclosed vehicle compartments despite having access to vehicle power.
| Platform category | Idle power | Active power | Peak power | Example devices |
|---|---|---|---|---|
| TinyML (MCU) | 1–100 \(\MicroUnitPrefix\)W | 1–50 mW | 100 mW | Arduino Nano 33, STM32H7, Nordic nRF5340 |
| Mobile NPU | 10–100 mW | 0.5–5 W | 10 W | Pixel Tensor, Apple Neural Engine, Snapdragon NPU |
| Edge GPU/TPU | 1–5 W | 5–30 W | 75 W | NVIDIA Jetson Orin NX (10–25 W) and AGX Orin (15–60 W), Google Edge TPU, RPi AI Kit |
| Autonomous Vehicle | 10–50 W | 50–200 W | 500 W | Tesla FSD Computer, Mobileye EyeQ, NVIDIA Drive |
TinyML power state dynamics
TinyML devices are the smallest members of edge fleets, sitting below the 2–10 W phones of Archetype C (Federated MobileNet) in both memory and power. Their energy efficiency is a sustainability concern because billions of edge inference calls add up to a measurable carbon footprint at fleet scale. TinyML efficiency depends heavily on duty cycling, where devices alternate between deep sleep and active inference. The duty-cycle model of equation 8 applies directly, with \(\InferenceDutyCycle = \InferenceActiveTime/\DutyCyclePeriod\) and the deep-sleep draw in place of idle power.
↩︎ The same duty-cycled power budget, applied to on-device learning rather than inference, is established in Continuous training orchestration.
Consider a keyword-spotting model on a Cortex-M4 microcontroller, an extreme case that obeys the same battery arithmetic as the Archetype C phones. The device draws 15 mW of active inference power for 20 ms in each detection cycle, falls to a deep-sleep draw of 10 microamps at 3.3 V (33 µW) between evaluations, and repeats on a 1 s detection period during continuous listening. Substituting these values into equation 8 yields the average power draw:
\[P_{\text{avg}} = 15\text{ mW} \times 0.02 + 0.033\text{ mW} \times 0.98 = 0.30 + 0.032 \approx 0.33\text{ mW}\]
A 250 mAh coin cell at 3 V nominal stores 750 mWh, enough for approximately 2,260 hours, about 94 days, under this idealized budget. The estimate covers compute only. Continuous listening also requires powered sensing and input buffering while the microcontroller sleeps, and their energy, regulator losses, and battery derating must enter any deployment estimate.
On-device learning and the battery wall
Gradient-based on-device learning costs more work and memory than inference alone. A dense gradient step needs roughly 2–3\(\times\) the forward arithmetic, with activation, gradient, and optimizer-state memory budgeted separately. The battery, thermal, and foreground-latency test that decides when a phone may admit such an update is established in Energy, heat, and background admission, and its representative phone envelope—sustained processing within 2–3 W and bursts to 5–10 W for limited periods—bounds how long an on-device update can run alongside battery energy, memory, and the update deadline, where processor TDP alone does not establish feasibility. The sustainability account adds the fleet-scale question of how much energy the admitted updates consume in total.
Napkin Math 15.8: The energy of learning
Problem: Consider fine-tuning a small language model (1B parameters) on a user’s smartphone overnight. Is this feasible within a 5 percent battery budget?
Math:
- Phone battery: Typical capacity is approximately 15 Wh, or about 54,000 J.
- Budget: 5 percent of 54,000 J = 2,700 J.
- Training cost, using illustrative per-parameter energy coefficients for a mobile accelerator (assumed for this scenario, not measured on a particular phone), with the backward pass at twice the forward cost because it computes gradients with respect to both activations and weights, so one training step costs about three forward passes:
- Forward pass: \(\approx\) 2 nJ/param.
- Backward pass: \(\approx\) 4 nJ/param.
- Total per token: 6 nJ/param \(\times 10^9\) params = 6 J/token.
- Capacity: 2,700 J / 6 J/token = 450 tokens.
Systems insight: The calculation establishes a token capacity, not whether the proposed adaptation fits. That decision also requires the token count needed to reach the quality target, the available memory, and sustained device power. If the required work exceeds the battery budget, parameter-efficient fine-tuning or sparse updates are candidates for reducing cost; their measured energy and achieved quality must establish whether they close the gap.
The local-processing decision compares the energy of the required computation with the communication and remote computation it avoids. Per-bit radio costs motivate the comparison, but the full job must also include repeated training rounds and model transfers.
Systems Perspective 15.3: The energy hierarchy
Trade-off: The architectural choice between processing data locally and sending it to the cloud is governed by an energy budget. The energy-to-communication ratio motivates comparing local work with transmission, but a decision requires the total energy of each alternative at the required quality and latency.
Energy cost per operation (approximate):
- 32-bit integer add: 0.1 pJ
- 32-bit float mult: 3.7 pJ
- Wireless transmit (1 bit): 100,000–500,000 pJ (Bluetooth/Wi-Fi)
Systems insight: Under these illustrative component costs, a transmitted bit consumes far more energy than one arithmetic operation. The radio cost is quoted per bit; per byte it reaches roughly 0.8 to 4 million pJ, about two orders of magnitude above the lower bound given for the wired network row of table 2. This motivates local processing but does not establish an offloading threshold: include memory, radio startup and protocol overhead, idle power, and remote computation in the full edge-cloud comparison. Local processing wins only when those complete terms favor it.
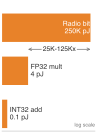
Radio transmission dwarfs local arithmetic in energy.
Energy harvesting for autonomous edge AI
TinyML can operate from harvested ambient energy when the available supply supports the full device workload. Sustained operation requires both an adequate long-term energy budget and a way to handle intervals when harvesting falls below demand, through storage, duty cycling, or suspended execution.
Ambient energy harvesting delivers from about a microwatt to about ten milliwatts per device, depending on the source (table 9). A keyword spotting model optimized to 0.5 mW average power matches the nominal output of approximately 5 cm² of indoor solar harvesting only near the top of the listed illumination range, before conversion losses and other device loads. This average-power comparison does not establish uninterrupted operation. The design must cover sensing, storage losses, and periods of dim or absent light, or permit the workload to pause. Ambient supply removes the need for purchased operating electricity only when it covers that complete budget; manufacturing, storage, maintenance, and disposal still enter the lifecycle account.
| Harvesting source | Typical power | Viable TinyML applications |
|---|---|---|
| Indoor solar (1 cm²) | 10–100 microwatts | Periodic sensor classification |
| Outdoor solar (1 cm²) | 1–10 milliwatts | Continuous keyword spotting |
| Thermoelectric (body heat) | 10–100 microwatts | Wearable gesture recognition |
| RF harvesting (Wi-Fi) | 1–10 microwatts | Ultra-low-duty sensor nodes |
| Vibration piezoelectric | 100 microwatts–1 mW | Industrial monitoring |
Cascade inference architecture
Beyond individual device efficiency, architectural patterns determine total system energy consumption across edge-cloud boundaries. A cascade architecture deploys a task-appropriate small edge model to filter inputs before cloud inference. Equation 14 expresses total energy as the sum of local processing plus probabilistically-triggered cloud costs:
\[\CascadeInferenceEnergy= \LocalInferenceEnergy + \CascadeEscalationProbability\times (\CloudOffloadEnergy + \CloudInferenceEnergy) \tag{14}\]
where \(\CascadeEscalationProbability\) is the probability of requiring cloud inference (measured on the deployment input distribution).
Consider an illustrative visual inspection system where a lightweight edge model, such as MobileNetV3-Small, consumes 0.5 mJ per image classification, whereas a high-capacity cloud model, such as ResNet-152, requires 50 mJ per inference. Transmitting an image across a cellular uplink adds 10 mJ. If the edge model resolves routine cases locally and escalates only ambiguous inputs, for an escalation rate \(\CascadeEscalationProbability\) of 10 percent, substituting these parameters into equation 14 gives the average cascade energy:
\[E_{\text{cascade}} = 0.5 + 0.10 \times (10 + 50) = 0.5 + 6.0 = 6.5 \text{ mJ/image}\]
Compared to always-cloud inference at 60 mJ per image, this illustrative cascade reduces the modeled energy by 89 percent. Quality requires a separate test of local decisions, missed escalations, and the cloud model; the energy calculation says nothing about accuracy.
Wake-word triggered systems
Always-on systems can use hierarchical wake detection to reduce average power across stages of increasing capability and draw. In this illustrative model, an analog front end consumes 10 µW while monitoring for voice activity. A detected event activates a compact neural network wake detector drawing 100 µW. A positive wake decision then triggers full-model inference at 10 mW for 50 ms. The energy calculation uses those assumed state powers and event rates; a deployed system must also account for false activations, missed wake words, and transition costs when evaluating its energy and service quality.
↩︎ The always-on budget of wake-word detection, set by how often the detector evaluates over the listening period, is established in Where adaptation pays.
For an illustrative speech-active fraction of 5 percent and a wake-event rate of 0.001 per second (one event per 1,000 s), each full-model event lasts 0.05 s. The front end draws continuously, the wake detector draws only during speech, and the full model contributes its event rate times its event energy:
\[P_{\text{avg}} = 0.01 + 0.05 \times 0.1 + 0.001 \times 10 \times 0.05 = 0.0155\text{ mW}\]
The hierarchical approach achieves 15.5 µW average power compared to 10 mW for always-active full inference, a reduction of roughly 645× within this modeled boundary. Battery lifetime also requires battery capacity, conversion losses, sensors, and other device loads.
Federated learning energy analysis
Training at the edge keeps raw data local but replaces its transfer with repeated model downloads and client-update uploads. This is the regime of Archetype C (Federated MobileNet), where phones train a shared model within a sustained power budget of a few watts. Equation 15 contrasts the energy trade-offs between federated and centralized approaches, where \(\FederatedRoundCount\) is the number of rounds, \(\ParticipatingClientCount\) is the number of participating clients per round, \(\ClientUpdateUploadEnergy\) is one client-update upload, \(\RawDataUploadEnergy\) is one client’s raw-data upload, and \(\CloudTrainingRunEnergy\) is the energy of one centralized cloud training run:
\[\FederatedTrainingEnergy= \FederatedRoundCount\left[\ParticipatingClientCount\left(\ClientLocalTrainingEnergy+ \ModelDownloadEnergy+ \ClientUpdateUploadEnergy\right) + \ServerAggregationEnergy\right]\] \[\CentralizedTrainingEnergy= \ParticipatingClientCount\times \RawDataUploadEnergy+ \CloudTrainingRunEnergy \tag{15}\]
Federated learning becomes more energy-efficient only when repeated model communication, local training, and aggregation consume less energy than raw-data transfer and centralized training at comparable model quality. The comparison must cover the same client population and account for repeated participation across rounds. Data being larger than one model update is insufficient by itself because downloads and uploads recur. Privacy and energy benefits require separate evidence: keeping raw data local does not by itself prevent updates from revealing private information, and any protection mechanism adds its own costs to the energy account.
Training, serving, and edge deployment all draw operational energy, and none of these accounts includes the hardware that performs the work. That physical supply chain, from fabrication through disposal, is the lifecycle term that remains to be counted.
Self-Check: Question
Which systems analogy and operational reality best explains why inference often dominates total lifecycle energy for widely deployed foundation models?
- Inference requires higher instantaneous wattage per accelerator than training because real-time serving disables dynamic voltage scaling.
- Training is like a one-time rocket launch that burns concentrated energy over several weeks, whereas inference is like operating a commercial airline fleet that burns energy continuously across billions of recurring user interactions over years.
- Inference models must perform a full backward pass on every user query to maintain accuracy, doubling computational cost.
- Inference cannot run on specialized accelerators, forcing cloud operators to use energy-inefficient legacy CPUs.
A distributed training job expands from 1,024 to 2,048 accelerators. Explain which mechanisms can increase communication energy and what measurements establish its share of step energy for the actual run.
Profiling an autoregressive LLM serving pipeline shows that the prefill phase achieves 55 percent Model FLOPs Utilization (MFU), while the token-generation decode phase achieves only 6 percent MFU with high HBM bandwidth utilization. What is the physical mechanism causing decode energy inefficiency?
- Decode executes in FP32 precision while prefill executes in INT4 precision.
- Prefill bypasses high-bandwidth memory entirely by storing all weights in CPU host RAM.
- Decode requires running backpropagation to generate key-value cache embeddings for each new token.
- Decode is memory-bandwidth bound: each generated token requires reading all model weights from HBM with low arithmetic intensity, leaving tensor execution units idling while drawing static leakage and clock distribution power.
A mobile application team proposes running nightly on-device full backpropagation fine-tuning for a 1B-parameter model on user smartphones. Using the concept of the ‘battery wall’, explain how to assess a 5 percent overnight battery budget and identify alternatives if the measured workload exceeds it.
A TinyML sensor runs inference for 10 ms at 20 mW active power and sleeps for 990 ms at 20 \(\mu\text{W}\) deep-sleep power during a 1-second monitoring period. Calculate the average power draw, and explain how duty cycling enables multi-year battery operation.
Order the stages of a hierarchical wake-word cascade designed to minimize average energy consumption on a smart speaker from lowest power to highest power: (1) large language model or full automatic speech recognition running on host processor or cloud, (2) small convolutional or recurrent neural network wake-word classifier verifying the trigger phrase, (3) ultra-low-power Voice Activity Detection (VAD) circuit listening continuously at microwatt power.
15.8 Hardware Lifecycle and E-Waste
The environmental cost of an AI accelerator begins long before its first FLOP is calculated (Gupta et al. 2022; Luccioni et al. 2023; NVIDIA Corporation 2025; Schneider et al. 2025). The per-H100 manufacturing footprint quantified in section 15.5.5 is incurred before the device is ever powered on.17 A training fleet of a few thousand such accelerators therefore carries a manufacturing debt of the same order as the operational emissions of a GPT-3-scale training run on the US-average grid (about 552,123 kg). A comprehensive life cycle assessment (LCA) quantifies the cumulative environmental impact across four key phases: design, manufacture, use, and disposal. LCA can reveal manufacturing as a major share of lifecycle impact, making it a critical sustainability lever that operational efficiency improvements alone cannot address. The first published LCA of an AI accelerator, covering five generations of Google’s TPU across all four phases, introduced compute carbon intensity, the lifecycle emissions per unit of computation. Unlike performance per watt, the metric charges each chip for its own manufacturing, and by that measure the TPU v6e is about 3× better than the TPU v4i (Schneider et al. 2025).
Gupta, Udit, Young Geun Kim, Sylvia Lee, Jordan Tse, Hsien-Hsin S Lee, Gu-Yeon Wei, David Brooks, and Carole-Jean Wu. 2022. “Chasing Carbon: The Elusive Environmental Footprint of Computing.” IEEE Micro 42 (4): 37–47. https://doi.org/10.1109/MM.2022.3163226.
Schneider, Ian, Hui Xu, Stephan Benecke, David Patterson, Keguo Huang, Parthasarathy Ranganathan, and Cooper Elsworth. 2025. “Life-Cycle Emissions of AI Hardware: A Cradle-to-Grave Approach and Generational Trends.” arXiv Preprint arXiv:2502.01671.
17 Life cycle assessment (LCA): Standardized by ISO 14040/14044, LCA traces environmental impact from raw material extraction through disposal (International Organization for Standardization 2006a, 2006b). For AI hardware, LCA separates embodied manufacturing emissions from operational energy use, making hardware refresh cycles and accelerator lifespan extension first-order sustainability levers that operational efficiency alone cannot substitute.
International Organization for Standardization. 2006a. ISO 14040:2006 Environmental Management – Life Cycle Assessment – Principles and Framework. ISO standard.
International Organization for Standardization. 2006b. ISO 14044:2006 Environmental Management – Life Cycle Assessment – Requirements and Guidelines. ISO standard.
These four phases organize the same emissions by time rather than by activity or reporting scope, as the second column of table 5 records, so a phase total must never be added to an activity or scope total. Evaluated across that full timeline, life cycle assessments can show that discarding functional hardware purely for modest efficiency gains causes more environmental harm through embodied carbon than it saves in operational power. The tipping point where new hardware becomes environmentally justified depends on utilization and grid intensity, a break-even worked in section 15.8.6.
Each of the four lifecycle stages adds its burden through a distinct physical mechanism (figure 13). System design fixes much of the lifetime load, manufacturing embeds carbon, water, and chemical burdens during fabrication, operation draws grid electricity for training and serving, and decommissioning produces electronic waste unless hardware is refurbished or its components recovered.
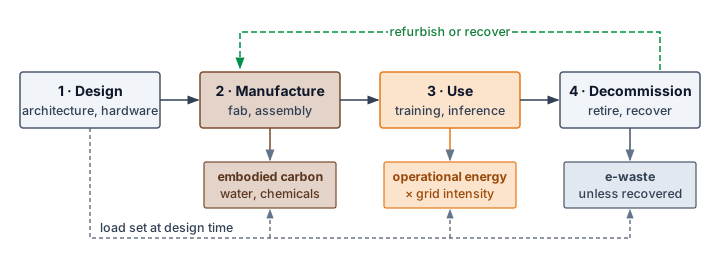
The lifecycle sequence connects design choices to costs incurred at different times. Experimentation consumes resources before deployment; manufacturing adds embodied carbon; and use couples the workload to grid and cooling constraints. Retirement creates a choice among reuse, recovery, and disposal. Extending useful service spreads the hardware’s embodied burden over more work, but it does not reverse emissions already incurred. The environmental benefit depends on the replacement it avoids and the operating cost of keeping the existing equipment in service.
15.8.1 Design and experimentation phase
Public training-energy figures almost always report the single final run that produced the published checkpoint, omitting the months of failed experiments, hyperparameter sweeps, and architecture searches that preceded it. Those preliminary runs belong to the design phase, which covers research, development, and optimization before deployment. Automated neural architecture search (NAS) can evaluate many configurations, and section 15.7.1 showed that two estimates of the same search can differ by orders of magnitude depending on whether the boundary includes proxy searches, full runs, data-center overhead, grid mix, and reuse across downstream models (Strubell et al. 2019; Patterson et al. 2021). Later efficient NAS methods use weight sharing, continuous relaxations, and hardware-aware search to reduce that search budget (Elsken et al. 2019). Excluding search does not make the remaining figures comparable either, because final runs also resist ranking by model size (table 10).
Elsken, Thomas, Jan Hendrik Metzen, and Frank Hutter. 2019. “Neural Architecture Search.” In The Springer Series on Challenges in Machine Learning, vol. 20. Springer International Publishing. https://doi.org/10.1007/978-3-030-05318-5_3.
| Model | Parameters | Energy (MWh) | Emissions (t CO2e) | t CO2e per MWh |
|---|---|---|---|---|
| T5 | 11B | 86 | 47 | 0.55 |
| Meena | 2.6B | 232 | 96 | 0.41 |
| GShard-600B | 600B | 24 | 4.3 | 0.18 |
| Switch Transformer | 1.5T | 179 | 59 | 0.33 |
| GPT-3 | 175B | 1,287 | 552 | 0.43 |
The reported final run for the 600-billion-parameter GShard model emitted under a tenth as much as the 11-billion-parameter T5 run. The table records both lower energy use and lower emissions per megawatt-hour for GShard; across the five runs, the latter quantity varies by a factor of about 3. These different workloads and operating conditions do not isolate the saving from sparse activation alone. Parameter count therefore cannot rank their emissions, and operation count would still need an execution-efficiency and grid account. Search and failed experiments require a separate development inventory before these final-run figures can support a lifecycle comparison.
Addressing the design phase’s sustainability challenges requires innovations in training efficiency: sparse training, low-precision arithmetic, weight-sharing, and energy-aware NAS approaches. Transfer learning and fine-tuning pretrained models reuse pretrained representations instead of requiring every task to be trained from scratch (Raffel et al. 2020).
15.8.2 Water, chemicals, and critical materials
Before an accelerator exists, its fabrication consumes physical resources that an energy account alone does not quantify: ultrapure water, process chemicals, and materials. Their burdens occur across extraction, refining, fabrication, and assembly sites, rather than solely where the finished hardware operates. Water demand must be evaluated against local availability and competing uses, while material supply depends on the component and manufacturing process (Jha 2014; Chen 2006). These resource accounts extend the lifecycle boundary beyond carbon without reducing unlike impacts to a single energy total.
Jha, A. R. 2014. Rare Earth Materials: Properties and Applications. CRC Press. https://doi.org/10.1201/b17045.
Chen, H.-W. 2006. “Gallium, Indium, and Arsenic Pollution of Groundwater from a Semiconductor Manufacturing Area of Taiwan.” Bulletin of Environmental Contamination and Toxicology 77 (2): 289–96. https://doi.org/10.1007/s00128-006-1062-3.
Environmental Management—Water Footprint—Principles, Requirements and Guidelines, Pub. L. Nos. ISO 14046:2014 (2014).
The Green Grid. 2011. Water Usage Effectiveness (WUE): A Green Grid Data Center Sustainability Metric. White Paper 35. The Green Grid.
Water accounting requires more than a single WUE ratio. Water withdrawal measures water removed from a source, whereas water consumption measures the portion not returned to the same watershed in a usable form. The account must separate direct on-site cooling water, which equation 3 and the cooling-tower calculation in section 15.6.3 estimate, from indirect water used to generate electricity (figure 9) and manufacture hardware, then attach each flow to its watershed, season, and local scarcity (Environmental Management—Water Footprint—Principles, Requirements and Guidelines 2014; The Green Grid 2011). One liter consumed during a wet season in a low-stress basin is not equivalent to one liter consumed during a drought in a stressed basin, so decision-grade comparisons report both physical volume and a stress-weighted result. Reclaimed-water percentages also need a declared denominator because recirculating water inside a facility can reduce withdrawal without eliminating evaporative consumption.
Semiconductor fabrication uses ultrapure water for chemical-mechanical planarization, wet etching, and wafer rinsing (Cooper et al. 2011).18 Complete environmental accounting requires auditing gross process flow, freshwater withdrawal, recycled volume, and evaporative consumption as distinct quantities, because internal reuse and flows that leave the facility change different totals (figure 14). Treatment returns reclaimed water to the intake stream and can reduce freshwater withdrawal, whereas evaporation remains a consumptive loss within the local water account. That classification does not mean the water permanently disappears from the hydrological cycle.
Cooper, Tom, Suzanne Fallender, Joyann Pafumi, Jon Dettling, Sebastien Humbert, and Lindsay Lessard. 2011. “A Semiconductor Company’s Examination of Its Water Footprint Approach.” Proceedings of the 2011 IEEE International Symposium on Sustainable Systems and Technology, 1–6. https://doi.org/10.1109/issst.2011.5936865.
18 Semiconductor water scale: A fab water inventory must separate intake, internal reuse, discharge, and consumption. Water per usable die depends on process flow, yield, allocation, and site conditions; a smaller process-node label does not establish a universal per-die multiplier.
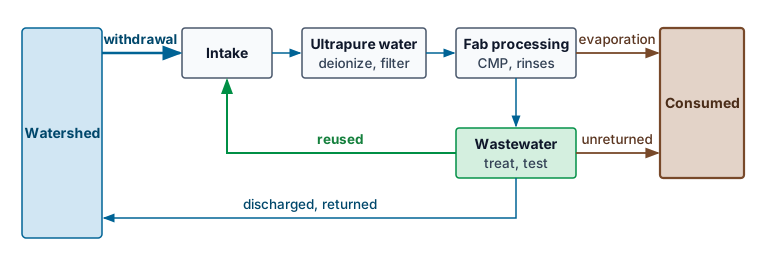
The separate flows in figure 14 show why a recycling fraction cannot determine absolute consumption. The same reuse percentage can accompany very different intake volumes and evaporative losses. Facility siting therefore requires the underlying water volumes and local watershed conditions, not a reuse percentage alone.
Fabrication also uses chemical products for etching, doping, and cleaning: strong acids such as hydrofluoric and sulfuric acid, organic solvents, and toxic dopant gases such as arsine and phosphine. Their hazard comes from toxicity, reactivity, and the treatment burden of the waste streams they produce, not from their energy content. Chemical inventories and safety data sheets identify hazardous ingredients, although undisclosed formulations can limit the assessment (Kim et al. 2018). The environmental account needs the substances and quantities used at the specific facility, together with their release and treatment pathways. An energy total alone cannot describe these chemical burdens.
Kim, Sunju, Chungsik Yoon, Seunghon Ham, Jihoon Park, Ohun Kwon, Donguk Park, Sangjun Choi, Seungwon Kim, Kwonchul Ha, and Won Kim. 2018. “Chemical Use in the Semiconductor Manufacturing Industry.” International Journal of Occupational and Environmental Health 24 (3-4): 109–18. https://doi.org/10.1080/10773525.2018.1519957.
Rhodes, Christopher J. 2019. “Endangered Elements, Critical Raw Materials and Conflict Minerals.” Science Progress 102 (4): 304–50. https://doi.org/10.1177/0036850419884873.
AI hardware and its manufacturing supply chain depend on critical materials whose supply disruption can constrain production. Criticality is not synonymous with geological rarity or membership in the rare earth group. Materials such as indium appear in critical-materials and endangered-elements analyses because supply can depend on byproduct extraction, substitution options, and recycling constraints (Rhodes 2019). The relevant dependency may lie in a processor, package, peripheral component, or fabrication process (table 11).
| Material | Application in AI semiconductor manufacturing | Supply concerns |
|---|---|---|
| Silicon (Si) | Primary substrate for chips, wafers, transistors | • Processing constraints • Geopolitical risks |
| Gallium (Ga) | GaN-based power amplifiers, high-frequency components | • Limited availability • Byproduct of aluminum and zinc production |
| Germanium (Ge) | High-speed transistors, photodetectors, optical interconnects | • Scarcity • Geographically concentrated |
| Indium (In) | Indium tin oxide, optoelectronics | • Limited reserves • Recycling dependency |
| Tantalum (Ta) | Capacitors, stable integrated components | • Conflict mineral • Vulnerable supply chains |
| Rare earth elements | Magnets, sensors, high-performance electronics | • High geopolitical risks • Environmental extraction concerns |
| Cobalt (Co) | Batteries for edge computing devices | • Human rights issues • Geographical concentration (Congo) |
| Tungsten (W) | Contact and via plugs, diffusion barriers | • Limited production sites • Geopolitical concerns |
| Copper (Cu) | On-chip interconnect wiring, heat spreaders | • Limited high-purity sources • Geopolitical concerns |
| Helium (He) | Semiconductor cooling, plasma etching, EUV lithography | • Nonrenewable • Irretrievable atmospheric loss • Limited extraction capacity |
The construction and operation of fabs and data centers also directly impact natural ecosystems through habitat disruption, water stress, and pollution from chemical discharge. Semiconductor-industry effluents can contaminate nearby fluvial sediments with heavy metals and trace elements (Hsu et al. 2016). Waste generation from fabrication, including gaseous emissions, VOC-laden air, and metal-contaminated wastewater, requires advanced treatment systems, and end-of-life hardware adds the e-waste stream examined in section 15.8.5. These water, chemical, and material demands are what fabrication spends to produce each usable accelerator, and the manufacturing phase that follows explains why an AI accelerator spends more of them than its wafer area suggests.
Hsu, Liang-Ching, Ching-Yi Huang, Yen-Hsun Chuang, Ho-Wen Chen, Ya-Ting Chan, Heng Yi Teah, Tsan-Yao Chen, Chiung-Fen Chang, Yu-Ting Liu, and Yu-Min Tzou. 2016. “Accumulation of Heavy Metals and Trace Elements in Fluvial Sediments Received Effluents from Traditional and Semiconductor Industries.” Scientific Reports 6 (1): 34250. https://doi.org/10.1038/srep34250.
15.8.3 Manufacturing phase
A wafer defect density that ruins only 5 percent of small mobile chips can ruin 20 percent or more of reticle-limit AI accelerators, forcing every working die to carry the water, chemicals, and lithography energy spent on the failed ones. The manufacturing footprint combines the embodied carbon established in section 15.5.5 with the water, chemical, and material demands in section 15.8.2, and accelerator geometry directly determines how much of that resource investment yields a usable device.
Two structural properties of AI accelerators enlarge this footprint per usable device. First, high-performance accelerators are often fabricated at or near the reticle limit, the maximum die area a single lithography exposure can print. A larger die yields fewer candidates per wafer, and because the probability that a die escapes every random defect falls roughly exponentially with its area, a defect density that kills 5 percent of small dies may kill 20 percent or more of reticle-limit dies. The water, chemicals, and lithography energy spent on every defective die must then be allocated to the working ones. Second, the memory bandwidth that large-scale training and inference require pushes accelerators toward advanced 2.5D and 3D packaging, such as TSMC’s Chip-on-Wafer-on-Substrate (CoWoS), which places high bandwidth memory stacks beside the logic die on an interposer. The inventory must include those memory stacks, the interposer, and the added assembly stages rather than counting only the accelerator die. Each usable accelerator therefore carries more process water, chemicals, and energy than its logic-die area alone suggests. Longer useful service spreads that manufacturing investment across more work, while lower-toxicity materials, recycling, and cleaner manufacturing address the production burden itself (Cenci et al. 2021; Irimia-Vladu 2014).
Cenci, Marcelo Pilotto, Tatiana Scarazzato, Daniel Dotto Munchen, Paula Cristina Dartora, Hugo Marcelo Veit, Andrea Moura Bernardes, and Pablo R. Dias. 2021. “Eco-Friendly Electronics—a Comprehensive Review.” Advanced Materials Technologies 7 (2): 2001263. https://doi.org/10.1002/admt.202001263.
Irimia-Vladu, M. 2014. “‘Green’ Electronics: Biodegradable and Biocompatible Materials and Devices for Sustainable Future.” Chemical Society Reviews 43 (2): 588–610. https://doi.org/10.1039/c3cs60235d.
15.8.4 Use phase
A GPT-3-scale training run draws 1,287 MWh over weeks of sustained cluster operation, and when those megawatt-hours are drawn matters just as much to the grid and the atmosphere as their sum. The operational energy consumed during training and inference is detailed in section 15.7; how flexible workloads shift that draw toward cleaner hours is developed in section 15.9.4. Once that active service ends, the remaining lifecycle question is what happens to the physical equipment itself.
15.8.5 Disposal, e-waste, and embedded AI
Data centers routinely retire working AI servers after three to four years—not because the silicon has failed, but because a newer generation’s memory capacity, bandwidth, or interconnect leaves the older racks uncompetitive. Those hardware upgrade cycles (Slade 2007) connect AI deployment to the broader electronic waste (e-waste) problem. In 2019, global e-waste reached roughly 54 million metric tons (Forti et al. 2020), of which 17.4 percent was documented as formally collected and recycled (Singh and Ogunseitan 2022). These totals cover electrical and electronic equipment generally, not AI hardware alone. Replacement schedules also differ from physical lifetimes; a server retired from one workload may still support another. When equipment is discarded, hazardous substances in its components require controlled recovery and treatment rather than uncontrolled dumping or processing (Grossman 2007).
Slade, G. 2007. Made to Break: Technology and Obsolescence in America. Harvard University Press. https://doi.org/10.4159/9780674043756.
Forti, V., C. P. Baldé, R. Kuehr, and G. Bel. 2020. The Global e-Waste Monitor 2020: Quantities, Flows and the Circular Economy Potential. United Nations University/United Nations Institute for Training and Research; International Telecommunication Union; International Solid Waste Association.
Singh, Narendra, and Oladele A. Ogunseitan. 2022. “Disentangling the Worldwide Web of e-Waste and Climate Change Co-Benefits.” Circular Economy 1 (2): 100011. https://doi.org/10.1016/j.cec.2022.100011.
Grossman, E. 2007. High Tech Trash: Digital Devices, Hidden Toxics, and Human Health. Island press.
Memory capacity, bandwidth, and interconnect compatibility can motivate replacement before accelerators physically fail. In tightly integrated systems, a new accelerator generation may require baseboard, networking, or server changes; PCIe-based designs can offer different upgrade options. Evaluate the actual compatibility boundary and reuse path. Replacement does not automatically mean disposal, and a functioning retired node may remain useful for less demanding workloads.
The deployment of embedded AI integrates inference into edge appliances and consumer electronics. The broader connected-device fleet (figure 15) grew from an estimated 8.6 billion devices in 2019 to 15.1 billion in 2023, with 29.4 billion projected by 2030 (Statista 2022). These counts indicate the scale of the device ecosystem, not the number of AI systems or the amount of e-waste. Waste generation also depends on service life, repair, and reuse. Adhesive enclosures, nonreplaceable batteries, and proprietary components can make repair difficult, increasing the risk that a limited failure leads to whole-device disposal (Baldé et al. 2017).
Baldé, Cornelis P, Vanessa Forti, Vanessa Gray, Ruediger Kuehr, and Paul Stegmann. 2017. “The Global e-Waste Monitor 2017: Quantities, Flows and Resources.” United Nations University, International Telecommunication Union, International Solid Waste Association.
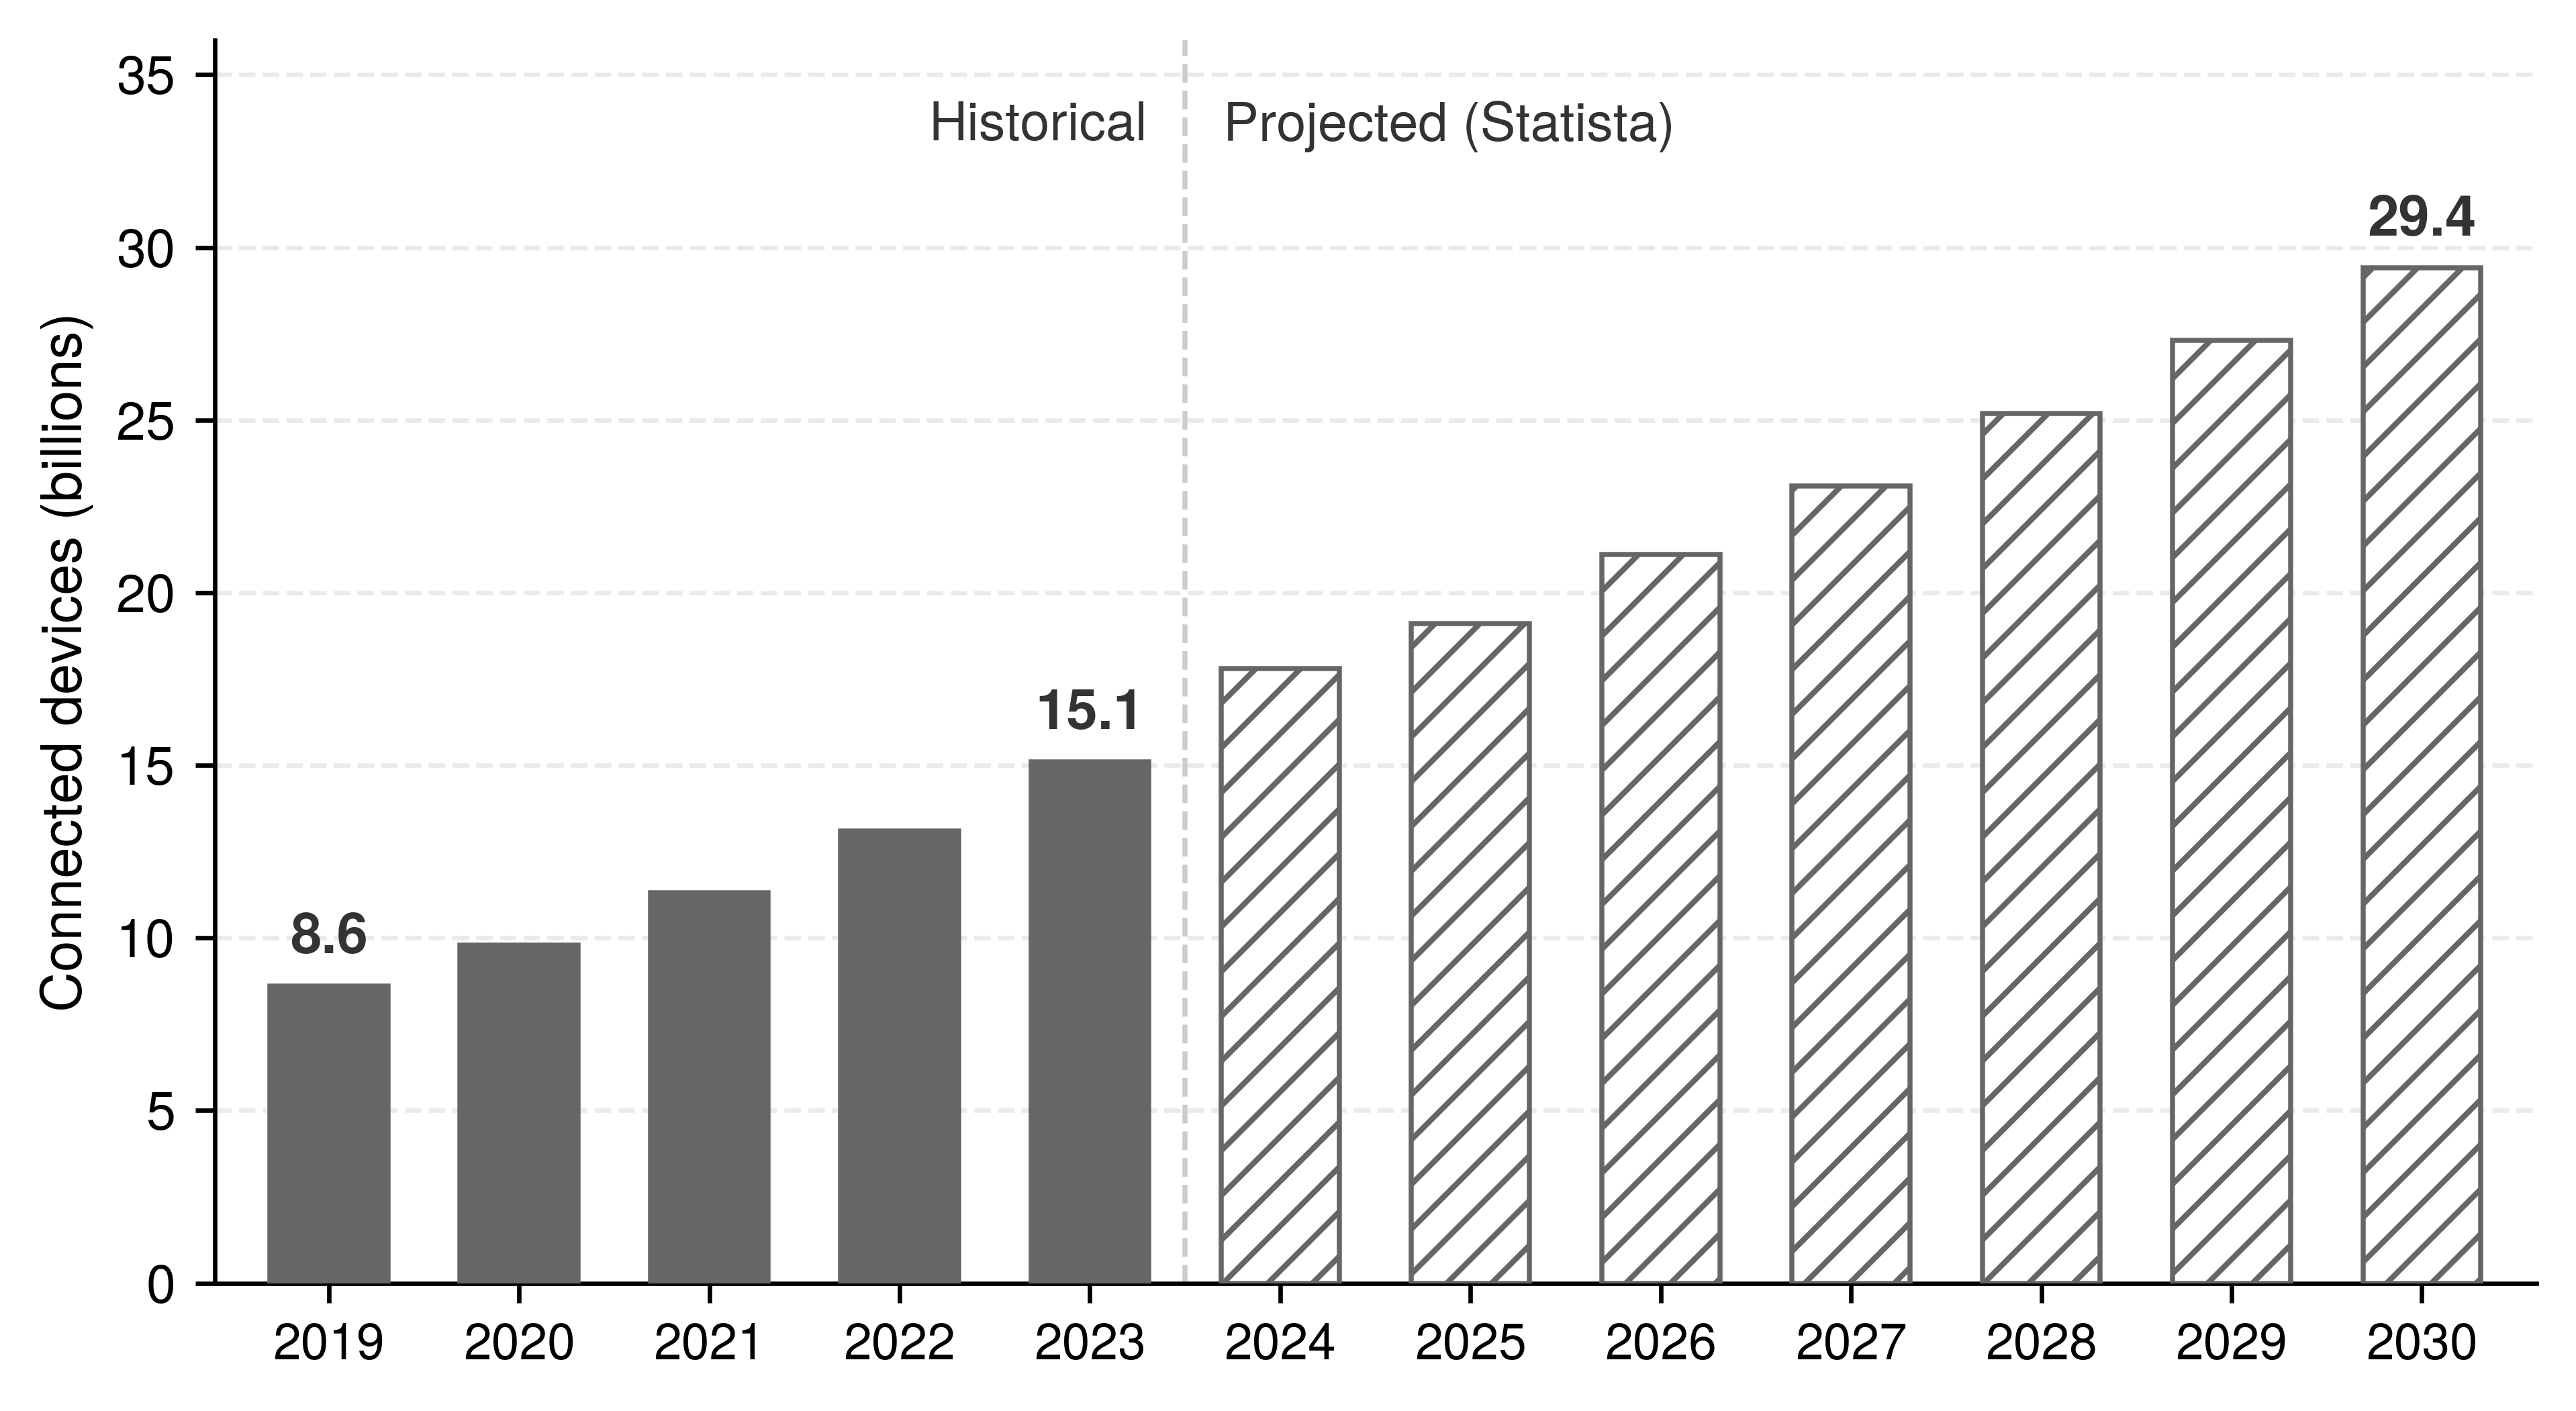
Statista. 2022. Number of Internet of Things (IoT) Connected Devices Worldwide from 2019 to 2030.
Limited software support, restricted repair, and difficult disassembly can push devices toward replacement instead of reuse. The lifecycle boundary must then follow the retired equipment to its next use or treatment destination. Moving hardware out of the operator’s inventory does not remove its environmental burden; the account must distinguish useful reuse, controlled recovery, and disposal that transfers costs to other communities.
15.8.6 Hardware lifespan extension
Keeping an AI server in useful service for 5 years instead of 3 years cuts the embodied carbon allocated to each year of operation by 40 percent. Countering the linear “take-make-dispose” model requires a shift toward a circular economy (Stahel 2016) that prioritizes reuse, refurbishment, and recycling, spreading a fixed manufacturing footprint over more service. This allocation result motivates evaluating longer use, but a claim of avoided emissions requires comparing the replacement and operating costs of the alternatives.
Stahel, Walter R. 2016. “The Circular Economy.” Nature 531 (7595): 435–38. https://doi.org/10.1038/531435a.
Federal Trade Commission. 2021. Nixing the Fix: An FTC Report to Congress on Repair Restrictions. Federal Trade Commission.
Four lifecycle interventions support longer hardware service by making systems repairable, upgradeable, supported, and reusable across their physical life. Physically, right-to-repair initiatives reduce service restrictions, including barriers to replacement parts, tools, and repair information (Federal Trade Commission 2021), while modular design separates replaceable subsystems so that an accelerator or network upgrade need not require discarding the entire chassis. Once the hardware remains serviceable, extended support cycles provide the driver updates and security patches needed to keep functioning equipment usable, and when a node eventually falls behind frontier training demands, secondary-use programs match retired accelerators to workloads they can still serve, such as batch processing, development, or research. Each intervention must preserve the performance, compatibility, and security required for useful continued operation.
These interventions move sustainability from disposal management to lifecycle engineering. A replacement decision compares two ways of delivering the same future service, continued operation of the existing fleet and operation of a replacement fleet. The original manufacturing emissions have already occurred under either choice. Replacement adds a new manufacturing burden that pays back only through operational savings over the remaining service interval, so the tipping point is the time those savings take to equal it. Suppose a replacement accelerator carries the same allocated manufacturing footprint as an H100 (164 kg CO2e) and completes the same work with 50 percent less energy. Against an existing accelerator running continuously at the rated 700 W, the replacement repays its manufacturing emissions in about 6.5 weeks on the US-average grid, but only after about 2.7 years on Quebec’s grid, nearly the whole of a 3-year standard service life. Lower utilization stretches both intervals in proportion. The same upgrade can therefore repay itself within weeks on a fossil-heavy grid and become a net loss on a clean one if the replacement leaves service before it breaks even. This accelerator-only account omits host and facility overhead, and disposal and any useful second life for the retired hardware shift it further, so a lower annual amortized figure alone cannot settle the decision. The cost side of the same refresh decision is screened in Refresh screening.
Self-Check: Question
For a fixed inventoried manufacturing footprint, what happens to annualized embodied carbon when useful hardware life extends from three years to five years, before considering changes in operational energy?
- The fixed manufacturing footprint is amortized over five years rather than three, reducing its annualized allocation by 40 percent; total lifecycle savings still depend on operational energy and the inventory boundary.
- Older accelerators automatically consume 40 percent less electrical power per FLOP as silicon pathways break in over time.
- Extending accelerator lifespans from three to five years eliminates electronic waste entirely because hardware decomposes organically after five years.
- Data center PUE automatically drops to 1.0 after servers have operated for more than four years.
A research paper reports that training a new vision-language model consumed 500 MWh for its final successful training run. Explain why reporting only the final run systematically underestimates the development phase’s total carbon footprint, and identify two mitigation practices.
True or False: If an AI training data center is powered 100 percent by dedicated geothermal and hydroelectric power, the use phase is completely unconstrained and engineers no longer need to consider grid dynamics or cooling efficiency.
Standardized under ISO 14040 and ISO 14044, a comprehensive
____evaluates the cumulative environmental impact of AI hardware across raw material extraction, manufacturing, use, and end-of-life disposal.A cloud provider considers retiring functional accelerators because a new generation offers a 12 percent improvement in performance per watt. Which option identifies a circular-economy candidate for evaluation, without claiming that this efficiency specification alone determines the lowest-emissions choice?
- Immediately shred and dispose of all prior-generation accelerators to eliminate any hardware with lower peak energy efficiency.
- Replace all servers instantly because any improvement in operational efficiency automatically offsets the embodied carbon of manufacturing a replacement fleet.
- Evaluate redeployment to compatible secondary workloads, comparing continued useful service with replacement manufacturing and measured operating emissions over the same remaining service interval.
- Overclock the older accelerators beyond thermal limits to match new hardware throughput regardless of cooling failure risk.
15.9 Mitigation Strategies
When a data center hits its absolute power ceiling, the operator cannot simply buy more GPUs. Supporting additional useful work requires reducing the power needed for that work, changing its schedule, or securing additional feasible capacity. Algorithmic optimization can reduce executed work and data movement; infrastructure changes can reduce overhead. Carbon-aware placement addresses a different constraint by changing the emissions associated with electricity use, even when energy demand stays fixed.
The measurement frameworks identify where environmental costs concentrate in a particular workload. Repeated experiments can make development dominant; sustained serving can make inference dominant; and clean electricity or limited use can increase the relative importance of manufacturing. The measured balance guides intervention. Algorithmic changes can reduce the number or cost of operations, infrastructure changes affect execution and facility overhead, and governance sets the budgets and incentives under which those choices operate.
Implementation must account for the rebound introduced with fleet growth in section 15.3, known as the Jevons paradox19 (principle 25). The tenfold-efficiency, hundredfold-volume example there supplied the arithmetic; the mechanism is that cheaper computation enables applications that were previously economically infeasible, so usage can grow enough to erase or exceed the expected energy savings. This rebound effect makes absolute outcomes, including carbon budgets, necessary companions to rate efficiency (FLOP/s per watt). Renewable sourcing changes the emissions associated with electricity but does not cap consumption. Governance must track workload growth against the intended resource budget to determine whether efficiency gains reduce the fleet’s total impact.
19 Jevons paradox: Jevons (1865) described how efficiency could stimulate demand enough to increase total coal use. Price reductions alone do not establish either energy factor; measure both unit energy and demand.
Jevons, William Stanley. 1865. The Coal Question: An Inquiry Concerning the Progress of the Nation, and the Probable Exhaustion of Our Coal Mines. Macmillan; Co.
15.9.1 Multi-layer mitigation
Compressing a model in half saves no carbon if the freed cluster capacity immediately fills with new experiments or if the job runs on a coal-heavy grid without a facility cap. Because a local efficiency gain can itself raise total consumption, mitigation must decide both which layer owns each reduction and which absolute budget contains the growth in demand that follows. Energy-efficient model design, optimized hardware deployment, sustainable infrastructure operations, and carbon-aware scheduling each attack a different term in the lifecycle footprint. Framework selection matters only insofar as it changes computation, memory movement, utilization, or reporting. Lifecycle-aware design keeps the optimization from ending at deployment by checking whether savings survive training, inference, manufacturing, and use.
Each mitigation lever acts at one accounting tier (figure 16). Work reduction and execution efficiency change IT energy; facility overhead scales that energy to the facility total; a regional grid factor converts facility kilowatt-hours into operational carbon; and hardware amortization adds embodied emissions at its own boundary. Because these terms carry different units and compound at different layers, isolated efficiency percentages cannot be multiplied into a single composite reduction factor.
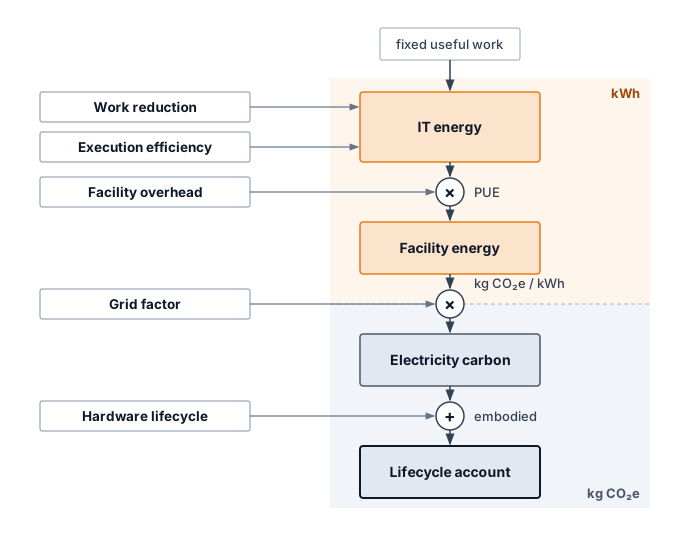
Rebound can cancel a reduction at any of these tiers. On an elastic demand curve (\(\DemandPriceElasticity> 1\)), a fall in unit cost raises volume enough to outweigh the saving (figure 17). When unit cost falls from \(\ComputeUnitCost_0\) to \(\ComputeUnitCost_1\), the green shaded area represents the saving on baseline volume \(\ComputeDemandVolume_0\). Demand expands to \(\ComputeDemandVolume_1\), creating a red area (\(\ComputeUnitCost_1 (\ComputeDemandVolume_1 - \ComputeDemandVolume_0)\)) that exceeds the original saving in this schematic. With monetary unit cost on the vertical axis, the areas measure expenditure. They represent energy only under an additional assumption that unit cost changes in proportion to energy per operation; an emissions comparison also needs the applicable carbon intensity.
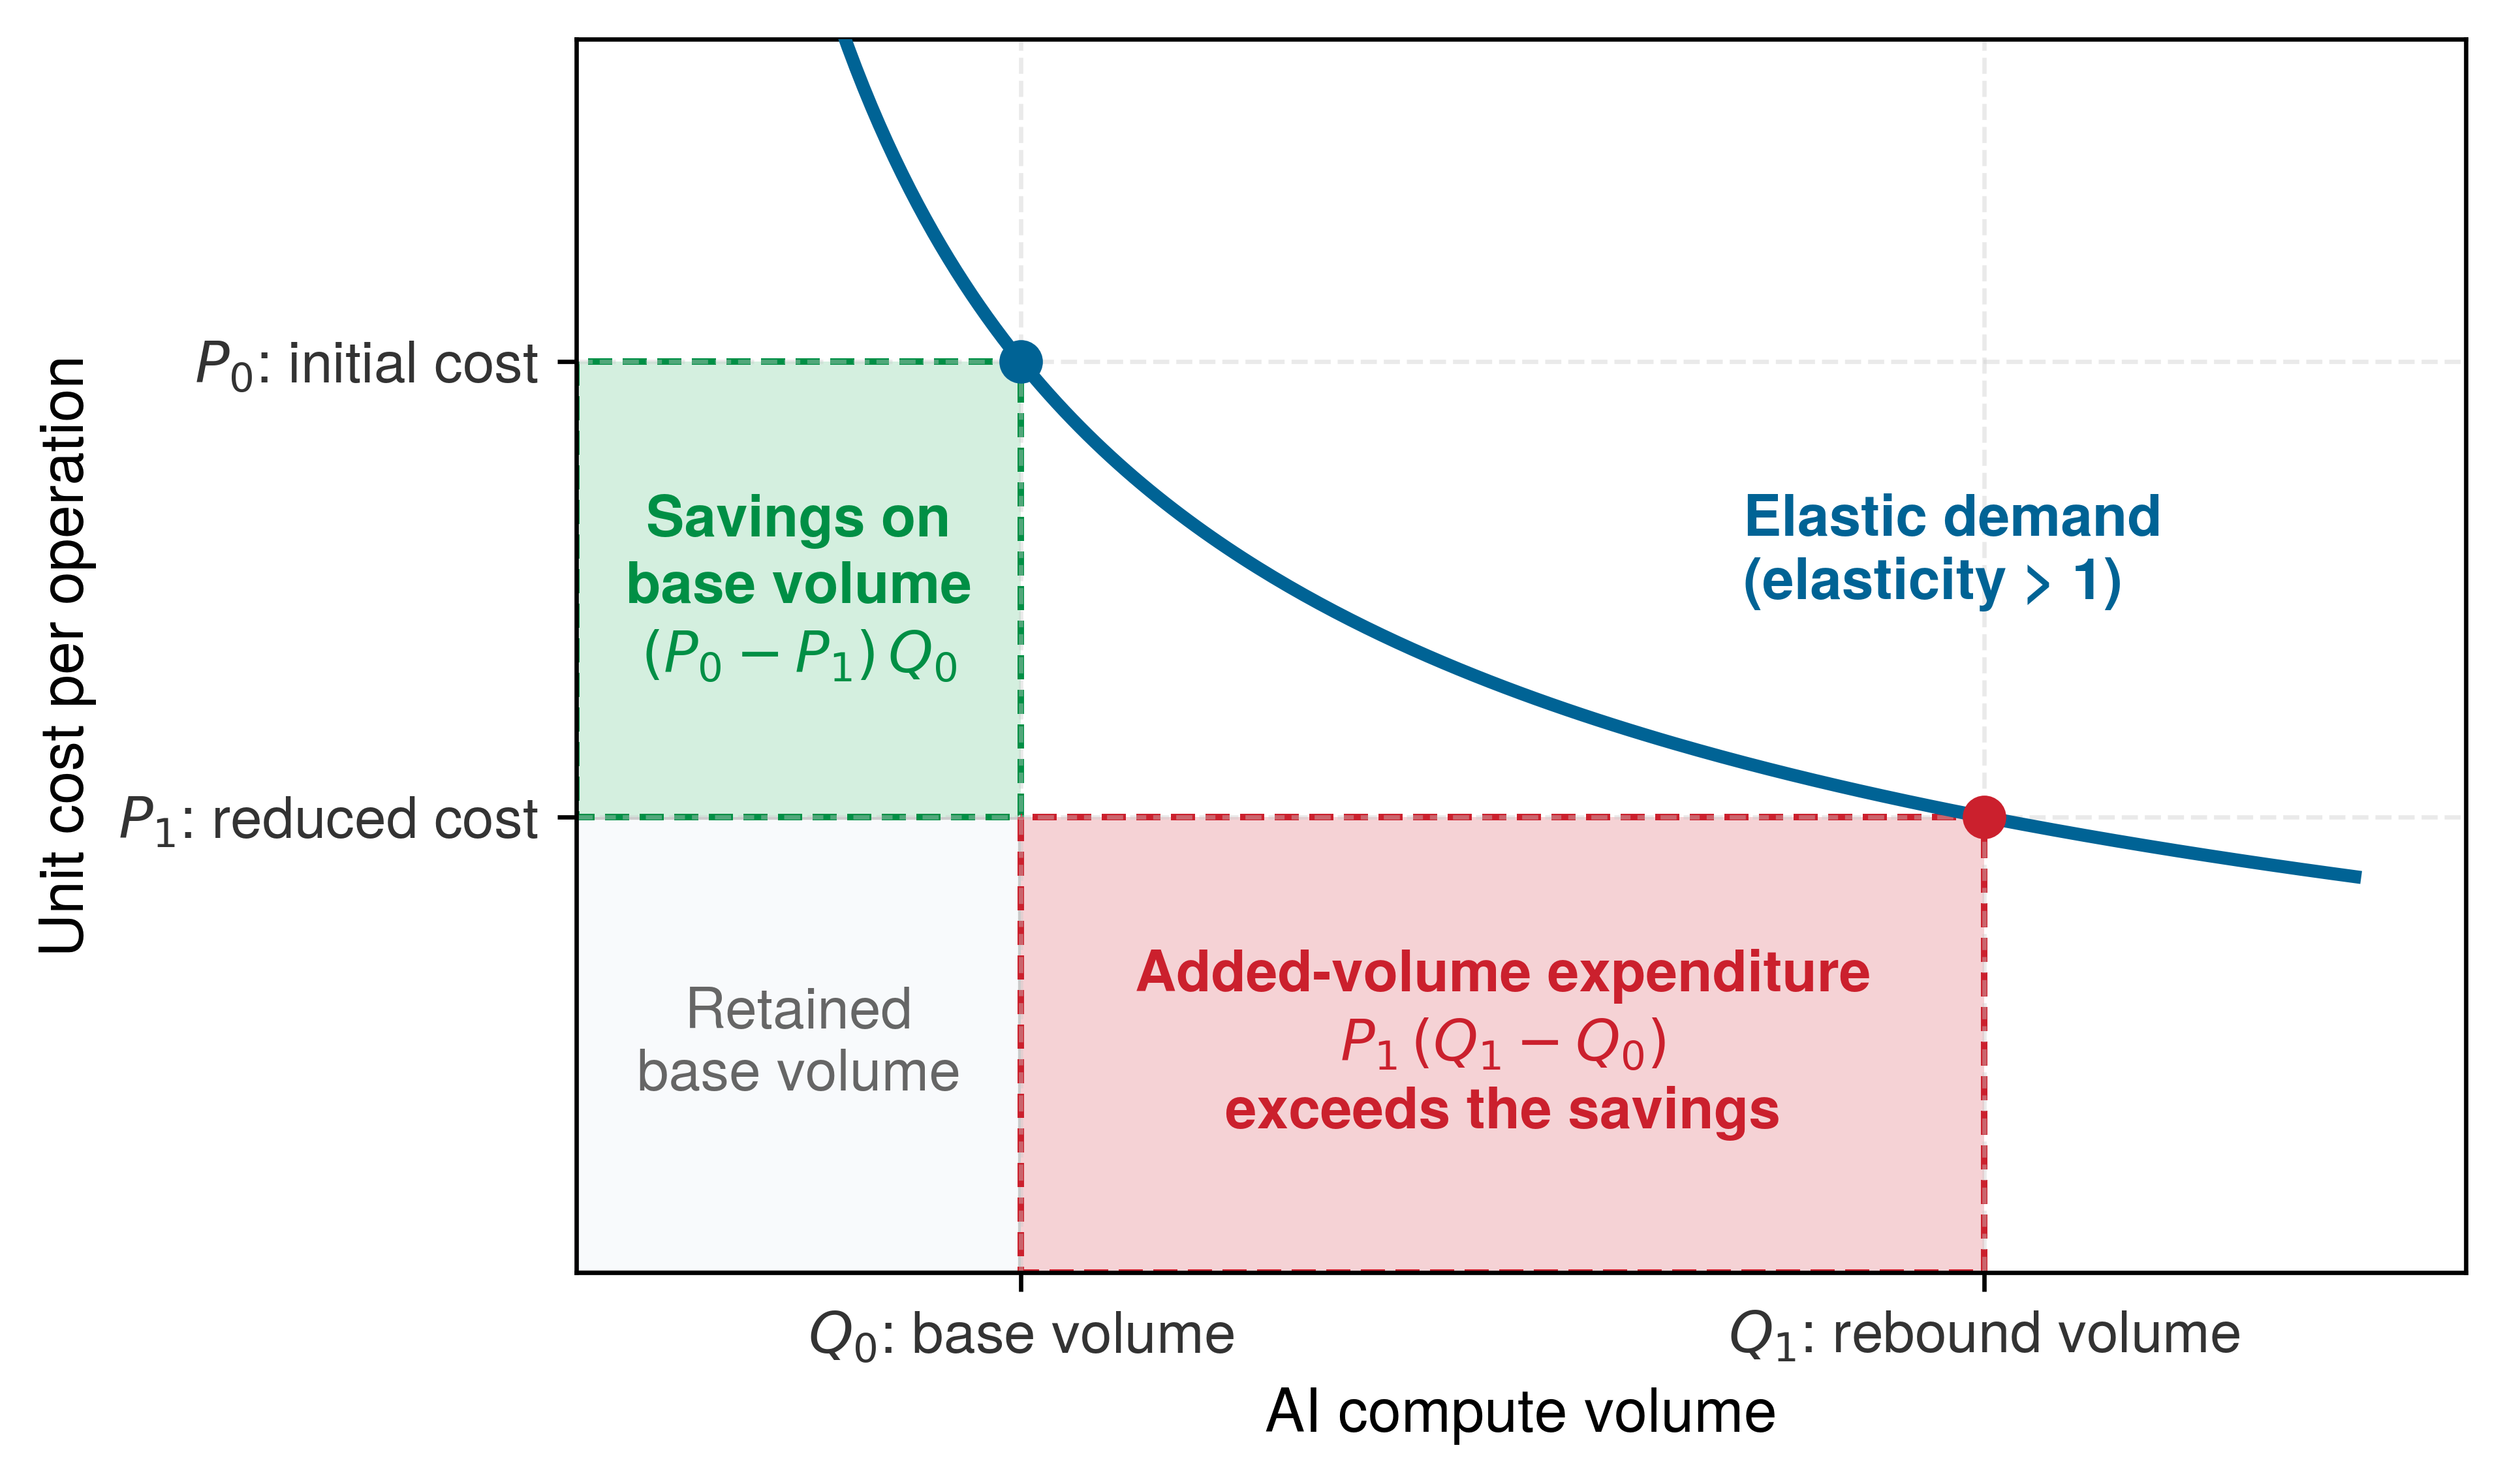
Total energy depends on measured energy per query and query volume. Demand elasticity describes how volume responds to price; translating that response into energy requires a separate account of how unit energy changes.
Checkpoint 15.5: The efficiency trap (Jevons paradox)
An engineering team optimizes a translation service, reducing measured energy per query by 50 percent (2\(\times\) efficiency gain) at fixed quality. Assume the service passes that saving through as a proportional price reduction and that grid intensity stays unchanged.
The Jevons paradox does not invalidate efficiency as a strategy; it makes governance and capacity planning part of the result. At the level of individual systems, reducing energy per useful task remains a direct sustainability lever. A reduction in latency or monetary cost is a candidate improvement whose energy effect must still be measured.
Systems Perspective 15.4: Efficiency as sustainability
Model optimizations become sustainability tools only when they reduce measured lifecycle cost at fixed quality. Pruning can remove computation and memory traffic when the hardware skips the resulting structure. Quantization reduces representation size and may accelerate supported kernels, while knowledge distillation trades additional training for a smaller serving model. Each technique can also fail to reduce wall energy when its overhead or deployment regime leaves the dominant term unchanged.
Performance engineering supplies candidate interventions, but the environmental result still needs measurement. A faster run reduces energy only if the shorter duration outweighs any increase in average power; lower memory use helps only if it removes powered work or capacity. Hardware-software co-design becomes a sustainability gain when these savings survive the lifecycle boundary and the deployed workload volume.
Sustainable AI engineering overlaps strongly with efficient AI engineering but extends beyond it. The engineering principles that enable systems to scale, perform better, and cost less to operate can also reduce environmental impact, but sustainability adds lifecycle accounting, carbon-aware placement, absolute resource budgets, water and materials constraints, and governance against rebound effects. Sustainability is an integral part of good systems engineering, not a synonym for efficiency alone.
15.9.2 Lifecycle-aware development
Spending weeks quantizing a model whose footprint is dominated by repeated architecture searches—or moving a training job to a cleaner grid when year-round serving draws ten times more electricity—solves the wrong part of the inventory. Lifecycle-aware development starts from the largest environmental term in the workload and then selects the intervention that changes that term. Algorithmic design, infrastructure optimization, operational practice, and governance reduce impact only when they are sequenced around the measured bottleneck rather than applied as a generic checklist (Uddin and Rahman 2012).
Uddin, Mueen, and Azizah Abdul Rahman. 2012. “Energy Efficiency and Low Carbon Enabler Green IT Framework for Data Centers Considering Green Metrics.” Renewable and Sustainable Energy Reviews 16 (6): 4078–94. https://doi.org/10.1016/j.rser.2012.03.014.
Energy-efficient algorithmic design
Large deep learning models can require substantial computation during training and inference. The engineering question is how much of that work a particular task needs at its required quality. Parameter count alone does not identify redundant computation, and removing weights saves energy only if the resulting implementation avoids work or data movement. Sustainable algorithm design therefore evaluates the model and its execution together, measuring energy per useful task rather than treating a smaller representation as sufficient evidence of improvement.
When the measured bottleneck is unused structure, bit width, or serving scale, the sustainable design lever changes, because each bottleneck has its own intervention on the energy term (table 12).
| Technique | Measured bottleneck | Energy mechanism | Representative evidence |
|---|---|---|---|
| Pruning | Unused model structure | Removes redundant weights, reducing model size, compute, and memory movement during inference | Structured pruning can remove complete channels or blocks; measure energy and quality for the resulting executable model |
| Quantization | Bit width | Lowers numerical precision so arithmetic units and memory transfers move fewer bits | Q8BERT demonstrates an 8-bit BERT representation with a smaller model footprint and task-dependent quality retention (Zafrir et al. 2019) |
| Knowledge distillation (Hinton et al. 2015) | Serving scale | Moves repeated inference cost into a one-time teacher-student training process | DistilBERT retains 97% of BERT accuracy with 40% fewer parameters and 60% faster inference (Sanh et al. 2019) |
Zafrir, Ofir, Guy Boudoukh, Peter Izsak, and Moshe Wasserblat. 2019. “Q8BERT: Quantized 8Bit BERT.” 2019 Fifth Workshop on Energy Efficient Machine Learning and Cognitive Computing - NeurIPS Edition (EMC2-NIPS), 36–39. https://doi.org/10.1109/emc2-nips53020.2019.00016.
Sanh, Victor, Lysandre Debut, Julien Chaumond, and Thomas Wolf. 2019. “DistilBERT, a Distilled Version of BERT: Smaller, Faster, Cheaper and Lighter.” arXiv Preprint arXiv:1910.01108, ahead of print. https://doi.org/10.48550/arXiv.1910.01108.
The table’s three levers carry different deployment caveats. Pruning and quantization save energy only when the executed kernels skip arithmetic or move fewer bytes, which depends on sparsity structure, kernel support, and conversion overhead (section 15.4.1.2). Knowledge distillation20 instead amortizes its extra training cost across repeated serving.
20 Knowledge distillation: Introduced by Hinton et al. (2015), distillation trains a compact “student” model on soft probability targets from a larger “teacher,” capturing inter-class relationships that hard labels discard. The sustainability comparison must amortize teacher and student training across the actual serving volume and measure energy at the required output quality.
Hinton, Geoffrey, Oriol Vinyals, and Jeff Dean. 2015. “Distilling the Knowledge in a Neural Network.” arXiv Preprint.
Pruning, quantization, and distillation form the core toolkit for sustainable AI development, but their sustainability value depends on the measured bottleneck. The design question is not how to implement each compression method from first principles; it is how to rank these levers against memory movement, serving volume, carbon intensity, and lifecycle cost. A prioritized strategy orders them, together with carbon-aware scheduling, by the emissions term each one changes and attacks the largest term first.
Checkpoint 15.6: Prioritizing decarbonization strategy
Deploying a 70B LLM for a latency-sensitive application:
Architectures that avoid unneeded work
Architecture is a lever beyond compressing a given model, because it sets how much work the hardware performs at all. Specialized datapaths and local data reuse can reduce energy per useful operation, but a comparison must match workload, precision, achieved quality, and measurement boundary. Chip arithmetic alone excludes memory and supporting systems; end-to-end energy also includes their activity and execution time.
Under a fixed power envelope, the cheapest joule is the one the hardware never spends, so the choice of which work an architecture performs at all bears directly on the ceiling. Alternative computing architectures expose potential sources of efficiency: selective activation, local state, and reduced communication. Comparing their energy with a dense model requires a shared task, quality threshold, latency target, and measurement boundary.
The architectural opportunity is to avoid work that the task does not need. A periodically evaluated dense model may repeat computation on unchanged inputs, while an event-driven design can respond only when a relevant signal changes. The comparison reduces to two rates. A dense model evaluated \(\DenseEvaluationRate\) times per second at energy \(\DenseEvaluationEnergy\) per evaluation draws \(\DenseEvaluationRate \DenseEvaluationEnergy\) whether or not its input changed. An event-driven design that fires \(\InputEventRate\) times per second at energy \(\EventProcessingEnergy\) draws \(\InputEventRate \EventProcessingEnergy+ \EventDetectionPower\), where \(\EventDetectionPower\) is the constant power of the circuitry that watches for events. Skipping work pays only while \(\InputEventRate \EventProcessingEnergy+ \EventDetectionPower< \DenseEvaluationRate \DenseEvaluationEnergy\), so the advantage shrinks as inputs change more often or as detection itself grows expensive. Dense execution can also reuse data and power down idle circuitry, so the comparison must examine the implemented workload rather than the architecture label alone.
Powering down inactive components helps either design only where the hardware supports it, and static power, sensing, and communication overhead remain part of the energy budget. Local learning and improved sample efficiency address different costs. Keeping an update local can reduce communication, while requiring fewer examples or optimization steps can reduce training work; neither property guarantees the other. Evaluation must include auxiliary preprocessing, adaptation, and inference costs at the required accuracy. Sparsity and sparse interconnects offer another route when execution skips arithmetic or transfers, but indexing, routing, load imbalance, and synchronization can consume the nominal saving.
Event-driven and sparse computation point toward research directions for sustainable AI. Architectures that implement spiking neural networks (SNNs), event-driven models that communicate through discrete spikes, or sparse activation patterns can reduce energy because a neuron that does not spike neither computes nor sends a message, so switching and communication track input activity rather than a fixed clock21 (Prakash et al. 2023).
21 Spiking neural networks (SNNs): Sparse spiking activity can reduce communication and switching, but the complete comparison includes training, encoding, sensing, and the hardware used to execute the model. A saving measured on one temporal task does not transfer automatically to other workloads.
Prakash, Shvetank, Matthew Stewart, Colby Banbury, Mark Mazumder, Pete Warden, Brian Plancher, and Vijay Janapa Reddi. 2023. “Is TinyML Sustainable? Assessing the Environmental Impacts of Machine Learning on Microcontrollers.” ArXiv Preprint abs/2301.11899.
These directions expand the design space without making one architecture universally sustainable. The relevant improvement is less measured lifecycle impact per useful task at the required quality and service level. Dense, sparse, and event-driven implementations must meet the same comparison contract.
Lifecycle-aware systems
Repeated model updates add to the lifecycle footprint even when each deployed version is efficient. The relevant comparison is the work required to maintain the service’s quality over time, including development and retraining; a retraining cycle that repeats the development sweep of section 15.5.2 pays its 5× final-run multiple again on every update. Transfer learning and fine-tuning can reuse a pretrained model instead of repeating training from scratch (Raffel et al. 2020), but the comparison must include adaptation, evaluation, and any additional work needed to recover quality on the target task. Reuse is a candidate saving whose value depends on that complete update cycle.
Raffel, C., N. Shazeer, A. Roberts, K. Lee, S. Narang, M. Matena, Y. Zhou, W. Li, and P. J. Liu. 2020. “Exploring the Limits of Transfer Learning with a Unified Text-to-Text Transformer.” Journal of Machine Learning Research 21 (140): 1–67.
Xu, Dianlei, Tong Li, Yong Li, Xiang Su, Sasu Tarkoma, Tao Jiang, Jon Crowcroft, and Pan Hui. 2020. “Edge Intelligence: Architectures, Challenges, and Applications.” arXiv Preprint arXiv:2003.12172.
The deployment boundary matters just as much as the training boundary. Edge deployment can reduce communication energy by running inference on specialized low-power hardware at the point of use (Xu et al. 2020), but the lifecycle account must include the embodied carbon of manufacturing and replacing those devices. Embedding LCA methodologies into AI workflows allows teams to see this trade-off early: a cloud model, an edge model, and a hybrid cascade may have different winners depending on query volume, device lifetime, grid carbon intensity, and retraining frequency (International Organization for Standardization 2006a, 2006b). Henderson et al. (2020) argue for systematic reporting of ML energy and carbon footprints precisely so these comparisons can be made consistently. As the Jevons paradox warns, the accounting must also include usage growth, because optimizing one stage may increase total impact if lower costs enable wider deployment.
Benchmarks and operating metrics
Benchmarks matter when they make efficiency visible at procurement and design time. The ML.ENERGY Leaderboard (ML.ENERGY Initiative et al. 2023) reports inference energy measurements under declared model and serving configurations. MLPerf power submissions pair performance results with system-level power measurements under benchmark rules. These results support comparisons within the stated workload, quality, and measurement conditions; converting them into carbon footprints still requires electricity and lifecycle accounting beyond the benchmark.
ML.ENERGY Initiative, Jae-Won Chung, Jiachen Gu, Zhewei Yan, Tony Lo, Yejin Park, and Mosharaf Chowdhury. 2023. The ML.ENERGY Leaderboard. SymbioticLab, University of Michigan.
The right efficiency metric depends on the serving regime. Batch inference is naturally expressed as correct samples per joule, latency-sensitive serving as queries per joule that meet the service-level objective (SLO), and generative workloads as joules per accepted output token at a declared quality threshold. Each is fleet energy productivity (equation 1.5) with useful work counted in the regime’s own unit, and those queries are the requests that SLO goodput credits (The inversion from training to inference). Raw throughput per joule rewards systems that lower accuracy, truncate outputs, or miss latency objectives. Standardization does not make one platform universally green; it fixes useful work, quality, the measurement window, and the energy denominator well enough for procurement and architecture decisions to be argued quantitatively.
For sub-watt TinyML deployments, the MLPerf Tiny benchmark suite applies this discipline to constrained devices (Banbury et al. 2021). Tasks include visual wake words, keyword spotting, anomaly detection, and image classification. The closed division constrains implementations to reference-equivalent models, while the open division permits broader model choices. Reading accuracy, latency, and energy together within the declared division prevents a change in task or model quality from masquerading as a hardware-efficiency gain.
Banbury, Colby, Vijay Janapa Reddi, Peter Torelli, Jeremy Holleman, Nat Jeffries, Csaba Kiraly, Pietro Montino, et al. 2021. “MLPerf Tiny Benchmark.” arXiv Preprint.
Energy and latency still have to be read together through the energy-delay product (EDP) (equation 16), which balances energy consumption against response time by penalizing solutions that save power only by taking too long:
\[\text{EDP} = \TotalEnergy \times \Time= \AveragePower\times \Time^2 \tag{16}\]
where \(\TotalEnergy\) is energy consumed, \(\Time\) is execution time, and \(\AveragePower\) is average power. The quadratic delay term penalizes solutions that achieve low energy through excessive delays. Lower EDP is preferable under this particular trade-off score, after quality and latency requirements have been satisfied. It does not authorize missing a service deadline or replace energy per completed task.
For TinyML deployments, EDP provides a score for comparing feasible operating points. Reducing clock frequency can lower power while extending execution; reducing voltage can lower switching energy as well, when the hardware permits it. Static power and the longer active interval can offset those gains. The preferred setting therefore comes from measured energy and delay across supported configurations, after excluding settings that miss the workload’s deadlines.
Sustainability metrics complement performance benchmarks by recording the resource cost of useful work. Regulation is beginning to require such records. The EU AI Act’s documentation obligations for covered general-purpose models, examined with the other regulatory mechanisms in section 15.10.1, include known or estimated energy consumption. Such requirements make the measurement boundary and provenance part of the reporting evidence rather than an optional annotation to a performance result.
15.9.3 Infrastructure optimization
Even the best-tuned training kernel cannot control how much power the chillers and transformers spend around the rack, or how much coal the regional grid burns to supply the substation. While algorithmic optimizations reduce operation counts, data movement, or the energy of execution, the surrounding operational environment determines the facility overhead and emissions associated with that work. Renewable energy integration, carbon-aware workload scheduling, and cooling optimization act on these surrounding terms, so each intervention must be evaluated at the boundary it changes.
A single hyperscale data center can consume over 100 MW of power, comparable to a small city.22 Renewable energy integration, advanced cooling, and AI-driven optimization offer complementary interventions. Their value depends on whether the measured problem lies in the electricity source, heat-removal overhead, or operating controls.
22 PUE gap: The PUE model in section 15.4.1.3 shows that facility overhead scales with every watt of IT load. At 100 MW, even a small PUE change therefore represents megawatts of cooling and power-delivery capacity, but its carbon value still depends on the grid signal.
Power availability and power source are connected infrastructure decisions, but annual energy matching does not establish continuous supply. Organizations training large models may locate near renewable sources or purchase renewable energy certificates (RECs) to claim the attributes of renewable generation. A certificate does not physically deliver electricity or remove the facility’s demand from the grid; the design must still provide power when and where the workload runs.
Procurement can also support additional low-carbon supply. Microsoft’s 2024 agreement with Constellation supported a planned nuclear-reactor restart, while Google’s geothermal partnership with Fervo began supplying the Nevada grid in 2023. These examples address the need for generation beyond variable wind and solar output. They do not make one generation technology mandatory; the engineering requirement is a supply portfolio that meets the facility’s demand across time, with transmission, storage, and workload flexibility accounted for.
Major cloud providers have announced renewable-energy commitments, but variable generation leaves a supply-matching problem. Storage and flexible scheduling can help address it alongside transmission and other generation sources; the appropriate combination depends on the site and workload. Google’s published 2030 target for 24/7 carbon-free energy23 illustrates the harder version of this goal: matching electricity consumption with carbon-free generation, including nuclear as well as renewables, hour by hour rather than only on an annual basis.
23 24/7 carbon-free energy (CFE): Hourly matching strengthens the time resolution of electricity procurement and accounting. Its physical impact depends on deliverability, additional clean supply, storage, and grid conditions. It does not eliminate manufacturing emissions or prove that every consumed electron came from a carbon-free generator.
Cooling overhead depends on rack density, climate, and the heat-removal design, as quantified in section 15.6.3. Liquid cooling can support dense accelerator configurations, but its energy benefit depends on the complete pumping and heat-rejection system. Control policy supplies another lever. The DeepMind case in section 15.4.1.4 shows how measured operating data can guide cooling adjustments within thermal constraints; its reported savings describe the evaluated site rather than a universal reduction for any facility.
15.9.4 Carbon-aware placement and scheduling
A batch training job that consumes the exact same megawatt-hours can emit several times more carbon if it runs during an evening fossil-gas peak or in a coal-heavy region than if it waits for a windy afternoon or runs on a hydro-heavy grid. Placement and scheduling change the emissions attributed to a fixed workload rather than the energy it uses: placement chooses the region a job runs in, and scheduling chooses its hours. Both depend on the grid signal they act on and on the additional energy the move itself causes.
↩︎ Scheduling against an external price signal, trading waiting and preemption against deadlines, is established in Cost-aware scheduling policies.
Regional grid intensity data sources
Every carbon-aware decision inherits the quality of the grid signal behind it, and the right signal depends on the decision. Grid carbon intensity varies with generation mix, which changes hourly with demand, renewable availability, and plant dispatch. The US Energy Information Administration publishes historical grid emissions factors by region, updated annually; these averages give a coarse baseline for inventories or early planning, but they cannot resolve the hourly effect of moving a flexible workload. Electricity Maps provides time-resolved, flow-traced average and lifecycle intensity estimates across covered grids, while WattTime provides marginal operating-emissions signals that estimate the generator response to added or removed load.
The two kinds of signal answer the two questions that the measurement contract (section 15.4) separated. Time-matched average factors support the attributional inventory of a completed run. Marginal factors support the consequential question of how shifting or eliminating a run would change system emissions, which is the question a scheduler asks.
Placement across regions and hours
Carbon intensity varies across geographic locations and time periods, creating optimization opportunities. Temporal scheduling can reduce emissions when deadline-tolerant workloads are shifted toward lower-carbon hours or regions, with the realized gain depending on workload flexibility, grid mix, and whether the scheduler uses average or marginal emissions (Patterson et al. 2022; Radovanovic et al. 2021). Carbon-aware scheduling automates that shift, moving flexible, nonurgent work toward times and regions with lower carbon intensity while respecting its deadline and the available capacity.
A real placement decision weighs more than the grid factor. Adding electricity prices, facility overhead, and an internal carbon price turns the comparison into a placement objective, priced as a modeled total cost of ownership (TCO) over three candidate regions (the US-average grid, Quebec, and Iowa). Notebook 15.2 isolated the grid factor by holding facility energy fixed. This objective must instead let facility overhead differ from region to region, so it starts one boundary earlier, holding the run’s IT energy fixed and letting each region apply its own PUE. That choice separates the carbon charge from the cost of facility overhead.
↩︎ The total-cost-of-ownership model that prices ownership, maintenance, and electricity is established in The TCO equation.
Example 15.1: Automated carbon-aware placement
Scenario: A team is planning a large training run requiring 10,000 MWh of IT energy, which occupies an 8,192-GPU frontier-scale cluster for about 112 days. The team is choosing among three candidate regions (US average, Quebec, and Iowa) with different facility overheads (PUE) and grid carbon intensities.
Diagnosis: With an internal carbon tax of $100/tonne, the placement model adds a carbon charge to each region’s modeled cost of ownership and selects Quebec for a total cost of $25.3M. Hardware ownership and maintenance make up most of that total and are the same in every region, so the candidates differ only in facility overhead and carbon. Without a carbon price, Quebec’s lower PUE saves about $72,000 against the US-average placement. With the tax, the US-average and Iowa placements cost $0.5M and $0.8M more than Quebec, and most of each gap is the carbon charge.
Systems lesson: Carbon-aware placement adds an explicit carbon price to the fleet scheduling objective. The selected region minimizes the modeled cost among these candidates under the stated assumptions. A deployment decision must also check capacity, data transfer, deadlines, and reliability.
The placement example compares regions using a fixed annual grid factor for each candidate. Temporal scheduling adds another decision by allowing a flexible job to wait for lower-carbon hours within one region. These are distinct levers, and their relative value depends on the available regions and the job’s deadline; section 15.9.4.3 develops the temporal lever with the marginal signal that the measurement contract assigns to it.
Time-shifting under deadlines
Carbon-aware scheduling is a load-shifting software problem. The scheduler queries one of the grid signals compared above and combines it with workload flexibility. A feasible shift must finish before the deadline, retain access to data and accelerator capacity, and preserve the job’s reliability constraints. Its net benefit must exceed checkpoint, transfer, restart, and idle-capacity emissions. Pausing useful work without reducing the cluster’s powered load can erase the expected saving.
Google’s carbon-intelligent computing platform illustrates this approach by using forecasts and virtual capacity limits to delay flexible work (Radovanovic et al. 2021). In the multi-tier accounting cascade of figure 16, temporal load shifting modulates the grid emissions factor applied to facility electricity rather than reducing raw compute FLOPs. That is a carbon intervention, not automatically an energy reduction; checkpointing, transfer, and a different runtime can also change electricity consumption.
Radovanovic, Ana, Ross Koningstein, Ian Schneider, Bokan Chen, Alexandre Duarte, Binz Roy, Diyue Xiao, et al. 2021. “Carbon-Aware Computing for Datacenters.” arXiv Preprint arXiv:2106.11750, ahead of print. https://doi.org/10.48550/arXiv.2106.11750.
Because a scheduler asks how moving a job changes emissions, it needs a marginal signal rather than the average factor an inventory uses, and the providers compared above expose signals with different methodologies and coverage. A feasible schedule must satisfy three constraints on one time axis at once, the grid carbon signal \(\text{CO}_{2,\text{grid}}(\TimeInstant)\), the job’s execution state, and cluster headroom \(\ClusterHeadroom(\TimeInstant)\) (figure 18). The job waits, checkpointed, through the high-carbon peak, runs for \(\JobDuration\) in a low-carbon trough where headroom exists, and still finishes with slack before its deadline. Waiting pays only when the avoided grid emissions exceed the checkpoint I/O, idle standby, and state migration that the wait itself causes.
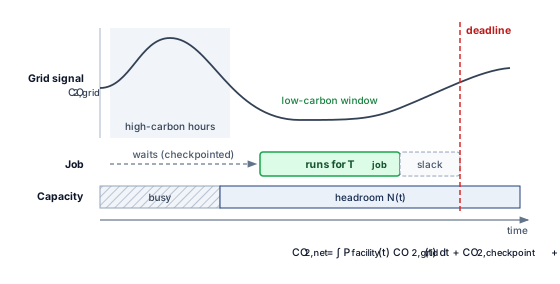
A large distributed training run draws sustained aggregate power with the correlated phase transitions described in section 15.6.2, but its completion deadline may leave scheduling flexibility. Checkpoints created for fault recovery also provide the restart points for the deliberate pause in figure 18. The decision requires a local emissions forecast and enough deadline slack; late-afternoon or overnight operation is not universally preferable. Fault tolerance thus supplies a mechanism for flexibility without proving that every pause saves emissions. Online inference has tighter delay budgets and may support bounded preemption, while offline inference can often be deferred more freely.
↩︎ Checkpoint-restart mechanics and the failure-driven choice of checkpoint interval are established in Checkpointing and Progress Preservation.
The duck curve describes the ramp in net load (demand minus variable solar and wind output) as solar generation falls in the evening. A constant data-center load raises the level of net demand but does not by itself increase the ramp rate. A flexible load can reduce the required ramp by curtailing during that interval. Schedule from local forecasts and marginal emissions signals; a universal daily pause window would ignore regional generation and transmission conditions.
Renewable generation variability complicates batch training dispatch across power grids. Over one week of November 2023, the European Union’s hourly generation mix moved across days as well as within each day (figure 19). Demand peaked each day between 326 GW and 367 GW. Nuclear held near 73 GW, solar contributed midday output, and wind ranged from 27 GW on Sunday to 111 GW on Thursday. Wind contributes to that variation, but demand, other generation, storage, and electricity exchanges also affect fossil dispatch. Carbon-aware scheduling therefore needs regional grid forecasts rather than a fixed assumption about which hours are cleanest.
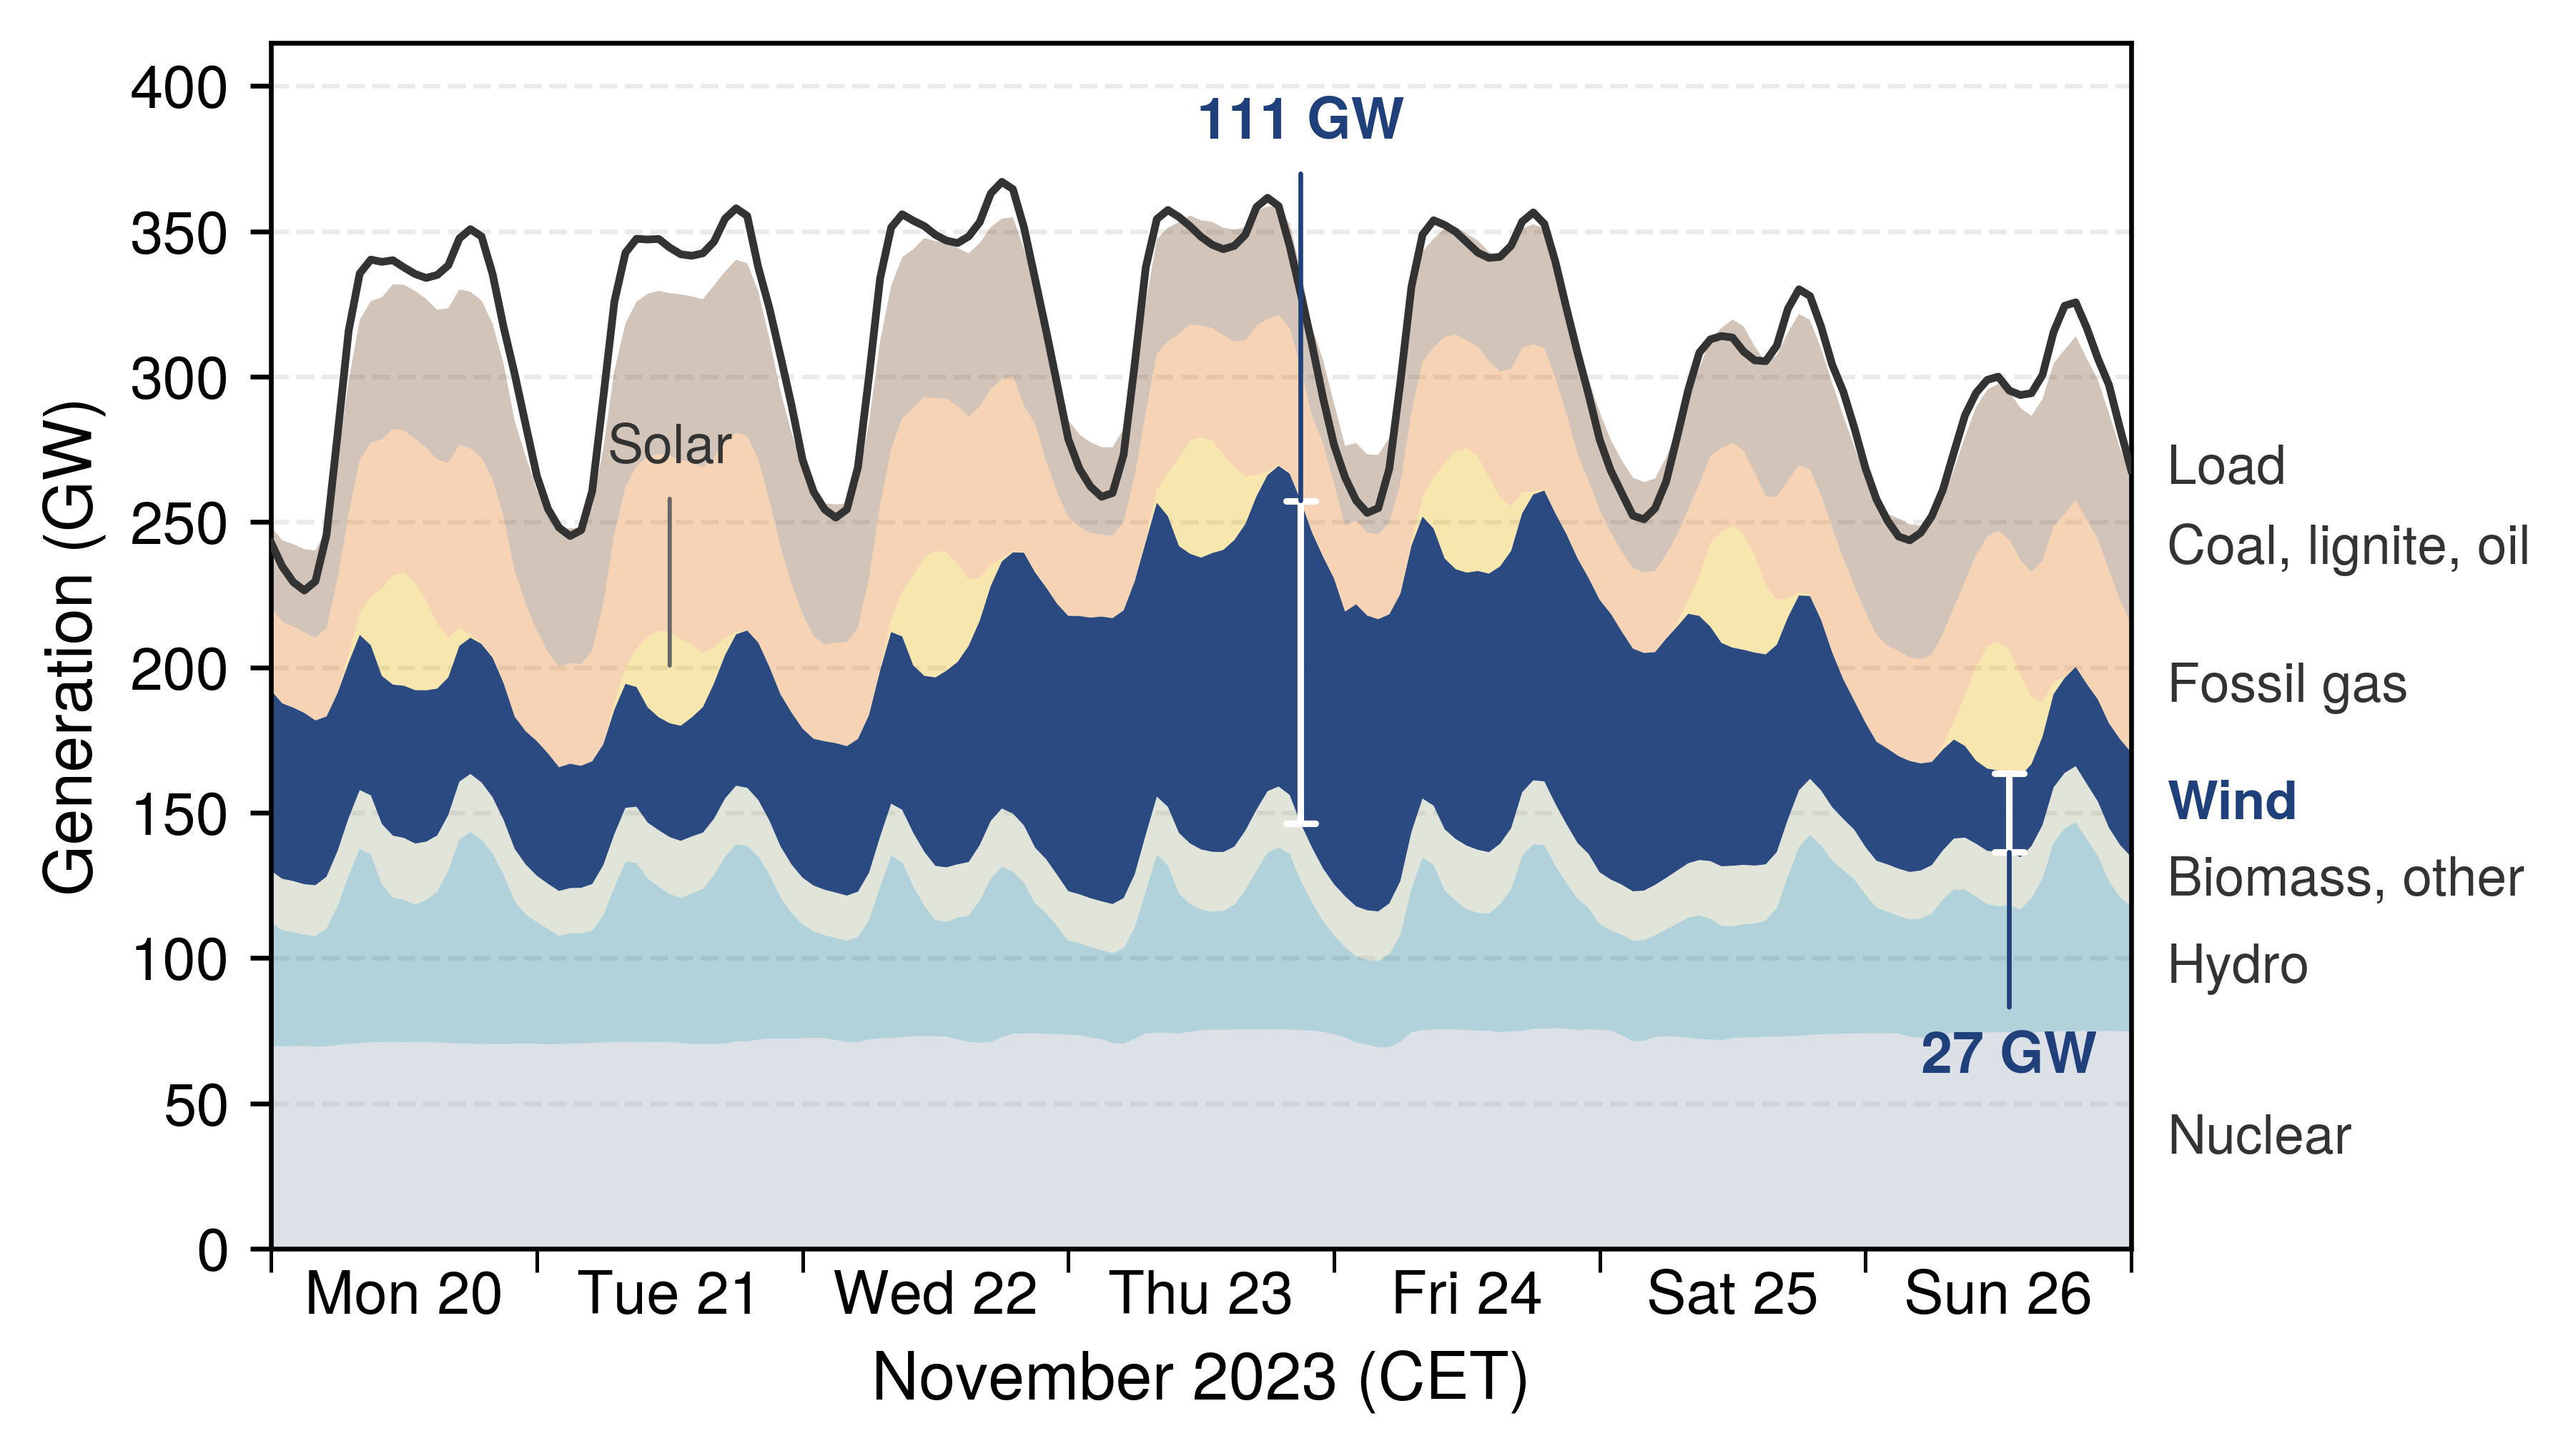
15.9.5 Google sustainability framework case study
When Google engineers compared a baseline Transformer training setup against one that combined a sparser architecture, custom TPUs, an efficient cloud facility, and a low-carbon grid, they reported an 83-fold reduction in energy and a 747-fold reduction in operational \(\text{CO}_2\) emissions (Patterson et al. 2022). The value of Google’s case study is that it groups mitigation into four levers that correspond to terms this chapter has tracked, namely the model’s work, the machine’s efficiency, the facility’s overhead, and the grid’s carbon factor. Google engineers identified these “4 Ms” (table 13) for reducing the carbon footprint of rapidly expanding AI workloads (Patterson et al. 2022).
| Lever | Intervention | Reported efficiency effect | Example mechanism |
|---|---|---|---|
| Model | Select efficient AI architectures such as sparse models or neural-architecture-search-derived designs | 5–10\(\times\) lower computation requirements without compromising model quality | Evolved Transformer and Primer |
| Machine | Use AI-specific hardware rather than general-purpose systems | 2–5\(\times\) performance-per-watt improvement; TPUs show 5–13\(\times\) greater carbon efficiency relative to nonoptimized GPUs | Tensor Processing Units |
| Mechanization | Run optimized cloud infrastructure at high utilization | 1.4–2\(\times\) energy reduction compared to conventional on-premises data centers | Lower facility PUE than the industry-average baseline used in the 2021 study |
| Map | Place data centers in regions with low-carbon electricity supplies | 5–10\(\times\) lower gross emissions | Real-time monitoring of renewable energy usage across infrastructure |
In Patterson et al. (2022), that 83-fold energy reduction and 747-fold CO2 reduction come from a consistent accounting model supported by measurements across compatible workloads and boundaries; multiplying unrelated best-case component ratios would not establish the same result. In the period studied, AI workloads also represented less than 15 percent of Google’s total energy consumption despite expanding deployment. That share is evidence about relative consumption; it does not by itself establish constant or declining absolute energy when the denominator also changes, so engineers must assess absolute growth from measured energy totals alongside the reported efficiency improvements.
Patterson, David, Joseph Gonzalez, Urs Holzle, Quoc Le, Chen Liang, Lluis-Miquel Munguia, Daniel Rothchild, David R. So, Maud Texier, and Jeff Dean. 2022. “The Carbon Footprint of Machine Learning Training Will Plateau, Then Shrink.” Computer 55 (7): 18–28. https://doi.org/10.1109/mc.2022.3148714.
Du, Nan, Yanping Huang, Andrew M. Dai, Simon Tong, Dmitry Lepikhin, Yuanzhong Xu, Maxim Krikun, et al. 2022. “GLaM: Efficient Scaling of Language Models with Mixture-of-Experts.” In International Conference on Machine Learning (ICML), edited by Kamalika Chaudhuri, Stefanie Jegelka, Le Song, Csaba Szepesvari, Gang Niu, and Sivan Sabato, vol. 162. Proceedings of Machine Learning Research. PMLR.
Empirical case studies demonstrate how sustainable-AI engineering can improve both capability and environmental impact. For example, Patterson et al. (2022) compare GPT-3 with Google’s GLaM and report improved quality metrics alongside reduced training computation and lower-carbon energy sources, while the GLaM model paper explains the mixture-of-experts architecture behind that efficient scaling (Du et al. 2022).
↩︎ Mixture-of-experts execution and the AllToAll routing it requires are established in Expert parallelism (mixture of experts).
The strategy in the case study, which combines systematic measurement, carbon-aware development, transparency in reporting, and renewable energy transition, is useful as a framework for sustainable AI scaling. The analysis also argues that earlier extrapolations overstated ML energy requirements by large factors because they did not account for efficiency improvements and workload measurement boundaries, showing why empirical measurement must replace theoretical projections.
Self-Check: Question
An AI company deploys quantization and knowledge distillation, reducing the energy cost per user query by 50 percent. Over the following year, the company’s total data center electricity consumption increases by 75 percent as lower per-query costs enable new product features and attract 3.5\(\times\) more queries. Which phenomenon explains this outcome?
- Amdahl’s law, which states that sequential execution limits parallel speedup.
- Dennard scaling breakdown, where transistor power density increases with scaling.
- Jevons paradox, where technological efficiency improvements lower the effective cost of a resource, stimulating increased demand that outweighs per-unit efficiency gains.
- The memory wall, where DRAM bandwidth fails to keep pace with arithmetic throughput.
A model compression team evaluates unstructured weight pruning, INT8 quantization, and knowledge distillation for serving a transformer. Explain the hardware mechanisms that can turn each technique into measured energy savings, and why theoretical compression alone is insufficient.
A systems team aims to overcome the energy wall for future foundation model architectures. Which design direction most directly targets the physical root cause of energy waste identified in the chapter?
- Increasing clock frequency and supply voltage to maximize compute throughput per unit silicon area.
- Enforcing dense, synchronized execution across all model layers so accelerator execution units maintain 100 percent active duty cycles.
- Adopting event-driven and sparse-activation architectures that execute compute only on salient tokens or state changes, minimizing dense data movement across memory hierarchies.
- Replacing FP16 tensor cores with FP32 standard execution units to maximize numeric accuracy per memory access.
A platform team has recurring batch training jobs that can move across regions or time while preserving quality. Which intervention is a candidate for lowering operational carbon without changing the model, provided capacity, data access, deadlines, and net emissions are checked?
- Replacing all ReLU activation functions with GELU activations across training scripts.
- Increasing the batch size to maximize GPU execution unit occupancy.
- Switching from PyTorch to a C++ inference engine for training loops.
- Implementing carbon-aware spatial and temporal scheduling to route training jobs to data center regions and time windows with surplus renewable energy and low carbon intensity.
Explain the difference between average and marginal grid emissions, and identify the evidence a scheduler needs to estimate the emissions effect of a proposed workload shift.
Order the following stages of a carbon-aware scheduler’s decision: (1) compare complete projected emissions of feasible candidates, including checkpoint, transfer, restart, and idle costs, (2) obtain documented grid forecasts and workload requirements, (3) dispatch the selected feasible action, (4) monitor progress and re-evaluate against constraints, (5) filter candidates by deadline, capacity, data access, power, cooling, and reliability requirements.
15.10 Policy, Regulation, and the Path Forward
Electricity prices reward some efficiency gains, but they need not capture water stress, manufacturing emissions, or local environmental burdens. A training cluster can reduce its electricity bill by moving to a cheaper region while increasing its emissions. If the bill omits that environmental cost, a cost-minimizing placement decision may favor the higher-emissions site. Reporting requirements expose the trade-off; carbon pricing, procurement conditions, and other policy instruments can change the incentives. Their effect depends on which activities they cover and how organizations implement them.
For a systems reader, policy is the control plane that changes the objective function. Reporting rules make hidden energy and embodied-carbon costs measurable, carbon pricing turns location into a scheduling variable, and procurement standards make lifecycle accounting part of infrastructure design. The regulatory mechanisms in section 15.10.1 matter because they determine which optimizations become economically rational at fleet scale.
15.10.1 Regulatory mechanisms
An organization training a frontier model above \(10^{25}\) FLOPs or operating a large European subsidiary can face legal requirements to disclose energy consumption and value-chain emissions—yet neither law requires metering every individual AI job. Reporting rules act at different organizational boundaries: the EU AI Act24 includes model-level technical-documentation obligations, while the Corporate Sustainability Reporting Directive (CSRD)25 addresses sustainability reporting by covered companies. Model energy records can inform both, so engineers must identify the covered entity or model, applicable dates and exemptions, and the evidence the reporting method requires.
24 EU AI Act (2024): The Act presumes high-impact capabilities above \(10^{25}\) FLOPs of training compute and imposes additional obligations on general-purpose models with systemic risk. Annex XI includes computational resources and known or estimated energy consumption in required technical documentation; qualifying open-source models without systemic risk can be exempt from these documentation obligations. Article 101 permits fines for specified provider violations up to 3 percent of annual worldwide turnover or EUR 15 million, whichever is higher. Application dates, model scope, and exemptions must be checked before turning these provisions into an engineering reporting requirement.
25 Corporate Sustainability Reporting Directive (CSRD): Directive (EU) 2026/470 narrows reporting thresholds to more than 1,000 employees and more than EUR 450 million in net annual turnover, assessed at group level where applicable. Member States must transpose its reporting amendments by March 19, 2027; entity scope, exemptions, and reporting-year rules still determine applicability. Covered reporting follows European Sustainability Reporting Standards rather than a separate inventory of AI jobs. The engineering contribution is traceable information on relevant electricity, procurement, and value-chain impacts.
26 Emissions trading for compute: Applying cap-and-trade to AI emissions is a policy analogy here, not a description of an established compute-allowance market. Such a design would need a declared emissions boundary, measurement method, enforcement mechanism, and rules for trading allowances.
Policy can also impose a priced resource constraint. A hypothetical emissions cap for AI operations would specify tonnes of CO2e and allow trading of unused emissions allowances, following the general logic of emissions trading systems (ETS).26 A power cap in MW or an energy budget in MWh would constrain different quantities and must not be called the same credit. The EU Carbon Border Adjustment Mechanism, by contrast, applies to embedded emissions in specified imported goods and electricity; it does not generally price an AI service by its compute location.
Incentives and procurement conditions can change which designs organizations choose. A grant can support efficiency research, while a procurement contract can require declared energy measurements or lifecycle evidence. These conditions need measurable criteria rather than an undefined “green” label. Scope 3 emissions also depend on whose inventory is being prepared: purchased hardware and outsourced cloud services enter the customer’s value-chain account, while the supplier classifies its own activities within its organizational boundary. The same physical emissions must not be added twice merely because two organizations report them.
15.10.2 Industry self-regulation and standards
A cloud provider can announce “100 percent annual renewable matching” while its data centers still draw fossil-generated electricity every night when solar output drops to zero. Voluntary commitments and common standards supplement government requirements, but an announced target is not evidence of a measured reduction. Annual renewable-energy matching and 24/7 carbon-free energy (CFE) address different time resolutions: hourly matching makes periods of unmatched demand visible, while the resulting physical emissions still depend on the generation and grid context (Monyei and Jenkins 2018). Evaluating a provider’s progress therefore requires the reported method and results, rather than merely its announced target.
Monyei, C. G., and Kirsten E. H. Jenkins. 2018. “Electrons Have No Identity: Setting Right Misrepresentations in Google and Apple’s Clean Energy Purchasing.” Energy Research & Social Science 46: 48–51. https://doi.org/10.1016/j.erss.2018.06.015.
Schmidt, Victor, Kamal Goyal, Aditya Joshi, Boris Feld, Liam Conell, Nikolas Laskaris, Doug Blank, Jonathan Wilson, Sorelle Friedler, and Sasha Luccioni. 2021. CodeCarbon: Estimate and Track Carbon Emissions from Machine Learning Computing. Zenodo software citation. https://doi.org/10.5281/zenodo.4658424.
Lacoste, Alexandre, Alexandra Luccioni, Victor Schmidt, and Thomas Dandres. 2019. “Quantifying the Carbon Emissions of Machine Learning.” arXiv Preprint arXiv:1910.09700.
Internal carbon pricing gives emissions a weight in project decisions. A “shadow price” lets an organization compare alternatives using both financial cost and attributed emissions; its influence depends on the price, accounting boundary, and whether decision makers use it. Measurement tools supply inputs to that comparison. Projects like CodeCarbon and ML CO2 Impact let developers estimate model carbon footprints within their workflows (Schmidt et al. 2021; Lacoste et al. 2019), but the estimates still need declared power, location, and allocation assumptions.
Standardized benchmarks provide evidence for particular efficiency claims. MLCommons defines MLPerf power-measurement protocols that connect system energy with workload performance under declared conditions. The Green Software Foundation’s Software Carbon Intensity specification addresses a different boundary, combining operational and allocated embodied emissions per functional unit. A benchmark result or a calculation method is not itself an independent sustainability audit. Accountability requires checking the reported inputs, scope, and comparison against the claim being made.
15.10.3 Public engagement and transparency
A sustainability report that trumpets a 50 percent drop in energy per query while omitting a fourfold expansion in total cluster capacity—or that leaves hardware manufacturing out of its inventory—masks a growing footprint behind a selective boundary. Misleading presentation of environmental performance, or greenwashing,27 can arise from selective boundaries or omitted trade-offs as well as unsupported offset claims. Effective AI sustainability governance requires evidence that matches the claim, combining workload telemetry with facility measurements and supply-chain inventories; runtime power counters alone cannot establish Scope 1–3 completeness or the environmental costs of manufacturing.
27 Greenwashing in AI: Typical forms are claiming “carbon neutrality” through offsets while expanding data center capacity, or highlighting per-query efficiency gains while total compute grows faster. Green-claims rules can require verifiable evidence for environmental claims. For ML engineers, the technical litmus test is whether sustainability reporting covers all three GHG Protocol scopes, or conveniently omits Scope 3 (hardware manufacturing, cloud supply chain) where much of AI’s carbon can reside.
Pledge-style disclosure is useful only when it creates auditable data rather than reputational cover. The Montréal Carbon Pledge, originally a commitment by institutional investors to measure and disclose carbon footprints annually, is a useful model precisely because its value lies in the disclosed data, not the pledge itself; the same standard applies to an AI organization, whose sustainability claims are only as credible as the workload-level measurements behind them.
15.10.4 Environmental justice and responsible development
When a hyperscale data center is sited in a drought-prone agricultural basin or beside a neighborhood served by peaking gas turbines, local residents absorb the water stress and air pollution while the model’s outputs serve users thousands of miles away. Transparency establishes the evidence base for those impacts; environmental justice asks how the burdens and benefits revealed by that evidence are distributed. Site selection is where much of that distribution is decided, which makes it an environmental-justice decision rather than a facilities decision alone. Environmental sustainability extends ML systems responsibility from model behavior to ecological stewardship (Vinuesa et al. 2020). The computational resources required for AI development concentrate environmental costs on specific communities while distributing benefits unequally across global populations. Data centers impose both grid demand and cooling-water demand, and the local burden depends on the energy mix, watershed, and competing regional uses.
Vinuesa, Ricardo, Hossein Azizpour, Iolanda Leite, Madeline Balaam, Virginia Dignum, Sami Domisch, Anna Felländer, Simone Daniela Langhans, Max Tegmark, and Francesco Fuso Nerini. 2020. “The Role of Artificial Intelligence in Achieving the Sustainable Development Goals.” Nature Communications 11 (1): 233. https://doi.org/10.1038/s41467-019-14108-y.
28 Environmental justice in data center siting: A site-cost model can omit burdens borne by nearby residents, such as competing water demand or changes to local infrastructure. A low financial cost therefore does not establish a low community burden. Site evaluation must identify who benefits, who bears the resource costs, and how affected communities participate in the decision alongside the analysis of grid intensity and water stress.
That geographic concentration creates environmental-justice risks that align with broader responsible AI frameworks.28 The fairness claim here is narrow and systems-specific. An ML fleet allocates benefits, electricity demand, water use, land pressure, and e-waste across different communities. Communities hosting AI infrastructure can bear disproportionate environmental burdens while having limited access to AI’s economic benefits.
These distributional concerns fall into four groups (figure 20). Environmental justice concerns local water withdrawal and grid strain; intergenerational equity concerns atmospheric \(\text{CO}_2\) persistence and long-lived infrastructure; resource competition concerns agricultural and municipal claims on land, water, and minerals; and the transparency gap concerns undisclosed per-model energy, carbon, and water records. Engineering acts most directly on the last group, because auditable telemetry is what allows the other three to be assessed at all; the measurement contract of section 15.4 supplies that telemetry.
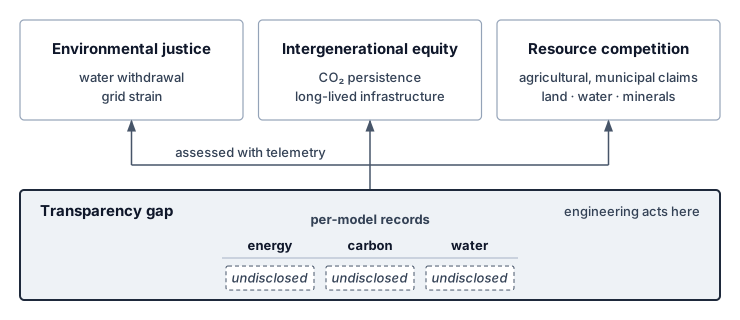
Impact assessments and community participation make these trade-offs visible before a site is committed. Any claim that such an assessment is legally required must identify the applicable jurisdiction, rule, and project scope. Where siting and governance bound the burden of current facilities, longer-term research targets the architectural and measurement limits that make AI workloads so resource-intensive in the first place.
15.10.5 Future research directions
Even after a team applies every scheduling, cooling, and compression lever in this chapter, conventional accelerators still spend most of their dynamic energy shuttling weights and activations back and forth across memory buses, while most teams still lack real-time, per-job carbon telemetry. The research agenda therefore follows the same engineering logic as the mitigation framework: reduce data movement, close the measurement gap, and avoid redundant computation. Non-von Neumann computing architectures,29 including neuromorphic computing and in-memory computing, can reduce selected transfers, extending the event-driven and spiking designs of section 15.9.2.2 from avoided work to avoided movement. Evaluate the remaining arithmetic, conversion, control, and peripheral energy at the required quality; eliminating one cost does not eliminate the whole system account.
29 Von Neumann bottleneck: Separating processing from memory requires data transfers whose energy depends on locality and arithmetic intensity. If movement contributes a fraction \(\DataMovementEnergyFraction\) of total energy, eliminating that term alone gives at most a \(1/(1-\DataMovementEnergyFraction)\) reduction factor when the remaining terms are unchanged. For an illustrative 60–80 percent share, that bound is 2.5–5\(\times\), before accounting for replacement circuitry.
Henderson, Peter, Jieru Hu, Joshua Romoff, Emma Brunskill, Dan Jurafsky, and Joelle Pineau. 2020. “Towards the Systematic Reporting of the Energy and Carbon Footprints of Machine Learning.” CoRR abs/2002.05651 (248): 1–43. https://doi.org/10.48550/arxiv.2002.05651.
A critical implementation barrier is the “measurement gap”: AI teams need standardized, workload-level reporting of energy use and carbon emissions rather than relying only on coarse proxy metrics (Henderson et al. 2020). Coarse methods often rely on proxies such as GPU-hours multiplied by average grid intensity, which fail to capture the real-world dynamics required by reporting regimes that care about time, location, and workload boundary. Developing and standardizing granular, real-time energy and carbon accounting tools is essential for both compliance and effective optimization.
A second research direction reduces redundant computation before it reaches the accelerator. Data selection, model design, and training procedure all affect the environmental cost of learning (Wu et al. 2022). Smarter data sampling, active learning, and data valuation can reduce work spent on low-value examples, but the resulting model quality and coverage must be measured rather than assumed. An integrated approach combining algorithmic efficiency, hardware innovation, renewable energy adoption, and transparent governance is necessary to align AI development with environmental constraints.
Wu, Carole-Jean, Ramya Raghavendra, Udit Gupta, Bilge Acun, Newsha Ardalani, Kiwan Maeng, Gloria Chang, et al. 2022. “Sustainable AI: Environmental Implications, Challenges and Opportunities.” Proceedings of Machine Learning and Systems 4: 795–813.
Reducing redundant computation can improve operational efficiency, but compliance and environmental benefit require their own evidence. A sustainable design must show that the saved work survives the complete lifecycle account and the resulting deployment scale. Incorrect boundaries or assumptions can otherwise turn a local improvement into a larger total footprint.
Self-Check: Question
An industry observer claims that policy interventions and carbon pricing are unnecessary because ‘free-market competition will naturally incentivize data center operators to minimize energy use and carbon emissions.’ Which counterargument best explains why market mechanisms alone fail to guarantee sustainable AI deployment?
- Data center operators are legally restricted from purchasing power from renewable energy utilities.
- Electricity prices can omit emissions and other environmental burdens, so minimizing the electricity bill need not minimize the complete environmental account; pricing, reporting, or procurement requirements can change the decision incentives.
- AI models running on renewable electricity automatically suffer from higher inference latency than models on fossil power.
- Hardware vendors have already achieved the physical thermodynamic limit of computing efficiency, leaving no room for further optimization.
How do modern regulatory frameworks such as the Corporate Sustainability Reporting Directive (CSRD) and the EU AI Act directly affect the systems engineering practices of organizations deploying large-scale AI?
- They impose an absolute global cap banning the training of any machine learning model exceeding 100 billion parameters.
- For organizations and systems within their applicable scope, they create documentation and disclosure duties that require traceable energy and sustainability evidence; the exact obligations depend on the framework and deployment.
- They mandate that all AI inference must be executed exclusively on battery-powered mobile devices rather than cloud servers.
- They require that all machine learning models be retrained weekly using uncompressed full-precision floating-point arithmetic.
Explain how an applicable emissions trading system or carbon tax changes a workload scheduler’s cost objective, and what conditions determine whether cleaner placement becomes economically preferable.
True or False: If a technology enterprise purchases enough annual Renewable Energy Certificates (RECs) to match 100 percent of its data centers’ annual electricity consumption, its evening foundation-model inference workloads running on a fossil-fueled regional grid can be accurately characterized as zero-carbon operations.
Explain how future non-von-Neumann computing paradigms (such as neuromorphic computing and in-memory analog computing) address the fundamental physical bottleneck responsible for AI energy consumption.
15.11 Fallacies and Pitfalls
Sustainability involves counterintuitive physics where efficiency improvements can increase total consumption and geographic choices can outweigh component-level optimizations. These fallacies and pitfalls capture errors that waste compute budgets and planetary resources through misallocated optimization effort.
Fallacy: Cloud computing automatically makes AI systems more environmentally sustainable.
Engineers assume cloud providers operate efficiently and sustainably. Cloud infrastructure can improve utilization and facility efficiency, but it transfers neither the physical footprint nor the customer’s accounting responsibility out of existence. The 7B model trained on 64 A100s in notebook 15.5 emits roughly 21.5× as much CO2 on the US-average grid as on Quebec’s hydroelectric grid, and the hydroelectric figure is an operational factor, not a lifecycle-zero one. As demonstrated in section 15.5, cloud comparisons must disclose region, energy boundary, utilization, embodied allocation, and whether the electricity is Scope 2 for the provider or Scope 3 for the customer.
Pitfall: Focusing only on operational energy consumption while ignoring embodied carbon and lifecycle impacts.
Teams optimize training efficiency while ignoring manufacturing emissions. In low-carbon grids, embodied carbon can dominate fleet-level footprint accounting. As quantified in section 15.5.5, an A100 accelerator carries roughly 150 kg CO2 from manufacturing (Luccioni et al. 2023); for the earlier 14-day, 64-A100 training run, the unamortized upfront burden is roughly 9.6 t CO2. Amortized over a 4-year service life, the share attributable to this specific job is about 90 kg. The job comparison must use that allocated share; a fleet lifecycle comparison must instead compare the full manufacturing burden against operations over the same fleet lifetime. Comparing the entire manufacturing burden with one short job’s electricity would mix boundaries. Extending hardware lifetime from 3 years to 5 years reduces amortized embodied carbon by 40 percent, but procurement decisions must also evaluate the operational cost of retaining the hardware.
Luccioni, Alexandra Sasha, Sylvain Viguier, and Anne-Laure Ligozat. 2023. “Estimating the Carbon Footprint of BLOOM, a 176B Parameter Language Model.” Journal of Machine Learning Research 24 (253): 1–15.
Fallacy: TDP is actual power consumption.
Thermal design power is a hardware design specification, not the measured power of a particular workload. Actual draw depends on the device, configured power limit, utilization, memory traffic, clocks, and idle intervals. A TDP-based calculation is a stated capacity scenario; it does not establish serving energy or facility energy. Carbon and electricity-cost estimates that drive placement decisions (section 15.5) should use measured power over the workload interval and include the support systems within the chosen boundary.
Pitfall: Using PUE as a complete environmental metric.
Data-center operators report PUE in sustainability disclosures and engineers may treat it as a complete environmental score. PUE measures only facility energy relative to IT energy. A lower-PUE facility can still cause more electricity-related emissions if its grid factor is sufficiently higher, and neither factor accounts for hardware manufacturing or local water stress. Compare matched emissions factors and complete lifecycle boundaries rather than ranking sites by PUE alone.
Fallacy: Efficiency improvements automatically reduce total environmental impact.
Engineers assume that halving inference cost cuts environmental impact in half. The Jevons paradox warns that efficiency improvements can increase total consumption by enabling expanded usage. In a rebound scenario, suppose reducing token cost from $0.06 to $0.002 per 1,000 tokens accompanies a proportional 30× reduction in measured energy per query at fixed output length and quality. A 100× increase in query volume then raises total energy by 3.3× and, at unchanged grid intensity, emissions by the same factor. Any implementation change that lowers per-query energy can still raise total energy when usage grows by a larger factor. Teams must therefore evaluate deployment volume against the intended carbon or resource budget; per-query gains alone do not control the rebound illustrated in figure 17, where the red area of new consumption at the lower unit cost completely swallows the green area of initial efficiency savings.
Pitfall: Treating carbon offsets as a substitute for reducing actual emissions.
Organizations may purchase offsets without establishing that the credited reduction is additional, durable, independently verified, and free of double counting. An offset does not change the electricity consumed by the workload or its immediate emissions. Teams should report physical emissions reductions separately from compensation claims, with the offset boundary and uncertainty visible. Geographic placement can reduce electricity-related emissions when the complete workload comparison supports it; neither an offset purchase nor a renewable label substitutes for that calculation.
Fallacy: Component-level optimization guarantees lifecycle improvement.
Teams reduce training cost to improve sustainability without analyzing deployment scale. A training change that increases serving energy must be evaluated over expected query volume: the crossover occurs when accumulated additional serving emissions exceed the one-time training saving. Edge deployment adds device manufacturing and replacement to any avoided data-center and transmission emissions. Keeping hardware longer avoids new manufacturing but may consume more operating energy than replacement. Each comparison requires the same useful service, grid-factor boundary, and lifetime; there is no universal query count or upgrade age that settles it. Effective sustainability requires the complete account in section 15.5.6.
Pitfall: Evaluating sustainability at the component boundary instead of the lifecycle boundary.
A pruned model may contain fewer weights while its sparse representation adds indexing and execution overhead. If those costs outweigh the arithmetic and transfers avoided, the smaller model need not consume less energy. The same boundary error appears when hardware teams report accelerator efficiency without procurement carbon, platform teams report PUE without grid intensity, or model teams report training emissions without expected serving volume. The lifecycle boundary in section 15.5.6 requires evaluating training, serving, embodied carbon, regional grid mix, hardware lifetime, and demand growth together before calling a change sustainable.
Self-Check: Question
True or False: Migrating a machine learning training workload from an on-premises enterprise cluster in a low-carbon region (20 \(\text{gCO}_2/\text{kWh}\)) to a commercial cloud data center in a coal-heavy region (750 \(\text{gCO}_2/\text{kWh}\)) is guaranteed to reduce the workload’s carbon footprint because hyperscale cloud providers operate at lower PUE.
A systems team aggressively compresses a model using unstructured pruning to cut training FLOPs by 60 percent. In production, serving the sparse model requires specialized, custom-fabricated NPU accelerators and requires double the serving iterations to reach quality parity. Which pitfall does this scenario illustrate, and what is the proper engineering mitigation?
- Local optimization of training compute without full-lifecycle assessment; the mitigation is conducting end-to-end Life Cycle Assessment (LCA) that accounts for hardware manufacturing, deployment scale, and serving energy before committing to architectural changes.
- Failure to apply Amdahl’s law; the mitigation is increasing CPU clock frequency.
- Violating the GHG Protocol; the mitigation is reclassifying Scope 3 emissions as Scope 1.
- Ignoring PUE; the mitigation is installing liquid cooling on the development workstations.
Explain why an offset purchase does not replace evidence of physical emissions reductions, and what must be established before claiming a reduction from placement, efficiency, or hardware reuse.
15.12 Summary
The lifecycle boundary connects training, serving, embodied carbon, grid mix, hardware lifetime, and demand growth. Sustainable AI asks whether the machine learning fleet can operate within available energy, water, and material resources even after its models and infrastructure have been optimized.
The measurement contract makes comparisons meaningful by fixing useful work, required quality, system boundaries, attribution, time, location, and uncertainty. Operational and embodied carbon accounting then identify which lifecycle term an intervention can change. Memory traffic, idle equipment, cooling, and power delivery can all consume energy beyond useful arithmetic; lower FLOP counts alone do not establish lower environmental impact.
The Fleet Law connects execution time to the fleet energy account. A step’s energy is approximately its average fleet power times \(\DistributedStepTime(\DeviceCount)\) (equation 13), so exposed communication and synchronization extend the interval over which the system draws power. Recovery adds further work outside successful steps. The C³ terms therefore matter to both performance and sustainability, although the power trace determines their energy cost. PUE extends an IT-energy estimate to the facility boundary, the grid factor attributes operational emissions, and embodied carbon adds the hardware lifecycle burden rather than converting operating joules.
Mitigation follows that diagnosis. Algorithm and hardware changes must reduce measured resource use while preserving quality, latency, and reliability; scheduling must account for grid intensity and the cost of moving work; hardware replacement must weigh operational savings against new manufacturing emissions. Water availability and the distribution of environmental burdens also matter when choosing where and how a fleet can grow.
Key Takeaways: Efficiency alone is not enough
- Power is a hard ceiling: A fleet cannot compute past the megawatts, cooling, water, and grid capacity its site can supply. Sustainability is therefore an existence constraint on model scale, not a public-relations layer around an otherwise finished architecture.
- A footprint is only as good as its boundary: An energy or carbon figure supports a comparison only when it names the functional unit, system boundary, attribution rule, carbon signal, and time and location. The boundary alone can more than double the energy reported for the same prompt.
- Demand can outrun efficiency: Lower energy per query does not ensure lower fleet energy use. At fixed work per query, total energy rises when query volume grows by a larger factor than per-query energy falls, so efficiency targets need an absolute resource budget.
- Memory traffic can dominate serving energy: During bandwidth-bound autoregressive decode, accelerators can draw power while waiting for weights and state. Quantization, batching, or memory-optimized hardware help sustainability only when they reduce measured energy at the required quality, latency, and reliability.
- Carbon starts before boot: Hardware manufacturing creates emissions before the first query runs, and its lifecycle share rises on clean grids and under low utilization. Keeping or replacing hardware therefore requires comparing new manufacturing emissions with operational savings over the same future service.
- Location changes the footprint: Moving flexible work to a cleaner grid can reduce operational carbon only when the saving exceeds transfer, restart, and idle-capacity emissions. Placement must also preserve deadlines, data access, capacity, and reliability; regional intensity ratios alone do not establish the net benefit.
- Water is its own account: Evaporative cooling saves facility energy by consuming local water, while dry cooling saves that water by spending electricity whose generation consumes water elsewhere. Report withdrawal and consumption, direct and indirect, weighted by the stress of each watershed.
Sustainability changes the scale at which efficiency must be judged. A reduction per query is a local result; the fleet result depends on how many queries run, where they run, and what hardware their service requires over time. Two forces push demand past efficiency. Scaling-driven growth is the first, as scaling laws (principle 9) price each further quality gain in more compute per model. The Jevons paradox of AI (principle 25) is the second, as cheaper work invites more of it. Both make the distinction consequential, because efficiency creates room within a resource budget while demand determines how much of that room is consumed. Deployment decisions therefore need both a useful-work efficiency target and an absolute resource budget.
What’s Next: From sustainability to responsibility
A fleet that is secure, robust, and within its power budget is not automatically fit to deploy. Security, robustness, and sustainability each answer a technical question about what a production system can support. The siting analysis in section 15.10.4 already showed that a feasible fleet can place its water, grid, and waste burdens on communities that see little of its benefit. The model’s decisions raise the same question about the people they act on. An accurate, fast model can still concentrate its errors among people with little power to challenge them. Responsible AI therefore asks who receives the system’s benefits, who bears its costs, and how an affected person can contest a decision. The carbon inventory and lifecycle account built here become one input to the assurance record that answers it. They supply evidence for that judgment; they do not settle whose interests the fleet should serve.
↪ Governance frameworks, algorithmic fairness, and ethical guardrails are developed in Responsible AI.
15.13 Self-Check Answers
Self-Check: Answer
A hyperscaler plans a 500 MW campus for a new foundation model cluster, but the local utility interconnect approval is capped at 320 MW for the next three years. The organization’s capital reserves could cover the electricity cost multiple times over. Which framing best captures why sustainable AI treats energy as a first-class engineering constraint rather than a financial or reporting concern?
- Carbon accounting frameworks mandate disclosing total planned capacity upfront, creating an administrative filing hurdle before training begins.
- Electricity price fluctuations create budget volatility, so the primary engineering intervention is financial hedging.
- Corporate sustainability reporting requires purchasing voluntary offsets for unapproved megawatts, adding financial cost without altering physical infrastructure.
- Power delivery and grid interconnect capacity impose a hard physical ceiling that capital cannot bypass on deployment timescales, making power an operational constraint that model architectures and cluster sizing must fit within.
Answer: The correct answer is D. Power delivery and grid interconnect capacity impose a hard physical ceiling that capital cannot bypass on deployment timescales, making power an operational constraint that model architectures and cluster sizing must fit within. The chapter’s central thesis is that sustainability is a physical capacity ceiling, not a financial or reporting line item: a 500 MW cluster facing a 320 MW interconnect cannot operate at planned scale regardless of capital expenditure. An administrative-reporting framing mistakes accounting disclosures for physical bounds; a financial-hedging framing treats capacity as a price risk rather than a physical limit; and a voluntary-offset framing ignores physical grid interconnect constraints.
Learning Objective: Classify energy and power delivery as physical system constraints rather than financial or reporting concerns
A research team plans a 10,000 MWh training run, measured as facility electricity. Quebec and Poland both meet its capacity, data-access, quality, and deadline requirements, and transfer overhead is negligible. The stated grid factors are approximately 20 and 820 grams of CO2 per kWh, respectively, on a common boundary. An algorithmic change would reduce facility energy in Poland by 15 percent at unchanged quality. Calculate the emissions under these alternatives and justify which offers the larger reduction in this scenario.
Answer: At the supplied factors, Quebec emits 200 tonnes of CO2 and Poland emits 8,200 tonnes. The algorithmic change in Poland lowers that result to 6,970 tonnes, so Quebec offers the larger reduction among these alternatives. This conclusion depends on the stated equal-energy baseline and feasible placements; a regional intensity ratio alone does not rank unmeasured interventions or establish the effect of shifting actual grid demand.
Learning Objective: Calculate scenario emissions and compare feasible placement and algorithmic interventions under a declared accounting boundary
True or False: Because successive generations of specialized AI accelerators deliver substantial improvements in energy efficiency (FLOP/s per watt), organizations can rely on hardware innovation alone to keep total data center power consumption flat while scaling model parameters.
Answer: False. Hardware improvements alone do not guarantee flat fleet power. Total energy depends on workload volume and realized work per joule at a consistent boundary; power also depends on the execution schedule. A historical compute-growth curve does not determine either quantity without those measurements.
Learning Objective: Evaluate the claim that hardware efficiency scaling alone can offset exponential growth in AI compute demand
Thousands of GPUs alternate between dense computation and collective communication, producing correlated changes in device power. Explain how bidirectional energy storage can buffer the change at a protected electrical boundary, and what measurements determine its timing and capacity.
Answer: When load falls, storage can absorb surplus input; when load rises, it can discharge to cover the deficit while upstream supply responds. The controller must follow the measured load and supply response at the protected boundary, including losses, state of charge, and power limits. Device-side changes need not propagate unchanged to the grid, and buffering can act during a transition rather than only after it.
Learning Objective: Explain how energy storage buffers synchronized training load changes and identify the measurements needed to size it
Self-Check: Answer
A 2,000 MWh training run can be placed at a site whose annual-average grid factor is 400 g CO2 per kWh or at one whose factor is 20 g CO2 per kWh, with facility electricity held equal. Which conclusion follows?
- The cleaner site also cuts the run’s energy twentyfold, because low-carbon grids deliver electricity more efficiently.
- Attributed emissions fall from about 800 tonnes to about 40 tonnes, a twentyfold difference that isolates the grid factor at equal facility energy.
- This comparison alone ranks placement against an algorithmic change, because both reduce emissions.
- Waiting for cleaner hours at the cleaner site would multiply the saving by a further twentyfold.
Answer: The correct answer is B. Emissions equal facility energy times the grid factor, so 2,000,000 kWh gives about 800 tonnes at 400 g per kWh and about 40 tonnes at 20 g per kWh. The grid factor changes attributed emissions, not the energy the run consumes. A placement comparison isolates one factor and cannot rank an unmeasured algorithmic change, and a temporal gain cannot simply be multiplied onto an annual-average placement gain.
Learning Objective: Calculate attributed training emissions from facility energy and grid factor, and identify what a placement comparison does and does not establish.
True or False: Because training compute for notable models has grown by many orders of magnitude, training energy has grown by the same multiplier.
Answer: False. A compute multiplier becomes an energy multiplier only after dividing by realized work per joule at a stated boundary. Efficiency gains in hardware and execution can make energy grow more slowly than compute, so the energy trend must be measured rather than read off a compute curve.
Learning Objective: Distinguish growth in training compute from growth in training energy.
An operator reports its AI fleet’s environmental footprint as metered electricity multiplied by the grid factor. What does this account leave out?
- Nothing, because operational electricity is the only environmental cost of AI hardware.
- Only facility overhead, because grid factors already include the cost of manufacturing.
- A fixed disposal charge per device, because retiring any accelerator necessarily creates e-waste.
- Manufacturing impacts that precede the first training run, such as embodied carbon, ultrapure water, and specialty gases, and the land, water, and grid capacity that host communities supply.
Answer: The correct answer is D. Producing processors carries embodied carbon and consumes water, gases, and chemicals before any job runs, and hosting a fleet assigns land, water, grid capacity, and disposal burdens to communities. Grid factors describe electricity supply, not manufacturing. Retirement does not necessarily create waste, because equipment can be redeployed, resold, or recycled, so disposal must be estimated from the actual end-of-life route.
Learning Objective: Identify the environmental costs that an electricity-only footprint omits.
A Quebec-versus-Poland comparison shows a 41-fold emissions difference for the same 10,000 MWh run, and carbon-aware scheduling can also shift work to cleaner hours. Explain why the geographic and temporal gains cannot simply be multiplied, and how the decision should be evaluated.
Answer: Both levers act on the same quantity, the emissions factor of the electricity that supplies a fixed amount of energy, and the 41-fold ratio already uses annual-average factors at equal facility energy. At a hydro-dominated site the hourly factor stays close to its low average, so waiting for cleaner hours there leaves little additional gain. The placement and the schedule must therefore be evaluated as one decision, using the hourly or marginal factors the schedule would actually see along with the job’s power, deadline, and capacity constraints.
Learning Objective: Explain why geographic and temporal carbon levers must be evaluated jointly rather than multiplied.
Self-Check: Answer
An inference optimization cuts energy per task by a factor of 4, and the lower cost raises task volume by a factor of 20, with the workload mix unchanged. What happens to fleet energy?
- It falls by a factor of 4, because per-task efficiency sets fleet energy.
- It stays the same, because efficiency and demand cancel.
- It rises by a factor of 5, because fleet energy is energy per task multiplied by the number of tasks.
- It rises by a factor of 80, because the efficiency gain and the demand growth compound.
Answer: The correct answer is C. Fleet energy is energy per completed task times the number of completed tasks, so one quarter of the energy times 20 times the volume gives five times the energy. Reading only the per-task gain misses the demand response, and multiplying both factors as growth treats the efficiency gain as a cost. This rebound differs from scaling-driven growth, which raises the compute each frontier model requires.
Learning Objective: Calculate fleet energy under rebound and distinguish rebound from scaling-driven demand growth.
A team plans a three-day run that needs 120 MW of accelerator power at once in a facility with an 80 MW grid feed. They argue the run fits because its total energy is less than the facility uses in a month. What is wrong with the argument?
- The power limit is instantaneous, so the feed caps how many servers can be active at once regardless of run length; the plan must lower concurrency and accept a longer run, or obtain more deliverable power.
- Nothing, because over a month an energy budget and a power cap are interchangeable.
- The run fails only on cost, because energy drawn above the feed is billed at a peak tariff.
- The only error is omitting PUE; adding facility overhead would show that the run’s energy exceeds the monthly budget.
Answer: The correct answer is A. Facility power cannot exceed the grid feed at any instant, which caps active servers whatever the job’s duration, while energy integrates average power over time and enters the electricity and emissions accounts. A modest energy total therefore cannot license a power draw above the feed. Treating the limits as interchangeable confuses the two physical constraints, and the tariff and PUE answers address the energy account rather than the power cap.
Learning Objective: Distinguish the instantaneous power envelope from the cumulative energy account when judging a training plan’s feasibility.
Synchronized training phases swing accelerator draw together across thousands of devices, and a battery or UPS stage that supplies or absorbs energy during each load change provides energy ____, whose location, capacity, and control response must match the electrical boundary being protected.
Answer: buffering. Energy buffering smooths the load step that coordinated training phases would otherwise push toward the utility connection; it protects a specific electrical boundary rather than reducing the run’s total energy.
Learning Objective: Identify the grid-interface mechanism that absorbs correlated training load swings and state what it does and does not change.
True or False: Because a frontier training run’s yearly energy is a modest share of a region’s consumption, the facility can be provisioned for that run’s annual-average power.
Answer: False. A training run concentrates its draw into weeks or months of sustained peak, and synchronized phases swing that draw together across the cluster. The facility must provision for the sustained peak, and the grid sees one large correlated load rather than many small independent ones.
Learning Objective: Explain why temporal concentration, not annual energy, sets the facility and grid requirements of a training campaign.
In the regime studied by Kaplan et al., each 10 percent reduction in compute-limited loss costs about 8.2 times the compute. Explain what two successive 10 percent reductions imply for training energy, and what would have to hold for energy not to grow by the same factor.
Answer: The multiples compound, so two successive 10 percent reductions cost about 8.2 times 8.2, or roughly 67 times, the original compute, because the small compute exponent makes each fixed fractional loss reduction a multiplicative increase in work. Training energy grows by the same factor unless realized FLOPs per joule improve at the same pace, which historical hardware gains have not matched. The diminishing return of the scaling law therefore reaches the facility as a multiplicative energy demand, which is why compute demand has outrun hardware efficiency.
Learning Objective: Analyze how the scaling-law compute exponent translates successive quality gains into multiplicative training energy.
Self-Check: Answer
An attention kernel has an arithmetic intensity of 3 FLOP/byte. An illustrative chip-and-memory energy model assigns 10 pJ per FLOP and 160 pJ per byte moved from DRAM, excluding static and facility energy. Which intervention directly targets the larger modeled energy contribution?
- Replacing the accelerator with one offering double the peak TFLOP/s while retaining the same memory bandwidth and memory technology.
- Increasing arithmetic precision from FP16 to FP32 to execute more FLOPs per memory transaction.
- Fusing normalization and attention operators and tiling intermediate activations to keep data in on-chip SRAM, reducing DRAM traffic.
- Lowering facility PUE from 1.5 to 1.1 to eliminate memory stall cycles.
Answer: The correct answer is C. The crossover is 16 FLOP/byte, so at 3 FLOP/byte movement contributes more energy than arithmetic in this model. Fusion and tiling can reduce that traffic when implemented successfully. Peak throughput alone establishes neither an energy saving nor the execution bottleneck; PUE does not eliminate memory stalls. Measure the complete workload to confirm the saving.
Learning Objective: Apply the energy-roofline crossover to classify a kernel’s dominant energy component and select the corresponding optimization
A 2 MW IT load cluster improves its Power Usage Effectiveness (PUE) from 1.58 to 1.10 without altering any model weights or server SKUs. Calculate the annual electricity savings in megawatt-hours (MWh) assuming 24/7 continuous operation, and explain why facility optimization is considered a first-order sustainability lever.
Answer: At \(\text{PUE} = 1.58\), total facility power is \(2\text{ MW} \times 1.58 = 3.16\text{ MW}\). At \(\text{PUE} = 1.10\), total power drops to \(2\text{ MW} \times 1.10 = 2.20\text{ MW}\), saving \(0.96\text{ MW}\) continuously. Over one year (\(8{,}760\text{ hours}\)), this saves \(0.96\text{ MW} \times 8{,}760\text{ h} \approx 8{,}410\text{ MWh}\). This demonstrates that facility infrastructure optimization delivers multi-gigawatt-hour savings equivalent to massive algorithmic optimizations without requiring changes to model code or accuracy.
Learning Objective: Calculate annual facility energy savings resulting from PUE improvements and justify infrastructure optimization as a high-leverage sustainability intervention
In the CMOS dynamic power equation \(P_{\text{dynamic}}=\alpha_{\text{sw}}CV^2f\), the parameter \(\alpha_{\text{sw}}\) is the
____, summarizing capacitance-weighted switching per clock cycle under the chosen counting convention.Answer: switching activity factor. It scales dynamic power linearly at fixed capacitance, voltage, and frequency; more switching is not necessarily more useful computation or greater energy efficiency.
Learning Objective: Explain the role of the switching activity factor in the CMOS dynamic power equation
An engineer needs to profile the energy consumption of a sub-watt microcontroller executing an on-device wake-word detection model that spends 98 percent of its time in deep sleep drawing 30 \(\mu\text{W}\). The microcontroller lacks on-chip energy counters. Which measurement approach is appropriate?
- Sampling the Linux RAPL interface at 100 Hz to capture CPU package power states.
- Querying NVML/nvidia-smi programmatic bindings to integrate instantaneous milliwatt metrics.
- Multiplying model parameter count by a theoretical constant of 5 pJ per parameter.
- Using a calibrated external analyzer with verified current range, analog bandwidth, synchronized voltage measurement, and integration windows covering sleep, active execution, and transitions.
Answer: The correct answer is D. An external analyzer must resolve both sleep and active states at the declared electrical boundary. Its configured range, bandwidth, calibration, voltage measurement, and integration interval determine whether it can do so; a fast sample rate or product name alone is insufficient. RAPL and NVML do not supply this microcontroller measurement, and parameter count omits duty-cycle and peripheral costs.
Learning Objective: Select instrumentation capable of measuring the declared duty cycle and electrical boundary of a TinyML system
True or False: To determine the total environmental energy impact of an AI workload, an engineering team can simply sum the measured energy of the GPUs, CPUs, DRAM, and network interface cards reported by hardware telemetry.
Answer: False. Component measurements must cover disjoint IT loads over the same interval; GPU telemetry that includes device memory must not be added to that memory again. Restore omitted support loads, then use facility meters or a time-matched PUE to include non-IT overhead. Electricity alone still omits manufacturing and other lifecycle impacts.
Learning Objective: Evaluate the requirement of incorporating facility overhead (PUE) into comprehensive AI energy accounting
Explain how the Energy-Delay Product (\(\text{EDP} = E \times t\)) guides operating point selection in TinyML systems, and identify how voltage scaling interacts with clock frequency to minimize EDP.
Answer: EDP compares energy multiplied by execution time across feasible operating points. First exclude settings that miss quality or deadline requirements, then measure energy and delay for supported voltage-frequency combinations. Lower voltage can reduce switching energy, but a longer runtime adds static and support energy. The measured curves determine the optimum; the formula does not guarantee a moderate frequency or a universally beneficial voltage reduction.
Learning Objective: Explain how Energy-Delay Product (EDP) balances voltage scaling, clock frequency, and static leakage in edge systems
Self-Check: Answer
Which equation pair correctly formalizes operational carbon emissions and daily amortized embodied carbon for AI hardware according to the chapter’s accounting methodology?
- \(C_{\text{operational}} = E_{\text{IT}} / \text{PUE}\) and \(C_{\text{embodied,daily}} = C_{\text{manufacturing}} \times T_{\text{lifetime}}\).
- \(C_{\text{operational}} = E_{\text{total}} + \text{CI}_{\text{grid}}\) and \(C_{\text{embodied,daily}} = C_{\text{manufacturing}} / 365\).
- \(C_{\text{operational}} = E_{\text{total}} \times \text{PUE} \times \text{CI}_{\text{grid}}\) and \(C_{\text{embodied,daily}} = C_{\text{manufacturing}} \times 365 / T_{\text{lifetime}}\).
- \(C_{\text{operational}} = E_{\text{total}} \times \text{CI}_{\text{grid}}\) (where \(E_{\text{total}} = E_{\text{IT}} \times \text{PUE}\)) and \(C_{\text{embodied,daily}} = \frac{C_{\text{manufacturing}}}{T_{\text{lifetime}} \times 365}\).
Answer: The correct answer is D. \(C_{\text{operational}} = E_{\text{total}} \times \text{CI}_{\text{grid}}\) (where \(E_{\text{total}} = E_{\text{IT}} \times \text{PUE}\)) and \(C_{\text{embodied,daily}} = \frac{C_{\text{manufacturing}}}{T_{\text{lifetime}} \times 365}\). Operational carbon is facility energy (IT energy scaled by PUE) multiplied by grid carbon intensity, and embodied carbon is total manufacturing emissions divided by expected lifetime in days (\(T_{\text{lifetime}} \times 365\)). Dividing IT energy by PUE inverts facility overhead; adding energy to carbon intensity mixes incompatible units; and multiplying facility energy by PUE a second time double-counts facility overhead.
Learning Objective: Compare the mathematical formulations for operational carbon and amortized embodied carbon
When a hyperscaler relocates a training cluster from a fossil-heavy grid (800 \(\text{gCO}_2/\text{kWh}\)) to a clean hydro grid (20 \(\text{gCO}_2/\text{kWh}\)), its sustainability dashboard reveals that embodied carbon becomes the dominant component of total lifecycle emissions. Explain the mechanism behind this inversion and its implications for hardware procurement.
Answer: With facility energy held constant, changing the scenario grid intensity from 800 to 20 gCO2/kWh reduces operational emissions by 97.5%, while manufacturing emissions are unchanged. The embodied share therefore rises, but its final percentage requires the actual manufacturing footprint and lifetime energy. Procurement should compare lifetime extension and replacement using that lifecycle boundary rather than assume a universal embodied-carbon share.
Learning Objective: Analyze why grid decarbonization shifts the dominant lifecycle carbon component from operational to embodied emissions
**An engineering team is auditing the greenhouse gas emissions of an AI platform. Which option correctly maps the five operational sources to their respective GHG Protocol scopes?
S1: Diesel fuel burned by backup generators during a power outage at an owned facility.
S2: Grid electricity purchased to power an owned GPU cluster.
S3: Grid electricity consumed by cooling chillers in the same owned facility.
S4: Embodied carbon from manufacturing the GPUs at an external foundry.
S5: Electrical energy consumed by end-user smartphones running the deployed mobile inference app.**
- S1: Scope 1; S2: Scope 2; S3: Scope 2; S4: Scope 3; S5: Scope 3.
- S1: Scope 2; S2: Scope 1; S3: Scope 2; S4: Scope 3; S5: Scope 3.
- S1: Scope 1; S2: Scope 2; S3: Scope 1; S4: Scope 2; S5: Scope 3.
- S1: Scope 3; S2: Scope 2; S3: Scope 2; S4: Scope 1; S5: Scope 1.
Answer: The correct answer is A. S1: Scope 1; S2: Scope 2; S3: Scope 2; S4: Scope 3; S5: Scope 3. Scope 1 encompasses direct emissions from owned combustion sources (on-site diesel generators). Scope 2 covers indirect emissions from purchased electricity (powering servers and facility cooling equipment). Scope 3 covers value-chain emissions upstream (semiconductor manufacturing at external foundries) and downstream (end-user mobile device execution). Classifying diesel as Scope 2 confuses direct combustion with purchased utility power; classifying cooling electricity as Scope 1 treats purchased utility power as on-site combustion; and classifying upstream semiconductor fabrication as Scope 1 misattributes supplier manufacturing to direct operations.
Learning Objective: Classify AI system emissions sources into Scope 1, Scope 2, and Scope 3 under the GHG Protocol
The metric representing the mass of carbon dioxide emitted per unit of electricity generated, expressed in grams of \(\text{CO}_2\) per kilowatt-hour, is known as
____.Answer: carbon intensity. Grid carbon intensity (\(\text{gCO}_2/\text{kWh}\)) varies by location and time, governing the operational emissions associated with electricity consumption.
Learning Objective: Explain how grid carbon intensity translates electrical energy into operational carbon emissions
A production language model consumed 1,200 MWh during its one-time training run. In production, it serves 8 million requests per day, consuming 0.0005 kWh per request. After how many days of continuous serving will the cumulative inference energy reach the one-time training energy?
- 120 days.
- 300 days.
- 600 days.
- 1,200 days.
Answer: The correct answer is B. 300 days. Daily inference energy is \(8{,}000{,}000\text{ requests/day} \times 0.0005\text{ kWh/request} = 4{,}000\text{ kWh/day} = 4\text{ MWh/day}\). Dividing total training energy by daily inference energy yields \(1{,}200\text{ MWh} / 4\text{ MWh/day} = 300\text{ days}\). A calculation yielding 120 days underestimates the crossover period; 600 days assumes half the daily inference volume; and 1,200 days erroneously assumes 1 MWh/day serving energy.
Learning Objective: Calculate the crossover point where cumulative inference energy exceeds one-time training energy
Give one valid order for the following steps in computing the specified operational-plus-accelerator-manufacturing carbon subtotal of a model training workload: (1) multiply IT energy by facility PUE to obtain total facility energy consumption, (2) amortize accelerator manufacturing footprint over total operational lifetime to calculate the job’s embodied share, (3) measure or estimate raw IT electrical power and duration across GPUs, CPUs, and memory, (4) sum operational and embodied carbon to determine the accounted subtotal, (5) multiply total facility energy by regional grid carbon intensity to determine operational carbon.
Answer: One valid order is: (3) measure or estimate raw IT electrical power and duration across GPUs, CPUs, and memory, (1) multiply IT energy by facility PUE to obtain total facility energy consumption, (5) multiply total facility energy by regional grid carbon intensity to determine operational carbon, (2) amortize accelerator manufacturing footprint over total operational lifetime to calculate the job’s embodied share, (4) sum operational and embodied carbon to determine the accounted subtotal. IT energy must be measured first; facility PUE is applied to calculate total electrical draw; grid carbon intensity converts facility energy into operational emissions; embodied manufacturing carbon is amortized over the run’s duration; and both components are summed for this partial lifecycle account. Manufacturing of hosts, networking, storage, and facilities, and any other lifecycle stages outside the stated inventory, must be added before claiming a complete footprint. PUE and carbon intensity may be multiplied in either order, but facility overhead must be included exactly once; embodied carbon can be computed independently before the final sum.
Learning Objective: Analyze the sequential calculation workflow for AI lifecycle carbon accounting
Self-Check: Answer
A cloud provider can procure and install 10,000 GPUs within six months, but building the required electrical substation and securing utility interconnect approval takes 24 months. Explain why electrical power delivery represents the binding bottleneck for data center expansion, and state the systems consequence of this lead-time disparity.
Answer: In this scenario, the 24-month power-delivery path is four times the six-month GPU-procurement path and gates operation at the intended scale. Delivered accelerators can remain electrically stranded until the connection is ready. Actual lead times and alternatives are site-specific, so procurement must follow a qualified supply schedule rather than assume this ratio applies everywhere.
Learning Objective: Explain how power delivery infrastructure and utility interconnect lead times constrain large-scale AI cluster deployments
A facility audit lists conversion losses in five places: the utility transformer, the online UPS, the facility power distribution units, the server power supplies, and the baseboard voltage regulators. Which losses raise the facility’s PUE?
- The transformer, UPS, and facility distribution losses, because they lie upstream of the IT boundary; server power supplies and voltage regulators sit inside the measured IT load.
- All five, because every conversion loss turns delivered power into heat that the cooling system must remove.
- Only the server power supplies and voltage regulators, because they sit closest to the accelerators that do the useful work.
- None of them, because PUE measures cooling overhead and conversion losses are electrical rather than thermal.
Answer: The correct answer is A. PUE divides facility energy by IT energy, so only losses outside the IT boundary add to the overhead: the transformer, UPS, and facility distribution. Server power supplies and baseboard regulators are part of the measured IT load and appear in both numerator and denominator, although their heat still loads the cooling system. Counting every loss as overhead double counts the IT-side terms, and PUE covers all non-IT facility load, not only cooling.
Learning Objective: Assign power-delivery losses to the correct side of the PUE accounting boundary
Facility A reports a Power Usage Effectiveness (PUE) of 1.08 on an electrical grid with carbon intensity of \(450\text{ g CO}_2/\text{kWh}\). Facility B reports PUE 1.35 on a grid with \(50\text{ g CO}_2/\text{kWh}\). For a \(10\text{ MW}\) IT compute load, calculate the total hourly electrical power drawn and carbon emissions for both facilities, and explain the limitation of using PUE as a sole environmental metric.
Answer: At \(10\text{ MW}\) IT load: Facility A draws \(10\text{ MW} \times 1.08 = 10.8\text{ MW}\) (\(10{,}800\text{ kW}\)) total power, emitting \(10{,}800\text{ kW} \times 450\text{ g CO}_2/\text{kWh} = 4{,}860\text{ kg CO}_2/\text{hr}\) (\(4.86\text{ tonnes/hr}\)). Facility B draws \(10\text{ MW} \times 1.35 = 13.5\text{ MW}\) (\(13{,}500\text{ kW}\)) total power, emitting \(13{,}500\text{ kW} \times 50\text{ g CO}_2/\text{kWh} = 675\text{ kg CO}_2/\text{hr}\) (\(0.675\text{ tonnes/hr}\)). Facility B emits \(\approx 7.2\times\) less carbon than Facility A despite having a significantly worse PUE (1.35 vs. 1.08). PUE measures only facility power relative to IT-equipment power, not the cleanliness of the electricity source, so optimizing PUE in isolation can mislead teams into high-carbon grid locations.
Learning Objective: Calculate facility power draw and carbon emissions using PUE and grid carbon intensity to evaluate environmental impact.
A 10 MW facility in a water-stressed region can reject heat through evaporative cooling towers or through dry coolers. Explain the water and energy trade-off between the two, and why the operator might accept higher fan energy.
Answer: Evaporation carries large amounts of heat with a small water flow because each kilogram evaporated removes its latent heat, but the evaporated water is consumed and must be replaced, which shows up as WUE. Dry coolers avoid that direct water consumption, but their capacity depends on the coolant-to-ambient temperature difference, so hot weather reduces capacity or requires more fan power. In a water-stressed watershed the local water burden can outweigh the added electricity, so the operator may choose dry or hybrid rejection while still counting the upstream water of the electricity it buys.
Learning Objective: Evaluate the water-energy trade-off between evaporative and dry heat rejection
Self-Check: Answer
Which systems analogy and operational reality best explains why inference often dominates total lifecycle energy for widely deployed foundation models?
- Inference requires higher instantaneous wattage per accelerator than training because real-time serving disables dynamic voltage scaling.
- Training is like a one-time rocket launch that burns concentrated energy over several weeks, whereas inference is like operating a commercial airline fleet that burns energy continuously across billions of recurring user interactions over years.
- Inference models must perform a full backward pass on every user query to maintain accuracy, doubling computational cost.
- Inference cannot run on specialized accelerators, forcing cloud operators to use energy-inefficient legacy CPUs.
Answer: The correct answer is B. A training run concentrates energy in a bounded interval, while serving repeats for the product’s lifetime. Sufficient demand can make cumulative serving energy exceed training energy, but volume, workload mix, idle capacity, and updates determine the crossover. Neither instantaneous power nor an assumed backward pass establishes it; inference can use specialized accelerators.
Learning Objective: Analyze why cumulative inference energy dominates one-time training energy for large-scale production models
A distributed training job expands from 1,024 to 2,048 accelerators. Explain which mechanisms can increase communication energy and what measurements establish its share of step energy for the actual run.
Answer: Topology, collective algorithm, message volume, overlap, stragglers, and powered waiting determine the energy change; a larger participant count does not guarantee super-linear growth for every collective. Estimate phase energy from measured power integrated over each phase and compare with the whole-step account. Exposed communication time equals its energy fraction only under an explicit equal-average-power approximation; continued power draw alone does not justify that equality.
Learning Objective: Analyze communication-energy mechanisms and estimate their contribution from phase power and duration
Profiling an autoregressive LLM serving pipeline shows that the prefill phase achieves 55 percent Model FLOPs Utilization (MFU), while the token-generation decode phase achieves only 6 percent MFU with high HBM bandwidth utilization. What is the physical mechanism causing decode energy inefficiency?
- Decode executes in FP32 precision while prefill executes in INT4 precision.
- Prefill bypasses high-bandwidth memory entirely by storing all weights in CPU host RAM.
- Decode requires running backpropagation to generate key-value cache embeddings for each new token.
- Decode is memory-bandwidth bound: each generated token requires reading all model weights from HBM with low arithmetic intensity, leaving tensor execution units idling while drawing static leakage and clock distribution power.
Answer: The correct answer is D. High HBM utilization with low MFU is consistent with a bandwidth-bound decode phase whose limited batch reuse leaves arithmetic units underused. Powered waiting can add static and support energy. These measurements do not establish a fixed prefill-to-decode energy ratio; compare measured energy under declared batch, context, output quality, latency, and hardware boundaries. Decode does not require backpropagation.
Learning Objective: Explain the microarchitectural mechanism behind the decode phase’s low energy efficiency in LLM serving
A mobile application team proposes running nightly on-device full backpropagation fine-tuning for a 1B-parameter model on user smartphones. Using the concept of the ‘battery wall’, explain how to assess a 5 percent overnight battery budget and identify alternatives if the measured workload exceeds it.
Answer: A 15 Wh battery contains 54,000 J, so a 5% budget permits 2,700 J. Whether a 1B-parameter training workload fits depends on its measured energy per token, training length, memory footprint, and thermal limits; parameter count alone cannot establish infeasibility. PEFT can reduce trainable parameters and optimizer state, but LoRA still backpropagates through the relevant network and need not remove activation storage. Profile the complete update and consider fewer local steps, off-device training, or charging-only execution.
Learning Objective: Evaluate an on-device update against battery, memory, thermal, and quality requirements and identify alternatives when it exceeds them
A TinyML sensor runs inference for 10 ms at 20 mW active power and sleeps for 990 ms at 20 \(\mu\text{W}\) deep-sleep power during a 1-second monitoring period. Calculate the average power draw, and explain how duty cycling enables multi-year battery operation.
Answer: The active contribution to average power is \(20\text{ mW}\times0.010=0.20\text{ mW}\); the sleep contribution is \(0.020\text{ mW}\times0.990=0.0198\text{ mW}\). Their sum is \(0.2198\text{ mW}\), about 91 times below continuous active power. This saves energy, but multi-year operation depends on usable battery capacity, self-discharge, and peripheral loads. Even one year at this average requires about 1.93 Wh before those additional costs.
Learning Objective: Calculate average power in duty-cycled TinyML systems and explain how duty cycling extends operational battery life
Order the stages of a hierarchical wake-word cascade designed to minimize average energy consumption on a smart speaker from lowest power to highest power: (1) large language model or full automatic speech recognition running on host processor or cloud, (2) small convolutional or recurrent neural network wake-word classifier verifying the trigger phrase, (3) ultra-low-power Voice Activity Detection (VAD) circuit listening continuously at microwatt power.
Answer: The correct order is: (3) ultra-low-power Voice Activity Detection (VAD) circuit listening continuously at microwatt power, (2) small convolutional or recurrent neural network wake-word classifier verifying the trigger phrase, (1) large language model or full automatic speech recognition running on host processor or cloud. The cascade minimizes energy by placing the cheapest filter first: the microwatt VAD filters silence/ambient noise; upon detecting voice, it triggers the small milliwatt wake-word model; only when the trigger phrase is validated does the system power up the watt-scale host processor or cloud network stack for full inference. Inverting the sequence would burn hundreds of milliwatts or watts on continuous ambient silence.
Learning Objective: Design a hierarchical wake-word cascade to minimize average power consumption in low-power edge systems
Self-Check: Answer
For a fixed inventoried manufacturing footprint, what happens to annualized embodied carbon when useful hardware life extends from three years to five years, before considering changes in operational energy?
- The fixed manufacturing footprint is amortized over five years rather than three, reducing its annualized allocation by 40 percent; total lifecycle savings still depend on operational energy and the inventory boundary.
- Older accelerators automatically consume 40 percent less electrical power per FLOP as silicon pathways break in over time.
- Extending accelerator lifespans from three to five years eliminates electronic waste entirely because hardware decomposes organically after five years.
- Data center PUE automatically drops to 1.0 after servers have operated for more than four years.
Answer: The correct answer is A. Dividing the same manufacturing footprint by five years rather than three changes its annual allocation by a factor of 3/5, a 40% reduction. This does not erase manufacturing emissions or prove that retaining hardware minimizes total lifecycle carbon. The comparison also needs useful work, operational energy, replacement manufacturing, and consistent component boundaries. Aging does not automatically improve silicon efficiency or facility PUE.
Learning Objective: Justify hardware lifespan extension as a high-leverage sustainability intervention using embodied carbon amortization
A research paper reports that training a new vision-language model consumed 500 MWh for its final successful training run. Explain why reporting only the final run systematically underestimates the development phase’s total carbon footprint, and identify two mitigation practices.
Answer: The final run omits exploratory searches, debugging, failed runs, compilation, and evaluation. Their cost depends on the actual experiment inventory; fifty candidates at one-tenth of final-run cost add five final-run equivalents in the chapter’s example. Transfer learning, shared search, and early stopping can reduce development work, provided the complete comparison preserves the required quality.
Learning Objective: Analyze why development-phase experimentation overhead must be included in AI sustainability accounting and identify mitigation practices
True or False: If an AI training data center is powered 100 percent by dedicated geothermal and hydroelectric power, the use phase is completely unconstrained and engineers no longer need to consider grid dynamics or cooling efficiency.
Answer: False. Low-carbon sourcing does not remove electrical capacity, thermal, water, or reliability limits, and it does not erase generation or hardware lifecycle burdens. Any effect on other grid generation depends on the actual supply and grid connection; dedicated hydro or geothermal alone does not establish a peaker response.
Learning Objective: Evaluate how zero-carbon electricity sourcing changes emissions accounting while physical use-phase constraints remain binding
Standardized under ISO 14040 and ISO 14044, a comprehensive
____evaluates the cumulative environmental impact of AI hardware across raw material extraction, manufacturing, use, and end-of-life disposal.Answer: life cycle assessment. A Life Cycle Assessment (LCA) quantifies environmental impacts across design, supply-chain fabrication, active operational use, and recycling/disposal, ensuring embodied emissions are not ignored.
Learning Objective: Explain the role of Life Cycle Assessment (LCA) methodology in quantifying end-to-end hardware environmental impact
A cloud provider considers retiring functional accelerators because a new generation offers a 12 percent improvement in performance per watt. Which option identifies a circular-economy candidate for evaluation, without claiming that this efficiency specification alone determines the lowest-emissions choice?
- Immediately shred and dispose of all prior-generation accelerators to eliminate any hardware with lower peak energy efficiency.
- Replace all servers instantly because any improvement in operational efficiency automatically offsets the embodied carbon of manufacturing a replacement fleet.
- Evaluate redeployment to compatible secondary workloads, comparing continued useful service with replacement manufacturing and measured operating emissions over the same remaining service interval.
- Overclock the older accelerators beyond thermal limits to match new hardware throughput regardless of cooling failure risk.
Answer: The correct answer is C. Compatible secondary use can avoid premature disposal and new procurement, but it must meet the workload’s quality, performance, security, and reliability requirements. Compare useful-work energy, grid intensity, utilization, replacement manufacturing, and remaining life. A 12 percent performance-per-watt specification alone cannot establish the emissions minimum or its break-even time; automatic replacement ignores the new embodied burden.
Learning Objective: Apply circular economy principles to hardware retirement and secondary redeployment decisions
Self-Check: Answer
An AI company deploys quantization and knowledge distillation, reducing the energy cost per user query by 50 percent. Over the following year, the company’s total data center electricity consumption increases by 75 percent as lower per-query costs enable new product features and attract 3.5\(\times\) more queries. Which phenomenon explains this outcome?
- Amdahl’s law, which states that sequential execution limits parallel speedup.
- Dennard scaling breakdown, where transistor power density increases with scaling.
- Jevons paradox, where technological efficiency improvements lower the effective cost of a resource, stimulating increased demand that outweighs per-unit efficiency gains.
- The memory wall, where DRAM bandwidth fails to keep pace with arithmetic throughput.
Answer: The correct answer is C. Jevons paradox, where technological efficiency improvements lower the effective cost of a resource, stimulating increased demand that outweighs per-unit efficiency gains. Jevons paradox (or the rebound effect) describes when per-unit efficiency gains make a service cheaper or faster, unlocking new use cases and user demand whose aggregate resource consumption exceeds the initial per-unit savings. This demonstrates why engineering efficiency alone cannot guarantee environmental sustainability without capacity governance or carbon budgets. Amdahl’s law governs parallel compute speedup; Dennard scaling describes CMOS power physics; and the memory wall addresses processor-memory bandwidth disparities.
Learning Objective: Explain Jevons paradox in AI systems and justify why engineering efficiency must be paired with usage governance
A model compression team evaluates unstructured weight pruning, INT8 quantization, and knowledge distillation for serving a transformer. Explain the hardware mechanisms that can turn each technique into measured energy savings, and why theoretical compression alone is insufficient.
Answer: INT8 can reduce weight-transfer bytes relative to FP16 and use supported integer kernels; distillation can reduce dense operations and stored state at the required quality. Unstructured pruning saves energy only when the implementation exploits sparsity instead of moving and processing zeros or spending the savings on indexing. Compare joules per completed task at matched quality, precision assumptions, utilization, and measurement boundaries; no universal cross-precision energy multiplier follows from the operation count alone.
Learning Objective: Compare theoretical model compression techniques against hardware-realizable energy reductions on modern AI accelerators
A systems team aims to overcome the energy wall for future foundation model architectures. Which design direction most directly targets the physical root cause of energy waste identified in the chapter?
- Increasing clock frequency and supply voltage to maximize compute throughput per unit silicon area.
- Enforcing dense, synchronized execution across all model layers so accelerator execution units maintain 100 percent active duty cycles.
- Adopting event-driven and sparse-activation architectures that execute compute only on salient tokens or state changes, minimizing dense data movement across memory hierarchies.
- Replacing FP16 tensor cores with FP32 standard execution units to maximize numeric accuracy per memory access.
Answer: The correct answer is C. Event-driven and sparse-activation designs can avoid unnecessary computation and transfers when inputs or activations permit it. The saving depends on event rate, sensing and static power, sparse execution overhead, and achieved quality. Raising voltage increases dynamic power at fixed activity and frequency; keeping units active does not establish useful work per joule. Dense computation is not universally movement dominated.
Learning Objective: Design architectural strategies that address data-movement dominance to mitigate the AI energy wall
A platform team has recurring batch training jobs that can move across regions or time while preserving quality. Which intervention is a candidate for lowering operational carbon without changing the model, provided capacity, data access, deadlines, and net emissions are checked?
- Replacing all ReLU activation functions with GELU activations across training scripts.
- Increasing the batch size to maximize GPU execution unit occupancy.
- Switching from PyTorch to a C++ inference engine for training loops.
- Implementing carbon-aware spatial and temporal scheduling to route training jobs to data center regions and time windows with surplus renewable energy and low carbon intensity.
Answer: The correct answer is D. Carbon-aware placement and scheduling can exploit lower-emissions windows for flexible jobs. Compare complete facility energy and compatible grid signals, including checkpoint, transfer, restart, and idle costs, after filtering infeasible candidates. Regional averages motivate investigation but do not guarantee an order-of-magnitude net saving. Changing batch size or activations changes the workload and may change its quality or convergence.
Learning Objective: Evaluate carbon-aware placement as a conditional mitigation candidate for feasible batch workloads
Explain the difference between average and marginal grid emissions, and identify the evidence a scheduler needs to estimate the emissions effect of a proposed workload shift.
Answer: An average factor attributes an electricity mix over a specified place and period; it can be annual or time-resolved. A marginal factor estimates the emissions response to changing demand. A scheduler evaluating a proposed shift needs consequential evidence matched to its region, forecast horizon, and workload, with uncertainty recorded. A marginal estimate need not identify one directly observable generator, and the full comparison must also include shifting costs.
Learning Objective: Distinguish attributional and consequential grid evidence and select evidence appropriate to a workload-shifting decision
Order the following stages of a carbon-aware scheduler’s decision: (1) compare complete projected emissions of feasible candidates, including checkpoint, transfer, restart, and idle costs, (2) obtain documented grid forecasts and workload requirements, (3) dispatch the selected feasible action, (4) monitor progress and re-evaluate against constraints, (5) filter candidates by deadline, capacity, data access, power, cooling, and reliability requirements.
Answer: The correct order is: (2) obtain grid forecasts and workload requirements, (5) filter candidates by operational constraints, (1) compare complete projected emissions, (3) dispatch the selected feasible action, (4) monitor progress and re-evaluate. A lower-intensity region can be infeasible or lose its advantage once movement and waiting costs enter. Feasibility and net benefit must therefore precede dispatch, while progress monitoring can trigger another decision cycle.
Learning Objective: Analyze the operational execution pipeline of a carbon-aware workload scheduler managing distributed AI jobs
Self-Check: Answer
An industry observer claims that policy interventions and carbon pricing are unnecessary because ‘free-market competition will naturally incentivize data center operators to minimize energy use and carbon emissions.’ Which counterargument best explains why market mechanisms alone fail to guarantee sustainable AI deployment?
- Data center operators are legally restricted from purchasing power from renewable energy utilities.
- Electricity prices can omit emissions and other environmental burdens, so minimizing the electricity bill need not minimize the complete environmental account; pricing, reporting, or procurement requirements can change the decision incentives.
- AI models running on renewable electricity automatically suffer from higher inference latency than models on fossil power.
- Hardware vendors have already achieved the physical thermodynamic limit of computing efficiency, leaving no room for further optimization.
Answer: The correct answer is B. A financial objective can omit environmental externalities, so a cheaper feasible site need not have lower emissions or water stress. Policy can make those burdens visible or priced; carbon pricing is one mechanism rather than a prerequisite for every physical reduction. Electricity source alone does not determine silicon latency.
Learning Objective: Explain why market incentives alone fail to drive carbon reduction and justify the role of carbon pricing policy
How do modern regulatory frameworks such as the Corporate Sustainability Reporting Directive (CSRD) and the EU AI Act directly affect the systems engineering practices of organizations deploying large-scale AI?
- They impose an absolute global cap banning the training of any machine learning model exceeding 100 billion parameters.
- For organizations and systems within their applicable scope, they create documentation and disclosure duties that require traceable energy and sustainability evidence; the exact obligations depend on the framework and deployment.
- They mandate that all AI inference must be executed exclusively on battery-powered mobile devices rather than cloud servers.
- They require that all machine learning models be retrained weekly using uncompressed full-precision floating-point arithmetic.
Answer: The correct answer is B. Reporting and AI governance frameworks can turn energy and sustainability evidence into a deployment obligation for covered entities or systems. Engineering teams need reproducible measurements, documented boundaries, and retained records matched to the applicable requirement. The frameworks have different scopes; they do not impose one universal Scope 1–3 telemetry rule on every AI deployment, nor the parameter bans or edge-only mandates in the other choices.
Learning Objective: Analyze how sustainability regulations convert environmental accounting into mandatory software and infrastructure engineering requirements
Explain how an applicable emissions trading system or carbon tax changes a workload scheduler’s cost objective, and what conditions determine whether cleaner placement becomes economically preferable.
Answer: A carbon price adds an emissions term to the cost objective. At equal facility energy and electricity tariffs, a higher applicable emissions factor produces a larger carbon charge. Cleaner placement becomes preferable only when the complete priced benefit exceeds transfer, waiting, runtime, and other costs and the candidate meets deadline, capacity, data, and reliability constraints. Carbon pricing changes incentives; it does not guarantee migration.
Learning Objective: Analyze how carbon taxation aligns financial cost optimization with carbon-aware infrastructure scheduling
True or False: If a technology enterprise purchases enough annual Renewable Energy Certificates (RECs) to match 100 percent of its data centers’ annual electricity consumption, its evening foundation-model inference workloads running on a fossil-fueled regional grid can be accurately characterized as zero-carbon operations.
Answer: False. Annual certificates match electricity attributes over a year; they do not establish the emissions of an evening workload. Hourly matching makes unmatched intervals visible, but physical benefit still depends on deliverability, additional clean supply, storage, and grid conditions. Neither method eliminates hardware manufacturing emissions or proves a complete zero-carbon lifecycle.
Learning Objective: Evaluate the difference between annual renewable energy netting (RECs) and 24/7 hourly clean energy matching
Explain how future non-von-Neumann computing paradigms (such as neuromorphic computing and in-memory analog computing) address the fundamental physical bottleneck responsible for AI energy consumption.
Answer: These architectures can reduce selected transfers or unnecessary switching, but the gain depends on the workload and implementation. If movement contributes a fraction q of total energy, eliminating that term alone yields at most a 1/(1-q) reduction factor with other terms unchanged. Conversion, control, sensing, peripheral energy, training, and achieved quality remain in the comparison; neither a universal movement share nor near-zero system energy follows from the architecture label.
Learning Objective: Explain how alternative architectures target movement energy and bound their benefit within the complete system account
Self-Check: Answer
True or False: Migrating a machine learning training workload from an on-premises enterprise cluster in a low-carbon region (20 \(\text{gCO}_2/\text{kWh}\)) to a commercial cloud data center in a coal-heavy region (750 \(\text{gCO}_2/\text{kWh}\)) is guaranteed to reduce the workload’s carbon footprint because hyperscale cloud providers operate at lower PUE.
Answer: False. Lower PUE alone does not guarantee lower emissions. At equal IT energy and the supplied grid factors, a PUE improvement must offset a 37.5-fold intensity increase merely to match electricity-related emissions. A complete comparison also needs actual energy, useful work, movement costs, and embodied allocations; cloud status is not evidence of that result.
Learning Objective: Evaluate the fallacy that cloud migration is inherently greener regardless of regional grid carbon intensity
A systems team aggressively compresses a model using unstructured pruning to cut training FLOPs by 60 percent. In production, serving the sparse model requires specialized, custom-fabricated NPU accelerators and requires double the serving iterations to reach quality parity. Which pitfall does this scenario illustrate, and what is the proper engineering mitigation?
- Local optimization of training compute without full-lifecycle assessment; the mitigation is conducting end-to-end Life Cycle Assessment (LCA) that accounts for hardware manufacturing, deployment scale, and serving energy before committing to architectural changes.
- Failure to apply Amdahl’s law; the mitigation is increasing CPU clock frequency.
- Violating the GHG Protocol; the mitigation is reclassifying Scope 3 emissions as Scope 1.
- Ignoring PUE; the mitigation is installing liquid cooling on the development workstations.
Answer: The correct answer is A. Local optimization of training compute without full-lifecycle assessment; the mitigation is conducting end-to-end Life Cycle Assessment (LCA) that accounts for hardware manufacturing, deployment scale, and serving energy before committing to architectural changes. Optimizing one isolated phase (training FLOPs) often shifts environmental burdens to other lifecycle phases, such as requiring new specialized hardware fabrication (embodied carbon) or increasing recurring inference queries. Comprehensive LCA across training, serving, and hardware manufacturing prevents counterproductive local optimizations. Amdahl’s law does not address lifecycle trade-offs; reclassifying emissions scopes does not alter physical carbon; and workstation cooling is irrelevant to datacenter-scale deployment.
Learning Objective: Analyze the pitfalls of localized optimization and apply full Life Cycle Assessment to evaluate net environmental impact
Explain why an offset purchase does not replace evidence of physical emissions reductions, and what must be established before claiming a reduction from placement, efficiency, or hardware reuse.
Answer: An offset compensates through a separately credited activity; it does not change the workload’s own electricity or manufacturing emissions. Additionality, durability, verification, and double counting affect that claim. Physical interventions need their own complete comparison: placement includes movement and waiting costs, efficiency preserves useful service, and reuse weighs avoided new manufacturing against continued operating energy. Report reductions separately from compensation and amortized allocation.
Learning Objective: Evaluate carbon offsets against direct engineering interventions and justify prioritizing physical emissions reductions