
4 Data Storage
Purpose
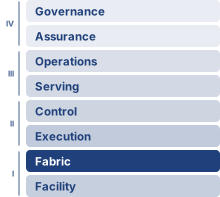
Fleet stack focus for this chapter.
Why does storage become the invisible bottleneck that prevents accelerators from reaching their potential?
A training job can leave expensive accelerators idle even when its models fit in memory and its network has ample capacity, because the next batch must arrive before computation needs it and a saved checkpoint must remain usable when a worker fails. Storage becomes an invisible bottleneck whenever accelerator benchmarks begin with data already in place, excluding the work needed to deliver inputs and preserve results. A pipeline that keeps one machine busy can stall once many workers compete for the same data source, and a burst of checkpoint writes from one job can delay input reads for others, turning a local pause into lost progress across the fleet while adding compute increases demand without expanding the shared system’s ability to serve it. How severely that contention hurts depends on the workload: compact training inputs may be easy to deliver even when saving model state dominates storage traffic, whereas larger samples can make continuous input delivery the limiting factor. Bringing data closer to the accelerator reduces those delivery delays, though it adds staging traffic, capacity cost, and the obligation to preserve complete versions—since a fast local save provides little protection if the only copy disappears with the failed machine. Storage decisions therefore govern both how quickly the fleet advances and how much of that progress survives disruption. In C³ terms, storage design coordinates data movement and durable state so that available compute produces recoverable progress.
Learning Objectives
- Compare storage demands of full-corpus training, checkpoint writes, and model serving across local and shared tiers
- Calculate input bandwidth and mean cache service time from workload demand and tier behavior
- Design shard packaging, prefetching, locality, and direct-storage paths that keep fleet accelerators fed when small files or slow tiers would starve them
- Select checkpoint staging and replication strategies that balance pause time, recovery risk, and storage cost
- Specify storage commit and replay contracts that preserve correctness when distributed pipeline stages fail, including the provenance that generated training data must retain
- Analyze serving-time storage workloads, from bulk model loads and rollout bursts to retrieval indexes bound by random-access IOPS
- Evaluate staging and tiering choices by total delivery cost, including transfer fees and idle accelerators
4.1 The Fuel Line
The dense accelerator nodes of Compute Infrastructure pack eight GPUs delivering petaFLOP/s of aggregate compute, and the InfiniBand fabrics of Network Fabrics connect thousands of such nodes at hundreds of gigabits per second. Within the multi-tier fleet stack of The Fleet Stack, data storage completes that physical foundation, staging training data, model weights, optimizer state, and intermediate checkpoints at the right distance from the accelerator. An engine without fuel is expensive sculpture. The engineering question is how to deliver that fuel fast enough that the accelerators of a training cluster never starve. The running cluster for that question is 256 eight-GPU nodes, 2,048 accelerators in all, deliberately twice the 1,024-GPU (128-node) reference cluster used elsewhere in this book, because the larger fleet makes the pressure on shared storage easier to see. Every worked number for the 175B job uses this running cluster; a side scenario with a different workload or fleet size names its own scale where it appears.
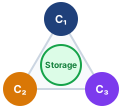
Storage is the physical substrate spanning Compute (\(\OperationalTaxonomyDimension_1\)), Communication (\(\OperationalTaxonomyDimension_2\)), and Coordination (\(\OperationalTaxonomyDimension_3\)).
Consider the running example for the storage analysis, an instance of Archetype A (GPT-4/Llama-3). A 175-billion parameter language model trains on 1.5 trillion tokens of text: roughly 3 TB in compressed source form, or 6 TB once represented as 4-byte token IDs. That token budget is set upstream of storage. Under the compute-optimal scaling results of AI Scaling Laws, the training-token count grows in proportion to parameter count, so each step up the model-size curve enlarges both the corpus the fleet must hold and the bytes each epoch must read. This corpus already sits below the compute-optimal allocation for a 175B-parameter model, so a compute-optimal run would raise both figures further. The run makes a single pass (one epoch) over this corpus, reading every selected token once in an order determined by the shuffle seed. No small “hot” subset dominates access. Meanwhile, each accelerator processes its local batch in roughly 200 ms, then waits for the next. If storage cannot deliver data within that 200 ms window, the accelerator sits idle, and the organization pays for silicon that produces heat instead of gradients.
The problem is deceptive because storage technology has improved substantially. Non-Volatile Memory Express (NVMe) drives achieve 7 GB/s of sequential throughput, a figure that would have seemed out of reach a decade ago. An H100 moves data internally through high-bandwidth memory (HBM) at 3.35 TB/s, roughly 479× the sequential bandwidth of a single NVMe drive. This ratio contrasts two tiers; it is not the rate at which storage must supply training inputs, because HBM bandwidth also carries repeated weight, activation, and tensor traffic during computation. The storage feed requirement is instead determined by the input-batch bytes each accelerator needs per iteration. Dividing those bytes by the compute window gives one worker’s required delivery rate; summing across workers gives the fleet demand. That rate must be evaluated at each tier using the representation stored there, since compressed inputs and decoded tensors occupy different numbers of bytes. A hierarchy becomes useful when the durable source cannot meet that rate or its latency varies enough to interrupt computation. Faster tiers stage upcoming batches while the durable tier supplies capacity and preserves the source data.
The storage problem joins physics with economics. Physics favors the memory closest to the accelerator, which offers the highest bandwidth in the smallest capacity; economics favors shared storage, which pools far more capacity at lower cost per byte behind additional interfaces and service queues. Device technology, interconnects, and contention then determine the rate a particular consumer actually receives. The engineering task is to place and move data so that the accelerator receives each batch before it is needed. The resulting design problem is quantitative. It asks how fast each tier must be, how deep the pipeline must run, and which bytes are worth keeping close to the accelerator. Improving arithmetic throughput alone does not improve input delivery or checkpoint persistence. Those paths require their own bandwidth and latency budgets.
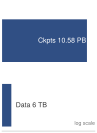
Over the run, checkpoint writes exceed one epoch of training-data reads by more than 1,000 times.
The canonical training-data footprint for this example is roughly 9 TB across the hierarchy, combining the example’s compressed corpus and tokenized shards. Additional shuffled or packed variants can raise the staging footprint, but the per-epoch training read over 4-byte token IDs is 6 TB. This chapter adopts one resumable mixed-precision Adaptive Moment Estimation (Adam) checkpoint contract: FP16 model weights, FP32 master weights, and two FP32 Adam moments, for 14 bytes per parameter. This is the 16-byte training state of Node memory partitioning without its 2-byte FP16 gradients, which are recomputed after restore, while scheduler, random-number-generator, and data-loader metadata are negligible at this scale. The resulting checkpoint is 2,450 GB every 10 minutes. Over a 30-day training run on the 256-node cluster, the storage system must deliver 6 TB of tokenized training data in the run’s single epoch, absorb 10.6 PB of checkpoint writes, and stage model weights for evaluation runs; the sections that follow use this same contract for every checkpoint size, duration, retention total, and lifetime-write calculation.
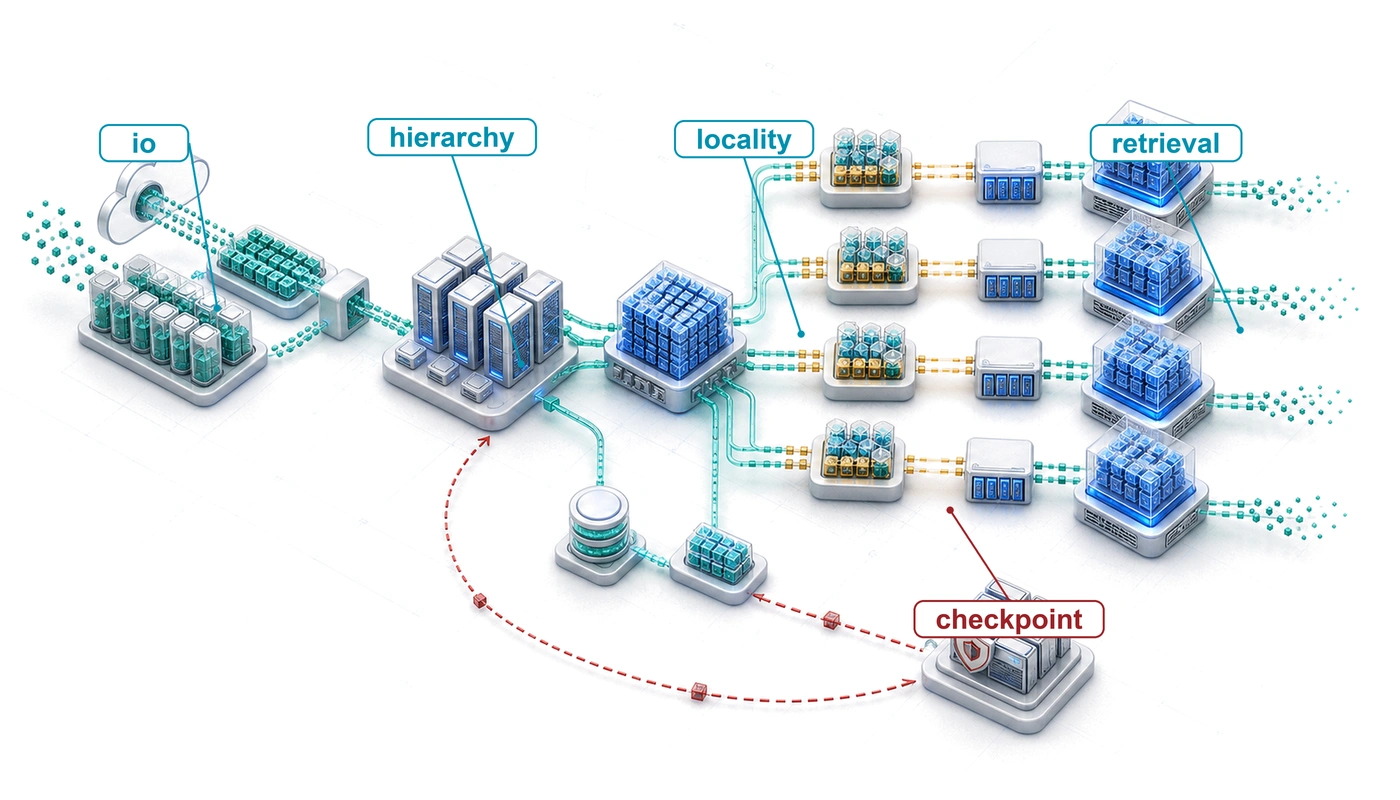
Those numbers force the storage path. ML access patterns first invert the assumptions behind conventional storage systems; that inversion forces a hierarchy from HBM to cold archive; the hierarchy then requires a pipeline equation that sizes delivery, direct data paths that remove host copies, a checkpoint protocol for the dominant write traffic, commit boundaries that keep every versioned artifact reproducible (generated training data included), and economics that decide which bytes belong at each tier. Serving-time model loading and retrieval indexes are variations on the same fuel-line problem, and devices that move the boundaries between tiers close the chapter. In each workload, the storage system must place the right representation at the right distance before the accelerator asks for it.
Self-Check: Question
An H100 accelerator consumes data from its HBM at roughly \(3.35\text{ TB/s}\), while a single local NVMe drive delivers sequential reads at roughly \(7\text{ GB/s}\). A team is designing the storage infrastructure for a 1,000-accelerator training fleet. Which conclusion follows directly from this bandwidth ratio?
- The gap is easily bridged by standard NVMe RAID arrays because sequential read throughput scales without bound across drives.
- The roughly \(479\times\) device-bandwidth gap motivates tiered staging, but required input bandwidth must be calculated from batch bytes and compute time rather than equated with HBM traffic.
- The bandwidth gap is negligible because large-scale training is entirely compute-bound and rarely exercises HBM bandwidth.
- The bandwidth gap disappears when high-speed InfiniBand fabrics deliver data directly into HBM from remote storage endpoints without local staging.
A 175B-parameter model trains for 30 days on 256 nodes, writing resumable mixed-precision Adam checkpoints of roughly \(2.45\text{ TB}\) (\(350\text{ GB}\) FP16 weights, \(700\text{ GB}\) FP32 master weights, and \(1.4\text{ TB}\) of Adam moments) every 10 minutes. Explain why ML storage design is fundamentally a joint physics-and-economics optimization problem.
True or False: A cluster benchmark demonstrating that compute hardware achieves advertised peak TFLOP/s and network fabric achieves advertised bisection bandwidth is sufficient evidence that end-to-end training throughput will scale linearly with accelerator count.
An accelerator upgrade reduces compute time per batch while the input representation and storage delivery time remain fixed. What is the primary systems consequence for training cluster design?
- Training pipelines automatically increase data compression ratios to prevent accelerator starvation without requiring architectural adjustments.
- Storage hierarchies can eliminate intermediate DRAM and NVMe caching tiers because modern network fabrics directly absorb the difference.
- Checkpoint intervals must be decreased proportionally to the compute growth to keep local NVMe buffers from overflowing.
- The compute window available to deliver each batch shrinks, so input I/O can become the bottleneck unless the measured delivery path keeps pace.
In large-scale distributed training, when hundreds of nodes simultaneously pause computation to write gigabytes of model weights and optimizer states to persistent storage, the resulting synchronized burst of write traffic is called a ____.
4.2 How ML Workloads Invert Storage Assumptions
A database administrator moving to an ML infrastructure team would find that full-corpus pretraining workloads invert many familiar storage design principles. The 175B running example makes the inversion concrete. Its training pass reads every selected token once, in shuffled order, and a run that makes several passes reshuffles the same corpus for each one. Under this scenario, no small “hot” subset dominates access. Fine-tuning, curriculum learning, hard-example mining, recommendation features, and retrieval do create skewed working sets, so the inversion is a workload property rather than a universal property of ML.
Transactional databases emphasize small random accesses and strong consistency. A database server might issue thousands of 4 KB reads per second to serve user queries. Storage designs for this workload combine caching algorithms that exploit repeated access, write-ahead logs that support recovery, and redundant array of independent disks (RAID)1 configurations that trade capacity and performance for fault tolerance. The caching layers assume that recently accessed data will soon be accessed again. A full-corpus training scan breaks that assumption and changes the access pattern, while retaining the need to protect durable state.
1 RAID (redundant array of independent disks): A Berkeley taxonomy of drive-combining strategies that trade redundancy, capacity, and I/O performance (Patterson et al. 1988). RAID 0 stripes data without redundancy and can suit a disposable cache backed by a durable source. A drive failure then requires restaging; redundancy may still be worthwhile when that recovery cost or the required availability justifies it. Unreplicated checkpoints and sole dataset copies require a different durability contract.
Patterson, David A., Garth Gibson, and Randy H. Katz. 1988. “A Case for Redundant Arrays of Inexpensive Disks (RAID).” Proceedings of the 1988 ACM SIGMOD International Conference on Management of Data, 109–16. https://doi.org/10.1145/50202.50214.
Full-corpus pretraining inverts these assumptions when samples are packaged into sequential shards, allowing the pipeline to stream through datasets that span hundreds of terabytes. Individual accesses are large (megabytes rather than kilobytes) because models consume batches of images or text sequences, while immutable, versioned training shards avoid read-write conflicts during a run even though checkpoint publication and live feature updates still require explicit consistency guarantees. Image and video workloads can demand hundreds of gigabytes per second for days or weeks, whereas compact tokenized text can require much less input bandwidth even when checkpoint writes dominate total traffic. The mismatch between what storage was optimized for and what ML actually needs creates the I/O wall (principle 7): when storage throughput cannot deliver training data as fast as accelerators consume it, GPUs idle regardless of their computational power. For bandwidth-heavy image and video inputs, that wall arrives when accelerator count grows faster than provisioned storage throughput, making the data pipeline, not the model, the limiting factor whenever a fixed input service time cannot keep pace with faster compute.
↪ How storage stalls surface as communication or coordination bottlenecks in the C\(^3\) taxonomy is developed in Storage as the persistent substrate.
Systems Perspective 4.1: The moving I/O bottleneck
Hold the batch representation and storage path fixed while improving compute throughput. The batch now finishes sooner, leaving less time to deliver the next one. Prefetching can overlap delivery with execution, but it cannot overcome a sustained service-rate deficit. This compute-to-storage imbalance does not imply that every larger model is input bound: a model that performs more computation on the same batch can instead give storage more time. The design must follow workload service times, not advertised peak-throughput trends.
A normalized example isolates the effect. Suppose input delivery takes one quarter of the original compute time and overlaps perfectly with computation, so each batch takes the longer of the two service times. Doubling compute speed halves batch time, and quadrupling it halves batch time again, at which point compute and delivery take equal time. Beyond that point the pipeline is delivery bound. A sixteenfold faster accelerator still raises batch throughput only fourfold, and the remaining compute sits idle behind the input path. That plateau is an I/O wall for this workload and allocation. Faster storage, a more compact representation, or additional independent input paths can move it; deeper prefetching alone cannot.
The first inversion is access pattern. Where database workloads issue random access patterns that benefit from seek-time optimization, full-corpus pretraining performs large sequential scans. An epoch in the running example reads each selected sample once, in the order produced by shard and buffer shuffling, so the pattern resembles video streaming more than database queries; storage systems optimized for random IOPS2 waste capabilities on this workload, whereas systems optimized for sequential throughput excel. The penalty for the wrong pattern is large: a Gen4/Gen5 NVMe drive delivers roughly 7–14 GB/s for sequential reads while small 4 KB random reads can fall near 0.5 GB/s, an order-of-magnitude to 30\(\times\) drop, and hard drives pay an even steeper 100\(\times\) throughput reduction because mechanical seek times dominate random access.
2 IOPS (input/output operations per second): The metric that dominated storage procurement for decades because database workloads issue millions of small random reads. ML training inverts this priority: a pipeline streaming 256 MB shards sequentially needs sustained GB/s throughput, not per-operation speed. Provisioning storage by IOPS rating for an ML workload over-spends on random-access capability the pipeline never exercises.
The shuffling that ML training requires adds a complication rooted in the requirements of stochastic gradient descent. Stochastic gradient descent requires that each mini-batch be drawn approximately uniformly from the training distribution; presenting samples in a correlated order (all samples from the same document, all images from the same class) biases the gradient estimates and slows or destabilizes convergence. True global shuffling would satisfy this requirement perfectly, but it requires random access across the entire dataset, destroying the sequential access pattern that storage hardware demands. Even for a multi-terabyte corpus, random per-sample seeks are I/O-prohibitive: a dataset of 1 trillion 4-byte tokens (about 4 TB) stored as individual elements on NVMe, accessed at random, would take hundreds to thousands of hours to read at the drive’s random-read IOPS rate rather than about ten minutes of sequential streaming. The practical solution is therefore a compromise that shuffles the order of large data shards and then shuffles samples within each shard’s local buffer. This preserves sequential I/O, but adequate mixing depends on shard composition and buffer size, a dependence section 4.4.2 turns into a validation step for the loader.
The second inversion is working set size. Traditional applications rely on temporal locality: a web server repeatedly accesses popular pages, and a cache holding the top 10 percent of content serves 90 percent of requests. In the chapter’s full-corpus pretraining scenario, the 6 TB serialized corpus has no “popular” token range; each selected token is consumed once per epoch. A cache of any practical size holds only a small fraction of the corpus, and most samples are effectively “cold” when accessed. This access pattern makes traditional recency caching much less effective. A least recently used (LRU)3 cache can approach a 0 percent hit rate for a cyclic scan larger than the cache, because each sample is evicted before its next access. With independently reshuffled epochs, cross-epoch hits are low but nonzero and depend on the cache fraction and sample order.
3 LRU (least recently used): An eviction policy that discards the entry unused for the longest time, effective when recently accessed data is likely to be accessed again soon. Under independent reshuffling, some samples retained from the end of one epoch may be reused early in the next, so teams should measure that reuse before allocating DRAM that could otherwise serve as prefetch buffers.
Other training policies create different locality. Multi-task or curriculum learning, hard-example mining, and filtered sampling access some subsets more frequently during particular phases. This temporary working set lets the NVMe tier exploit locality. Large-scale pretraining jobs that repeatedly scan a fixed corpus remain the scenario for the hierarchy derived here; systems serving another sampling policy should measure its reuse distribution before adopting the same cache design.
The third inversion is write pattern. Transactional systems generate continuous streams of small writes, each immediately durable. ML systems generate occasional large writes when saving checkpoints. A 175B parameter model checkpoint, including optimizer state, occupies roughly 2,450 GB. Saving it every 10 minutes generates concentrated bursts that saturate bandwidth for seconds, followed by long idle periods. These synchronized bursts, called checkpoint storms and defined formally in definition 4.5, must be absorbed by the shared file system without disrupting ongoing training reads. The bursty write pattern is particularly challenging because all nodes in the cluster write their checkpoint shards simultaneously. If 256 nodes each write 10 GB, the parallel file system receives 2.4 TB of writes in a single burst, which blocks training if the job writes synchronously to that tier. Local staging and asynchronous replication can shorten this pause, as section 4.6 develops. When checkpoint and gradient traffic share one fabric, traffic isolation also keeps the burst from delaying the job’s collectives.
↩︎ Traffic isolation and quality-of-service mechanisms are established in Traffic isolation and quality of service.
The fourth inversion is subtler. The read/write ratio shifts by lifecycle phase. During the intervals between checkpoints, the input pipeline reads continuously. Across a complete run, however, the read/write ratio depends on input size, epoch count, checkpoint size, and save frequency. The running language-model example produces far more checkpoint bytes than training-input bytes despite spending most of its time between saves. During data preprocessing, both reads and writes are heavy, and the access pattern more closely resembles a MapReduce job than a training loop: tokenization, deduplication, and shuffling scan the raw corpus once (large sequential reads), write intermediate artifacts (large sequential writes), and then scan those artifacts again for the next stage. A 3 TB compressed text corpus typically expands to 6 TB of tokenized shards before the first training epoch begins, loading each storage tier differently from the read-only training phase that follows. No single storage configuration optimizes for all phases, which is why ML systems require a multi-tier hierarchy rather than a single storage technology.
A fifth inversion emerges when comparing training and inference workloads. Training reads datasets sequentially and writes checkpoints in bursts. Weight-resident inference, by contrast, performs one large model read at startup and then serves requests from HBM. Its storage challenge is cold-start latency: the time required to load a model when scaling up or recovering from failure. The binding constraint flips from sustained dataset throughput to a bulk read whose duration depends on which tier supplies the weights. Retrieval, state offload, and models larger than aggregate HBM create additional serving-time I/O, so this weight-resident case is a baseline rather than a universal inference pattern. Section 4.9 derives the load times and connects that baseline to the retrieval workload that follows.
Serving at fleet scale also creates a fan-out read burst. A serving cluster with 100 replicas of the 175B running model holds 35 TB of FP16 weights, and a model rollout must deliver a new version to every replica within minutes while the old version keeps serving. The burst is the checkpoint storm in reverse. Instead of many nodes writing to shared storage at once, many nodes read the same data at once.
| Workload pattern | Traditional assumption | ML reality |
|---|---|---|
| Access pattern | Random access | Sequential streaming |
| Working set | Fits in cache, with strong temporal locality | Exceeds all cache levels; low locality in full-corpus scans |
| Write pattern | Continuous small writes | Bursty large writes |
| Read/write ratio | Balanced | Phase-dependent (read-only to write-dominated) |
| Training vs. inference | One access pattern for all phases | Corpus streaming in training; bulk model loads and fan-out in serving |
Together, the five inversions collected in table 1 reduce to one procurement rule, which is to optimize for streaming reads and bursty writes rather than database-style random IOPS. An organization provisioning storage for ML based on database-era heuristics will over-invest in random IOPS for sequential training shards, under-invest in the sustained bandwidth those shards require, and fail to account for the bursty write patterns that checkpointing creates.
Checkpoint 4.1: Storage workload analysis
Consider the storage subsystem for a new ML training cluster with 512 GPUs. The primary workload will train large language models on a 10 TB text dataset.
Which storage tier can keep accelerators fed depends on workload demand, not on a model’s parameter count. The required rate is the aggregate input bytes consumed during a delivery window divided by that window, and demand above a tier’s allocated service rate cannot be sustained by prefetching alone. A larger model need not require a higher input rate, because representation, batch size, parallelism, and compute time jointly determine it; section 4.4 turns that dependence into a sizing equation. Adding clients can raise the aggregate service a shared tier provides, while contention lowers the share available to any one job.
For the running example, the inversions first decide how the corpus is packaged. The 1.5 trillion tokens of training data produce roughly 6 TB of sequential token-ID reads per epoch, even though the compressed source corpus is only 3 TB. Stored as one file per sample, the corpus would spend its storage service on file opens rather than payload bytes, a metadata request rate rather than a byte rate that section 4.3.6 develops as the small file problem. Preprocessing it into large sequential shards (Aizman et al. 2019) amortizes the fixed cost of open, seek, and close across many tokens, reducing metadata demand without changing the required payload rate; section 4.3.5 compares the shard formats that make this packaging work. Where those shards should live, and how close to the accelerator, is the question the storage hierarchy answers.
Self-Check: Question
A storage procurement team is sizing storage hardware for a cluster dedicated to pretraining foundation models on a \(200\text{ TB}\) immutable text corpus. Which purchasing decision represents the most severe misallocation of budget based on ML workload characteristics?
- Paying a premium for enterprise SSDs optimized for high \(4\text{ KB}\) random-read IOPS while under-provisioning sustained sequential read bandwidth (GB/s).
- Aggregating raw text samples into \(256\text{ MB}\) to \(4\text{ GB}\) contiguous binary shards prior to training to amortize file-system metadata operations.
- Provisioning local NVMe drives on compute nodes to serve as a warm read cache for multi-epoch training passes.
- Sizing the parallel file system write tier to absorb synchronized multi-terabyte checkpoint write bursts from hundreds of nodes.
True or False: An in-memory LRU cache sized to \(300\text{ GB}\) placed in front of a \(3\text{ TB}\) uniformly shuffled pretraining dataset will achieve roughly a \(90\%\) hit rate after the first epoch warms the cache because all samples are reused across epochs.
Explain why ML data loaders implement shard-level shuffling combined with within-shard buffer mixing rather than true global per-sample random shuffling across petabyte-scale training corpora.
When an inference platform deploys a new version of a 175B-parameter model (\(350\text{ GB}\) FP16 weights) across 100 serving replicas, how does the storage access profile contrast with a training checkpoint save?
- It generates continuous small random writes to update parameter journals on each replica node.
- It streams an incremental delta of only modified parameters over hours to minimize bandwidth utilization.
- It creates a synchronized fan-out read burst of roughly \(35\text{ TB}\) (\(100 \times 350\text{ GB}\)) that must complete within the deployment latency budget while serving traffic continues.
- It requires sustained multi-gigabyte-per-second sequential write bandwidth to central durable object storage.
A team plans one storage configuration for the whole life of a language-model project: tokenizing and deduplicating a \(3\text{ TB}\) compressed corpus into \(6\text{ TB}\) of shards, then training on those shards with periodic checkpoints. Why does the chapter conclude that no single configuration optimizes every phase?
- Preprocessing reads and writes large sequential artifacts in MapReduce-like passes, while training reads immutable shards between bursty checkpoint writes, so the read/write balance and access pattern change by phase.
- Training reads are dominated by small random lookups that only a database-style random-IOPS tier can serve, while preprocessing is purely sequential.
- The tokenized corpus is smaller than the compressed source, so preprocessing frees capacity that the training phase cannot use.
- Checkpoint writes are continuous and small, so they require a different write-ahead log configuration than preprocessing.
4.3 The ML Storage Hierarchy
No single storage device can hold a petabyte-scale training corpus, absorb multi-terabyte checkpoints, and still feed an accelerator at terabytes per second. HBM supplies high local bandwidth at limited capacity, whereas object storage pools durable capacity behind a much slower service and client path. A multi-tier hierarchy combines these resources rather than requiring one technology to meet every demand. Each tier offers a different balance of bandwidth, latency, capacity, and cost. The hierarchy extends the familiar processor memory hierarchy across nodes. The new fleet-level decision is how local staging reduces demand on shared storage while preserving a durable, consistently versioned source. Comparing the tiers fairly requires stating each resource at its own scope, per accelerator, per node, or as an aggregate shared service (table 2).
| Storage tier | Typical capacity | Bandwidth | Latency | Illustrative cost basis |
|---|---|---|---|---|
| GPU HBM | 80 GB | 3.35 TB/s | ~100 ns | ~$15/GB acquisition cost |
| Host DRAM | 512 GB–2 TB | 200 GB/s | ~100 ns | ~$3/GB acquisition cost |
| Local NVMe SSD | 4–30 TB | 7–25 GB/s | ~100 μs | ~$0.10/GB/month provisioned |
| Parallel File System | 100+ PB | 1+ TB/s aggregate | ~1 ms | ~$0.03/GB/month provisioned/service |
| Object Storage | Very large pool | 100 GB/s aggregate | ~50 ms | ~$0.02/GB/month service |
| Archive/Cold Storage | Very large pool | 1 GB/s | Minutes to hours | ~$0.004/GB/month service |
HBM’s advantage over host DRAM in table 2 is bandwidth, not latency, because its lead comes from wide stacked interfaces rather than faster cells (HBM and the memory wall). The latency cliff between adjacent tiers opens only at NVMe and below, where the physical distance from the accelerator grows from millimeters to meters. The storage hierarchy model (principle 8) therefore governs storage tiering and pipeline design: the local tiers exchange bandwidth for capacity, while shared tiers aggregate many devices and expose a different client path. Because per-client bandwidth depends on allocation and contention rather than a fixed factor between tiers, data format choices, caching strategies, prefetch buffer sizing, and tiering policies all exist to manage the movement of data upward through the hierarchy so that the accelerator never starves.
The rest of the chapter numbers the six tiers by distance from the accelerator, from Tier 0 (HBM) through Tier 1 (host DRAM), Tier 2 (local NVMe), Tier 3 (parallel file system), and Tier 4 (object storage) to Tier 5 (archive). Distance alone hides an important distinction, because each tier’s bandwidth figure describes a different scope: per accelerator, per node, or a shared service divided among its clients (figure 1).
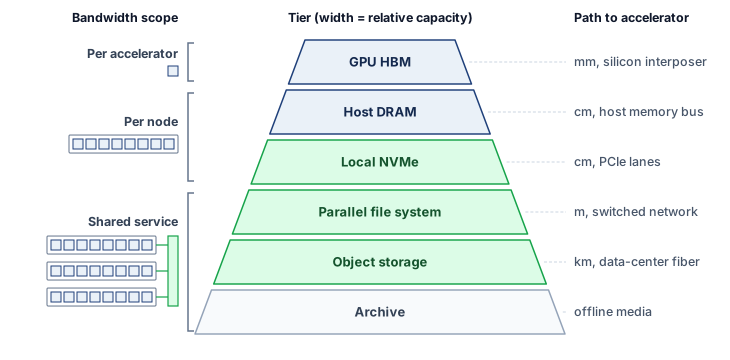
The physical tiers of figure 1 govern the trade-off among access distance, capacity, and cost. Shared services can aggregate more bandwidth than an individual local device, so the ordering is not a monotonic ranking of aggregate throughput. This trade-off is not arbitrary; it reflects the physics of data proximity. HBM sits on the same silicon interposer as the accelerator, connected by thousands of parallel traces measured in millimeters, whereas host DRAM connects to the CPU memory controller and reaches the accelerator across the host-device interconnect, and local NVMe reaches across the circuit board over PCIe lanes. Beyond the node, the parallel file system traverses meters of cable and network switches, while object storage may span kilometers of fiber between data centers. Distance, protocol overhead, and contention can increase access latency, while media technology and provisioning determine capacity cost. Distance is therefore a guide rather than a measurement; only the complete client path establishes all three properties for a given consumer.
The engineering challenge is to deliver each batch to HBM before the accelerator needs it. Return to the running example: the durable corpus lives in object storage (Tier 4) as a 3 TB compressed source copy plus 6 TB of tokenized training shards, but the accelerator needs each batch in HBM (Tier 0) within 200 ms. The chapter’s reference design fixes one path between them. At job start, each node copies its share of the tokenized shards from object storage to its local NVMe (Tier 2); the single training epoch then reads from that local copy, prepares batches in host DRAM, and transfers them to HBM, while the parallel file system (Tier 3) holds checkpoints rather than training inputs. Streaming the shards directly from object storage, or serving them from a parallel file system, are the alternatives the chapter weighs against this design, and the hierarchy describes placement choices, not a requirement that every byte visit every level.
4.3.1 Bandwidth cliffs between tiers
Stepping down one level from a single accelerator’s HBM (3.35 TB/s) to the whole host’s DRAM (~200 GB/s) drops bandwidth by roughly 16.8×, and that comparison still understates the cliff on an eight-GPU node because all eight accelerators share the same host-memory bandwidth. Comparing adjacent tiers requires making the scope of each rate explicit—per accelerator, per node, or across a shared service—as bracketed in figure 1. Between host DRAM and NVMe, the ratio is roughly 7.1× (200 GB/s vs. ~28 GB/s from a 4-drive RAID-0). Between NVMe and a parallel file system, the ratio depends on the per-node allocation: if a 1 TB/s aggregate parallel file system (PFS) serves 256 nodes, each node receives roughly 4 GB/s, a 7× reduction from the local RAID-0 stripe. Object-storage throughput likewise depends on the client path and allocation; there is no fixed ratio to a parallel file system.
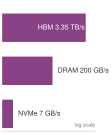
Per-client bandwidth falls roughly 7 to 17\(\times\) at each step from HBM to a node’s share of the parallel file system.
As section 4.1 established, a cliff is not a feed requirement; the feed rate remains input-batch bytes divided by iteration time, summed over distinct consumers. What the cliffs decide is where buffering must sit. Along the chosen path, host DRAM can buffer prepared batches and NVMe can cache shards from shared storage. Each buffer must cover the delay of the tier below it while that tier sustains the consumption rate; durable repositories need not act as intermediate buffers.
The same hierarchy can be analyzed as a cache rather than as six isolated devices. If a request hits the hot tier with probability \(\HotTierHitProbability\), taking \(\HotTierServiceTime\), and otherwise falls through to a colder tier, taking total end-to-end miss-path time \(\MissPathServiceTime\) (including the failed hot-tier lookup), its mean service time is
\[ \mathbb{E}[\TieredRequestServiceTime] = \HotTierHitProbability \HotTierServiceTime+ (1-\HotTierHitProbability)\MissPathServiceTime. \tag{1}\]
For fixed-size records served serially, the corresponding effective bandwidth is the record size divided by \(\mathbb{E}[\TieredRequestServiceTime]\). The arithmetic makes small miss rates consequential: with a 95 percent hit rate and a cold-tier access 100\(\times\) slower than a hot-tier access, \(\mathbb{E}[\TieredRequestServiceTime]=5.95\HotTierServiceTime\), so the effective request rate is only about one-sixth of the all-hot rate. Concurrent requests and prefetching can overlap service, so this mean is a sizing baseline rather than a fleet-throughput or latency guarantee. Correlated misses or a heavy-tailed cold tier can drain the prefetch buffer even when the average satisfies the pipeline budget, so production designs must check a tail percentile and miss bursts as well as \(\mathbb{E}[\TieredRequestServiceTime]\).
The batch-volume arithmetic also explains why increasing cluster size creates storage pressure. Aggregate demand is each consumer’s batch bytes divided by its compute window, summed over consumers, so at a fixed per-node rate it grows linearly with node count. The per-node rate itself spans orders of magnitude across data modalities, as text and image training on the running cluster show.

Image training demands 1,800× the storage bandwidth of text.
Napkin Math 4.1: Text vs. image bandwidth
Problem: How much aggregate storage bandwidth does a 2,048-GPU cluster require for text training vs. image training?
Setup: Compare two declared batch representations at the same compute window and number of independent input consumers. The result depends on batch volume and rate, not modality alone. Both jobs are generic ones sized to the running cluster, not the 175B running job. Each GPU consumes one per-GPU batch every step, a pace that fits a model far smaller than 175B parameters.
For text training, the demand is low. With a per-GPU batch of one packed sequence of 4,096 tokens and a 200 ms step time, the aggregate bandwidth is:
\[2{,}048 \text{ GPUs} \times 4{,}096 \text{ tokens/GPU} \times 4 \text{ bytes/token} \div 0.2\text{s} \approx {167.8 MB/s}\]
This is easily served by a single network-attached storage node.
Image training demands far more. Using a common batch size of 256 per GPU (ImageNet at \(224{\times}224\), roughly 116 KB/image), the aggregate bandwidth is:
\[2{,}048 \text{ GPUs} \times 256 \text{ images/GPU} \times 115.7 \text{ KB/image} \div 0.2\text{s} \approx {303.2 GB/s}\]
Systems insight: Under the stated batch representations and compute times, image training requires 1,800× higher input bandwidth than text training. The text example is volume-heavy but bandwidth-light. One network-attached storage server can carry its input feed, so its storage design is shaped by total corpus volume and, as later sections show, by checkpoint traffic. The image example is bandwidth-heavy, with a feed that exceeds any single storage server and calls for the aggregate bandwidth of many servers or of local caches. Whether either demand becomes an actual bottleneck still depends on the measured delivery rate of the path that serves it.
The 175B running job sits lower still. Its 6 TB epoch spread over the 30-day window averages about 2.3 MB/s for the whole cluster, corpus bytes divided by run length, roughly 70× below the notebook’s generic text job. Each token of a 175B model carries so much computation that the corpus trickles in, which is why the running example’s storage design is shaped by checkpoint traffic rather than by its input feed.
The image result is a floor for visual data rather than a ceiling. At about 303.2 GB/s across 256 nodes, the image job already consumes nearly a third of a 1 TB/s parallel file system built from 100 data-serving nodes (the architecture section 4.3.6 develops). Higher-resolution images and video clips, at megabytes per sample rather than the roughly 116 KB of a compressed ImageNet image, raise the per-node demand by an order of magnitude or more, and a fleet several times larger multiplies it again. Demand at that scale exceeds what a shared file system of this size can serve, so the architecture must rely on local NVMe caching to take repeated reads off shared storage.
The bandwidth cliff between tiers also has implications for the data format at each level. Computation consumes float16 tensors, packed token IDs, or other supported representations, while NVMe and object storage can retain compressed records. Compression reduces bytes stored and transferred but adds decoding work. The chosen format must let CPU or GPU decoding keep pace with consumption; maximum compression can reduce end-to-end throughput when decoding becomes the limiting stage. A host-decoded path stages the resulting tensors in DRAM, while a GPU-decoded path moves the transformation and its resource demand to the accelerator.
The format challenge intensifies for multi-modal training, which combines text, images, audio, and video in a single model. Serialized sizes span orders of magnitude, from 4 bytes per text token to roughly 116 KB per compressed image to megabytes per short video clip, depending on representation, compression, resolution, and duration, and each modality requires its own decoding and augmentation work. A multi-modal training job must manage these parallel streams and provision for their combined service demand. For a corpus containing 3 TB of text, 50 TB of images, and 200 TB of video, video dominates retained capacity. Its bandwidth contribution also depends on how frequently training samples it and how many bytes each sampled batch reads. Corpus size alone determines neither the delivery rate nor the modality’s contribution to model quality.
Tracing how each tier meets these bandwidth and format constraints begins at the top of the pyramid and steps outward from the accelerator to the archive. That descent starts where computation actually consumes bytes: HBM, the tier fast enough to keep accelerator arithmetic fed but far too scarce to hold the full training corpus.
4.3.2 Tier 0 GPU HBM
The scarcest resource in the system sits closest to the arithmetic. On the H100 used here, HBM holds the active weights and activations served to the accelerator, while caches and on-chip buffers reuse portions of that state. Its stacked packaging supplies 3.35 TB/s of aggregate bandwidth, the top of the cliffs just measured. That bandwidth is what makes large-scale deep learning feasible, because a matrix multiplication involving billions of parameters reads those parameters from memory on every forward and backward pass. What HBM lacks is room.
↩︎ High-bandwidth memory packaging, the 3D stacking and through-silicon vias behind this bandwidth, is established in HBM and the memory wall.
For placing the unpartitioned running model, the immediate constraint is capacity. Once state fits, HBM bandwidth can still limit execution. The node-memory budget of Node memory partitioning already shows how far one 80 GB device falls short of the 175B running example: the FP16 weights alone, 350 GB, need at least five H100 accelerators. The mixed-precision contract this chapter checkpoints also retains 700 GB of FP32 master weights, so weights, gradients, master weights, and Adam moments occupy 2.80 TB before activations and communication buffers. State that does not fit in one HBM pool must be split across accelerators or kept outside HBM and fetched when needed. Splitting it across the cluster makes the run possible, but every shard becomes a separate piece of state that lower tiers must stage, save, and restore in step with the others. HBM scarcity is what forces the rest of the hierarchy to exist, and HBM is the destination that every lower tier exists to serve.
Because HBM capacity is so limited relative to both model size and dataset size, the accelerator processes data in batches. Each batch occupies a fraction of HBM for the duration of one forward-backward pass, then is discarded to make room for the next. The rate at which batches must be supplied sets the bandwidth requirement for all lower tiers.
The razor-thin margin is a defining feature of large model training, visible in the HBM budget that each 80 GB H100 carries while the fleet trains the 175B parameter model (table 3). The table treats partitioning as a storage layout, and the chapter keeps this one layout throughout. Tensor parallelism splits the model weights eight ways inside each node, so every node holds one complete copy of the weights spread across its GPUs. Optimizer, master-weight, and gradient state are additionally sharded across the 256 nodes, so each GPU holds only its slice of that state rather than a full replica. Sharding optimizer and gradient state across data-parallel replicas while each replica keeps its weights is the second stage of the Zero Redundancy Optimizer (ZeRO), a training technique in its own right; its third stage also partitions the weights. Here only the resulting per-GPU slices matter, because they set the storage pressure HBM sees.
↪ Sharded data parallelism (ZeRO and FSDP), which partitions optimizer, gradient, and weight state across workers, is developed in Memory-efficient data parallelism with ZeRO and FSDP.
| Component | Size per GPU |
|---|---|
| Model Weights (FP16, 8-way shard) | 43.75 GB |
| Optimizer State (node-sharded) | 0.7 GB |
| FP32 Master Weights (node-sharded) | 0.34 GB |
| Activations (variable by sequence length) | 10–20 GB |
| Gradient Buffers (FP16, node-sharded) | 0.2 GB |
| Communication Buffers (NCCL) | 2–4 GB |
| Total Occupied | 56.9–68.9 GB |
Even with aggressive partitioning, the total memory footprint reaches 56.9–68.9 GB in decimal gigabytes, about 66.3–80.3 percent of the HBM pool (the device’s nominal 80 GB is a binary capacity, slightly larger than 80 decimal gigabytes). The remaining headroom shrinks further once fragmentation and framework workspaces are included, and that headroom is all the incoming data pipeline has to work with. An input batch and its activations occupy HBM for one training step, while model weights and optimizer state persist across steps. Prefetching the next batch therefore competes with the live training footprint for scarce capacity; a deeper input queue is useful only if the memory budget can accommodate it.
From the data pipeline’s perspective, Tier 0 is not a storage tier to be managed but a constraint to be satisfied. The pipeline’s purpose is to ensure that the batch the accelerator needs next is already resident in HBM before the current batch’s computation completes. If it arrives late, the accelerator stalls. If it arrives early, it consumes HBM that could hold activations. The tension between “just in time” and “just too late” defines the pipeline’s buffer management strategy, quantified in section 4.4.
4.3.3 Tier 1 host DRAM
One level below HBM, host DRAM serves as the staging area for the data pipeline. Every byte of training data that reaches the accelerator passes through host DRAM first (unless GPUDirect Storage bypasses it, as described in section 4.5). A typical training node contains 512 GB to 2 TB of system memory shared across the host CPU and its peripherals. While the bandwidth between host DRAM and the accelerator is limited to what PCIe Gen 5 (about 64 GB/s per direction, 128 GB/s bidirectional) can provide, host DRAM plays three roles in the ML storage hierarchy: it is the prefetch buffer, a home for embedding tables too large for HBM, and the augmentation workspace. Only CPU-accelerator superchips with a coherent NVLink-class host link raise that path toward the 900 GB/s that NVLink provides between accelerators. The data loader occupies two of these roles at once, because its augmentation stage and the prefetch buffer it fills both live in host DRAM.
The data loader pipeline that runs in host DRAM works as it does on a single node: reader threads fetch compressed samples, workers decode and augment them, and a collation stage assembles batches in pinned, or page-locked, memory for the host-to-accelerator direct memory access (DMA) transfer. At fleet scale, these stages compete with the node’s other demands for the same host DRAM.
↪ The single-node overlap techniques behind this loader (prefetching, pinned host buffers, and double buffering) are collected for reference in D·A·M coordination from sum to max.
Host DRAM’s most critical function is serving as a prefetch buffer. When the accelerator finishes processing batch \(\BatchIndex\), batch \(\BatchIndex+1\) should already be assembled in host memory, ready for transfer to HBM. The depth of this prefetch buffer determines how much I/O variance the pipeline can absorb without stalling.
Recommendation workloads, the regime of Archetype B (DLRM at Scale), place a different demand on host DRAM: hosting embedding tables that can exceed 100 GB, far too large for HBM. These tables reside in host DRAM and are accessed through lookups that fetch only the rows needed for the current batch. The bandwidth between host DRAM and HBM becomes the critical bottleneck for these workloads, and some systems go further, pooling embedding tables in the DRAM of dedicated CPU servers and returning only the requested rows over remote direct memory access (RDMA).
Host DRAM also provides the augmentation workspace that the CPU pipeline requires. Data augmentation operations (resizing images, tokenizing text, applying noise) execute on the CPU and require temporary memory for intermediate results. A training pipeline that applies five augmentations to a 256-image batch at 116 KB per image needs tens of megabytes of working space for each augmentation stage. Although modest per-batch, this memory accumulates when multiple data loader workers run in parallel. GPU-side decoding with libraries such as the NVIDIA Data Loading Library (DALI) moves decode and augmentation onto the accelerator, so smaller compressed bytes cross the host link and host DRAM bandwidth demand falls; the work then consumes HBM capacity and compute cycles instead, which helps an input-bound job and hurts a compute-bound one.
The three roles interact in subtle ways. The prefetch buffer and the augmentation workspace compete for the same physical DRAM, and embedding tables consume capacity that could otherwise serve as deeper prefetch queues. A node with 512 GB of DRAM hosting a 200 GB embedding table has only 312 GB remaining for prefetching and augmentation. If the data loader uses 8 workers, each maintaining a decode buffer of 1 GB, the effective prefetch capacity drops further. System architects must balance these competing demands by profiling the actual memory consumption of each pipeline stage and provisioning DRAM accordingly.
The physical layout of DRAM also matters. On a dual-socket node, each socket’s DRAM forms a non-uniform memory access (NUMA) domain local to the GPUs on that socket’s PCIe root complex, and reaching the other socket’s DRAM crosses the inter-socket link, with a penalty that depends on the processor, topology, and concurrent traffic (The PCIe hierarchy within a node). NUMA-aware allocation keeps each data loader worker and its prefetch buffer in the same NUMA domain as the GPUs it serves; the gain should be measured on the target node rather than assumed.
Host DRAM sits below the first cliff of section 4.3.1, and the host-to-GPU interconnect adds a separate cliff, with effective transfer bandwidth depending on whether the node uses PCIe or NVLink. In the conventional path that stages payloads through host memory, a depleted DRAM prefetch buffer leaves the accelerator waiting for lower tiers. The direct path of section 4.5 removes that staging copy when the data layout and devices support it. In the running example, the 256-node cluster requires each node’s host DRAM to sustain a continuous flow of decoded, augmented batches ready for PCIe transfer. If the NVMe-to-DRAM read pipeline falls behind by even a few hundred milliseconds, the prefetch buffer drains and the accelerator idles until the next batch arrives.
4.3.4 Tier 2 local NVMe
When the working set exceeds host DRAM, the system falls to Tier 2: the local NVMe drives attached directly to the compute node. NVMe4 provides a high-performance protocol designed specifically for solid-state drives, achieving 7 GB/s of sequential throughput per drive. NVMe’s deep queues and PCIe lanes, rather than faster flash, explain why it delivers 10\(\times\) to 50\(\times\) the throughput of SATA SSDs (capped near 550 MB/s by the link) with identical NAND flash, provided the loader keeps many asynchronous reads outstanding. With four drives in a RAID-0 configuration, a single node can sustain roughly 28 GB/s of sequential reads before overhead, sufficient to stream the 6 TB serialized dataset from local disk in about 3.6 minutes under ideal sequential conditions.
4 NVMe (Non-Volatile Memory Express): A storage protocol designed for SSDs, connecting directly to the CPU via PCIe lanes. Its many deep command queues, replacing the single 32-command queue of the older SATA interface, are what allow a multi-worker ML data loader to keep enough requests outstanding to saturate the drive’s bandwidth.
In ML training, local NVMe acts as a warm cache, storing data shards fetched from distributed storage. Workers can reread resident shards across epochs without fetching them over the network again. The savings depend on reuse, cache capacity, and whether remote reads cross a charged transfer boundary (section 4.8). Staging pays an initial transfer cost and provisions local capacity in exchange for avoiding later remote reads; it does not eliminate storage cost or read latency.
The warm cache pattern requires careful capacity planning. A training node with four 7.68 TB NVMe drives provides approximately 30.7 TB of local storage. For the running example, the 6 TB serialized dataset fits comfortably on a single node’s local storage, with room for checkpoint staging and temporary augmentation buffers. A multi-modal training job combining 20 TB of images, 10 TB of text, and 5 TB of audio totals 35 TB, exceeding local capacity by about 4.3 TB and forcing the pipeline to stream from the parallel file system for at least part of the dataset. The design trade-off is between provisioning more local NVMe (which increases node cost) and accepting network-dependent reads (which risks latency spikes).
The I/O wall takes a deceptive form at this tier. The HBM-to-NVMe ratio of section 4.3.1 does not set demand, so the question here is whether the stripe meets the input-batch rate, not whether it approaches HBM. Pipelining overlaps that delivery with compute (section 4.4), while GPUDirect Storage (section 4.5) can remove host payload copies when those copies limit throughput. The wall is easy to miss because NVMe performance is excellent by historical standards. A storage engineer accustomed to HDD-era throughput of 150 MB/s might view 28 GB/s from a local RAID-0 stripe as more than enough. Whether 28 GB/s suffices depends on the batch representation and consumption rate. Compact text may fit within this budget, while image or video inputs may require more bandwidth; overlap hides transfer time only when sustained supply keeps pace with demand.
Local NVMe also supports local checkpoint staging. Writing a consistent snapshot locally and replicating it to shared storage in the background can shorten \(\CheckpointWriteTime\), the time training pauses to save a checkpoint, when the shared write would otherwise be slower. Resuming after a local save accepts a period during which a node failure can destroy the new shard. The storage design must therefore specify both the exposed pause and the later durability boundary, while retaining a previous recoverable generation. Section 4.6 develops this trade-off and its timing model.
The same local NVMe tier also pays for itself by recovering utilization lost to remote-read latency. When congestion on a shared file system drains the host prefetch buffer and exposes I/O wait on every step, staging shards onto node-local flash converts that exposed remote wait into reclaimed accelerator compute time.
Napkin Math 4.2: Return on investment of local NVMe caching
Problem: A vision-model training pipeline, a separate workload from the 175B language model, runs each step in 800 ms on the 1,024-GPU reference cluster. It reads from a shared parallel file system, and even with prefetching, congestion bursts on that shared service drain the loader’s buffer and leave an average of 150 ms of exposed I/O wait per step. Assume that serving the same shards from local NVMe leaves only 10 ms of exposed wait per step, the residue of local tail latency that the prefetch queue does not cover. How much does adding local NVMe SSDs to each node improve GPU utilization?
Math: GPU utilization here means the fraction of step time spent in computation, an active-time fraction rather than model FLOPs utilization.
- Remote Only: 800 ms / (800 ms + 150 ms) \(\approx\) 84.2 percent.
- Local Cache: Prefetching from local NVMe removes the congestion bursts of the shared service, leaving the assumed local residue.
- New Util: 800 ms / (800 ms + 10 ms) \(\approx\) 98.8 percent.
Systems insight: Local storage can act as a GPU utilization multiplier. In this scenario, adding a $500 NVMe drive to a node whose accelerators each cost $30,000 recovers 14.6 percent of the GPU’s capacity that was previously wasted on I/O wait. Across the 1,024-GPU cluster, that utilization gain is equivalent to adding 149 GPUs worth of useful work without buying that many more accelerators. The gain is exactly the exposed remote wait that local reads remove, so it is large only when shared-storage congestion leaves a wait of this size; where it does, local NVMe is not auxiliary but the physical buffer that decouples expensive compute from unpredictable shared storage.
A practical concern at this tier is SSD endurance. NAND flash memory can sustain a limited number of write-erase cycles before the cells degrade. Enterprise NVMe drives are rated for 1 to 3 drive writes per day (DWPD) over a 5-year lifespan. For a 7.68 TB drive at 1 DWPD, this means the drive can absorb 7.68 TB of writes per day, or roughly 14 PB total over its lifetime. ML training workloads are predominantly read-heavy (the dataset is written once and read many times), which is favorable for SSD endurance. However, checkpoint writes can be intensive: if each node saves its roughly 10 GB share of the running example’s checkpoint every 10 minutes, that is about 1.4 TB per day of checkpoint writes spread across the node’s drives, well within a four-drive node’s 1 DWPD budget. The risk emerges when local NVMe is used as a staging buffer for both checkpoint writes and dataset caching: the combined write volume from initial dataset staging plus repeated checkpoint saves must remain within the drive’s endurance rating.
4.3.5 Data formats for training
Local NVMe can stream 28 GB/s per node, but packaging determines how much of that bandwidth reaches the loader. The same multi-terabyte dataset stored in different formats can yield I/O throughput that differs by over 100\(\times\) on identical hardware, because each format charges a different access cost: per-file metadata, unnecessary feature reads, or sequential shard traversal. A directory containing one JPEG per sample pays a separate file open and metadata lookup for every image. At roughly 10 to 50 microseconds per open in the kernel’s file-system layer, a node reading 8,000 images per second spends 80 to 400 ms of CPU time per second on opens alone, before it decodes a single byte. On a shared file system the same operations also queue at a metadata service, the fleet-scale form of this cost that section 4.3.6 develops as the small file problem. A standard ImageNet training pipeline makes the cost of the wrong format visible.
Napkin Math 4.3: The ImageNet bottleneck analysis
Problem: A ResNet-50 training job on ImageNet (1.28M, ~116 KB average) targets 1000 images/s. Can individual JPEG files on an HDD sustain that rate, or does the job need NVMe?
Math:
- Raw Bandwidth: 1000 images/s \(\times\) 116 KB = 116 MB/s.
- HDD reality: A 7200 RPM hard disk drive (HDD) delivers 100 IOPS at random reads. Sustaining 1000 images/s requires 10× more IOPS than the disk provides.
- Result: When every image is a separate random read, shuffling individual files on an HDD will starve the GPU, capping utilization at about 10 percent before decode, seek, and file-system overheads.
Systems insight: Two fixes work, and they remove different limits. NVMe answers a random read in roughly 100 μs rather than the milliseconds of a mechanical seek, so even one outstanding request covers the 1000 images/s that the HDD’s 100 IOPS cannot. Alternatively, converting the dataset to a sequential format (TFRecord/WebDataset) removes the random reads altogether and turns the HDD problem into a bandwidth one, in which the job needs 116 MB/s, within the roughly 150 MB/s that one HDD streams sequentially.
The first format choice is the record layout. Row-oriented formats, such as CSV or JSON lines, store successive records together and are easy to inspect and debug. They can stream many records from one file, although parsing text and reading unused fields consume CPU cycles and bandwidth.
A second choice solves a different storage problem. Columnar formats like Apache Parquet and Apache Arrow avoid unnecessary reads when tabular features can be selected before transfer. They organize data by column rather than by row, which allows for excellent compression as data within a column is typically of the same type and has lower entropy. Column pruning lets the reader fetch only required features. Predicate pushdown applies filters at the storage reader and can skip groups of records using their metadata, further reducing unnecessary I/O. These formats are well-suited for tabular ML tasks and feature engineering but are less natural for unstructured data like images or audio, which are treated as atomic blobs.
A third choice addresses the training access pattern directly. Sequential streaming formats reduce per-sample metadata to the cost of opening a shard. TFRecord, Mosaic’s StreamingDataset format (Databricks 2026), and WebDataset5 group many samples into large, contiguous binary files called shards. WebDataset uses standard tar archives, in which each sample keeps its image, label, and metadata entries while the loader streams the archive in order. A data loader opens a single shard and streams its contents sequentially, amortizing the open over thousands of samples. The tar-based formats have the added advantage of being valid targets for HTTP byte-range requests, making them ideal for streaming data directly from object storage without downloading the entire file first.
5 WebDataset: A data format that repurposes standard POSIX tar archives for ML training. The design insight is that tar’s sequential header-then-data layout, invented in 1979 for tape backup, maps perfectly onto the streaming access pattern that ML data loaders need.
A key trade-off within streaming formats is the presence of an index. TFRecord readers often rely on a separate index file that records each sample’s byte offset within a shard, while HDF5 embeds its index in the file itself. This enables efficient random access within a shard but introduces a metadata dependency: the index must be read and held in memory. WebDataset is indexless, because each record in the tar archive contains its own header specifying its size, allowing for purely sequential streaming without any external metadata. The trade-off is that indexless formats cannot efficiently seek to an arbitrary sample within a shard, a capability that matters for curriculum learning or active learning workloads that require nonsequential data access.
Compression integration also varies across formats, and it trades storage bytes against CPU decoding work. Parquet integrates compression at the column level, exploiting type homogeneity for high ratios. WebDataset and TFRecord typically leave compression to the individual sample: a WebDataset of images stores already-compressed JPEG files, while a text dataset might apply zstd compression per shard, and the host CPU pays for that decompression. Consider two illustrative codecs on the same corpus: a lighter codec compresses 3:1 and produces 1.5 GB/s of decoded output per CPU core, while a denser codec compresses 4:1 and produces 0.5 GB/s per core. These are scenario assumptions, not fixed properties of named codec levels. At the 28 GB/s local NVMe rate, their potential decoded output rates are 84 GB/s and 112 GB/s, respectively, provided decoding keeps pace. Sustaining those different output rates requires 56 versus 224 cores, so the denser codec needs 4× as many. Running each codec at the drives’ full output is the worst case, an upper bound on decode work; a node needs only enough cores to decode its own share of demand. The generic text job of notebook 4.1 asks the entire cluster for about 167.8 MB/s, which a single core of either codec covers, so these core counts bind only for image and video feeds whose decoded demand per node approaches the drives’ rate. With fewer cores than that demand requires, decoding limits delivery before storage saturates, so compression is chosen from the measured corpus, decoder, and available CPU budget rather than from the compression ratio alone.
For the running example, the 1.5 trillion token dataset is stored as roughly 2,000 shards of 3 GB each in a custom binary format. Each shard contains a small header (token count, vocabulary size, byte order) followed by a contiguous array of 4-byte token IDs. The number of open() calls per epoch is therefore the number of shards, not the number of tokens (trillions), an approximately 750,000,000× reduction in metadata operations that makes streaming from both local NVMe and remote storage feasible at training scale. When staged on POSIX storage such as local NVMe or a parallel file system, the data loader memory-maps the shard and indexes directly into the token array by position, achieving near-peak read bandwidth with zero per-sample metadata overhead. When the same shards are read directly from object storage, the loader uses HTTP ranged GET streaming and an explicit local buffer rather than memory mapping. The formats differ chiefly in the access cost each one imposes per sample on the storage path (table 4).
| Format | Overhead/sample | Random access | Streaming | Compression |
|---|---|---|---|---|
| Individual files | \(\approx 50\ \MicroUnitPrefix\)s (open/stat/close) | Yes | Poor | Per-file |
| Parquet | \(\approx 1\ \MicroUnitPrefix\)s (row group seek) | Yes (row group) | Good | Column-level |
| TFRecord | \(\approx 0.1\ \MicroUnitPrefix\)s (index lookup) | With index | Excellent | Per-record |
WebDataset (tar) |
~0 (sequential) | No | Excellent | Per-sample |
| Raw binary (tokens) | 0 | Yes (byte offset) | Excellent | None needed |
Packaging removes the per-file cost within one node, but no node-local format gives every node the same view of the data. That requirement belongs to the next tier.
4.3.6 Tier 3 parallel file systems
Local NVMe drives cannot give 256 training nodes a single namespace for shared datasets or a globally visible home for checkpoints that survive a node crash. A parallel file system provides that shared tier across the cluster.
Definition 4.1: Parallel file system
Parallel file system (PFS) is a distributed storage architecture for ML training clusters that stripes data across many storage servers to provide aggregate throughput exceeding the capacity of any single device.
- Significance: A PFS aggregates storage I/O bandwidth \((\StorageBandwidth)\) across object storage servers (OSS). Twenty OSS nodes delivering 10 GB/s each offer 200 GB/s aggregate. When the client and network sustain that full rate, a 10 GB striped shard loads in about 50 ms rather than the 1 second a single 10 GB/s server would need. The rate that enters the data-movement term \(\DataVolume/\Bandwidth\) of the single-machine iron law recalled in The Fleet Law is the bandwidth that reaches the actual consumer, not the aggregate rating.
- Distinction: Unlike network-attached storage, where every I/O request routes through a single server, a PFS client receives stripe location metadata from a dedicated metadata server (MDS) and then reads data directly from multiple OSS nodes in parallel: the MDS and OSS paths are architecturally separated, so data bandwidth scales with OSS count while metadata operations scale with MDS count.
- Common pitfall: A frequent misconception is that a PFS has unlimited throughput if enough OSS nodes are added. In reality, every open, stat, and create passes through the MDS, whose service rate is finite and does not grow with the number of OSS nodes; a one-time burst of 10,000 opens does not by itself establish sustained saturation. The MDS becomes a throughput bottleneck when the aggregate metadata-operation arrival rate exceeds its service rate, regardless of spare bandwidth at the OSS nodes.
A Lustre-style parallel file system decouples metadata lookups from bulk data movement (figure 2), separating two concerns that traditional file systems handle together (Schwan 2003). Metadata servers (MDS) manage the namespace (persisting file layouts and attributes on metadata targets, or MDTs): file creation, directory listings, permission checks, and lock management. Object storage servers (OSS)6 manage the actual data blocks, each serving a stripe of every large file. When a client opens a 10 GB training shard, the MDS tells the client which OSS nodes hold which stripes, and the client reads from all of them in parallel. A Lustre7 deployment with 100 OSS nodes, each providing 10 GB/s, delivers an aggregate 1 TB/s.
Schwan, P. 2003. “Lustre: Building a File System for 1,000-Node Clusters.” Proceedings of the 2003 Linux Symposium, 380–86.
6 OSS (object storage server): In parallel file system terminology, “object” means a chunk of striped file data managed by an object storage target, a usage that predates cloud object storage (S3, GCS) by over a decade. Confusing the two is a common source of miscommunication: when a Lustre administrator says “add more OSS nodes,” they mean adding data-serving capacity to the parallel file system, not provisioning cloud buckets.
7 Lustre: A portmanteau of “Linux” and “cluster,” developed at Carnegie Mellon University and first deployed in production in 2003. Lustre is common in HPC and ML infrastructure because its architecture scales aggregate bandwidth linearly with the number of OSS nodes, the same property that makes it a natural choice for training clusters where a single job may demand hundreds of GB/s of sustained read throughput.
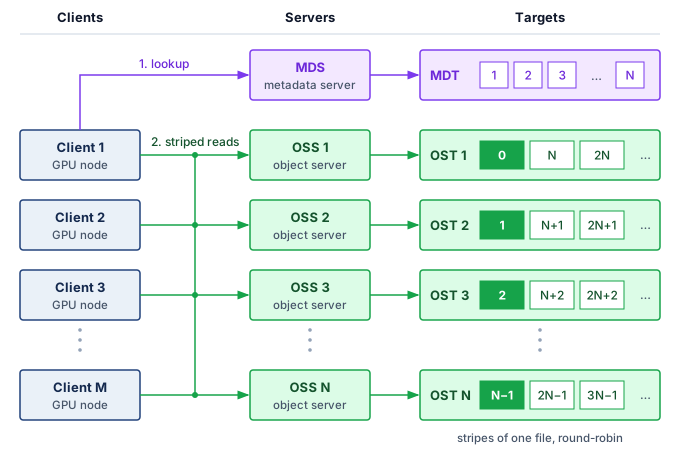
This abstract architecture has concrete implications for performance tuning. When a training job creates a new dataset directory on Lustre, the administrator configures the stripe count (the number of object storage targets, or OSTs, a file is spread across) and stripe size (the chunk size written to each OST) for that directory (Lustre Wiki 2017). For large sequential-read training shards, administrators may choose wider striping and multi-megabyte stripe sizes so a single file can draw bandwidth from multiple OSS nodes; Lustre’s striping guide treats wide striping as useful for very large files or files accessed by many clients, while smaller files often use fewer stripes to reduce overhead (Lustre Wiki 2019). A 4 GB data shard striped across 100 OSTs with 4 MB stripes places roughly 10 stripes on each OST. When a data loader reads large contiguous ranges, the Lustre client can issue parallel read requests to the OSS nodes holding those stripes, aggregating their bandwidth. The client also maintains its own read-ahead buffer, prefetching the next several stripes while the application processes the current ones. This file-system-level read-ahead is distinct from the data loader’s application-level prefetch buffer; the two layers of prefetching compound to provide deep latency hiding, making the physical distance to the OSS nodes nearly transparent to the training process.
Lustre Wiki. 2017. lfs setstripe: Set Striping Pattern of a File. Lustre Wiki manual page.
Lustre Wiki. 2019. Configuring Lustre File Striping. Lustre Wiki.
8 GPFS (General Parallel File System): Developed by IBM Research starting in 1998, now marketed as IBM Spectrum Scale. For ML checkpoint writes, its token-based distributed coordination can reduce reliance on a single dedicated metadata path, but it also makes lock behavior part of the performance envelope.
The separation between metadata and data paths is what enables the aggregate bandwidth that ML workloads demand. In GPFS8 (IBM Spectrum Scale), the architecture takes a different approach: it stripes data and metadata across shared disks and coordinates concurrent access through token-based distributed locking (Schmuck and Haskin 2002). The result is not a simple MDS/OSS split; it is a shared-disk design whose metadata and data placement can be distributed while the lock protocol preserves consistency across clients. The trade-off is greater complexity in lock management, which must scale to thousands of nodes.
The data path scales with the number of object storage servers, but every file still begins with a request to the metadata service, and that service has a finite operation rate. That finite rate is the source of the small file problem. The per-open cost that section 4.3.5 charged to one node’s CPU now lands on a metadata service shared by the whole fleet. Each open() system call requires a metadata lookup, lock acquisition, and attribute fetch. When a dataset of millions of 10 KB images is stored as individual files and 10,000 workers, a fleet several times the running cluster, each open a new file every few samples, the aggregate open rate exceeds the few hundred thousand operations per second an MDS typically serves. The MDS becomes the serialization point, and delivery collapses to its operation rate long before the data links saturate.
Definition 4.2: Small file problem
Small file problem is an ML data-loading pathology in which per-file operations overwhelm a storage system’s metadata service.
- Significance:
open,stat, andcloserequests from 10,000 workers can serialize at the metadata service, idle the cluster, and reduce effective I/O bandwidth \((\StorageBandwidth)\). - Distinction: This is a metadata request-rate and latency \((\Latency)\) problem, not a bulk bit-rate problem.
- Common pitfall: Faster SSDs do not fix this format problem. Packing samples into sequential containers such as TFRecord or Parquet amortizes metadata operations across many samples.
At production scale, the metadata bottleneck can collapse an otherwise high-bandwidth file system. When a cluster migrates from aggregated containers back to individual sample files, metadata request queues saturate long before the underlying storage servers or network links reach their byte-rate limits.
Example 4.1: The metadata meltdown
Scenario: A large-scale training cluster migrates from a preprocessed sequential dataset to 200 million raw image files stored individually on a parallel file system provisioned for 500 GB/s aggregate bandwidth.
Diagnosis: The file system delivers less than 1 percent of rated throughput. Millions of per-second stat() and open() calls overwhelm the metadata servers, choking data loaders despite abundant network and storage bandwidth.
Systems lesson: Metadata contention limits delivery when operation demand exceeds metadata service capacity. Bundling 200 million raw images into 50,000 large tar shards (for example, WebDataset) reduces the file count by 4,000\(\times\) and amortizes per-file operations across samples. Packaging alone does not prevent startup contention if loaders still enumerate files with per-file stat() calls; distributing a precomputed dataset manifest removes those repeated lookups from the hot path. Measure metadata operation rate alongside byte bandwidth to determine which service limits delivery.
Striping and aggregation solve different problems: striping distributes large files across data servers, whereas aggregation, the shard packaging of section 4.3.5, reduces the number of files the MDS must track. Realized bandwidth then depends on the reader, because a read contained within one stripe uses a single server while enough concurrent reads spanning stripes can draw from several servers at once, which means wider striping helps only when read sizes and concurrency exploit those paths and small files usually need fewer stripes.
Parallel file systems provide a shared namespace and lock management that support coordinated checkpoints (Schmuck and Haskin 2002), but the two ML write patterns need different guarantees from them. Immutable training shards remove conflicts with concurrent writers once the dataset version has been published, so readers need only agree on which completed version belongs to the run. A checkpoint needs more: file-system locks coordinate individual writes, and a completed write to one file does not establish that the other shards are complete, so a multi-file generation needs an application-level publication protocol, developed in section 4.6.
Schmuck, Frank, and Roger Haskin. 2002. “GPFS: A Shared-Disk File System for Large Computing Clusters.” Proceedings of the USENIX Conference on File and Storage Technologies (FAST ’02), 231–44.
The performance of a parallel file system depends on the balance of load across OSS nodes as well as their number. If a shard uses 10 of 100 equally provisioned OSS nodes, those servers offer at most 10 percent of the system’s aggregate server bandwidth. Realized delivery can be lower because of client limits, request size, or insufficient concurrency. Conversely, when many concurrent readers draw on shards striped across all 100 servers, demand spreads over every server and realized bandwidth can approach the system’s rating, provided the clients and network keep pace. Placement and access scheduling therefore matter alongside the number of storage servers, and a simple shard-assignment calculation shows how an imbalance can arise even when aggregate storage capacity looks ample.
Napkin Math 4.4: The thundering herd: Shard contention
Problem: A dataset is split into 1,000 shards on a shared file system. If 32 workers each pick a shard at random to start their next epoch, what is the probability that at least two GPUs “collide” on the same shard, creating a potential read hotspot? A shard collision does not imply a server collision unless the placement maps each shard to a distinct server.
Math: This is a variant of the “Birthday Problem” in probability.
- Probability of No Collision: \(\approx e^{-\ShardReaderCount^2/(2\DatasetShardCount)} = e^{-32^2/2{,}000} \approx 0.60\).
- Probability of Contention: \(1 - 0.60 = 40\%\).
Systems insight: With 32 workers and 1,000 shards, the 40.1 percent collision probability identifies a potential storage-shard hotspot. Whether that collision delays workers depends on shard placement, caching, and available service capacity. Coordinating shard assignments can reduce this source of tail latency when assignments spread demand across independently serving devices while preserving the intended sampling policy.
At the scale of thousands of nodes, tail latency (Dean and Barroso 2013a) can dominate exposed input wait. If a training step requires data from 100 storage servers and each independently has a 1 percent chance of being slow, the probability that all 100 respond quickly is \(0.99^{100} = 0.366\), meaning over 63 percent of these request sets contain at least one slow response. Shared congestion can correlate delays, changing that probability. A slow response delays the step only when prefetching fails to hide it and the required input lies on the step’s critical path. When it does, the delay is not confined to one worker, because synchronous data-parallel training waits for every worker at the next collective, so one late fetch stretches the whole fleet’s step.
Dean, Jeffrey, and Luiz André Barroso. 2013a. “The Tail at Scale.” Communications of the ACM 56 (2): 74–80. https://doi.org/10.1145/2408776.2408794.
Dean, Jeffrey, and Luiz André Barroso. 2013b. “The Tail at Scale.” Communications of the ACM 56 (2): 74–80.
Systems can mitigate tail latency through hedged requests: after a chosen delay, the client issues a redundant read to another replica and uses the first valid response. The trigger delay trades faster tail completion against extra work (Dean and Barroso 2013b). An independence model can multiply the probabilities of two slow replicas, but shared congestion and the later start of the hedge invalidate a simple squared-probability latency guarantee. Issuing a hedge at the median response time would duplicate roughly half of requests before accounting for cancellation; that load can worsen the congestion the scheme aims to avoid. A hedge therefore pays off only when its trigger sits in the measured tail and the duplicate traffic it adds stays within the spare service capacity.
↪ Tail latency as a serving constraint, where routing and load balancing decide which requests miss the p99 target, is developed in Load Balancing and Request Routing.
The effectiveness of hedged requests depends on the replicated data layout. If both replicas reside on OSS nodes that share the same network switch, a switch failure makes both copies simultaneously unavailable. Effective hedging requires failure-domain-aware placement: replicas should reside in different racks, connected through different top-of-rack switches, so that the failure of any single component affects at most one replica.
In production clusters, the parallel file system is a shared utility, simultaneously servicing many concurrent training jobs with different I/O patterns. At any given moment, a large language model job might be streaming sequentially through text shards, a computer vision job might be reading random image shards, and a checkpoint storm from a third job could be saturating write bandwidth. This concurrency gives rise to the noisy neighbor problem, where one job’s I/O pattern severely degrades performance for all other jobs. A checkpoint save that consumes a disproportionate share of the PFS’s internal network bandwidth causes read latency for other jobs to spike, potentially stalling their training pipelines. PFS administrators mitigate this through I/O scheduling policies (quality-of-service tiers, bandwidth quotas per job), but these policies add administrative complexity and can reduce peak single-job throughput.
A related challenge is namespace isolation. Different teams and workloads require different storage configurations. A team training on millions of 100 KB images first needs to aggregate samples to reduce metadata operations; increasing stripe count does not remove per-file metadata work. A team working with large video shards can use wider striping when read sizes and concurrency exploit the additional data paths. Misconfigured striping for one team’s workload can create hotspots that degrade performance for the entire shared file system. The impact of sharing is easy to quantify. A PFS with 1 TB/s aggregate bandwidth, shared across 10 concurrent training jobs, provides only 100 GB/s per job on average. If one job’s checkpoint storm consumes 400 GB/s for 10 seconds, the remaining nine jobs share 600 GB/s, a 33 percent reduction that can trigger data stalls in their accelerator pipelines.
Checkpoint 4.2: Parallel file system design
Consider a training cluster with 512 nodes, each running 8 GPUs. The training job requires 400 GB/s of aggregate read bandwidth.
Parallel file systems solve the shared-namespace problem for active training clusters, but their cost per byte is too high for the organization’s complete data holdings. The petabytes of raw training data, historical checkpoints, and preprocessed datasets that an ML organization accumulates over years require a tier optimized for capacity and durability rather than bandwidth.
4.3.7 Tier 4 object storage
Keeping petabytes of raw corpora, preprocessed shards, and historical checkpoints on a parallel file system would pay high-bandwidth server rates for data that sits mostly at rest. At petabyte scale, object storage provides the durable, lower-cost foundation of the hierarchy. Services like Amazon S3 and Google Cloud Storage organize data in object namespaces where objects are retrieved by keys rather than by POSIX directory paths (Amazon Web Services 2026c; Google Cloud 2026). Unlike file systems, which organize data in hierarchical directories with metadata-rich operations (rename, link, permission inheritance), object storage treats each object as an opaque blob identified by a unique key. The simpler interface changes the namespace operations exposed to clients; the service still manages metadata for placement, versions, access control, and integrity as capacity grows.
Amazon Web Services. 2026c. Naming Amazon S3 Objects. Amazon S3 User Guide.
Google Cloud. 2026. About Cloud Storage Objects. Google Cloud Documentation.
9 Eleven nines (99.999999999 percent durability): A design target of 11 nines annual durability corresponds to an expected loss probability of about \(10^{-11}\) per object-year; for one million objects, that is about one expected object loss per 100,000 years.
10 Erasure coding: Built on Reed-Solomon codes (Reed and Solomon 1960), which use maximum-distance-separable coding to recover the original data from any sufficient subset of encoded fragments. In storage systems, Reed-Solomon-style codes and later local-reconstruction variants trade storage overhead against repair bandwidth and degraded-read cost (Plank 1997; Huang et al. 2012). Local-reconstruction codes, for example, read fewer surviving fragments to rebuild a lost one, cutting repair traffic at the price of a little extra capacity.
Reed, I. S., and G. Solomon. 1960. “Polynomial Codes over Certain Finite Fields.” Journal of the Society for Industrial and Applied Mathematics 8 (2): 300–304. https://doi.org/10.1137/0108018.
Plank, James S. 1997. “A Tutorial on Reed-Solomon Coding for Fault-Tolerance in RAID-Like Systems.” Software: Practice and Experience 27 (9): 995–1012. https://doi.org/10.1002/(SICI)1097-024X(199709)27:9<995::AID-SPE111>3.0.CO;2-6.
Huang, Cheng, Huseyin Simitci, Yikang Xu, Aaron Ogus, Brad Calder, Parikshit Gopalan, Jin Li, and Sergey Yekhanin. 2012. “Erasure Coding in Windows Azure Storage.” 2012 USENIX Annual Technical Conference (USENIX ATC 12), 15–26.
Services such as Amazon S3 publish an “eleven nines”9 annual durability target (99.999999999 percent). Erasure coding,10 replication, placement, and repair contribute to storage protection, but a coding scheme alone does not establish a service’s durability target. Selecting a source-of-truth tier for training data and checkpoint archives requires checking the chosen service’s failure model alongside versioning, lifecycle policy, access control, and recovery testing.
Three different guarantees govern whether that source of truth is usable. Durability asks whether acknowledged data survives failures; availability asks whether the storage service responds when a client needs it; and consistency asks which version a read is allowed to observe when writes overlap or replicas disagree. Replication can improve durability and availability without by itself guaranteeing that a reader sees the newest committed checkpoint. A recovery design must therefore state all three properties instead of treating a durability percentage as a complete reliability contract.
Definition 4.3: Erasure coding
Erasure coding protects stored data by adding redundant fragments, with the Reed-Solomon scheme considered here encoding \(\ErasureDataFragmentCount\) data and \(\ErasureParityFragmentCount\) parity blocks so that any \(\ErasureDataFragmentCount\) remaining fragments recover the original.
- Significance: Coding can protect against fragment loss with less capacity overhead than full replication. A 4+2 Reed-Solomon code stores four data fragments and two parity fragments, tolerating two unavailable fragments at 1.5\(\times\) storage overhead instead of the 3\(\times\) overhead of triple replication. Actual durability also depends on failure correlation, placement, detection, and repair.
- Distinction: Unlike replication (which stores complete copies), erasure coding uses mathematical encoding (for example, Reed-Solomon) to distribute redundant information across different failure domains (disks, racks, or sites).
- Common pitfall: A frequent misconception is that erasure coding is “free durability.” In reality, it is a latency-compute trade-off: reconstructing data after a failure requires additional CPU cycles and increases the p99 latency of the storage read.
Erasure coding lets the service recover data without requiring the training application to manage fragments. In the form considered here, the service retains the original \(\ErasureDataFragmentCount\) data fragments alongside parity, so healthy reads can use the data fragments directly. When a required fragment is unavailable, reconstruction uses surviving data and parity fragments. The object interface hides that recovery procedure, but additional I/O, network traffic, and decoding can remain visible as longer read latency. Protection against data loss does not imply unchanged service time during a failure.
Object storage also costs less per byte. At a representative $0.02/GB/month, its recurring capacity rate is 5× lower than the local-NVMe rate assumed here, and section 4.8 converts that ratio into annual costs for a 100 TB dataset. Comparing it with HBM acquisition cost additionally requires a hardware lifetime and utilization assumption. This cost advantage makes object storage a common home for the organization’s training data lake, where raw data, preprocessed datasets, and archived model artifacts can reside durably.
Request latency also matters. Design estimates use 50 to 100 ms for an object GET as a representative planning range rather than a universal service guarantee. Much of that delay is the price of the indirection that provides durability. The service looks up the object’s location in a distributed metadata index, determines which fragments to read, fetches them from potentially different storage nodes, and reconstructs data when a fragment is unavailable, all on top of the client network path and queueing. Large transfers amortize per-request overhead across more bytes, while small transfers can spend most of their elapsed time on that overhead. Request size and concurrency therefore enter the delivery budget alongside aggregate bandwidth.
The remedy is the shard packaging of section 4.3.5, applied here to request latency rather than metadata operations. Formats like WebDataset (Aizman et al. 2019) or Mosaic Streaming (Databricks 2026) bundle samples into multi-gigabyte shards that transform high-latency random access into high-bandwidth sequential streaming. Rather than issuing billions of small GET requests, the data loader issues hundreds of large reads in parallel, each fetching an entire shard that contains thousands of samples. With sufficient parallelism and colocated network capacity, object storage can sustain high aggregate throughput, enough to feed large training clusters for some workloads. The streaming pattern works by assigning each data loader worker a subset of shards and having it read them sequentially. Within each shard, samples are stored contiguously, so the worker decodes them in order and shuffles them in a local buffer. This approach achieves pseudo-random access across the dataset while maintaining sequential I/O at the storage level.
Aizman, Alex, Gavin Maltby, and Thomas Breuel. 2019. “High Performance I/O for Large Scale Deep Learning.” 2019 IEEE International Conference on Big Data (Big Data), 5965–67. https://doi.org/10.1109/bigdata47090.2019.9005703.
Databricks. 2026. Mosaic Streaming: Main Concepts. Databricks Mosaic AI Training Documentation.
The architecture of a streaming data loader for object storage differs from a local-storage loader in important ways. A local-storage loader can use memory-mapped I/O to treat the dataset as a virtual memory region, relying on the operating system’s page fault mechanism to load data on demand. This approach is elegant but incompatible with object storage, which does not support the POSIX file system interface that memory mapping requires. Instead, an object-storage loader must explicitly manage HTTP connections, issue ranged GET requests for specific byte ranges within shards, handle retries on transient failures, and manage a local buffer pool for decoded samples. Libraries like WebDataset and Mosaic Streaming encapsulate this complexity, presenting a simple iterator interface to the training loop while managing the HTTP transport and buffering internally.
Applying this streaming architecture to the running example makes the design concrete as an alternative to the staged path the chapter adopts. Instead of copying shards to local NVMe at job start, the cluster would read them from the object store throughout the run. The tokenized training set is stored in an S3-like object store as roughly 2,000 shards of 3 GB each. The streaming architecture assigns each of the 256 compute nodes a unique subset of roughly 8 shards. Within each node, 8 data loader worker processes issue concurrent HTTP Range requests to fetch 256 MB chunks from their assigned shards. Across the cluster, this results in 2,048 concurrent requests, allowing aggregate throughput in the 50–100 GB/s range when the object store and network path are provisioned for it, far exceeding the roughly 167.8 MB/s required by the generic text job in the text-versus-image comparison. The running example’s average input demand is lower still. At these provisioned service rates, the network between the compute virtual private cloud (VPC) and the object-storage endpoint can limit maximum streaming throughput without making input delivery the running job’s bottleneck. Organizations that co-locate compute and storage in the same cloud availability zone can reduce cross-network latency, directly reducing the required prefetch buffer depth and improving overall pipeline efficiency.
That request parallelism is what object storage rewards. Each of the 2,048 GET requests is independent and can be served by a different storage node within the cloud provider’s infrastructure, and the count grows with the fleet. With each request fetching a 256 MB chunk of a shard, the aggregate throughput depends on the cloud provider’s network capacity, internal bandwidth, and request-rate quotas. The practical limit is often the network bandwidth between the compute cluster and the object storage service, not the storage service’s internal media bandwidth.
Many object storage services provide strong read-after-write consistency, which means that a subsequent read of an acknowledged object sees the completed write. Amazon S3 announced strong read-after-write consistency for object writes and overwrites, together with strongly consistent listing, in December 2020 (Amazon Web Services 2020). The relevant contract is the documented behavior of the chosen backend, not a blanket assumption about object storage. Per-object consistency still does not make a checkpoint spanning many objects atomic, so the publication protocol of section 4.6 applies here as it does on a file system.
Amazon Web Services. 2020. Amazon S3 Update – Strong Read-After-Write Consistency. AWS News Blog.
Amazon Web Services. 2026a. Checking Object Integrity in Amazon S3. Amazon S3 User Guide.
The scale of ML datasets makes them vulnerable to silent data corruption: subtle bit flips in the storage medium or during network transfer that can introduce training artifacts nearly impossible to diagnose. Object storage services provide per-object checksums that verify integrity on upload, copy, or download; Amazon S3, for example, documents checksum options including CRC-family and cryptographic hashes (Amazon Web Services 2026a). Parallel file systems often rely on underlying RAID or erasure coding for physical integrity but may not provide end-to-end checksums visible to the application. A well-engineered large-scale ML pipeline computes and stores a checksum for each data shard during preprocessing and verifies it when the shard is first loaded by a training worker. The verification overhead is negligible compared to the cost of training on corrupted data, and checkpoints need the same check, because a flipped bit in restored state can make training diverge silently after recovery.
↪ Detecting and verifying silent data corruption across the fleet, including in restored checkpoints, is developed in Check-and-Verify Defenses Against Silent Data Corruption.
Training datasets can contain sensitive information, including personal data, proprietary text, and licensed images. Storage design must carry the organization’s access and retention policies through every copy. Object services expose identity policies and encryption options; parallel file systems provide POSIX permissions and access-control lists. Audit coverage and enforcement depend on the configured platform, not the tier’s name. Versioned manifests should identify derived shards and retained copies so that access reviews, retention decisions, and deletion workflows can locate the relevant artifacts; a deletion request, for example, must reach every immutable preprocessed shard derived from the deleted record. Storage controls protect stored bytes; evaluating what a trained model retains requires additional model-level analysis.
The transition from Tier 4 to Tier 5 is driven primarily by economics. Data that is accessed rarely should move to archive storage when retrieval latency and governance requirements allow it, because archive capacity is cheaper still.
4.3.8 Tier 5 archive and cold storage
Archive services such as S3 Glacier preserve rarely accessed lineage—superseded checkpoints, raw source corpora, and training logs—over multi-year horizons so that a deployed model can still be reproduced or audited years after its run ends. At a representative $0.004/GB/month, archive storage is 5× cheaper than the $0.02/GB/month object-storage assumption used in section 4.3.7, trading that lower capacity rate for retrieval latency measured in minutes to hours and making this tier unsuitable for operational access. The record at stake is training data provenance: the link from a deployed model to the exact data versions, hyperparameters, and preprocessing that produced it. The organization’s governance policy determines which records to retain and for how long, and the storage design must keep them identifiable and retrievable for that period; archive serves when its retrieval delay meets the requirement, while records needed during frequent investigations may justify a warmer tier.
Automated lifecycle policies govern the transition of data between tiers based on access recency. As one illustration of how such automation is expressed, a time-based rule for ML infrastructure might move checkpoints as follows: the most recent three checkpoints remain on the parallel file system for fast recovery; checkpoints older than 72 hours are transitioned to object storage; checkpoints older than 90 days are transitioned to archive storage; and checkpoints older than two years are deleted unless flagged for regulatory retention. S3 Lifecycle rules provide the same general transition/archive/delete mechanism for object lifetimes (Amazon Web Services 2026b). The running example’s checkpoint retention in section 4.6 adopts a count-based variant of the same idea, where the transition rule keys on checkpoint count rather than age. Without automation, teams either hoard data on expensive tiers (wasting budget) or delete data too aggressively (losing reproducibility). The lifecycle policy encodes the organization’s cost-recovery trade-off in a declarative rule that requires no manual intervention.
Amazon Web Services. 2026b. Managing the Lifecycle of Objects. Amazon S3 User Guide.
For the 175B model training run, the archive tier holds the complete training lineage: the raw 3 TB compressed source corpus, the 6 TB serialized shard set, all preprocessing scripts, the final checkpoint, and a sampled subset of intermediate checkpoints. Capacity must include every retained full checkpoint as well as both corpus representations; table 5 computes that total for the declared retention policy. A round dataset-only allowance would underprovision the archive. The asymmetry between archive cost and compute cost makes retention inexpensive relative to the run it documents; failures to archive usually reflect missing lifecycle ownership, unclear retention policy, or retrieval-process neglect rather than raw capacity cost.
Archive storage services offer multiple retrieval speed tiers, each with different pricing. In an S3 Glacier-style service, standard retrieval may complete within hours at moderate cost, expedited retrieval may complete within minutes at a higher cost, and bulk retrieval may trade still more latency for the lowest retrieval price (Amazon Web Services 2026d). The choice of retrieval tier depends on the urgency of the use case. Forensic analysis of a production incident warrants faster retrieval; annual compliance audits can use slower bulk retrieval. Designing the lifecycle policy requires understanding the storage cost, the expected retrieval frequency, and the urgency for each class of data.
Amazon Web Services. 2026d. Understanding Archive Retrieval Options. Amazon S3 User Guide.
The six tiers now have their roles, capacities, and prices, but a role does not say how fast bytes must climb the hierarchy. That rate is set by the accelerators consuming them, and it is the next quantity to derive.
Self-Check: Question
Order the six tiers from Tier 0 through Tier 5 in the chapter’s placement hierarchy, moving outward from accelerator-resident memory through node-local resources to shared storage and archive: (1) Local NVMe SSD, (2) Object Storage, (3) Host DRAM, (4) GPU HBM, (5) Parallel File System, (6) Archive / Cold Storage.
Host DRAM (Tier 1) executes a four-stage data loader pipeline: Read, Decode, Augment, and Collate. Why place the final collated batch in page-locked (‘pinned’) host memory for direct asynchronous DMA to GPU HBM without an intermediate staging copy?
- Pinned memory automatically compresses tensors using host CPU vector units before PCIe transmission.
- Pinned memory locks physical pages in host RAM so the PCIe DMA controller can copy data directly to GPU memory without an intermediate pinned staging copy.
- Pinned memory replicates the batch across all NUMA nodes to ensure uniform memory access for parallel data loader threads.
- Pinned memory guarantees transactional ACID durability on host storage in case the worker process crashes during transfer.
A vision training cluster migrating to a high-performance parallel file system (PFS) with \(500\text{ GB/s}\) rated aggregate bandwidth reports that throughput during ImageNet training is capped at under \(5\text{ GB/s}\), with storage data disks showing negligible I/O activity. The dataset consists of millions of individual JPEG files. A worker trace shows repeated waits for file opens, and the MDS reports a sustained operation queue with rising lookup latency while its service rate is saturated. What bottleneck do these additional measurements establish, and which fix addresses it?
- The network fabric is dropping packets due to congestion; enable flow control on top-of-rack switches.
- The parallel file system is bottlenecked on drive endurance wear-leveling; replace SSDs with high-DWPD enterprise drives.
- The dataset is stored as millions of individual image files, saturating the Metadata Server (MDS) with per-file POSIX lookups; repackage images into large sequential shards (such as WebDataset tar archives).
- The GPUs are compute-bound and cannot consume data faster; decrease the batch size to increase I/O request frequency.
A training node uses four local NVMe drives configured in RAID-0 as a warm cache for \(25\text{ TB}\) of pre-shuffled training shards. Explain why RAID-0 is an appropriate engineering trade-off for this specific tier, and identify what workload change would make RAID-0 catastrophic.
A multi-modal training job combines \(3\text{ TB}\) of text, \(50\text{ TB}\) of images, and \(200\text{ TB}\) of video. The infrastructure team provisions storage bandwidth based exclusively on the video modality because video represents over \(75\%\) of total dataset capacity. What can be concluded about this sizing decision from the supplied information?
- Adequacy cannot be established from corpus capacity alone; sizing must include the combined sampled-batch byte rate and decoding, augmentation, and buffering demand of all active modalities.
- The video stream will starve the parallel file system because image and text files use incompatible POSIX stripe sizes.
- The model will fail to converge because object storage cannot maintain ACID consistency when serving multiple modalities simultaneously.
- The training job will exhaust GPU HBM because video tensors automatically overwrite text embeddings during collation.
In a parallel file system architecture like Lustre, namespace management (file creation, directory paths, locks) is handled by a dedicated ____, while raw data blocks are striped across multiple Object Storage Servers (OSS).
4.4 The Data Pipeline Equation
Every training job eventually raises the concrete sizing question of how much storage bandwidth the pipeline must deliver before accelerators stall. The required rate depends on the training configuration, and miscalculating in either direction is expensive. Under-provisioning storage bandwidth starves accelerators. Over-provisioning wastes budget on storage capacity that sits partially idle. The data pipeline throughput equation in equation 2 quantifies the bandwidth the pipeline must sustain for a target training rate:
\[\RequiredInputBandwidth = \InputConsumerAcceleratorCount \times \TargetComputeTimeFraction\times \frac{\BatchDataVolume}{\IronLawComputeTime} \tag{2}\]
where \(\InputConsumerAcceleratorCount\) counts accelerators consuming distinct local input batches, \(\TargetComputeTimeFraction\) is the target fraction of wall-clock time spent computing (typically 0.8 to 0.95), \(\BatchDataVolume\) is one local batch in bytes, and \(\IronLawComputeTime\) is its uninterrupted compute time. This utilization is an active-time fraction, not model FLOPs utilization. If iteration time already includes stalls, multiplying by utilization again would count the slowdown twice. Eliminating sustained input stalls requires supplying batches at the full compute rate; the target fraction sizes a lower accepted training rate. Devices that cooperate on one batch do not each require an independent storage read, so their shared input must be counted once at the tier being sized. The text-versus-image comparison of notebook 4.1 already applied this equation with \(\TargetComputeTimeFraction= 1\); the equation makes the target fraction explicit, and the service chain below adds the requirement that every stage, rather than the accelerator-facing endpoint alone, meet the resulting rate.
The demand equation sizes the accelerator-facing endpoint, but bytes must traverse the complete service chain. Let \(\InputStageServiceRate_{\InputPipelineStageIndex}\) denote the measured service rate of stage \(\InputPipelineStageIndex\), including object-store reads, network transfer, decoding and augmentation, host-memory copies, and host-to-device transfer. Express all rates in the same output-equivalent bytes per second, using each stage’s expansion or compression ratio; raw compressed-read bandwidth cannot be compared directly with decoded-tensor bandwidth. With bounded buffers and no sustained backlog, the pipeline can deliver at most
\[\InputPipelineServiceRate= \min_{\InputPipelineStageIndex} \InputStageServiceRate_{\InputPipelineStageIndex}, \qquad \InputPipelineServiceRate\geq \RequiredInputBandwidth. \tag{3}\]
Capacity at one tier cannot compensate for a slower downstream stage. Compression may raise the storage-read rate while lowering the decode rate; additional loader workers may raise decoding throughput while saturating the host-memory or PCIe stage. The end-to-end inequality in equation 3 therefore turns the chapter’s hierarchy into a testable contract. Measure every stage under representative concurrency, then provision or overlap the stage whose service rate is the minimum.
The throughput equation in equation 2 exposes four levers on storage demand, and none of them is free. Reducing the accelerator count (\(\InputConsumerAcceleratorCount\)) lowers aggregate input demand by reducing the number of distinct consumers, but it lowers training throughput with it, whereas lowering target utilization (\(\TargetComputeTimeFraction\)) relaxes the delivery rate only by accepting idle accelerators. Decreasing the per-batch data volume (\(\BatchDataVolume\)) through a more compact representation of the same samples helps only while decoding keeps pace, since shrinking the batch itself changes the training configuration and its statistical efficiency; conversely, increasing compute time (\(\IronLawComputeTime\)) gives storage longer to deliver each batch at the cost of proportionally longer iterations, which is also why a faster accelerator can expose an input bottleneck that a slower one hid. The equation therefore sizes the pipeline for a chosen training configuration; deliberately slowing useful computation does not improve delivery.
The consequences of falling short are captured by the data stall ratio, defined in equation 4 as the fraction of each training step where the accelerator waits for data:
\[\text{Data Stall \%} = \frac{\TrainingStepTime- \IronLawComputeTime}{\TrainingStepTime} \times 100 \tag{4}\]
The data stall ratio covers one worker’s input path with communication excluded, so its \(\TrainingStepTime\) is compute plus exposed input wait. The Fleet Law of The Fleet Law carries no input-wait term, so it implicitly treats the next batch as already resident; whatever input wait the loader fails to hide adds to the distributed step on top of \(\CommunicationTime(\DeviceCount)\) and \(\SynchronizationTime(\DeviceCount)\), as compute (\(\OperationalTaxonomyDimension_1\)) capacity that sits idle while storage catches up. In a real distributed job, the gap \(\TrainingStepTime- \IronLawComputeTime\) also contains exposed communication and synchronization, so the ratio implicates storage only when that gap is measured as time spent waiting on the input queue, separately from collectives and barriers. Without overlap, step time adds compute and I/O time. Pipelining reduces step time to the longer of the two durations and stall time to the positive difference between I/O and compute.
Napkin Math 4.5: The data stall ratio
Problem: A GPU processes a batch in 200 ms, but storage takes 250 ms to deliver the next batch. What fraction of each training step is the accelerator idle, and how much does pipelining I/O with compute reduce that stall?
Without pipelining (sequential I/O then compute):
\[T_{\text{step}} = T_{\text{IO}} + T_{\text{compute}} = 250 + 200 = 450 \text{ ms}\] \[\text{Stall \%} = \frac{250}{450} = 55.6\%\]
With pipelining (I/O overlapped with compute):
\[T_{\text{step}} = \max(200, 250) = 250 \text{ ms}\] \[\text{Stall \%} = \frac{250 - 200}{250} = {20\%}\]
Systems insight: Even with pipelining, the accelerator is idle 20 percent of the time. To eliminate the stall entirely, the next batch must arrive within the 200 ms compute window, either by increasing effective storage bandwidth or by adding parallel I/O streams. Deeper prefetch buffers cannot help here, because the delivery time exceeds the compute window on every step rather than merely in the tail.
The data stall ratio measures time lost waiting for inputs relative to the chosen iteration window. Acceptable stall time depends on the fleet’s cost and throughput objectives; a threshold is a policy choice, not a universal storage-health boundary. Instrument batch-ready times and accelerator execution in the same trace to distinguish input starvation from synchronization, CPU preprocessing, and other idle intervals. General profiling tools can expose these events, but an idle accelerator alone does not identify storage as the cause.
↪ An I/O-wait efficiency target for the fleet Data axis is developed in Fleet diagnostic scorecard.
A storage pipeline that met its budget at launch can drift out of it as datasets grow, jobs contend, and drives age, so it requires continuous monitoring to keep silent bottlenecks from eroding training efficiency. Key metrics to track in real time include per-tier bandwidth utilization (NVMe, network, object storage), prefetch buffer depth (how many batches are queued and ready), the data stall ratio per GPU, the parallel file system’s metadata operation rate, and NVMe drive health indicators (wear level, temperature, error counts). Alert thresholds should trigger before stalls become visible in training loss curves. An undetected 5 percent increase in data stall ratio across the 1,024-GPU reference cluster (half the running cluster) for just one week wastes about $17,203 in idle compute (1,024 GPUs \(\times\) $2/GPU-hour \(\times\) 168 hours \(\times\) 5 percent), making comprehensive storage monitoring a first-order economic concern rather than an operational nicety.
Diagnose a storage stall at three levels. The application timeline identifies when the accelerator waits; per-worker rates and queue depth identify the pipeline stage that falls behind; device and shared-server counters show which resource limits that stage. Correlating those observations distinguishes a byte-bandwidth shortage from metadata contention or insufficient decoding capacity. Because a small development dataset may hide the contention and accumulated state of a production run, a pipeline stress test should use representative data volume and concurrency and run long enough to expose queue depletion, resource leaks, and memory pressure before the loader is coupled to an expensive training job.
Different ML workloads place contrasting bandwidth demands on the same cluster. Image classification with ResNet-50 on ImageNet demands high sustained bandwidth because each batch contains hundreds of large images (116 KB each on average) and iteration times are short (100 to 200 ms), whereas language model pretraining demands much less bandwidth per batch because tokenized text is compact (each token is a 4-byte integer, so a packed sequence of 4,096 tokens occupies only 16 KB) even though total data volume over the run reaches trillions of tokens. Recommendation model training, the Archetype B (DLRM at Scale) workload, combines both access modes: embedding lookups require high-IOPS random access to the embedding table while the dense layers stream sequential training batches. Which storage tier binds therefore follows the workload’s access profile rather than cluster size alone. Archetype C (Federated MobileNet) falls outside this shared-storage analysis, because its raw training data stays on the devices that produce it; there is no central corpus to stage, and its storage constraints become per-device capacity and upload limits.
↪ On-device training data and federated updates are developed in Edge Intelligence.
Devarajan, Hariharan, Huihuo Zheng, Anthony Kougkas, Xian-He Sun, and Venkatram Vishwanath. 2021. “DLIO: A Data-Centric Benchmark for Scientific Deep Learning Applications.” 2021 IEEE/ACM 21st International Symposium on Cluster, Cloud and Internet Computing (CCGrid), 81–91. https://doi.org/10.1109/CCGrid51090.2021.00018.
MLPerf Storage measures these profiles on production storage systems. Each submission emulates a set of accelerators that consume samples with a fixed per-sample compute time, so the storage system, not a real GPU, sets the pace, and reports the read throughput the system sustained while keeping the emulated accelerators at least 90 percent busy (70 percent for CosmoFlow) (MLCommons 2024; Devarajan et al. 2021). Across the 124 passing results of the closed division in the 2024 round, sustained throughput grows in proportion to the number of emulated accelerators, as the \(\InputConsumerAcceleratorCount\) term of equation 2 predicts (figure 3, panel a). Per accelerator, the median demand differs about 15× across workloads, and ResNet-50, although demanding among image-classification jobs, is the lightest of the three because its samples are small 2D images while 3D U-Net reads whole medical volumes. An emulated H100 needs about 2.8 GB/s for 3D U-Net on medical volumes, 0.55 GB/s for CosmoFlow, and 0.18 GB/s for ResNet-50 (figure 3, panel b). Emulating H100s instead of A100s raises every workload’s demand by 1.6–2×, because the faster accelerator shortens \(\IronLawComputeTime\) while the bytes per batch stay the same. A storage tier sized for one accelerator generation is therefore undersized for the next, even when the dataset and the model do not change.
MLCommons. 2024. MLPerf Storage V1.0 Results.
In an ideal overlapped pipeline, the bandwidth-to-demand ratio bounds the compute active-time fraction (figure 4). With input demand defined as batch bytes divided by uninterrupted compute time, the frontier ramps linearly through bandwidth-starved operating points before flattening at the supply-equals-demand saturation knee (ratio = 1). The active fraction is the smaller of one and available bandwidth divided by that demand, assuming no other bottleneck.

Below matching supply, bandwidth increases raise the ideal active fraction proportionally. Above it, more bandwidth does not improve this ideal compute stage, although headroom can help absorb contention and variable delivery. The markers show how far apart the chapter’s workloads sit. Served by the whole 1 TB/s parallel file system, the text job of notebook 4.1 has about 6,000× more bandwidth than it consumes, the image job only 3.3×, and the pipeline of notebook 4.5 sits left of the knee at 80 percent active time. Real systems can fall below the curve because of preprocessing, latency tails, or synchronization. The graph identifies a workload service-rate boundary; it does not establish that every job needs every storage tier.
The pipeline equation also reveals a scaling challenge that worsens with cluster size. As \(\InputConsumerAcceleratorCount\) increases, the required bandwidth \(\RequiredInputBandwidth\) increases linearly, but the storage system’s aggregate bandwidth does not automatically scale to match. Adding more compute nodes to a cluster that shares a parallel file system increases the demand on a fixed storage resource. Eventually, the storage system saturates and every additional GPU beyond the saturation point contributes zero additional training throughput while increasing cost. This saturation point is the practical upper limit on cluster scaling for a given storage configuration, and identifying it quantitatively requires applying equation 2 to the specific storage system’s measured bandwidth.
4.4.1 Pipelining and prefetching
When a data loader waits until the GPU finishes batch \(\BatchIndex\) before reading and decoding batch \(\BatchIndex+1\), the accelerator sits idle across the entire storage read and CPU preparation window on every step, as panel (a) of figure 5 shows. Pipelining removes that synchronous stall by staging and preparing batch \(\BatchIndex+1\) on host resources while the GPU trains on batch \(\BatchIndex\), turning the sum of input and compute time into their maximum (D·A·M coordination from sum to max). When delivery keeps pace and enough prepared work sits in host memory to absorb latency variation, four batches finish in about the time sequential loading needs for two (panel (b)); at fleet scale, the open question is how deep that buffer of prepared work must be.
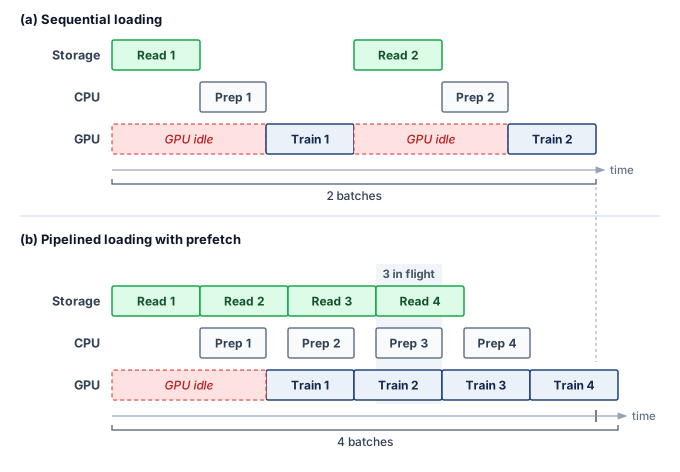
Pipelining converts a sequential bottleneck into overlapped execution (figure 5), but continuous saturation requires a prefetch buffer deep enough to absorb variance in I/O latency. Stage durations need not be deterministic if ready batches cover the delays. Storage systems experience I/O jitter: variation in read latency caused by contention and background work. NVMe drives suffer occasional latency spikes during internal garbage collection (when the controller reorganizes NAND flash blocks) or wear-leveling operations, while parallel file systems incur spikes when multiple training jobs contend for the same OSS nodes, when the MDS processes a burst of metadata operations, or when background scrubbing detects and repairs bit errors, and object storage likewise exposes delays from shared-service contention and maintenance.
A single slow I/O creates a “bubble” when it exhausts the pipeline’s ready work. If the CPU is preparing batch \(\BatchIndex+1\) with no additional batches ready, a delayed read can leave batch \(\BatchIndex+1\) unavailable when the GPU finishes batch \(\BatchIndex\). The GPU then idles until the batch is ready. A longer queue tolerates a longer interruption, and delivery faster than consumption can refill it afterward. Rather than preparing just one batch ahead, the CPU maintains a queue of \(\PrefetchBufferCount\) preloaded batches.
A buffer sized to the measured p99 I/O delay needs enough ready batches to cover that delay without draining:
\[\MinimumPrefetchBufferCount= \left\lceil \frac{\TailStepIoTime}{\IronLawComputeTime} \right\rceil \tag{5}\]
The prefetch depth equation in equation 5 estimates how many ready batches cover the selected latency window. Outstanding reads contribute to replenishing that buffer but do not count as ready batches until they complete. The equation assumes that the long-run data supply rate is at least as high as the accelerator’s consumption rate; prefetching absorbs latency variance, not a sustained bandwidth deficit. When average throughput is sufficient but p99 latency exceeds compute time, deeper prefetching absorbs delays within the provisioned window; rarer or correlated delays can still cause stalls. When sustained delivery is lower than demand, identify the limiting stage before choosing more storage bandwidth, additional decoding capacity, a different representation, or local staging. The equation uses the p99 delay rather than the mean because a buffer sized for the mean drains whenever a slow read arrives, and the tail-latency arithmetic of section 4.3.6 shows that when a step depends on many servers, some read is slow on most steps. Even the p99 window leaves rarer events and correlated interruptions to test.
If object-storage reads take 500 ms at the 99th percentile and compute takes 200 ms, then \(\MinimumPrefetchBufferCount= 3\) batches; provisioning five ready batches adds a margin. A data loader’s configured work-ahead count (for example, a per-worker prefetch factor) is not a count of ready batches, because some of that work may still be loading or preprocessing; the quantity that protects the accelerator is completed-queue occupancy and its refill rate, measured against the delay window on whichever tier serves the reads.

A 500 ms p99 read spans 2.5 steps of 200 ms, so three ready batches must cover it.
To illustrate the memory cost of prefetch buffer depth, return to the image job of notebook 4.1. Each GPU processes its batch in roughly 200 ms, and once its 256 images are decoded into \(224{\times}224{\times}3\)-byte tensors, the collated batch occupies about 40 MB per GPU. Reading from local NVMe, the p99 I/O latency for that batch is approximately 50 ms. Under the p99-window model, the minimum ready-buffer depth is \(\lceil 50/200 \rceil = 1\) batch, and this example provisions a depth of 2. Reading from a parallel file system, the p99 I/O latency rises to roughly 200 ms due to network jitter and contention, requiring a minimum depth of \(\lceil 200/200 \rceil = 1\), with an illustrative provisioned depth of 3. Reading from object storage, the p99 latency can exceed 500 ms, requiring a depth of at least 3, with an illustrative provisioned depth of 5 or more. These numbers translate directly into host DRAM consumption. At 40 MB per batch, a depth-5 prefetch buffer per GPU consumes 200 MB, and 8 GPUs per node consume 1.6 GB. At 40 MB per batch with a depth of 1, the same node needs only 320 MB. Measured delivery delays, batch size, and the chosen protection window determine this memory budget. Queue occupancy and refill rate must still be tested under correlated delays.
The representation decides whether that depth is cheap. Text barely registers, because a per-GPU batch of a few packed 4,096-token sequences occupies tens of kilobytes, so even a deep text queue is negligible. Decoded images are where depth costs memory. The 256-image batch above is roughly 39 MB before rounding, and a buffer of 8 such batches consumes about 308 MB per GPU, modest against a node’s 512 GB of DRAM even after multiplying by the GPUs on the node. Higher-resolution images and video raise the per-batch size by an order of magnitude or more, at which point the prefetch buffer competes with embedding tables and other DRAM consumers.
The interaction between prefetching and the storage hierarchy creates a layered defense against stalls: the prefetch buffer in host DRAM absorbs I/O variance from NVMe reads, the local NVMe warm cache absorbs network variance from shared storage (whether a parallel file system or an object store), and the parallel file system read-ahead cache absorbs variance from disk seeks across the OSS cluster. Because each layer adds latency tolerance at the cost of memory or storage capacity, the system designer must check each active path against the interruption window it is intended to absorb and verify that sustained delivery replenishes the consumed batches. The running example’s shards come from object storage, whose 500 ms p99 against a 200 ms step would call for 3 ready batches if every read went to that tier. Once the shards are staged on local NVMe, every training read is a local hit, and the prefetch buffer needs to absorb only the 50 ms local p99, which a single ready batch covers.
Checkpoint 4.3: Data pipeline design
A training cluster the size of the book’s reference cluster runs 1,024 GPUs with 128-image batches (116 KB per image after compression, 150 ms per iteration).
4.4.2 Multi-worker data loading
A single CPU core cannot keep a high-throughput accelerator fed, even when the storage hardware is fast enough, because of the CPU work required between the storage read and the GPU transfer. For image training, decoding a 116 KB JPEG image into a \(224{\times}224{\times}3\) raw tensor costs several milliseconds of CPU time. One measurement decoded full-resolution ImageNet images at about 530 per second across the four virtual CPUs of a cloud inference instance (Kang et al. 2020), and each augmentation, such as a random crop, flip, or color jitter, adds further work per image. The image job of notebook 4.1 feeds each GPU 256 images every 200 ms step, more than 1,000 images per second. At 1,000 images per second per GPU and 8 GPUs per node, a single core would need to decode and augment 8,000 images per second, tens of times what a single core can sustain. The solution is multi-worker data loading, where \(\DataLoaderWorkerCount\) worker processes each read from storage, decode, augment, and enqueue batches independently. The effective I/O throughput scales approximately linearly with \(\DataLoaderWorkerCount\) until one of three bottlenecks is reached: the storage device’s bandwidth saturates, the PCIe bus between host and device saturates, or the workers exhaust host CPU cycles.
Kang, Daniel, Ankit Mathur, Teja Veeramacheneni, Peter Bailis, and Matei Zaharia. 2020. “Jointly Optimizing Preprocessing and Inference for DNN-Based Visual Analytics.” Proceedings of the VLDB Endowment 14 (2): 87–100. https://doi.org/10.14778/3425879.3425881.
The worker count \(\DataLoaderWorkerCount\) is tuned as on a single node, by profiling the data stall ratio, since too few workers starve the GPU and too many waste CPU on contention. At fleet scale, every core given to loading is a core the training runtime, communication threads, and operating system cannot use, so dividing host CPU between data loading and training orchestration is itself a capacity planning exercise. How those workers exploit concurrency then depends on which tier serves their reads: on local NVMe, workers issue concurrent reads to the same RAID array and rely on NVMe’s deep command queues to expose device parallelism until shared drive or controller capacity saturates; on a parallel file system, they distribute reads across different OSS nodes to aggregate server bandwidth; and on object storage, they issue concurrent HTTP GET requests to distinct shards.
Multi-worker loading must also preserve shuffle quality without giving up I/O efficiency. Under the shard-level and within-shard shuffling of section 4.2, the loader assigns contiguous groups of the shuffled shard list to each worker, and the adequacy of that mixing depends on how the shards were built. A corpus whose shards are internally homogeneous, such as one source or one class per shard, needs finer shards or a larger shuffle buffer, so the layout should be validated against the loss curve of a fully shuffled baseline on a subset before the run commits to it.
The shuffle buffer size creates a memory-randomness trade-off. A larger buffer provides better randomness (because samples are drawn from a larger pool) but consumes more host DRAM. For the running example with text data, a shuffle buffer of 10,000 sequences at 2,048 tokens each, with each token represented as a 4-byte integer, consumes roughly 82 MB. This is negligible relative to the 512 GB of host DRAM. For image data, where each decoded image occupies 151 KB, a shuffle buffer of 10,000 images consumes 1.5 GB, still manageable but a nontrivial fraction of the prefetch budget. The data loader designer must balance shuffle buffer size against prefetch depth, since both compete for the same host DRAM capacity.
The data loading pipeline, from storage read through decode, augmentation, and transfer to accelerator, is the complete fuel delivery system for the training engine, and when any stage becomes the bottleneck the accelerator starves. Local reads can reduce network and shared-storage wait, which makes shard placement across nodes the next decision when that path limits delivery.
4.4.3 Data locality and placement
Even when a node has enough CPU workers to decode batches at full speed, fetching every shard across a shared storage network exposes the training loop to fabric congestion and remote service queues. Placing shards on node-local NVMe avoids that shared-network contention, whereas keeping them in a remote parallel file system or object store preserves a single shared pool that any node can read without copying data ahead of time. Because local NVMe’s advantage depends on both the node’s drive stripe and the per-client bandwidth the remote tier can sustain, placement decisions must compare measured client rates rather than assume a fixed local-to-remote ratio.
The staging decision determines where the job pays for data movement, whether before training starts, during the first epoch, or on every epoch. The simplest strategy is static placement, or prestaging. At the beginning of a training job, the orchestrator assigns a fixed subset of data shards to each node, and the node copies its shards from shared storage (the object store in the running example, a parallel file system in many on-premises clusters) to local NVMe drives before the first iteration. Reads remain local while the assigned shards fit and the sampling policy uses that assignment, which gives the highest steady-state throughput at the cost of the longest startup delay. Staging a 10 TB dataset across 256 nodes at 500 MB/s per node takes roughly 80 seconds under ideal conditions, and contention on shared bandwidth can extend that stall to several minutes. A changed dataset or assignment requires restaging, so the placement policy must preserve the intended sample distribution as well as local throughput.
The alternative is dynamic placement, or on-demand staging, where nodes fetch shards from shared storage when the data loader first accesses them and retain them locally for reuse. This removes the upfront delay and supports datasets larger than aggregate local NVMe capacity and sampling policies that change the active subset over time, but the first epoch pays the full network-read cost. Cache misses consume shared-storage bandwidth and expose remote latency unless prefetching hides it; cache hits retain the benefit of local reads, so the pattern pays off when later epochs reread the cached shards.
Streaming keeps data off local storage entirely, reading records from the parallel file system or object store on every epoch. It has no startup delay and needs no local NVMe capacity, but every epoch absorbs the network-read cost again. On transfer cost alone, streaming suits single-epoch pretraining, which reads each byte once, and datasets that exceed the cluster’s aggregate local capacity. The single-epoch running example stages anyway, for reasons of latency tails rather than transfer fees, as section 4.8 shows.
The cache view of equation 1 puts a number on that trade. Take the multi-modal job of section 4.3.4, whose 35 TB corpus overflows a node’s 30.7 TB of local NVMe. If the job samples uniformly and the cache holds that fraction of the corpus, about 88 percent of reads hit the 28 GB/s local stripe and the remaining 12 percent fall through to the node’s 4 GB/s share of the parallel file system. Taking the time to deliver one byte as the service time, the mean delivered rate is about 16 GB/s, only 58 percent of the all-local rate. A miss rate near one in eight costs about two-fifths of the bandwidth because each missed byte takes 7× as long as a hit, and that mean is the optimistic case; misses that cluster in time drain the prefetch buffer faster than the average suggests.
A more advanced approach is locality-aware scheduling. The scheduler keeps track of which data shards are cached on which nodes’ local NVMe drives. When it starts a new job or replaces a failed node, it prefers a node that already has the required data cached, rather than treating all nodes as interchangeable. This uses the principle of data gravity,11 co-locating compute with data to minimize transfer times. Scheduling avoids a staging copy only when an available node holds the required, validated shard versions. The next requirement is therefore to identify the cached contents precisely enough to reuse them safely.
11 Data gravity: A metaphor treating large datasets as massive objects that attract compute. The gravitational analogy is apt: moving a 100 TB dataset out of one cloud provider to another costs roughly $9,000 in egress fees and takes hours, while launching compute next to the data is near-instantaneous. In ML fleet design, data gravity means the storage location of the training dataset often dictates the physical placement of the entire training cluster.
For the 6 TB serialized dataset distributed across 256 nodes, each node is responsible for approximately 23.4 GB of data. If a node fails, its replacement must restage that shard subset from shared storage. Drawn at the uncontended 4 GB/s per-node share of the chapter’s parallel file system, the copy takes about 5.9 seconds. At an effective 400 MB/s per-node rate, which recovery contention can impose and which is also the order of the per-node share of the 50–100 GB/s object-store streaming path described in section 4.3.7, the same copy stretches to about 58.6 seconds. If the orchestrator can instead schedule the replacement workload on an idle node that already has the data cached from a previous run, staging time is zero and training resumes as soon as the replacement joins. The saving is modest per event but recurs. At a per-GPU mean time between failures of 50,000 hours, the 256-node cluster sees about 1 node failure per day, and each contended restage idles the whole synchronous job for the copy time above. Larger fleets fail proportionally more often, although each node’s share of the corpus shrinks as the node count grows.
The pipeline equation, the prefetch queue, the loader workers, and shard placement together determine which bytes reach host memory and when. On the conventional path, however, every one of those bytes is also copied by the CPU through host DRAM before the accelerator’s DMA can start, and at high request rates that copy competes with decoding for the same cores. No amount of orchestration removes that copy; only a direct data path between storage and accelerator does.
Self-Check: Question
The data pipeline throughput equation is \(\text{BW}_{\text{required}} = N_{\text{GPU}} \times \eta_{\text{target}} \times \frac{D_{\text{vol,batch}}}{T_{\text{iteration}}}\). If a cluster doubles its number of GPUs consuming distinct local batches from 1,024 to 2,048 while keeping per-GPU batch size, uninterrupted compute time per batch, and target active-time fraction constant, how does the required aggregate storage bandwidth scale?
- It remains constant because data-parallel workers divide the fixed total dataset into smaller partitions.
- It quadruples (\(4\times\)) because collective communication overhead scales quadratically with worker count.
- It decreases by \(50\%\) because each node requires fewer samples per epoch.
- It doubles (\(2\times\)) because aggregate byte consumption scales strictly linearly with the number of accelerators independently executing forward-backward iterations.
A training iteration has a GPU compute time of \(T_{\text{compute}} = 200\text{ ms}\) and an average I/O fetch time of \(T_{\text{I/O}} = 250\text{ ms}\) per batch. Explain why enabling double-buffering (pipelining batch \(i+1\) during batch \(i\) compute) reduces but cannot eliminate the data stall, and quantify the remaining stall time per step.
A data loader pipeline has an accelerator compute window of \(T_{\text{compute}} = 200\text{ ms}\) per batch. The storage tier exhibits median I/O latency of \(180\text{ ms}\) but experiences P99 tail-latency spikes of \(500\text{ ms}\) due to network jitter. What is the minimum recommended prefetch buffer depth (\(Q_{\text{prefetch}}\)) suggested by the P99 sizing rule, before allowing for longer or correlated stalls?
- At least 3 batches (\(Q_{\text{prefetch}} = \lceil 500 / 200 \rceil = 3\)) plus a safety margin, covering the stated P99 delay when the queue is full.
- Exactly 1 batch, because median I/O latency (\(180\text{ ms}\)) is strictly less than compute time (\(200\text{ ms}\)).
- Zero batches, because multi-worker asynchronous threading eliminates the need for host-memory queue buffering.
- At least 10 batches, because queue depth must equal the total number of CPU worker threads allocated to the data loader.
True or False: If a cluster monitoring dashboard indicates that average storage read bandwidth matches the aggregate throughput predicted by the pipeline equation, storage performance issues can be conclusively ruled out as the cause of low GPU utilization.
Explain how locality-aware scheduling reduces cluster startup latency and relieves bandwidth pressure on the shared parallel file system when a node fails during a 1,024-GPU training run.
Compare the three primary data staging patterns (prestaging, on-demand staging, and pure streaming) in terms of job startup latency and network bandwidth consumption during multi-epoch training.
4.5 GPUDirect Storage and the CPU Data-Copy Bypass
The storage hierarchy can provide enough aggregate bandwidth and still leave GPUs waiting when the CPU copies data for thousands of small transfers. In the traditional path, every shard read bounces through host DRAM before reaching GPU HBM; GPUDirect Storage (GDS)12 removes that host-memory bounce copy for local or RDMA-attached NVMe, which pays off when the copy itself limits throughput. The CPU still submits and coordinates I/O through the software stack.
12 GDS (GPUDirect Storage): Part of NVIDIA’s GPUDirect family, which also includes GPUDirect RDMA (network adapters writing directly to GPU memory) and GPUDirect Peer-to-Peer (inter-GPU memory access); GDS extends this data-copy-bypass approach to NVMe storage. With RDMA and GDS, payload data can traverse the path remote storage \(\to\) network \(\to\) GPU memory without a CPU-mediated bounce copy, while the CPU still issues and coordinates the operations.
The traditional data path for loading training data follows three hops: storage \(\to\) host DRAM \(\to\) GPU HBM. Data is first read from NVMe into a kernel buffer in host DRAM by a DMA transfer, then copied by the CPU into the data loader’s user-space buffer, and finally transferred over PCIe to GPU memory by the GPU’s DMA engine. Each hop adds latency and consumes CPU resources. The CPU must orchestrate every transfer, manage buffer allocation, and handle interrupts from both the storage device and the GPU. For a single transfer, this overhead is negligible. When eight GPUs each demand thousands of small transfers per second, however, the aggregate CPU load for data movement alone can saturate multiple cores, leaving insufficient CPU capacity for the data augmentation that is also essential to the pipeline.
Definition 4.4: GPUDirect Storage
GPUDirect storage (GDS) is a technology that enables a direct DMA path between NVMe storage devices and GPU memory, bypassing the system-DRAM bounce buffer and CPU payload copies while retaining CPU submission and control.
- Significance: It eliminates the “bounce buffer” through system memory. In the small-transfer model detailed in notebook 4.6, the assumed active CPU service per request falls by 75 percent. That model estimates CPU capacity savings, not an end-to-end latency guarantee. Whether the storage link saturates depends on the remaining bottlenecks.
- Distinction: Unlike traditional I/O, where payload data is staged through host buffers and copied between them, GDS provides direct memory access between the storage controller and the accelerator. CPU-issued I/O calls and kernel storage drivers remain in the control path.
- Common pitfall: A frequent misconception is that GDS makes all storage “faster.” The direct path depends on supported storage and interconnect configurations; it does not eliminate media latency, network latency, or queueing.
The software layers in the traditional I/O path contribute control overhead as well as payload-copy work, and direct I/O and pinned buffers can avoid some copies even without GDS, so the correct baseline is the actual data path rather than a fixed number of copies for every read. The direct path changes the payload route without eliminating the software control path. The application registers a GPU memory region for direct DMA (through the cuFile API in NVIDIA’s implementation), and later reads move payload from NVMe into GPU memory without an intermediate system-memory buffer, while the file system and kernel storage drivers still handle submission and completion.
The benefit from GDS matters when host payload movement is a limiting stage after other pipeline work is accounted for. In figure 6, the conventional path takes two DMA hops through intermediate host-DRAM bounce buffers, while GDS takes a single direct DMA transfer. The direct path eliminates the CPU payload-copy stage, but the dashed control link shows that the host CPU still orchestrates transfer submission and completion.
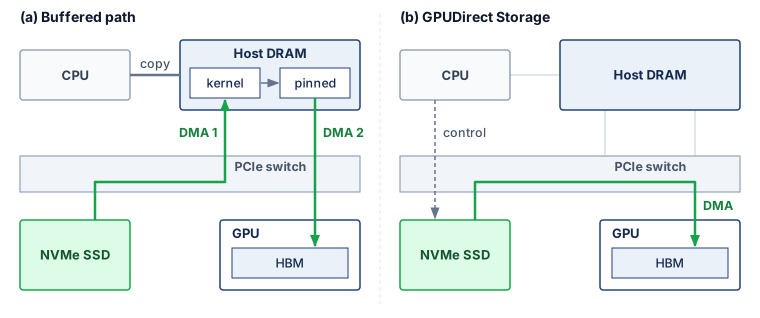
GDS benefits depend on the bottleneck, request sizes, alignment, concurrency, and storage topology. Removing host bounce buffers can improve throughput when those copies limit the path; it does not imply that the smallest transfers benefit most. Small I/O may remain submission- or latency-limited and require concurrency to approach the available bandwidth. Benchmarks of the direct path therefore measure I/O size and per-device behavior as well as throughput. The benefit appears only in an end-to-end comparison of the pipeline with and without the direct path, and the clearest case is the one where host CPU time per request is the limiting stage.
Napkin Math 4.6: The CPU bypass dividend
Problem: A training node with 8 GPUs loads 116 KB images at 8,000 images/s per GPU (64,000 images/s total). That rate is deliberately aggressive, several times the per-GPU image rate of notebook 4.1, to isolate the case in which per-request CPU work is the limiting stage. Assume active CPU service of 120 μs per request on the buffered path and 30 μs on the direct path. These illustrative service times exclude time blocked on I/O; compare the implied CPU load rather than treating elapsed transfer latency as CPU time.
Traditional path: In the assumed buffered implementation, each image requires a DMA from NVMe to DRAM, a host copy from kernel to user space, and a PCIe transfer to GPU. At 64,000 images/s with 120 μs of CPU time per image, the CPU spends 7.68 seconds of CPU time per wall-clock second, consuming roughly 8 cores worth of processing just for data movement.
GDS path: Each image is transferred directly via DMA from NVMe to GPU. At 30 μs of CPU time per image (for initiating the DMA), the CPU spends 1.92 seconds of CPU time per wall-clock second, freeing roughly 6 cores for data augmentation.
Systems insight: Under the assumed CPU-service costs, bypassing payload copies releases processing capacity for preprocessing. The calculation does not predict end-to-end transfer latency, nor prove that preprocessing or storage throughput can sustain this request rate.
GDS has practical limitations: not all NVMe controllers support peer-to-peer PCIe transfers, and the data must already be in a format that the GPU can consume directly (raw pixel values, token IDs, or formats handled by GPU decoders, rather than arbitrary compressed JPEG or gzip streams). In practice, many pipelines use a hybrid approach: CPU-side decoding for compressed formats followed by a normal pinned-memory GPU transfer, while GDS is reserved for direct reads of GPU-consumable data from supported local or remote storage.
The architectural evolution from CPU-mediated copies to direct storage access reflects a broader trend of removing CPU payload copies from the critical data path wherever possible. RDMA allows network payloads to move without CPU copying, while GDS provides the same bypass for storage payloads. Together, RDMA and GDS let data flow from remote storage (such as NVMe over Fabrics, or NVMe-oF), through the network fabric, and into GPU memory without a host-memory bounce copy. The CPU still submits and coordinates the operation, while more of its capacity remains available for data augmentation, pipeline orchestration, and error handling.
↩︎ RDMA and kernel-bypass network paths are established in RDMA and GPUDirect.
The GDS design principle also extends to checkpoint writes: whereas a host-staged path transfers checkpoint bytes from GPU HBM through host DRAM to NVMe, a supported direct path can bypass that host staging for a 2,450 GB checkpoint. Removing the copy reduces \(\CheckpointWriteTime\) only when that movement contributes to the exposed pause; snapshot consistency, serialization, storage service, and durable publication remain separate requirements.
4.5.1 The complete data path
Combining GDS with the multi-tier hierarchy, the complete data path connects the tiers for the running example. At the beginning of the training job, the 6 TB serialized shard set, derived from the 3 TB compressed source corpus, is staged from object storage into the cluster’s local NVMe caches, with each node receiving its assigned shard subset during setup. The data loader workers read tokenized shards from NVMe, assemble packed sequences in pinned host DRAM, and transfer those batches to the accelerator. With GDS enabled, token IDs that are already in a GPU-consumable layout can be loaded directly into GPU memory without CPU payload copying; compressed formats still require CPU or GPU decompression before use.
During steady-state training on the host-staged path, CPU data loader workers read from local NVMe and fill a prefetch queue in host DRAM. The GPU receives batches from this queue via PCIe DMA; the supported GDS alternative bypasses that host payload staging. The compute phase (forward pass, backward pass, optimizer step) consumes the batch and updates model state in HBM. Every 10 minutes, the training framework captures a consistent checkpoint, writes it to local NVMe through the chosen path, and copies it to the parallel file system in the background. The checkpoint protocol must still establish when all required shards are safe to publish for recovery.
At the end of the training job, the final model checkpoint is promoted from the parallel file system to object storage for long-term retention. The local NVMe copies are deleted during job cleanup. If the model is deployed for inference, it is loaded from object storage into the serving cluster’s HBM, completing the lifecycle of data movement through the hierarchy.
The total number of data copies in this lifecycle is instructive. Each training sample traverses: object storage \(\to\) NVMe (staging), NVMe \(\to\) host DRAM (read), host DRAM \(\to\) GPU HBM (transfer). Each checkpoint traverses: GPU HBM \(\to\) NVMe (local save), NVMe \(\to\) parallel file system (async copy), parallel file system \(\to\) object storage (long-term retention). Every copy consumes bandwidth and contributes latency. The engineering goal is to minimize copies on the critical path (the training loop) and tolerate additional copies on noncritical paths (staging and archival). Both lifecycles cross the same tiers in opposite directions, with synchronous critical-path copies drawn solid and asynchronous background transfers drawn dashed in figure 7. For training inputs moving rightward, the active loop waits only on local promotion into HBM (or the optional GDS bypass); for checkpoints flowing leftward, the exposed pause is confined to the local NVMe save while parallel-file-system replication and archival retention proceed off the critical path.
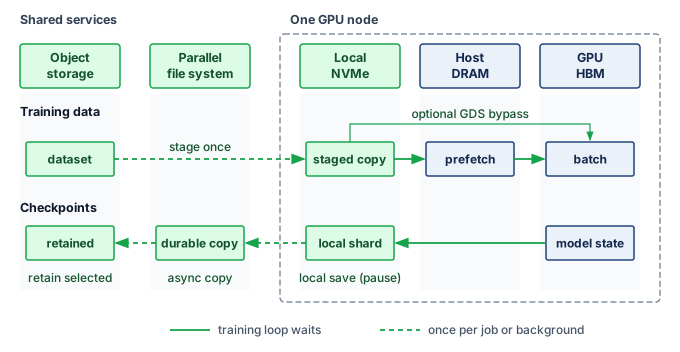
Every copy that leaves the node also needs a network, and the choice of network decides whom a storage burst can disturb. Many training nodes carry a small number of storage-facing network adapters on a separate front-end network, in addition to one compute-fabric adapter per accelerator. Routing staging reads and checkpoint copies over that front-end network isolates them from gradient collectives, but it caps each node’s storage bandwidth at a few front-end ports. Routing storage over the compute fabric offers far more bandwidth, and remote GDS reads use exactly that RDMA path, but then a checkpoint burst shares switch buffers and spine links with the job’s collectives and must be separated by traffic classes. For the running example, each node’s fair share of a 1 TB/s file system shared by 256 nodes is roughly 4 GB/s, and copying its roughly 10 GB checkpoint shard within the 10-minute interval needs far less, so a front-end network can carry it; image workloads that stream hundreds of GB/s across the cluster push designs toward the compute fabric. Through the C\(^3\) lens, storage traffic becomes communication (\(\OperationalTaxonomyDimension_2\)) load the moment it leaves the node, and the network chosen to carry it decides which collectives a storage burst can delay.
Over the 30-day run, checkpointing writes roughly 10.6 PB of state against a single read of the 6 TB serialized dataset, so checkpoints, not training inputs, are the storage workload to design next. That design must take a multi-terabyte save off the training critical path without ever exposing a checkpoint that cannot be restored.
Self-Check: Question
Which statement precisely describes the architectural data-path modification introduced by GPUDirect Storage (GDS)?
- GDS caches the entire training corpus in GPU HBM to eliminate all storage I/O operations during training epochs.
- GDS compresses training tensors directly inside the NVMe flash controller using hardware acceleration.
- GDS routes network packets through host DRAM bounce buffers to perform real-time data integrity checksumming.
- GDS establishes a direct DMA transfer path between NVMe storage (local or NVMe-oF) and GPU memory, eliminating the CPU-mediated bounce buffer in host DRAM while retaining CPU control-plane coordination.
A computer vision training pipeline uses complex CPU-based JPEG decompression and multi-step data augmentations (color jitter, affine warping). Explain why adopting GPUDirect Storage (GDS) without moving decompression to the GPU yields minimal end-to-end throughput improvement.
True or False: Enabling GPUDirect Storage (GDS) eliminates the physical round-trip network latency and P99 tail-latency spikes associated with fetching shards directly from remote cloud object storage endpoints.
In a high-throughput vision training node with 8 GPUs processing a combined 64,000 images per second, traditional CPU-mediated I/O requires \(120\ \mu\text{s}\) of CPU time per image (consuming \(\approx 7.68\) CPU seconds per wall-clock second, or \(\approx 8\) dedicated CPU cores). GDS reduces CPU overhead to \(30\ \mu\text{s}\) per image (\(1.92\) CPU seconds per second, or \(\approx 2\) cores). What is the primary systems benefit of this ‘CPU bypass dividend’?
- It enables the cluster to eliminate all local NVMe SSDs in favor of remote tape archives.
- It frees approximately 6 CPU cores per node that can be reallocated to computationally intensive data augmentation and pipeline orchestration without adding hardware.
- It reduces GPU power consumption by \(75\%\) during tensor matrix multiplication.
- It doubles the physical PCIe bus bandwidth between the CPU socket and the GPU accelerators.
Order the sequence of operations that occurs in the traditional (non-GDS) storage I/O path when an accelerator requests a batch from local NVMe: (1) The data loader process issues a POSIX read() system call traversing the VFS and filesystem drivers, (2) The NVMe controller initiates a DMA transfer of raw blocks into an OS kernel buffer in host DRAM, (3) The host CPU copies payload bytes from kernel space to user-space pinned memory, (4) The CPU programs a PCIe DMA transfer from host DRAM to GPU HBM, (5) The accelerator launches compute kernels on the newly arrived tensor resident in HBM.
4.6 Checkpoint Storage
After the 2,048 accelerators of the running cluster have been training for six hours, a power supply failure turns checkpoint storage into the difference between resuming quickly and repeating hours of work. The decisive storage questions are how quickly the most recent checkpoint was saved, where it resides, and whether it can be read back. Checkpoints are the most demanding write workload in the storage hierarchy. They are also among the most consequential, because a lost checkpoint after a hardware failure means repeating hours or days of training. The storage architecture must therefore minimize \(\CheckpointWriteTime\), the time the training pipeline pauses to save a checkpoint, while stating when that checkpoint becomes durable and visible for restore. The save interval is an input to this storage analysis; selecting it from failure rates and recovery costs is a separate reliability decision derived in The Young-Daly checkpoint interval.
A 175B parameter model with mixed-precision Adam generates a resumable checkpoint of approximately 2,450 GB. The byte contract comprises 350 GB of FP16 model weights, 700 GB of FP32 master weights, and 1,400 GB for the two FP32 Adam moments. Learning-rate-scheduler state, random-number-generator state, and the data-loader cursor add little capacity but remain required for deterministic continuation. Gradients are omitted because the restored job recomputes them. Each participating worker process, called a rank, saves its assigned shard simultaneously, creating a checkpoint storm that the storage system must absorb without disrupting ongoing training reads. How large each rank’s shard is depends on the rule that a coordinated save writes each unique byte once, whatever the parallel layout. In the running layout of table 3, the Adam moments and master weights already exist as distinct per-node slices, while the FP16 weights repeat once per node, so the save writes one copy of the weights and each optimizer slice once. Spreading those unique bytes evenly gives each of the 256 nodes about 1/256 of the checkpoint. The third ZeRO stage (ZeRO-3), which partitions the weights as well, makes that even split the natural one, because every rank already owns a distinct slice. Breaking that rule is a real risk even in the running layout, where a save in which every node writes the FP16 weight copy it holds would multiply the weight bytes by the node count. Its cost is clearest in a deliberately extreme thought experiment, a smaller model whose complete resumable state is written once per GPU of the book’s reference cluster.
Writing one copy per replica takes 1,024 times longer than writing each unique byte once.
Definition 4.5: Checkpoint storm
Checkpoint storm is a burst of synchronized network and storage traffic that occurs when all nodes in an ML training fleet save model state simultaneously.
- Significance: When each replica writes its own full copy, the naive storm takes \(\CheckpointWriteTime = \DataParallelDegree \times \text{per-replica state} / \StorageIngestBandwidth\), where \(\DataParallelDegree\) is the number of replicas writing at once and \(\StorageIngestBandwidth\) is the aggregate rate at which the target storage tier absorbs writes; a coordinated save that writes each unique byte once takes \(\text{unique state} / \StorageIngestBandwidth\). Under the chapter’s checkpoint contract, a 70B-parameter model, smaller than the 175B running example, stores 140 GB of FP16 weights, 280 GB of FP32 master weights, and 560 GB of Adam moments. With vanilla data parallelism across 1,024 replicas (one per GPU of the book’s reference cluster, rather than the chapter’s 256-node fleet), naively writing that complete state from every replica generates 1003.5 TB of simultaneous traffic. No 80 GB device can hold a 0.98 TB replica, so the case is a bound on write volume rather than a deployable layout. At 100 GB/s of aggregate storage ingest bandwidth, the write takes roughly 10,035.2 seconds, or over 167.3 minutes of training stall. A coordinated checkpoint protocol writes one logical copy. Replicated data parallelism can select one writer; ZeRO-3 instead distributes that copy across state-owning ranks. In the sharded example the total is roughly 0.98 TB, bringing \(\CheckpointWriteTime\) down to roughly 9.8 seconds. Gradients do not appear in either total because recovery recomputes them.
- Distinction: Unlike general I/O contention (which is stochastic and unpredictable), a checkpoint storm is synchronous and periodic: every node writes at the same moment because the training orchestrator triggers checkpoint after a fixed step count. Its predictability makes it both more damaging (all nodes compete simultaneously) and more tractable (it can be prevented by design through staggered scheduling or asynchronous serialization).
- Common pitfall: A frequent misconception is that checkpointing every 100 steps is “low overhead” whatever the save protocol. Under the naive protocol at 70B scale, if each training step takes 10 seconds and a checkpoint storm takes 10,035.2 seconds, checkpointing every 100 steps means spending most of the run on checkpoint I/O rather than useful training.
The severity of a checkpoint storm depends on two factors: the per-node shard size, determined by the model size and the sharding strategy, and the throughput of the first write tier, typically local NVMe. A concrete 175B example shows why the local-write phase, rather than the durable copy to the parallel file system, governs the exposed training pause.
Napkin Math 4.7: Tiered checkpoint staging
Problem: Assume sustained bandwidth, no snapshot-copy, serialization, or coordination overhead, and no interference from background copies. The resulting times are bandwidth lower bounds. A 256-node cluster saves a 175B-parameter checkpoint every 10 minutes. Each checkpoint totals 2,450 GB. Writing each unique byte once and spreading the bytes evenly across nodes, each node saves roughly 9.6 GB.
- Per-node write to local NVMe (4 drives at 7 GB/s each = 28 GB/s): 9.6 GB \(\div\) 28 GB/s \(\approx\) 0.34 seconds.
- Async copy to PFS: 256 \(\times\) 9.6 GB \(\approx\) 2.4 TB total. If the PFS provides 1 TB/s aggregate, the storm completes in roughly 2.4 seconds.
- Per-node PFS bandwidth: If all 256 write simultaneously, each gets 1000 GB/s \(\div\) 256 = 3.9 GB/s.
- Training pause: At least 0.34 seconds for the local NVMe write under this model. The PFS copy overlaps with the next training iteration.
- Overhead lower bound: 0.34 seconds pause every 600 seconds \(\approx\) 0.06 percent training time lost to checkpointing.
Systems insight: Under these 1 TB/s aggregate-PFS assumptions, tiered staging reduces checkpoint overhead from about a 2.4 seconds PFS-direct write to a sub-second local write. The training pause can end at the local snapshot boundary before durable publication, but actual pause includes snapshot creation, serialization, and coordination in addition to this byte-transfer lower bound.
A PFS-direct save of a few seconds every 10 minutes costs well under 1 percent of the run, which can make tiered staging look unnecessary for the running example. The checkpoint-dominance argument of section 4.5.1 concerns bytes moved, not this pause, and the notebook’s figure holds only while its assumptions do. The job has the whole 1 TB/s file system to itself; shared among the ten concurrent jobs of section 4.3.6, it receives a tenth of the bandwidth, the same save takes ten times as long, and its burst slows the other jobs’ reads. Realized ingest also falls below the rated aggregate once serialization, metadata operations, and stragglers enter. The save interval shrinks as the fleet grows, because a larger fleet fails more often and the reliability analysis of The Young-Daly checkpoint interval then calls for more frequent saves, and a larger model scales every save with it. Tiered staging removes the shared-tier write from the exposed pause when the background copy keeps pace, although local snapshot creation, serialization, writing, and coordination still determine that pause.
The tiered staging strategy minimizes \(\CheckpointWriteTime\) by writing in two phases. In the first phase, each node writes its checkpoint shard to local NVMe at full bandwidth. With 4 NVMe drives providing 28 GB/s aggregate, a per-node shard of roughly 9.6 GB (an even 256-node split of the 2,450 GB total checkpoint) completes in roughly 0.34 seconds. In this staging model, the training pipeline can resume after every required local shard has completed and the snapshot is no longer being modified. The local-write calculation excludes snapshot-copy, serialization, and coordination overhead, so it is a bandwidth lower bound on the pause.
In the second phase, a background process asynchronously copies the local checkpoint to the parallel file system for durability. The copy can overlap training, but it still competes for memory, network, and storage service and must drain before repeated saves create an unbounded backlog. The two phases therefore land differently in the Fleet Law (equation 1.3). The local write is a pause that every rank takes at the same step boundary, and training resumes only when the slowest writer has finished its shard. That is the shape of a barrier rather than of a transfer between workers, a coordination (\(\OperationalTaxonomyDimension_3\)) cost, so the pause adds to the synchronization term \(\SynchronizationTime(\DeviceCount)\) of each saving step, the term that already carries barrier and straggler waiting. The background copy belongs to no step’s critical path. While it stays hidden and drains before the next save, it adds nothing to the step time; it reappears only as interference, in \(\CommunicationTime(\DeviceCount)\) when it shares links with collectives or in exposed input wait when it slows shared-storage reads. If a node fails before its copy completes, the new generation may lose a required shard. Replication to peer nodes’ NVMe drives can protect against a single-node loss, provided replicas occupy independent failure domains. Waiting for that replication extends the pause beyond the local-only calculation. A design that resumes earlier must retain the previous committed generation until the new one reaches its declared durability boundary.
Durability alone does not make a distributed checkpoint restorable. Each rank writes its checksummed shard under an immutable generation identifier, and only after every shard has persisted does a coordinator publish a manifest naming the complete shard set, using an atomic primitive of the target tier (a create or rename on a file system, a conditional create or versioned pointer on an object store). A crash can then leave garbage to collect but never an incomplete generation that appears valid.
↪ The commit rule behind this ordering, a two-phase commit over the shard set, and the consistency of the cut that a manifest names are developed in Checkpoint coordination patterns.
The exposed pause and the durability boundary therefore fall at different moments, as the four concurrent lanes of figure 8 align them. Training pauses only during the local NVMe shard write (\(\TimeInstant_0\) to \(\TimeInstant_1\)), resuming on live state while the parallel file system absorbs the asynchronous copy (\(\TimeInstant_1\) to \(\TimeInstant_2\)) and the coordinator validates checksums before publishing the manifest last (\(\TimeInstant_3\)).
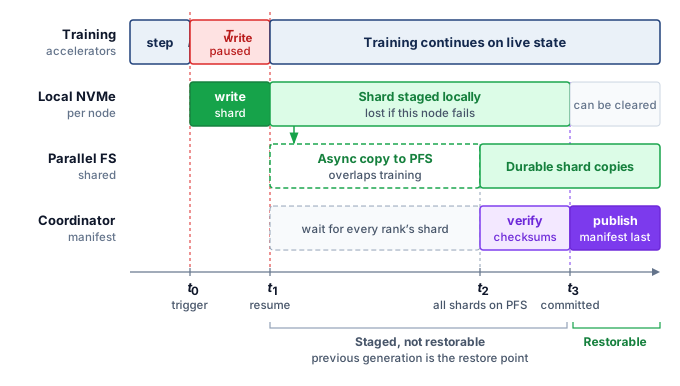
4.6.1 Synchronous and asynchronous checkpoint writes
In a sharded training setup with 256 nodes, no single node necessarily holds the complete training state, so a complete checkpoint requires every node to save its shard of the same completed training step. The commit rules that make such a generation consistent are developed in Checkpoint coordination patterns. On the storage path, the simplest synchronous save has every node write its shard to local NVMe and acknowledge it, so the slowest writer determines when the completion barrier releases training.
Asynchronous checkpointing reduces the training pause by writing in the background. Nodes first coordinate the training step to capture. Each node copies its accelerator-resident shard to a dedicated pinned host-memory buffer, then resumes training and writes the buffer to NVMe in a background thread. The snapshot buffer must remain immutable until the background write finishes; separate live-state buffers allow training to advance without changing the captured generation. If a node fails during the asynchronous write, its local shard may be incomplete. The job must wait for the required writes or peer replication before declaring this generation durable, even if training has already resumed.
The choice between synchronous and asynchronous checkpointing depends on the pause budget and save frequency. A 1-second pause at 200 ms per iteration costs five iterations; whether that overhead is acceptable depends on how much useful training occurs between saves. Asynchronous checkpointing reduces exposed write time when snapshot buffers and background bandwidth are available, but its buffer capacity, contention, and durability delay also enter the decision.
Checkpoint formats implement the write-once rule of the checkpoint storm as rank-sharded saves, as in DeepSpeed’s zero-redundancy checkpointing and PyTorch’s Distributed Checkpoint (PyTorch Contributors 2026). The sharding is what keeps the pause short. Had one node saved the full 2,450 GB itself, its 28 GB/s local stripe would need more than a minute rather than the 0.34 seconds of an even shard.
PyTorch Contributors. 2026. Distributed Checkpoint: Torch.distributed.checkpoint.
4.6.2 Checkpoint retention and restore
Checkpointing a 175B-parameter model every 10 minutes over a 30-day training run generates roughly 4,320 snapshots of 2,450 GB each, totaling approximately 10.6 PB—enough to fill a typical parallel file system several times over if retained in full. The retention policy this run adopts keeps the three most recent checkpoints on the parallel file system for fast recovery, copies every 100th checkpoint and the final checkpoint to object storage for long-term auditability, and deletes the rest. This policy reduces the parallel file system checkpoint footprint from 10.6 PB to roughly 7.35 TB (three live full checkpoints) while preserving 43 periodic historical snapshots in object storage, plus the final checkpoint when it does not coincide with that schedule, for posttraining analysis.
Incremental checkpointing offers a further optimization for reducing \(\CheckpointWriteTime\). Rather than saving the entire training state every time, an incremental checkpoint records changed state relative to a declared base or preceding generation. The delta must include changed optimizer and continuation state as well as parameters. For models where a large fraction of parameters are frozen (such as fine-tuning scenarios where only the last few layers are updated), incremental checkpoints can be orders of magnitude smaller than full checkpoints. Restoring a generation requires its base and every intervening delta, so smaller saves add recovery work and dependencies. Periodic full checkpoints bound that chain, and the retention policy must preserve each dependency until no retained generation requires it. A shorter pause matters only if the checkpoint can be read back; the costlier failure is a checkpoint that was written but never verified as restorable.
War Story 4.1: The backup that had not been restored (2017)
Context: On January 31, 2017, a GitLab.com site reliability engineer working a database replication incident accidentally wiped the primary PostgreSQL data directory (GitLab 2017).
Mechanism: All five layered backup paths failed simultaneously: S3 dumps were silently empty due to a version mismatch, Azure disk snapshots were disabled, replication was broken, LVM snapshots were six hours stale, and WAL archiving was unimplemented.
Impact: Six hours of production database writes, user comments, and repository metadata were permanently lost, requiring an 18-hour emergency restoration from a staging snapshot.
Fix: GitLab instituted automated daily backup restoration testing, unified PostgreSQL versioning across environments, and implemented automated WAL archiving to S3.
Systems lesson: Storage reliability is a restore property, not a backup property. A checkpoint, replica, or dump only counts if the team regularly proves that it can be located, validated, and restored under incident conditions. ML systems face the same vulnerability. A model checkpoint written to object storage or a feature store snapshot is useless if silent version mismatches or missing restore tests prevent resuming a multi-day training run after node preemption.
GitLab. 2017. Postmortem of Database Outage of January 31. GitLab postmortem.
That incident turns checkpoint storage from a capacity question into a restore-design question. Before consolidating the running example’s full storage footprint, the following check tests the write rates and staging trade-offs that govern each save.
Checkpoint 4.4: Checkpoint storage design
A training cluster of 256 nodes saves a 175B-parameter model checkpoint every 10 minutes. Each checkpoint is 2,450 GB total, distributed across all nodes.
With the checkpoint accounting now derived in full, the running example’s storage demands can be consolidated against the same hierarchy. Placing the training dataset, live model state, checkpoints, and archive lineage side by side reveals which direction of traffic dominates the 30-day run.
Systems Perspective 4.2: The 175B model's storage footprint
The running example, a 30-day training run of a 175B-parameter model on 256 nodes, places data on every tier of the hierarchy (table 5).
Table 5: 175B-Parameter Training Storage Footprint: Volume and primary storage tier for each data category in a 30-day, 256-node training run.
| Category | Volume | Primary tier |
|---|---|---|
| Training dataset (compressed source) | 3 TB | Object Storage |
| Training dataset (tokenized, per epoch) | 6 TB | Object Storage \(\to\) NVMe cache \(\to\) Host DRAM |
| Model weights (FP16) | 350 GB | GPU HBM (distributed) |
| Master weights (FP32) | 700 GB | GPU HBM (ZeRO-partitioned) |
| Adam moments (two FP32 states) | 1,400 GB | GPU HBM (ZeRO-partitioned) |
| Single resumable checkpoint | 2,450 GB | NVMe \(\to\) PFS \(\to\) Object Storage |
| All checkpoints (30 days, 10-minute interval) | 10.6 PB | NVMe (transient) \(\to\) PFS (recent) \(\to\) Object (archive) |
| Archive (retained checkpoints + dataset) | ~116.8 TB | Glacier |
The total data moved through the hierarchy is approximately 10.6 PB of checkpoint data plus 6 TB per 1 epoch of training data reads. For a single-epoch language model training run, checkpoint I/O dominates data loading I/O by a factor of over 1,764.
Checkpoints therefore set the run’s write budget, while the far smaller training corpus carries a different obligation. Because training quality depends on the exact samples delivered at every step, each byte of that corpus must remain traceable to the source version and transformation code that produced it.
Self-Check: Question
A 256-node cluster saves a 175B-parameter resumable checkpoint (\(2.45\text{ TB}\) total: \(350\text{ GB}\) FP16 weights, \(700\text{ GB}\) FP32 master weights, and \(1.4\text{ TB}\) of Adam moments) every 10 minutes. Under tiered staging, each node writes its \(9.57\text{ GB}\) ZeRO-3 shard to local NVMe (\(28\text{ GB/s}\) local array) in \(\approx 0.34\text{ s}\), followed by an asynchronous background copy to a \(1\text{ TB/s}\) parallel file system taking \(\approx 2.45\text{ s}\). What is the exposed training pause time (\(T_{\text{write}}\)) per checkpoint?
- Roughly \(2.8\text{ s}\), because training must remain paused until both the local write and the durable PFS copy complete.
- Roughly \(0.34\text{ s}\), because the training barrier releases immediately after the fast local NVMe write completes, while the PFS replication proceeds asynchronously in the background.
- Zero seconds, because modern storage drivers execute zero-copy writes without interrupting GPU tensor execution.
- Roughly \(2.45\text{ s}\), because parallel file system latency determines the minimum barrier synchronization time across nodes.
True or False: In distributed ML infrastructure, storage reliability is defined primarily as a write-completion property: once all nodes successfully execute and acknowledge their checkpoint write calls, the checkpoint can be guaranteed reliable for cluster recovery.
A cluster of 1,024 accelerators trains a 70B-parameter model whose resumable checkpoint contains \(140\text{ GB}\) of FP16 weights, \(280\text{ GB}\) of FP32 master weights, and \(560\text{ GB}\) of Adam moments, or \(980\text{ GB}\) per full replica. Contrast naive full-replica checkpointing with ZeRO-3 sharded checkpointing across a \(100\text{ GB/s}\) shared storage fabric.
A 30-day training run of a 175B model generates 4,320 resumable checkpoints totaling roughly \(10.6\text{ PB}\) of state data. Which retention policy balances rapid failure recovery, long-term auditability, and storage cost without exhausting the parallel file system budget?
- Retain all 4,320 checkpoints on the parallel file system to provide granular step-by-step rollback capabilities throughout the entire 30-day run.
- Delete all intermediate checkpoints immediately after each step and rely exclusively on live memory replication across peer nodes for fault tolerance.
- Retain the 3 most recent checkpoints on the parallel file system for fast local recovery, copy every 100th checkpoint to cloud object storage for long-term lineage, and purge older intermediate snapshots.
- Compress all checkpoints with gzip and write them directly to cold tape archive without maintaining any copies on NVMe or parallel file systems.
Order the sequence of steps executed during a tiered asynchronous checkpointing operation: (1) Background daemons asynchronously transfer the local checkpoint shards from NVMe to the shared parallel file system, (2) The training orchestrator initiates a synchronized step barrier across all worker ranks, (3) Each rank snapshots its model weights and optimizer state shard into a local pinned DRAM buffer, (4) The training barrier releases and accelerators immediately resume forward-backward computation for the next step, (5) Each node flushes its pinned memory snapshot to local NVMe at full drive bandwidth.
4.7 Versioned Data and Commit Boundaries
If a multi-week training run suffers a sudden loss spike or a deployed model regresses, an engineering team that did not record which shard versions, preprocessing code, and shuffle seeds fed each step cannot tell a model bug from a silent change in the input data. While a checkpoint manifest provides one commit boundary per save, the data pipeline that built the training corpus has many—one at every stage that turns raw inputs into processed shards—and the storage system must record both the exact bytes read and the preprocessing code, shuffle seed, schema, and integrity checks that produced them before the run began.
Lighthouse 4.1: Archetype B (DLRM at Scale): Feature store latency
While Archetype A (GPT-4/Llama-3) trains on static, versioned shards, Archetype B (DLRM at Scale) trains on live feature streams that change every second as users click and interact. Replaying an exact batch then becomes a point-in-time problem, which a feature store answers by keeping a retained, versioned feature log.
↪ Point-in-time correctness, the leakage it prevents, and the storage cost of retained feature history are developed in Point-in-time correctness.
13 Hash cost (SHA-256): Verifying the integrity of a 100 TB dataset using SHA-256 consumes approximately 55.6 CPU-core hours at a per-core hashing rate of 500 MB/s. The work parallelizes across shards, but it still competes with decoding for host cores and must read every byte, so the validation step is best pipelined with ingestion rather than run as a separate pass before the fleet starts.
Even when the underlying shard files are immutable, a distributed loader produces a stream of consumed samples whose versions and order can shift across epochs during a 30-day run. Dataset versioning provides a “Git for data” record by snapshotting the cryptographic hashes13 of every data shard, the exact preprocessing code used for tokenization, and the random seeds governing the global shuffle. With that snapshot in place, engineers investigating a mid-run divergence can replay the exact batch that triggered the loss spike and test whether the culprit was a corrupted sample or numerical instability in the optimizer.
At petabyte scale, the data pipeline has to make every transformation reproducible. Raw documents are cleaned, tokenized, packed into training examples, and sharded across storage tiers. Each stage writes an immutable artifact, and each artifact records the input version, code version, schema, and statistical checks it satisfied. Once those dependencies are explicit, the pipeline forms a directed acyclic graph: later artifacts depend on earlier artifacts, and no stage is allowed to rewrite its own history. When a training job starts, the cluster manager verifies that each worker’s local NVMe shards match the data snapshot declared for the run. Treating the data pipeline as a graph of versioned artifacts rather than a simple file transfer makes silent data drift detectable and attributable to a specific stage, code version, or input snapshot. Immutability also pays a storage dividend. Because an artifact never changes once written, a manifest can name it by content identifier, and many experiments can reference the same unchanged shards without copying entire datasets.
4.7.1 Replay and commit boundaries in data pipelines
When a tokenization worker crashes halfway through building a shard of the running example’s corpus, its replacement must decide which raw documents to process again without silently dropping records or writing duplicates. Versioned artifacts identify what a pipeline produced, while commit and replay rules determine whether mid-stage failures can alter that result. The storage system’s part in that decision is the commit boundary, the point at which a stage’s output becomes durable and visible downstream, the same contract that section 4.6 applied to checkpoint generations. That shared contract is why a storage chapter owns these semantics, because whether a replay loses or duplicates data is decided by what the store has committed. The restarted worker compares its input position with the last committed output and replays everything after it, so the work at risk is whatever accumulated past the last commit. Two service-rate effects govern how much accumulates. Records are assigned to workers by a partition key, such as a document’s source or a user identifier, and partition skew arises when one key owns disproportionate work and holds its stage open while the rest of the fleet idles. Backpressure propagates a slow downstream stage’s limit upstream by slowing admission or bounding in-flight data, a control response to overload rather than another name for slow processing.
Failures near that boundary raise a correctness question, and three guarantees answer it differently. At-most-once processing never replays uncertain work, so a document that was read but whose output was never confirmed is lost. At-least-once processing replays everything after the last confirmed commit, so a document whose output was written but not yet confirmed is written twice. An effectively exactly-once outcome combines replayable inputs with idempotent writes, writes that leave the same result however many times they repeat, or with transactional output keyed by a stable event or transaction identifier (Akidau et al. 2015). Reliable message delivery between workers cannot provide this guarantee on its own, because the duplicate arises from the worker’s own replay.
Example 4.2: The acknowledgment gap
Failure trace: A feature-pipeline worker writes the output row for click event
e42, then crashes before it records that the write succeeded. Its replacement cannot tell whether e42 was committed. Skipping the event risks losing it. Replaying it with an append writes the feature row a second time, so that click counts twice in every training set built from the table. Writing the row under the stable key (feature_version, e42) turns the replay into an overwrite of the same row, so the uncertain event can be reprocessed safely.
Systems lesson: Exactly-once belongs at the output commit boundary, whose record must bind the input position, transformation version, stable identifier, and commit state.
The two replays differ only in how the output is addressed. An append gives every attempt its own row, while a write under a stable key sends every attempt to the same row, so reprocessing uncertain work leaves the stored result unchanged (figure 9).
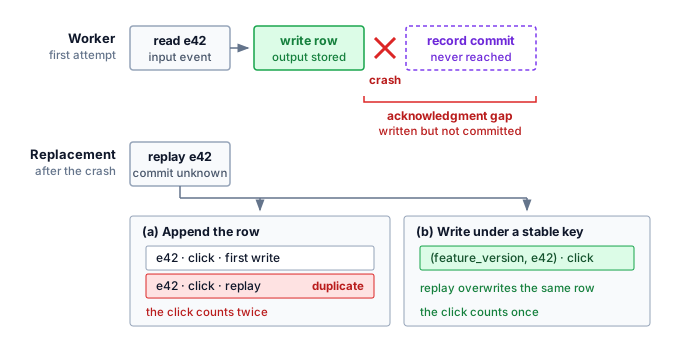
Streaming adds a time boundary to the contract. Event time records when an event occurred; processing time records when a worker handled it. A pipeline that aggregates clicks per hour must decide when an hour is finished, even though events can arrive late. A watermark is its running estimate that every event up to some event time has arrived, which lets it close that window and emit the result; a late-data policy determines whether later arrivals update, retract, quarantine, or drop the result (Akidau et al. 2015). Watermarks therefore trade freshness against completeness rather than prove that no older event remains.
Akidau, Tyler, Robert Bradshaw, Craig Chambers, Slava Chernyak, Rafael J. Fernández-Moctezuma, Reuven Lax, Sam McVeety, et al. 2015. “The Dataflow Model: A Practical Approach to Balancing Correctness, Latency, and Cost in Massive-Scale, Unbounded, Out-of-Order Data Processing.” Proceedings of the VLDB Endowment 8 (12): 1792–803. https://doi.org/10.14778/2824032.2824076.
Each of these mechanisms buys one property at the cost of another. Buffering absorbs finite bursts or temporary slowdowns but increases recovery state and freshness lag; sustained overload still requires backpressure or more service capacity. Aggressive watermarks reduce delay but exclude more late data, while retries help only when writes are safe to repeat. These choices change the stored result, because a feature table closed under an aggressive watermark holds different rows from one closed under a lenient watermark. A reproducible training snapshot must therefore record source and code versions alongside partitioning, replay policy, stable identifiers, watermark state, and late-data decisions. That record is what lets a later feature backfill, a replay of history under new code, rejoin features at the correct points in time without mixing old and new histories.
↪ Feature backfills that replay history under this snapshot contract are developed in Backfill procedures.
4.7.2 The synthetic fuel line
The versioned-artifact contract applies to generated training samples as well as collected ones. When a fleet generates candidate samples, filters them, and verifies the survivors, each stage adds storage traffic and records that must remain linked to the accepted payload. The pressure to generate comes from the compute-optimal allocation of AI Scaling Laws, which grows the token budget with the parameter count. As high-quality human-generated text becomes harder to expand, the fleet encounters the data wall: the point where additional training samples must increasingly come from synthesis, simulation, curation, or expensive human collection (Villalobos et al. 2024). This shift from simple collection to managed data generation sends more than payload bytes through the hierarchy. A “synthetic fuel line” must also store the provenance chain of every sample: which model generated it, which filters accepted or rejected it, which judge or verifier models scored it, and which downstream run consumed it. That lineage makes repeated reuse of generated material traceable. It supports investigation of model collapse, where recursive training on generated data can degrade the learned distribution (Shumailov et al. 2024); retaining provenance alone does not prevent the degradation. The storage design must separately budget retained artifacts and the repeated scans used to assess them.
Villalobos, Pablo, Anson Ho, Jaime Sevilla, Tamay Besiroglu, Lennart Heim, and Marius Hobbhahn. 2024. “Position: Will We Run Out of Data? Limits of LLM Scaling Based on Human-Generated Data.” Proceedings of the 41st International Conference on Machine Learning (ICML), Proceedings of machine learning research, vol. 235: 49523–44.
Shumailov, Ilia, Zakhar Shumaylov, Yiren Zhao, Nicolas Papernot, Ross Anderson, and Yarin Gal. 2024. “AI Models Collapse When Trained on Recursively Generated Data.” Nature 631 (8022): 755–59. https://doi.org/10.1038/s41586-024-07566-y.
Napkin Math 4.8: The storage cost of synthetic data
Problem: A 1 TB synthetic dataset retains provenance metadata and undergoes three independent verification scans. How much persistent capacity and pipeline traffic does it require if judge outputs are not retained as full dataset copies?
- Raw Payload: 1 TB.
- Provenance Overhead: 40 percent extra for lineage hashes, generation logs, and reward-model scores.
- Verification Traffic: 3 judge passes each read the payload, producing 3 TB of read traffic. Their scores reside in the provenance metadata rather than in three retained payload copies.
- Capacity Result: Persistent capacity is 1 TB \(\times\) 1.4 = 1.4 TB, a 1.4× capacity factor.
- Traffic Result: Writing the payload and metadata once and reading the payload three times moves 4.4 TB, a 4.4× traffic factor before generation and judge-model compute are counted.
Systems insight: Verification primarily draws on service rate and compute, while retained provenance consumes capacity. The two costs coincide only when the pipeline materializes each judge output as another full dataset. Synthetic storage must therefore budget bytes at rest separately from bytes moved and record which generator, filters, judges, and downstream runs produced each accepted sample.
Generated data therefore makes lineage part of the payload, so the store must budget retained provenance and verification traffic alongside the samples themselves. Every tier that holds those samples, checkpoints, or provenance records also carries a distinct price tag, turning placement across the hierarchy into an economic optimization problem.
Self-Check: Question
A feature-pipeline worker writes the output row for click event
e42, then crashes before it records that the write succeeded. Its replacement cannot tell whether the row was committed. Which design lets the replacement reprocesse42without losing the event or counting it twice?- Write each output row under a stable key such as
(feature_version, e42), so a replay overwrites the same row instead of appending a second one. - Switch the stage to at-most-once processing, so uncertain events are never replayed.
- Deliver messages between workers over a reliable transport, so every message arrives exactly once.
- Lengthen the watermark delay, so late events have more time to arrive before the window closes.
- Write each output row under a stable key such as
A team generates a \(1\text{ TB}\) synthetic text dataset. Retained provenance adds \(40\%\) metadata overhead, and 3 verifier models each read the payload once without materializing another full copy. What persistent capacity and total pipeline traffic are required?
- \(1.4\text{ TB}\) of persistent capacity and \(4.4\text{ TB}\) of traffic: \(1\text{ TB}\) payload write, \(0.4\text{ TB}\) metadata write, and \(3\text{ TB}\) of verifier reads.
- Exactly \(1.0\text{ TB}\), because verifier models run entirely in GPU registers without generating persistent storage artifacts.
- Roughly \(0.4\text{ TB}\), because synthetic data compresses more efficiently than natural language text.
- Roughly \(14\text{ TB}\), because every verifier model stores a full \(350\text{ GB}\) copy of its internal neural activations for every sample.
Explain why synthetic training data pipelines must treat storage as an active ‘provenance engine’ by recording the generating model, filters, and verifier scores for each accepted sample, rather than storing plain text files.
The degenerative failure mode where a machine learning model progressively degrades in quality and loses distributional diversity by recursively training on unverified synthetic data produced by earlier models is called model ____.
4.8 Storage Economics
Checkpoints, training shards, and the lineage that binds them now each have a place in the hierarchy, and every placement carries a price set by the tier that holds the bytes and by how often they cross a billing boundary. A 100 TB training dataset can reside on any tier of the hierarchy, but the cost differs by orders of magnitude depending on which tier is chosen and how the data is accessed. ML storage economics is not simply about choosing the cheapest tier but about minimizing total cost of data delivery, which includes storage costs, transfer costs, and the opportunity cost of idle accelerators.
The per-gigabyte rates quoted for each tier become concrete when applied to one 100 TB training dataset. The recurring annual storage costs diverge by orders of magnitude: object storage (S3 Standard) costs $24,000 per year, provisioned local NVMe costs $120,000 per year, and archival storage (such as Glacier) drops to $4,800 per year. By contrast, hypothetically provisioning the same capacity as GPU memory at $15/GB would require $1,500,000 in upfront acquisition cost alone, before factoring in amortization, power, or server housing.
The 5× cost difference between local NVMe and object storage motivates placing data on the least expensive tier that meets its delivery and recovery requirements. Device technology contributes to the gradient: HBM uses 3D-stacked silicon with through-silicon vias, and accelerator-adjacent capacity is constrained by packaging and node design. Shared storage pools capacity across clients but introduces network and service dependencies. The cost comparison must include those dependencies rather than infer the cheapest usable path from capacity price alone.

Repeated cross-boundary egress, not storage, dominates cloud cost.
Storage cost, however, is only part of the equation. Data transfer costs can dominate, especially in cloud environments. When compute runs in a different region or cloud from the bucket, as assumed here, reading the 100 TB dataset from object storage to compute instances incurs a transfer charge of $9,000. For multi-epoch training that reads the dataset 10 times, the egress cost alone reaches $90,000, more than the annual storage cost. This inversion, where reading data costs more than storing it, drives the architecture decision to cache data on local NVMe rather than streaming from object storage each epoch.
The economic analysis changes further when accounting for the opportunity cost of accelerator idle time. The book’s reference cluster of 1,024 GPUs, half the chapter’s running cluster, at $2/GPU-hour costs $49,152 per day. If input stalls reduce its compute-active fraction from 90 percent to 70 percent, the lost compute time is valued at $9,830 per day. Over a 30 days training run, this amounts to $294,912. That value sets a budget for evaluating a storage upgrade, but the recoverable benefit depends on how much exposed wait the upgrade removes. Capacity that does not relieve the limiting stage yields no corresponding compute-time saving.
Systems Perspective 4.3: The storage cost iceberg
The visible cost of storage ($/GB/month) is the tip of the iceberg. Below the surface lie costs that often exceed the storage cost itself:
- Egress fees: The ten-epoch egress charge of $90,000 computed above already exceeds a year of storage.
- IOPS charges: Object storage charges per-request fees. S3 Standard GET requests cost about $0.0004 per 1,000 requests, so a dataset of 100M individual files, read once, costs about $40 in GET request fees before data transfer or retrieval charges, even though the storage cost is $2,000/month.
- Idle accelerator cost: The $9,830 per day of lost compute computed above dwarfs any storage saving.
- Retrieval fees: Archive storage charges retrieval fees ($0.02/GB for Glacier) in addition to egress. Restoring a 100 TB dataset from Glacier costs $2,000 in retrieval fees plus $9,000 in egress.
The economically rational strategy often invests more in storage (local NVMe caching, parallel file system capacity) to reduce transfer costs and prevent accelerator stalls.
The cost iceberg reveals that raw storage capacity can account for less than half of the total expenditure; replication, metadata operations, API calls, and cross-region transfers can collectively dominate the bill at scale. Among those hidden line items, egress is the one that often flips the architecture decision. Unlike capacity charges, which scale with the volume of data stored, egress charges scale with the volume of data read, and ML training reads the full dataset on every epoch.
Napkin Math 4.9: The cost of egress
Problem: A team trains a vision model on a 50 TB image dataset stored in S3. Training runs for 20 epochs. The decision is whether to stream from S3 each epoch or stage to local NVMe.
Option A: Stream from S3
- Storage: 50 TB \(\times\) $0.02/GB/month \(\times\) 12 months = $12,000/year
- Egress: 50 TB \(\times\) 20 epochs \(\times\) $0.09/GB = $90,000 per training run
- Total for 4 training runs/year: $12,000 + $360,000 = $372,000/year
Option B: Stage to local NVMe
- Storage (S3 source of truth): $12,000/year
- NVMe capacity (50 TB across cluster): 50 TB \(\times\) $0.10/GB/month \(\times\) 12 = $60,000/year
- Egress (stage once per training run): 50 TB \(\times\) 4 runs \(\times\) $0.09/GB = $18,000/year
- Total: $12,000 + $60,000 + $18,000 = $90,000/year
Systems insight: Local NVMe caching saves $282,000/year at 20 epochs per run, enough to fund 9 additional H100 GPUs at list price. Including the $60,000/year provisioned NVMe cost and the once-per-run staging egress, the break-even point is just over 4 epochs per run; by the fifth epoch, local caching is cheaper than streaming from S3 every epoch.
The notebook turns the iceberg into a decision rule: the cheapest storage tier is not always the cheapest delivery path. Object storage can remain the source of truth, but repeated reads make egress, request overhead, and idle-accelerator cost part of the storage design. Multi-epoch vision training may justify staging on local NVMe by the fifth epoch, while single-epoch language-model pretraining may leave the corpus in object storage and optimize the streaming path instead. The running example stages anyway, although it reads its corpus only once, because egress is not what decides it. Each node’s share of the shards fits easily on local NVMe, the staging copy happens once before the clock starts, and local reads keep object-store latency tails out of every training step. When compute and bucket share a region, transfer fees largely disappear and the same comparison turns on request charges, latency, and idle accelerators instead. The architecture is therefore chosen from access pattern, read count, and latency sensitivity rather than from $/GB/month alone.
The cost analysis extends to the parallel file system tier, which occupies a middle ground between NVMe and object storage in both performance and price. A parallel file system capable of delivering 1 TB/s aggregate bandwidth requires roughly 100 OSS nodes, each with multiple NVMe drives and high-bandwidth network connections. Because the throughput target, not the stored capacity, sets that server count, a bandwidth-sized system costs far more than its stored bytes alone would suggest. This expense is justified only if the alternative, streaming from object storage and paying egress fees, is even more expensive, or if the latency requirements of checkpoint writes cannot be met by object storage alone. The break-even analysis depends on the organization’s workload mix. A team running a single long training job may find that staging data on local NVMe and bypassing the parallel file system entirely is the cheapest option, while a team running many concurrent short jobs benefits from the shared namespace that a parallel file system provides.
The decision to build vs. buy storage infrastructure hinges on the trade-off between the high capital expenditure of an on-premises parallel file system and the recurring operational expenditure of cloud object storage. A 1-petabyte Lustre deployment, sized for capacity rather than for the 1 TB/s target above, costs roughly $3–5 million in hardware, plus an additional $500,000 per year in operational overhead for power, cooling, and engineering support. Storing 1 PB in a cloud object store at $0.02/GB/month costs $240,000 per year for storage alone. Egress fees for accessing the data, however, dominate the total cost. Reading that petabyte at 10 reads/year adds $900,000 in data transfer fees. Under these assumptions, annual cloud delivery costs $1,140,000; after subtracting $500,000 of on-premises operations, the net savings are $640,000 per year. The resulting hardware break-even is roughly 4.7–7.8 years, and a payback within two years would require a hotter workload with many more full-dataset reads per year, lower capital expense, or non-egress drivers such as checkpoint latency and shared-namespace requirements. For the running example, the 6 TB serialized corpus is much smaller than 1 PB, so the local-storage case is driven more by latency, repeated experiments, and checkpoint staging than by one-year egress savings alone. Read-heavy training fleets also rarely wear out their drives under the DWPD budget of section 4.3.4, so a storage refresh cycle is usually driven by density rather than wear, and its timing belongs to the lifecycle cost analysis of Depreciation and lifecycle.
4.8.1 Tiering strategies
The cost structure laid out above turns tiering into a placement policy: keep data only as close to the accelerator as its access frequency and latency requirement justify. A tiering strategy encodes that policy across the hierarchy. Its hot, warm, cold, and archive labels name placement roles for a dataset rather than devices, and they follow the scope brackets of figure 1. The node-local pair is the hot tier, and the three shared services become the warm, cold, and archive tiers. The tier sections called local NVMe a warm cache because it sat in front of shared storage; in this placement vocabulary the same drives belong to the hot tier, because they hold the data the running job consumes.
The fastest and most expensive layer is the hot tier (local NVMe + host DRAM), which holds data being actively consumed by the running training job. Datasets are staged from shared storage to local NVMe at job start. This tier is provisioned per-node and is not shared across the cluster, so data that multiple jobs or teams need simultaneously cannot live here alone.
That shared-access requirement is what justifies the warm tier (parallel file system), which holds datasets accessed by multiple jobs or teams, shared checkpoints for fault recovery, and model artifacts under active development. The parallel file system provides the shared namespace necessary for multi-tenant access with strong consistency.
Below the warm tier sits the cold tier (object storage), which serves as the canonical repository for all organizational training data. Datasets are authored and versioned in object storage, then promoted to warmer tiers when needed for training. Object storage also serves as the durable backup for checkpoints after they are staged from local NVMe through the parallel file system.
Data that must be retained for compliance or reproducibility but is not expected to be accessed during normal operations drops to the archive tier (Glacier or equivalent). Lifecycle policies of the kind shown for the archive tier in section 4.3.8 automate both directions of movement, promoting data from cold to warm when a job requests it, demoting it when no job has read it for a configured period, and transitioning cold data to archive after 90 to 365 days since last access.
In the running example, the 3 TB source corpus and 6 TB serialized shards live permanently in object storage (cold tier), and the staging and cleanup lifecycle of section 4.5.1 moves each node’s shards through local NVMe (hot tier) for the life of the job. The parallel file system holds only the job’s recent checkpoints, which the retention policy of section 4.6.2 governs.
The economic benefit of automated tiering compounds over time. An organization retaining 50 training datasets of 10 TB each would need 500 TB of parallel file system capacity if all data were left in place. If ten datasets are active concurrently and the other forty can be demoted after their jobs finish, automated tiering reduces the dataset capacity required on the parallel file system to 100 TB, saving $144,000 per year at the parallel file system’s per-TB rate. These savings are invisible in any single experiment but substantial when accumulated across the fleet. Tiering and staging thus settle where training data and checkpoints live and what each placement costs; serving reuses the same hierarchy for a different objective, governed by the time to bring a model into HBM and the latency of serving-time state rather than epoch throughput.
Self-Check: Question
A team trains a vision model on a \(50\text{ TB}\) dataset stored in cloud object storage (\(\$0.02/\text{GB-month}\)) for 20 epochs across 4 training runs per year. Reading from object storage across a network boundary incurs a \(\$0.09/\text{GB}\) data egress fee. Staging the dataset onto local NVMe caches costs \(\$0.10/\text{GB-month}\). What does the economic analysis reveal about streaming vs. staging?
- Streaming directly from object storage every epoch is cheaper because local NVMe drives add unnecessary provisioned storage overhead.
- Egress fees are negligible compared to monthly storage costs, making tier selection purely a matter of operational convenience.
- Staging data once to local NVMe per run saves roughly \(\$282,000\) per year compared to streaming from object storage every epoch, breaking even after just 5 epochs per run.
- The team should migrate the dataset to cold tape archive to eliminate both egress fees and provisioned storage costs.
In a 1,000-GPU cluster where compute time is billed at \(\$2.00\) per GPU-hour, an undersized storage system introduces an additional 20 percentage points of input stalls (reducing the active compute fraction from \(90\%\) to \(70\%\)). Calculate the daily cost of this lost compute capacity and explain why investing in high-performance storage is economically rational.
An enterprise evaluates building an on-premises 1 PB parallel file system (\(\$3\text{M to } \$5\text{M}\) capex plus \(\$500\text{k/year}\) opex) versus storing the 1 PB corpus in cloud object storage (\(\$240\text{k/year}\) storage) and paying \(\$0.09/\text{GB}\) egress fees for 10 full-dataset reads per year (\(\$900\text{k/year}\) egress). What is the realistic financial payback horizon for building the on-premises system under these parameters?
- Between 4.7 and 7.8 years, because net annual cloud delivery savings (\(\$640\text{k/year}\)) require multiple years to amortize the multi-million dollar initial hardware expenditure.
- Less than 6 months, because cloud egress fees make any on-premises storage investment instantly profitable.
- Exactly 20 years, because on-premises operational overhead exceeds all cloud storage and egress fees combined.
- There is no payback horizon because cloud object storage is perpetually free for research and training workloads.
In cloud-based ML infrastructure, the recurring fee charged by providers per gigabyte of data transferred out of an object storage bucket across region or internet boundaries is called an ____ fee.
4.9 Storage for Serving
The fifth workload inversion of section 4.2 set serving apart from training. Full-corpus training streams datasets and writes checkpoints in bursts, while in the weight-resident serving baseline, inference reads model weights once at startup and then serves requests from HBM. The primary storage challenge shifts from sustained dataset throughput to model-loading latency, although retrieval indexes and KV-cache offload add serving-time I/O when those mechanisms are enabled.
The most critical metric for inference storage is model loading latency, often called cold-start time: the duration required to load a model from storage into the accelerator’s HBM. For the 175B parameter language model, the weights alone occupy 350 GB in FP16 format; loading that footprint sequentially from a single high-performance NVMe drive at 14 GB/s takes 25 seconds, an unacceptable delay for a user-facing application, while loading from a shared PFS at a per-node rate of 4 GB/s takes 87.5 seconds and reading from object storage at 1 GB/s stretches the delay to 5.8 minutes.
To reduce cold-start time, the model is sharded and loaded in parallel. If the 350 GB model is striped across 8 NVMe drives, each loading a 43.75 GB shard at 7 GB/s, the total load time drops to roughly 6.2 seconds. When using tensor parallelism across 8 GPUs, each GPU loads only its 43.75 GB shard. If the weights already sit in host DRAM, each GPU’s own PCIe link could move its shard in about 0.7 seconds, but the 8 transfers share the node’s 200 GB/s of host-memory bandwidth, so the full load takes about 1.8 seconds. For the most latency-sensitive applications, organizations maintain warm replicas: one or more copies of the model weights kept preloaded in host DRAM, ready for that host-memory-bound transfer. This trades DRAM capacity for a load of about 1.8 seconds instead of the 6.2 seconds striped NVMe read.
↪ How cold-start time limits autoscaling, and how warm pools trade idle capacity for scaling response, is developed in Autoscaling and Capacity Control.
These load times describe one replica. The model rollout previewed in section 4.2 asks all 100 replicas to load a new version at once, 35 TB of weights in one burst. If every replica reads from object storage at the 1 GB/s single-client rate, the fleet asks the store for 100 GB/s. A store whose aggregate service matches that figure, the 100 GB/s of table 2, finishes the rollout in about 5.8 minutes, no slower than one replica’s cold start; any smaller aggregate share stretches the rollout in proportion. Reading from the 1 TB/s parallel file system instead would take about 35 seconds, but only by claiming the whole file system and starving every training job that shares it, the read-side mirror of a checkpoint storm. Serving fleets therefore stage the new version on local NVMe before switching traffic, roll the update across groups of replicas so that the old version keeps serving, or let replicas that have finished loading supply the rest.
During autoregressive generation, the server keeps a per-request record of the attention keys and values produced by earlier tokens so it can generate the next token without recomputing the entire prefix. This record, called the key-value cache (KV cache), grows with sequence length and can consume significant HBM. For long sequences (128K tokens or more), KV cache offloading to host DRAM or NVMe extends the effective context window at the cost of increased latency per generated token, because cache blocks must be moved back into HBM before attention can use them. The storage lesson is that inference maintains an active working set rather than presenting solely a model-loading demand. When serving must also retrieve external context to ground that generation, the storage pipeline faces an entirely different access pattern: low-latency random queries into high-dimensional vector indexes.
↪ KV-cache growth and the HBM capacity wall it creates for serving are developed in The KV cache wall and memory capacity.
4.9.1 Retrieval indexes
An inference request that needs supporting documents cannot wait for a sequential scan of the training corpus. A retrieval system first converts documents into vectors that represent semantic meaning, then finds nearby vectors and returns their source documents as context. The same storage analysis still applies, but the unit of demand becomes a query and its index accesses, and the deadline becomes the serving latency budget. With a graph-based approximate nearest-neighbor (ANN) index, the storage system traverses a high-dimensional vector graph instead of streaming sequential blobs via formats such as TFRecord or Parquet. Other index families shift the storage demand elsewhere. Exact flat search scans every stored vector and is bound by scan bandwidth, inverted-file (IVF) partitioning probes only the few clusters nearest the query, and product quantization (PQ) compresses each vector into short codes so that more of the index fits in memory, at some cost in accuracy.
Systems Perspective 4.4: The IOPS bottleneck in high-dimensional search
For graph-based ANN, this architectural pattern shifts the primary storage bottleneck from sequential read bandwidth to random-access IOPS. The search traverses a high-dimensional graph to find approximate nearest neighbors across billions of embeddings. Its performance is governed by the trade-off among recall, latency, and capacity, where recall is the fraction of the true nearest neighbors that the approximate search returns. Raising recall requires traversing a larger portion of the index, driving up IOPS and latency. The arithmetic of a disk-resident traversal shows why IOPS, not bytes, binds. Each hop that misses DRAM costs one dependent SSD read of roughly 100 μs (table 2), and the next hop cannot start until that read returns, so ten such hops already spend a millisecond of the serving budget in storage alone. Throughput is bounded separately. A drive whose 4 KB random reads run near 0.5 GB/s (section 4.2) completes on the order of \(10^5\) such reads per second, and every concurrent query draws on that same budget, while each read moves only a few kilobytes. A 1,536-dimension embedding in FP32 (4 bytes per value) consumes approximately 6.1 KB, so a billion-document corpus requires roughly 6.1 TB before graph adjacency lists. If those lists add 50 to 100 bytes per node, they add 50 GB to 100 GB, making raw vectors plus minimal graph metadata about 6.2 TB at the high end. Production indexes can be larger once identifiers, graph levels, allocator overhead, deleted-entry slack, and replication are included. In-memory hierarchical navigable small world graph indexes make graph navigation fast when the index fits in DRAM (Malkov and Yashunin 2020). Disk-backed graph indexes such as DiskANN trade DRAM footprint against SSD traversal while targeting high recall and low query latency (Subramanya et al. 2019).
Subramanya, Suhas Jayaram, Fnu Devvrit, Harsha Vardhan Simhadri, Ravishankar Krishnawamy, and Rohan Kadekodi. 2019. “DiskANN: Fast Accurate Billion-Point Nearest Neighbor Search on a Single Node.” Advances in Neural Information Processing Systems (NeurIPS) 32.
Malkov, Yury A., and Dmitry A. Yashunin. 2020. “Efficient and Robust Approximate Nearest Neighbor Search Using Hierarchical Navigable Small World Graphs.” IEEE Transactions on Pattern Analysis and Machine Intelligence 42 (4): 824–36. https://doi.org/10.1109/TPAMI.2018.2889473.
Graph-based retrieval therefore spends storage budget on index levels that keep random traversal inside the serving latency service-level objective. A disk-backed graph is economical only if the extra SSD accesses do not erase the quality gain from searching a larger corpus. Flat, IVF, and PQ designs move that budget toward scan bandwidth, partition probes, or decompression and approximation error. The same hierarchy now supports bulk model loading, request-scoped KV state, and retrieval, each with a distinct service-rate contract. Every design so far also assumes today’s six tiers, and the boundaries between those tiers are themselves moving.
Self-Check: Question
A serving node must load the \(350\text{ GB}\) of FP16 weights of a 175B-parameter model into accelerator memory. Which source gives the shortest cold start under the chapter’s stated rates?
- Eight Gen4 NVMe drives read in parallel, each supplying one \(43.75\text{ GB}\) shard at \(7\text{ GB/s}\), for about 6.2 seconds.
- A single Gen5 NVMe drive at \(14\text{ GB/s}\), for about 25 seconds.
- The node’s \(4\text{ GB/s}\) share of the parallel file system, for about 87.5 seconds.
- A single object-storage client at \(1\text{ GB/s}\), for about 5.8 minutes.
A warm replica keeps the \(350\text{ GB}\) of weights in host DRAM. Each GPU’s own host link could move its \(43.75\text{ GB}\) shard in about 0.7 seconds, yet the full load takes about 1.8 seconds. Explain why.
A serving fleet of 100 replicas of a 175B-parameter model deploys a new version, so all replicas must read \(35\text{ TB}\) of FP16 weights at once. Which statement correctly evaluates the shared sources?
- A \(100\text{ GB/s}\) object store finishes in about 5.8 minutes, while the \(1\text{ TB/s}\) parallel file system would take about 35 seconds but only by claiming the whole file system from co-tenant training jobs.
- The parallel file system is always the right source because 35 seconds is shorter, and serving reads cannot interfere with training jobs.
- The object store finishes in about 35 seconds because each replica reads only its own share of the weights.
- Rollout time is independent of the source tier because each replica’s load is limited by its own PCIe link.
How does the storage performance bottleneck for a graph-based vector retrieval index at billion-vector scale contrast with the primary bottleneck of an ML training data loader?
- Vector retrieval is bottlenecked by sequential streaming bandwidth (GB/s), whereas training data loaders are bottlenecked by random \(4\text{ KB}\) read IOPS.
- Vector retrieval requires continuous multi-terabyte burst writes, whereas training data loaders perform purely read-only operations.
- Vector retrieval is strictly compute-bound on matrix multiplication units and generates zero storage device interaction.
- Vector retrieval traverses high-dimensional graph structures requiring high random-access IOPS and low point-lookup latency, whereas training data loaders require sustained high-bandwidth sequential streaming.
True or False: In graph-based approximate nearest-neighbor search such as HNSW or DiskANN, increasing target recall from \(90\%\) to \(99\%\) generally requires exploring more graph nodes, increasing random storage accesses and query latency.
A billion-entry vector index of 1536-dimensional FP32 embeddings consumes roughly \(6.1\text{ TB}\) of raw vector data plus graph adjacency overhead. Explain why systems migrate from pure in-memory indexes (HNSW) to disk-backed graph indexes (DiskANN), and identify the primary hardware trade-off involved.
4.10 Storage Technologies That Move Tiers
Today’s six-tier hierarchy leaves a hundredfold latency cliff between host DRAM (~100 ns) and local NVMe (~100 μs), forces the host CPU to spend cycles decompressing bytes that GPUDirect Storage could otherwise DMA directly, and pauses training while synchronous checkpoints reach flash. Compute Express Link (CXL), the coherent capacity tier of Compute express link (CXL), targets the DRAM-to-NVMe gap first. Seen from storage, CXL-attached memory is a “Tier 1.5,” slower than host DRAM but byte-addressable, with access latencies of roughly 200 to 500 ns against the roughly 100 μs of an NVMe read. It offers a capacity pool for the structures that the Tier 1 discussion showed competing for host DRAM. For the running example, CXL-attached memory could expand the effective host memory tier from 512 GB to over 4 TB per node. That pool could hold deeper prefetch queues, embedding-table spillover, or a local shard cache as large as the 3 TB compressed source corpus without paying NVMe access latency on every read, though it still falls short of the full 6 TB tokenized training copy on one node.
A different bottleneck appears when CPU-side decoding, not storage bandwidth, throttles the pipeline. The computational storage drive closes that gap by embedding processing elements (field-programmable gate arrays (FPGAs) or simple CPU cores) directly on the SSD controller, enabling decompression, filtering, or format conversion to happen at the storage device rather than consuming host CPU cycles. For ML pipelines where CPU-side decoding is the bottleneck, computational storage could eliminate the CPU from the data path entirely, complementing GDS by offloading work that direct DMA cannot address.
Checkpoint writes impose the pause \(\CheckpointWriteTime\) while a consistent snapshot reaches the first storage tier, and shrinking it makes frequent saves less costly. Persistent memory, despite market shifts such as Intel’s 2022 wind-down of its Optane memory business (Intel Corporation 2022), remains the architectural idea that attacks that term directly. Byte-addressable non-volatile memory could lower the destination-device latency, but the checkpoint pause still includes snapshot creation, byte transfer, and coordination. A lower device-access latency reduces \(\CheckpointWriteTime\) only to the extent that this device lies on the pause’s critical path.
Intel Corporation. 2022. Form 10-q for the Quarterly Period Ended July 2, 2022.
These technologies are not yet broadly deployed at the scale of the largest ML clusters, but they illustrate the direction of the storage hierarchy’s evolution. The fundamental principle remains unchanged, with faster, more expensive storage closer to the accelerator and slower, cheaper storage at the periphery. What changes is the granularity of the tiers and the size of the gaps between them.
4.11 Fallacies and Pitfalls
Storage design errors are among the most expensive mistakes in ML infrastructure because they are discovered late, when training begins, and remediation requires either expensive hardware upgrades or time-consuming data reformatting. The following fallacies and pitfalls capture the most common errors that experienced storage engineers make when first encountering ML workloads.
Fallacy: NVMe is fast enough to feed GPUs directly without pipelining.
A single NVMe drive delivers 7 GB/s, while an H100 consumes 3.35 TB/s from HBM. The gap is roughly 479×. Even four drives in RAID-0 only close this gap to about 120× before overhead. Without pipelining and prefetching to hide the latency of loading from NVMe to host DRAM to HBM, every batch transfer introduces a stall equal to the transfer time. The HBM ratio measures tier disparity rather than the required input rate, because model state is reused many times for each batch loaded from storage. The relevant test compares measured input delivery with batch bytes divided by compute time, then checks whether buffering hides transfer latency and jitter. A device can have enough sustained bandwidth and still expose stalls when transfers are serialized with computation.
Pitfall: Relying on prefetching to hide object storage latency.
Prefetching hides latency only within the time covered by ready batches; it cannot hide an arbitrarily long interruption. With \(\PrefetchBufferCount\) batches ready and constant compute time, a complete interruption of supply exhausts the queue after \(\PrefetchBufferCount \times \IronLawComputeTime\). A slow request need not stall computation if other completed work remains available, but correlated delays can deplete many workers’ queues together. Provision buffer depth from measured delivery tails, test correlated interruptions, and verify that the sustained refill rate meets consumption. Local staging can reduce remote exposure when the required shards fit and remain valid.
Fallacy: Millions of small training files are harmless at scale.
Storing each training sample as an individual file (one JPEG per image, one JSON per text sample) creates repeated per-file work through operations such as open(), stat(), and close(). Metadata becomes the bottleneck when the resulting request rate exceeds the service’s capacity, even if byte bandwidth remains available. Aggregating samples into sequential shards amortizes that work (section 4.3.5). Packaging 10,000 to 100,000 samples per shard can reduce file-level operations by a corresponding 10,000 to 100,000\(\times\) when readers consume whole shards. The loader must still implement the intended sampling policy and avoid repeated enumeration.
Pitfall: Ignoring egress costs when designing the storage architecture.
Cloud egress costs are invisible during development but can dominate at scale. Under a representative $0.09/GB cross-boundary egress fee, a training job that reads a 100 TB dataset from object storage 10 times incurs $90,000 in egress fees, far exceeding the annual storage cost of $24,000 under the object-storage price assumption in section 4.3.7. These fees apply when reads cross a region, provider, or internet boundary; same-region reads may be free or discounted, which is exactly why the cost stays hidden until a cross-region or multi-cloud topology makes it unavoidable. Teams that prototype with small datasets on object storage and then scale up discover that their storage architecture is economically unsustainable. The fix is to budget egress costs explicitly and to design the data pipeline to minimize cross-tier transfers, typically by staging data on local NVMe at job start rather than streaming from object storage each epoch.
Fallacy: Average write bandwidth is enough for checkpoint design.
Checkpoints are written by all nodes simultaneously, creating bursts that can exceed steady-state bandwidth by 10\(\times\) or more. When the PFS write lies on the training critical path, sizing it only for average write load extends \(\CheckpointWriteTime\) during bursts and reduces effective training throughput. A synchronous PFS-direct design must provision enough burst bandwidth to meet its pause budget. With local staging, the first tier absorbs the burst and the PFS drains it in the background; the shared tier must then meet the durability deadline and keep up with repeated saves without an unbounded backlog.
Pitfall: Assuming faster accelerators automatically improve training throughput.
When an organization upgrades from A100 to H100 GPUs, they expect training time to decrease proportionally to the compute improvement. If the storage pipeline was already marginal on A100s, delivering data just fast enough to avoid stalls, the faster H100 compute hits the I/O wall sooner. The accelerator upgrade reduces \(\IronLawComputeTime\) without reducing \(\StepIoTime\), which means the data stall ratio increases. Every accelerator upgrade must be accompanied by a storage pipeline audit to ensure that the faster compute does not expose a previously hidden storage bottleneck.
Fallacy: RAID configurations optimized for databases are suitable for ML training.
RAID selection follows the tier’s failure contract. A disposable local cache can use RAID 0 to aggregate drives without parity, provided a durable source remains available and the fleet can tolerate restaging after a drive failure. Redundant layouts can still reduce disruption when restaging is slow or the cache supports an availability objective. A local checkpoint awaiting durable replication is not yet disposable merely because it lives on the same NVMe drives. Treating all ML storage as replaceable input data confuses capacity placement with recovery policy.
Pitfall: Creating full copies for each dataset snapshot.
Copying an entire dataset for every version duplicates unchanged content. For a 10 TB dataset with 5 percent of its bytes changed, a full copy retains 9.5 TB of redundant data. Content-addressable storage or delta encoding can reuse unchanged objects or blocks. If the storage granularity isolates the changed bytes, the new payload is roughly 500 GB, a 20× reduction before metadata and redundancy overhead. Rewriting large compressed shards can reduce that saving because a small sample change may replace a much larger stored object. Versioning must therefore preserve lineage while choosing a reuse granularity compatible with the dataset format.
Fallacy: Compression always helps because it reduces the amount of data to read.
Compression reduces stored and transferred bytes but adds decoding work. If decoding further saturates an already limiting host processor, it makes that bottleneck worse, not better. If transfer is limiting and decoding has headroom, compression can improve delivery until another stage becomes the limit. Compare candidate representations using output-equivalent stage rates, including CPU or GPU decoding, rather than select the strongest codec from an I/O-bound label alone. The same choice can reduce capacity cost without improving training throughput. These fallacies all return to the same accounting exercise: where each byte lives, how often it moves, and which tier pays the cost.
Self-Check: Question
A team selects RAID 5 for a disposable local training-data cache whose immutable source is durably stored elsewhere. The fleet can tolerate restaging after drive failure. Why might RAID 0 be a better throughput-and-capacity trade-off under this failure contract?
- RAID 5 cannot be formatted with modern Linux filesystems such as ext4 or XFS.
- RAID 5 disables hardware DMA transfers, preventing the GPU from accessing host DRAM.
- The cache can be reconstructed from its durable source, so RAID 0 can aggregate drives without parity overhead when restaging disruption is acceptable.
- RAID 5 increases drive endurance wear by \(10\times\) compared to single-drive configurations.
A training team upgrades its cluster from A100 to H100 GPUs, expecting a \(3\times\) end-to-end training speedup. However, wall-clock epoch time barely improves, and GPU utilization drops from \(85\%\) to \(35\%\). Traces show shorter uninterrupted compute time, unchanged measured input-delivery rate, and increased time waiting for ready input batches, while communication and checkpoint pauses remain unchanged. Diagnose the measured bottleneck and explain why faster compute exposed it.
A team replaces a lighter codec with a denser codec on local-NVMe training shards. On this corpus, illustrative measurements give the lighter codec a 3:1 ratio and 1.5 GB/s decoded output per core, versus 4:1 and 0.5 GB/s for the denser codec. Before the change, worker profiles show decoding and augmentation saturating the host CPU and the ready-batch queue repeatedly draining. Afterward, decompression consumes more CPU time, the queue drains more often, and training step time increases although stored bytes decrease. What caused this measured regression?
- Compressed shards cannot be read by NVMe controllers because flash drives require raw uncompressed binary blocks.
- The pipeline was already CPU-bound on data decoding and augmentation, so adding heavy decompression work saturated the host CPU, starving the GPU of assembled batches.
- The denser codec introduces non-deterministic bit flips that cause stochastic gradient descent to diverge.
- The parallel file system rejects compressed shards larger than 1 GB due to POSIX file locking constraints.
True or False: Sizing a data loader’s prefetch buffer depth based on average storage read latency ensures that training runs will not experience data stalls during multi-week training jobs on shared object storage.
A team creates full \(10\text{ TB}\) copies of a pretraining dataset for every snapshot version, creating 20 versions over six months (\(200\text{ TB}\) total storage). Explain how content-addressable storage or delta encoding optimizes this workflow when successive versions differ by only \(5\%\).
4.12 Summary
Storage in ML systems is an active, multi-tiered pipeline that supplies accelerator inputs, preserves restorable state, and records the lineage of training and serving artifacts. The hierarchy exists because workloads need different combinations of bandwidth, capacity, latency, durability, and cost, and the demand on it grows with the scaling laws that drive the fleet. Larger models call for more training tokens and carry larger checkpoints, so storage pressure rises at every step up the model-size curve. The data pipeline throughput equation, \(\RequiredInputBandwidth = \InputConsumerAcceleratorCount \times \TargetComputeTimeFraction\times \BatchDataVolume / \IronLawComputeTime\), sizes delivery for a chosen training rate when applied to the representation and distinct input consumers at each tier. Measured against the Fleet Law, storage succeeds when it contributes no exposed time. Prefetching preserves the Fleet Law’s assumption that the next batch is already resident. Tiered checkpoint staging shrinks the save pause that surfaces in \(\SynchronizationTime(\DeviceCount)\) to the local write and takes the slow shared-storage copy off the step entirely, so that copy costs step time only when it contends with collectives or input reads. Both spend communication (\(\OperationalTaxonomyDimension_2\)) and coordination (\(\OperationalTaxonomyDimension_3\)) capacity to protect compute (\(\OperationalTaxonomyDimension_1\)).
Treating the hierarchy as a cache makes that sizing workload-specific. The hit rate and the service times of the hot and cold paths determine mean effective throughput, while the tail and correlation of misses determine whether a finite prefetch buffer drains. At the durable tiers, reliability also separates into three contracts: data survival, service response, and the version a reader may observe. These are durability, availability, and consistency, respectively; improving one does not automatically establish the others.
The diagnostic task is to identify which service contract fails before changing the storage tier. Low accelerator utilization can arise from metadata-intensive loading, a depleted prefetch queue, an exposed checkpoint write, or host-memory traffic crossing a contended NUMA link. Measure input wait separately from communication and synchronization before attributing it to storage. Full-corpus scans favor aggregated shards, while graph retrieval and live features require random access and explicit consistency. A depleted input queue can reflect slow storage, metadata contention, or insufficient decoding capacity; GDS helps when host payload copying is the limiting stage while retaining CPU control. Compare remedies by total delivery cost, including transfers and idle accelerators. For checkpoint writes, evaluate the shorter training pause together with the time until a complete generation becomes durable and publishable.
Key Takeaways: Feed the accelerators or waste them
- Workload demand sizes the delivery path: Use \(\RequiredInputBandwidth = \InputConsumerAcceleratorCount \times \TargetComputeTimeFraction\times \BatchDataVolume / \IronLawComputeTime\) for the chosen training rate, then check each tier’s service rate and buffering (principle 8).
- Workload determines the storage contract: Full-corpus scans favor sequential throughput and aggregated shards, and metadata operations can bind before byte bandwidth does (principle 7). Disk-backed graph retrieval must fit its random I/O within a serving deadline, and synthetic-data pipelines must budget verification traffic separately from retained capacity while keeping the versioned lineage of every accepted sample.
- Tail latency sets the cache budget: A high hot-tier hit rate is insufficient when cold misses are orders of magnitude slower. Use equation 1 as a mean baseline, then size prefetch buffers from p99 I/O latency and test correlated miss bursts against the compute window.
- Direct storage removes host payload copies: GDS retains CPU submission and coordination while bypassing host bounce buffers. The illustrative example assumes 75 percent less active CPU time per request; the benefit depends on whether payload copying limits the workload.
- Checkpoint recovery is a storage protocol: Local NVMe staging can shorten pause time, but a restorable checkpoint also needs durable publication, a committed manifest, and verified shards; durability, availability, and consistency remain distinct contracts.
- Pipeline correctness lives at commit boundaries: Replay preserves processing completeness only when stable identifiers and idempotent or transactional writes prevent duplicate effects. Event-time watermarks then make the separate freshness-completeness trade-off explicit.
- Economics drive tiering: The 5× local-NVMe/object-storage price ratio illustrates the incentive to keep data on cheaper tiers under the stated pricing assumptions (principle 8). Compare total delivery cost, including transfer charges and idle accelerators, before deciding where to stage it.
Checkpoint staging shows the C\(^3\) trade-off in one design decision. Writing first to local NVMe shortens the compute pause, but asynchronous replication adds communication traffic and requires coordination to publish only complete generations. Once the shared-file-system write leaves the critical path, the bottleneck can move to local flash endurance, peer-replication bandwidth, or manifest commit latency. Measuring only the shorter training pause would miss the new recovery boundary.
What’s Next: From storage to communication
Compute silicon, network fabrics, and storage hierarchies establish the physical resources of the machine learning fleet. Coordinating those resources into one training computation remains a separate problem. This chapter’s 175B running model already exceeds, in its FP16 weights alone, the 80 GB device of the HBM placement example, so its state and work must span devices, and every division of that work obliges workers to exchange gradients, activations, or parameters across the fabric. Part II moves from physical infrastructure to distributed execution. It begins with the collective operations that carry those exchanges and the cost of each, then partitions neural networks across data, tensor, pipeline, and sequence dimensions, before turning to the hardware failures that a fleet must survive.
↪ The collective operations that carry gradient and activation exchanges, and the cost models that price them, are developed in Collective Communication.
4.13 Self-Check Answers
Self-Check: Answer
An H100 accelerator consumes data from its HBM at roughly \(3.35\text{ TB/s}\), while a single local NVMe drive delivers sequential reads at roughly \(7\text{ GB/s}\). A team is designing the storage infrastructure for a 1,000-accelerator training fleet. Which conclusion follows directly from this bandwidth ratio?
- The gap is easily bridged by standard NVMe RAID arrays because sequential read throughput scales without bound across drives.
- The roughly \(479\times\) device-bandwidth gap motivates tiered staging, but required input bandwidth must be calculated from batch bytes and compute time rather than equated with HBM traffic.
- The bandwidth gap is negligible because large-scale training is entirely compute-bound and rarely exercises HBM bandwidth.
- The bandwidth gap disappears when high-speed InfiniBand fabrics deliver data directly into HBM from remote storage endpoints without local staging.
Answer: The correct answer is B. HBM and NVMe serve different traffic: model state and intermediate tensors can be reused many times for each input batch. The roughly \(479\times\) ratio illustrates tier disparity, not a storage-rate requirement. Batch bytes, compute time, concurrency, and buffering determine whether inputs arrive in time; neither RAID aggregation nor a faster network alone establishes that condition.
Learning Objective: Distinguish storage input demand from internal HBM traffic when interpreting the bandwidth gap
A 175B-parameter model trains for 30 days on 256 nodes, writing resumable mixed-precision Adam checkpoints of roughly \(2.45\text{ TB}\) (\(350\text{ GB}\) FP16 weights, \(700\text{ GB}\) FP32 master weights, and \(1.4\text{ TB}\) of Adam moments) every 10 minutes. Explain why ML storage design is fundamentally a joint physics-and-economics optimization problem.
Answer: HBM supplies high local bandwidth for active tensors but cannot economically retain the corpus and checkpoint history. Shared durable storage pools capacity at lower cost, while interfaces, contention, and client allocation determine the rate and latency a consumer receives. Tier placement must satisfy input-delivery and checkpoint-recovery budgets at the lowest total delivery cost. Remote input reads can suffice when their sustained rate and buffered latency meet demand; local staging is useful when they do not. Compare capacity cost, transfers, and exposed accelerator wait rather than infer a stall from remote placement alone.
Learning Objective: Analyze why ML storage architecture requires tiered placement that simultaneously satisfies bandwidth physics and capacity economics
True or False: A cluster benchmark demonstrating that compute hardware achieves advertised peak TFLOP/s and network fabric achieves advertised bisection bandwidth is sufficient evidence that end-to-end training throughput will scale linearly with accelerator count.
Answer: False. Isolated compute and fabric benchmarks evaluate floating-point throughput and inter-node communication in synthetic conditions without exercising the end-to-end data pipeline. Real training throughput requires continuously streaming input batches, loading model weights, and absorbing periodic checkpoint write storms; if the storage hierarchy cannot deliver input samples within the iteration window (\(T_{\text{iteration}}\)), accelerators sit idle regardless of peak compute capability.
Learning Objective: Evaluate why compute and network benchmarks in isolation fail to guarantee scalable end-to-end training throughput without storage pipeline validation
An accelerator upgrade reduces compute time per batch while the input representation and storage delivery time remain fixed. What is the primary systems consequence for training cluster design?
- Training pipelines automatically increase data compression ratios to prevent accelerator starvation without requiring architectural adjustments.
- Storage hierarchies can eliminate intermediate DRAM and NVMe caching tiers because modern network fabrics directly absorb the difference.
- Checkpoint intervals must be decreased proportionally to the compute growth to keep local NVMe buffers from overflowing.
- The compute window available to deliver each batch shrinks, so input I/O can become the bottleneck unless the measured delivery path keeps pace.
Answer: The correct answer is D. Faster computation leaves less time to fetch the next batch. Overlap and prefetching hide latency within their buffering window, but cannot fix a sustained service-rate deficit. Automatic compression is not guaranteed, removing staging does not improve a slow source, and checkpoint frequency does not set input delivery throughput.
Learning Objective: Explain the systems consequences of compute throughput scaling significantly faster than persistent storage bandwidth
In large-scale distributed training, when hundreds of nodes simultaneously pause computation to write gigabytes of model weights and optimizer states to persistent storage, the resulting synchronized burst of write traffic is called a ____.
Answer: The correct term is checkpoint storm. A checkpoint storm occurs when all data-parallel or model-parallel workers simultaneously flush their memory shards to local or remote storage, creating extreme write contention that must be absorbed via tiered staging (such as writing to local NVMe before asynchronously copying to a parallel file system).
Learning Objective: Explain the technical term for synchronized cluster-wide write bursts generated during distributed training state saves
Self-Check: Answer
A storage procurement team is sizing storage hardware for a cluster dedicated to pretraining foundation models on a \(200\text{ TB}\) immutable text corpus. Which purchasing decision represents the most severe misallocation of budget based on ML workload characteristics?
- Paying a premium for enterprise SSDs optimized for high \(4\text{ KB}\) random-read IOPS while under-provisioning sustained sequential read bandwidth (GB/s).
- Aggregating raw text samples into \(256\text{ MB}\) to \(4\text{ GB}\) contiguous binary shards prior to training to amortize file-system metadata operations.
- Provisioning local NVMe drives on compute nodes to serve as a warm read cache for multi-epoch training passes.
- Sizing the parallel file system write tier to absorb synchronized multi-terabyte checkpoint write bursts from hundreds of nodes.
Answer: The correct answer is A. Paying a premium for enterprise SSDs optimized for high \(4\text{ KB}\) random-read IOPS while under-provisioning sustained sequential read bandwidth (GB/s). ML pretraining streams large contiguous batches sequentially, where a drive delivers \(7\text{-}14\text{ GB/s}\), whereas \(4\text{ KB}\) random reads drop throughput to \(\approx 0.5\text{ GB/s}\); optimizing for random IOPS buys capabilities the workload never utilizes while starving the pipeline of raw gigabytes-per-second throughput. Shard aggregation is the standard mitigation against metadata serialization, local NVMe caching prevents repeated network egress, and sizing for checkpoint bursts directly addresses the bursty write inversion.
Learning Objective: Evaluate storage procurement decisions against the sequential-streaming and bursty-write inversions of ML workloads
True or False: An in-memory LRU cache sized to \(300\text{ GB}\) placed in front of a \(3\text{ TB}\) uniformly shuffled pretraining dataset will achieve roughly a \(90\%\) hit rate after the first epoch warms the cache because all samples are reused across epochs.
Answer: False. A cache holding one-tenth of a uniformly shuffled corpus does not gain a 90 percent hit rate merely because samples recur in later epochs. Most cached samples are evicted before reuse. A fixed cyclic scan larger than the cache can approach zero hits; independently reshuffled epochs allow low but nonzero cross-epoch hits that depend on cache fraction and sample order.
Learning Objective: Analyze why temporal-locality caching strategies such as LRU fail on uniformly streamed ML pretraining datasets
Explain why ML data loaders implement shard-level shuffling combined with within-shard buffer mixing rather than true global per-sample random shuffling across petabyte-scale training corpora.
Answer: Shard-level shuffling and within-shard buffer mixing preserve sequential I/O while introducing sample-order variation. Adequate mixing depends on shard composition and buffer size: homogeneous shards may require finer shards or larger mixing buffers. Validate the layout against the loss curve of a fully shuffled baseline on a subset before committing the run.
Learning Objective: Justify shard-level shuffling under explicit mixing and convergence checks
When an inference platform deploys a new version of a 175B-parameter model (\(350\text{ GB}\) FP16 weights) across 100 serving replicas, how does the storage access profile contrast with a training checkpoint save?
- It generates continuous small random writes to update parameter journals on each replica node.
- It streams an incremental delta of only modified parameters over hours to minimize bandwidth utilization.
- It creates a synchronized fan-out read burst of roughly \(35\text{ TB}\) (\(100 \times 350\text{ GB}\)) that must complete within the deployment latency budget while serving traffic continues.
- It requires sustained multi-gigabyte-per-second sequential write bandwidth to central durable object storage.
Answer: The correct answer is C. It creates a synchronized fan-out read burst of roughly \(35\text{ TB}\) (\(100 \times 350\text{ GB}\)) that must complete within the deployment latency budget while serving traffic continues. A model rollout is the architectural mirror image of a checkpoint storm: instead of many nodes simultaneously writing state to storage (fan-in burst), many replica nodes simultaneously read the same large model weights from storage (fan-out burst). The small-random-writes option describes OLTP database journaling. The delta-streaming option assumes parameter-level differential rollouts that production serving frameworks avoid in favor of immutable weight images. The central-write option confuses read distribution to serving nodes with training checkpoint writes.
Learning Objective: Classify model rollout storage traffic as a synchronized fan-out read burst and quantify its cluster-wide volume
A team plans one storage configuration for the whole life of a language-model project: tokenizing and deduplicating a \(3\text{ TB}\) compressed corpus into \(6\text{ TB}\) of shards, then training on those shards with periodic checkpoints. Why does the chapter conclude that no single configuration optimizes every phase?
- Preprocessing reads and writes large sequential artifacts in MapReduce-like passes, while training reads immutable shards between bursty checkpoint writes, so the read/write balance and access pattern change by phase.
- Training reads are dominated by small random lookups that only a database-style random-IOPS tier can serve, while preprocessing is purely sequential.
- The tokenized corpus is smaller than the compressed source, so preprocessing frees capacity that the training phase cannot use.
- Checkpoint writes are continuous and small, so they require a different write-ahead log configuration than preprocessing.
Answer: The correct answer is A. The fourth inversion is that the read/write ratio shifts by lifecycle phase: preprocessing scans and rewrites large artifacts, while training streams read-only shards between synchronized checkpoint bursts. Each phase loads the tiers differently, which is why ML systems use a multi-tier hierarchy rather than one storage technology. Training reads are not small random lookups, the tokenized corpus is larger than the compressed source, and checkpoints are bursty large writes, not continuous small ones.
Learning Objective: Explain why phase-dependent read/write behavior requires a multi-tier storage hierarchy
Self-Check: Answer
Order the six tiers from Tier 0 through Tier 5 in the chapter’s placement hierarchy, moving outward from accelerator-resident memory through node-local resources to shared storage and archive: (1) Local NVMe SSD, (2) Object Storage, (3) Host DRAM, (4) GPU HBM, (5) Parallel File System, (6) Archive / Cold Storage.
Answer: The correct order is: (4) GPU HBM, (3) Host DRAM, (1) Local NVMe SSD, (5) Parallel File System, (2) Object Storage, (6) Archive / Cold Storage. HBM is accelerator-resident; host DRAM and local NVMe serve the node; the parallel file system provides shared access; object storage retains durable organizational data; and archive preserves rarely accessed history. This is the chapter’s placement order, not a universal bandwidth ranking. HBM rates are per accelerator, DRAM and local NVMe rates are per node, and shared-service rates must be allocated among clients and checked against the actual delivery path.
Learning Objective: Order the six storage tiers by placement and distinguish that order from a bandwidth comparison
Host DRAM (Tier 1) executes a four-stage data loader pipeline: Read, Decode, Augment, and Collate. Why place the final collated batch in page-locked (‘pinned’) host memory for direct asynchronous DMA to GPU HBM without an intermediate staging copy?
- Pinned memory automatically compresses tensors using host CPU vector units before PCIe transmission.
- Pinned memory locks physical pages in host RAM so the PCIe DMA controller can copy data directly to GPU memory without an intermediate pinned staging copy.
- Pinned memory replicates the batch across all NUMA nodes to ensure uniform memory access for parallel data loader threads.
- Pinned memory guarantees transactional ACID durability on host storage in case the worker process crashes during transfer.
Answer: The correct answer is B. Pinned memory locks physical pages in host RAM so the PCIe DMA controller can copy data directly to GPU memory without an intermediate pinned staging copy. Standard virtual memory pages can be paged out or relocated by the operating system, forcing the GPU driver to copy data into an intermediate pinned staging buffer before initiating DMA; allocating pinned memory directly (
pin_memory=Truein PyTorch) eliminates this extra CPU memory copy and allows direct DMA across PCIe. The compression option is incorrect as pinned memory is an OS page-locking mechanism, not a compression algorithm. The NUMA replication claim is false because pinning prevents paging rather than replicating data or choosing NUMA placement. The ACID durability option confuses volatile host DRAM staging with persistent transaction logging.Learning Objective: Explain the architectural function of pinned host memory in accelerating CPU-to-GPU DMA data transfers
A vision training cluster migrating to a high-performance parallel file system (PFS) with \(500\text{ GB/s}\) rated aggregate bandwidth reports that throughput during ImageNet training is capped at under \(5\text{ GB/s}\), with storage data disks showing negligible I/O activity. The dataset consists of millions of individual JPEG files. A worker trace shows repeated waits for file opens, and the MDS reports a sustained operation queue with rising lookup latency while its service rate is saturated. What bottleneck do these additional measurements establish, and which fix addresses it?
- The network fabric is dropping packets due to congestion; enable flow control on top-of-rack switches.
- The parallel file system is bottlenecked on drive endurance wear-leveling; replace SSDs with high-DWPD enterprise drives.
- The dataset is stored as millions of individual image files, saturating the Metadata Server (MDS) with per-file POSIX lookups; repackage images into large sequential shards (such as WebDataset tar archives).
- The GPUs are compute-bound and cannot consume data faster; decrease the batch size to increase I/O request frequency.
Answer: The correct answer is C. The saturated MDS service rate, rising lookup latency, and worker file-open waits establish a metadata bottleneck in this case. Repackaging images into sequential shards amortizes per-file operations across many samples. Idle data disks and low throughput alone would not establish this cause; the supplied metadata measurements distinguish it from a slow decoder or another blocked pipeline stage.
Learning Objective: Analyze parallel file system metadata saturation from telemetry signatures and prescribe shard-aggregation remediation
A training node uses four local NVMe drives configured in RAID-0 as a warm cache for \(25\text{ TB}\) of pre-shuffled training shards. Explain why RAID-0 is an appropriate engineering trade-off for this specific tier, and identify what workload change would make RAID-0 catastrophic.
Answer: RAID-0 aggregates drive bandwidth without parity capacity overhead, making it appropriate for a disposable warm cache when a durable source remains available and the fleet can tolerate restaging after a drive failure. It does not protect availability: losing one drive can invalidate the array. If the array holds the only copy of an unrecoverable artifact or a checkpoint not yet durably replicated, a drive failure can permanently lose that state; the cache placement policy cannot substitute for a recovery contract.
Learning Objective: Justify RAID-0 storage configurations for warm cache tiers and identify failure boundaries where lack of redundancy causes unrecoverable data loss
A multi-modal training job combines \(3\text{ TB}\) of text, \(50\text{ TB}\) of images, and \(200\text{ TB}\) of video. The infrastructure team provisions storage bandwidth based exclusively on the video modality because video represents over \(75\%\) of total dataset capacity. What can be concluded about this sizing decision from the supplied information?
- Adequacy cannot be established from corpus capacity alone; sizing must include the combined sampled-batch byte rate and decoding, augmentation, and buffering demand of all active modalities.
- The video stream will starve the parallel file system because image and text files use incompatible POSIX stripe sizes.
- The model will fail to converge because object storage cannot maintain ACID consistency when serving multiple modalities simultaneously.
- The training job will exhaust GPU HBM because video tensors automatically overwrite text embeddings during collation.
Answer: The correct answer is A. Retained corpus capacity does not determine per-step delivery demand. Sampling frequency, batch representation, and compute time set how many bytes each modality contributes to the feed, while transformations determine its decoding and augmentation work. Sum those demands across active streams and compare them with measured stage rates and buffer capacity. Video-only sizing omits that accounting, but the supplied corpus sizes do not prove a particular storage, host-DRAM, or decoding bottleneck.
Learning Objective: Distinguish retained corpus capacity from combined sampled-batch and transformation demand when sizing multimodal delivery
In a parallel file system architecture like Lustre, namespace management (file creation, directory paths, locks) is handled by a dedicated ____, while raw data blocks are striped across multiple Object Storage Servers (OSS).
Answer: The correct term is Metadata Server (or MDS). The separation of the Metadata Server (MDS) from Object Storage Servers (OSS) allows data bandwidth to scale linearly with the number of OSS nodes, though the MDS can become a bottleneck if datasets contain millions of small individual files.
Learning Objective: Explain the architectural role of the Metadata Server (MDS) in parallel file systems
Self-Check: Answer
The data pipeline throughput equation is \(\text{BW}_{\text{required}} = N_{\text{GPU}} \times \eta_{\text{target}} \times \frac{D_{\text{vol,batch}}}{T_{\text{iteration}}}\). If a cluster doubles its number of GPUs consuming distinct local batches from 1,024 to 2,048 while keeping per-GPU batch size, uninterrupted compute time per batch, and target active-time fraction constant, how does the required aggregate storage bandwidth scale?
- It remains constant because data-parallel workers divide the fixed total dataset into smaller partitions.
- It quadruples (\(4\times\)) because collective communication overhead scales quadratically with worker count.
- It decreases by \(50\%\) because each node requires fewer samples per epoch.
- It doubles (\(2\times\)) because aggregate byte consumption scales strictly linearly with the number of accelerators independently executing forward-backward iterations.
Answer: The correct answer is D. It doubles (\(2\times\)) because aggregate byte consumption scales strictly linearly with the number of accelerators independently executing forward-backward iterations. In the pipeline throughput equation, each data-parallel accelerator requires an independent batch \(D_{\text{vol,batch}}\) every step \(T_{\text{iteration}}\), so doubling \(N_{\text{GPU}}\) exactly doubles the total bytes per second that the storage system must deliver to the fleet. The constant-bandwidth option confuses dataset size with per-iteration ingestion rate. The quadratic scaling option confuses inter-GPU all-reduce communication with storage data loader ingestion. The halving option misinterprets worker count scaling.
Learning Objective: Apply the pipeline throughput equation to predict aggregate storage bandwidth requirements as cluster compute scales
A training iteration has a GPU compute time of \(T_{\text{compute}} = 200\text{ ms}\) and an average I/O fetch time of \(T_{\text{I/O}} = 250\text{ ms}\) per batch. Explain why enabling double-buffering (pipelining batch \(i+1\) during batch \(i\) compute) reduces but cannot eliminate the data stall, and quantify the remaining stall time per step.
Answer: Pipelining overlaps I/O with compute such that step time becomes \(T_{\text{step}} = \max(T_{\text{compute}}, T_{\text{I/O}}) = T_{\text{compute}} + \max(0, T_{\text{I/O}} - T_{\text{compute}})\). Because \(T_{\text{I/O}} (250\text{ ms}) > T_{\text{compute}} (200\text{ ms})\), the pipeline remains fundamentally I/O-bound: when the GPU completes its 200 ms forward-backward pass, the next batch is still 50 ms away from completing its transfer. Pipelining reduces step time from sequential execution (\(200 + 250 = 450\text{ ms}\)) to \(250\text{ ms}\), but an exposed stall of \(50\text{ ms}\) (a \(20\%\) stall ratio, calculated as \((250 - 200) / 250 \times 100\)) persists until storage bandwidth is increased or I/O volume is reduced.
Learning Objective: Calculate the exposed data stall time when I/O fetch duration exceeds accelerator computation time under pipelining
A data loader pipeline has an accelerator compute window of \(T_{\text{compute}} = 200\text{ ms}\) per batch. The storage tier exhibits median I/O latency of \(180\text{ ms}\) but experiences P99 tail-latency spikes of \(500\text{ ms}\) due to network jitter. What is the minimum recommended prefetch buffer depth (\(Q_{\text{prefetch}}\)) suggested by the P99 sizing rule, before allowing for longer or correlated stalls?
- At least 3 batches (\(Q_{\text{prefetch}} = \lceil 500 / 200 \rceil = 3\)) plus a safety margin, covering the stated P99 delay when the queue is full.
- Exactly 1 batch, because median I/O latency (\(180\text{ ms}\)) is strictly less than compute time (\(200\text{ ms}\)).
- Zero batches, because multi-worker asynchronous threading eliminates the need for host-memory queue buffering.
- At least 10 batches, because queue depth must equal the total number of CPU worker threads allocated to the data loader.
Answer: The correct answer is A. Three ready batches cover \(600\text{ ms}\) of computation, exceeding the stated \(500\text{ ms}\) P99 delay. This is a buffer-sizing baseline, not a guarantee: a longer or correlated outage can still drain the queue, and insufficient sustained delivery bandwidth cannot be fixed by buffering. The median and worker count alone do not bound the required coverage.
Learning Objective: Calculate minimum prefetch buffer depth from P99 I/O latency and iteration compute duration
True or False: If a cluster monitoring dashboard indicates that average storage read bandwidth matches the aggregate throughput predicted by the pipeline equation, storage performance issues can be conclusively ruled out as the cause of low GPU utilization.
Answer: False. Average bandwidth metrics mask transient tail-latency spikes, worker-side lock contention, metadata serialization, and prefetch buffer underruns. Even if aggregate gigabytes-per-second over a 10-minute window matches the theoretical target, microsecond-level and millisecond-level I/O jitter can cause individual GPUs to stall repeatedly at step boundaries, driving down utilization. Diagnostics must evaluate per-step wait-for-data distributions (P95/P99 stall times) rather than aggregate bandwidth averages alone.
Learning Objective: Evaluate why average bandwidth metrics fail to rule out storage bottlenecks without fine-grained tail-latency and stall-ratio profiling
Explain how locality-aware scheduling reduces cluster startup latency and relieves bandwidth pressure on the shared parallel file system when a node fails during a 1,024-GPU training run.
Answer: A locality-aware scheduler can place a replacement worker where the required immutable input shards already reside in local NVMe, avoiding their transfer from the shared file system and reducing recovery traffic. This accelerates the data-staging part of recovery; it does not eliminate checkpoint restoration, coordination, or process startup. Locality is useful only when the cached version is correct and the placement also satisfies the job’s resource constraints.
Learning Objective: Analyze how locality-aware scheduling optimizes node recovery times and mitigates shared storage contention at fleet scale
Compare the three primary data staging patterns (prestaging, on-demand staging, and pure streaming) in terms of job startup latency and network bandwidth consumption during multi-epoch training.
Answer: Prestaging copies the required working set before training, trading startup delay and cache capacity for fewer remote input reads during execution. On-demand staging fetches shards on first access and can reuse them in later epochs if the cache retains them. Pure streaming avoids a full-dataset staging phase but repeatedly uses the remote path and remains exposed to its tail latency. Neither on-demand staging nor streaming eliminates first-batch latency, and local staging does not eliminate unrelated network traffic such as checkpoint writes.
Learning Objective: Compare the trade-offs of prestaging, on-demand staging, and pure streaming data delivery patterns
Self-Check: Answer
Which statement precisely describes the architectural data-path modification introduced by GPUDirect Storage (GDS)?
- GDS caches the entire training corpus in GPU HBM to eliminate all storage I/O operations during training epochs.
- GDS compresses training tensors directly inside the NVMe flash controller using hardware acceleration.
- GDS routes network packets through host DRAM bounce buffers to perform real-time data integrity checksumming.
- GDS establishes a direct DMA transfer path between NVMe storage (local or NVMe-oF) and GPU memory, eliminating the CPU-mediated bounce buffer in host DRAM while retaining CPU control-plane coordination.
Answer: The correct answer is D. GDS establishes a direct DMA transfer path between NVMe storage (local or NVMe-oF) and GPU memory, eliminating the CPU-mediated bounce buffer in host DRAM while retaining CPU control-plane coordination. In the traditional path, data is copied from NVMe to a kernel buffer, copied by the CPU to user space, and then transferred to the GPU via PCIe DMA; GDS programs a direct peer-to-peer DMA between the NVMe controller and GPU HBM, skipping host DRAM payload copies while the CPU continues to issue and manage I/O control requests. The HBM caching option is physically impossible given dataset-to-HBM capacity ratios. The flash compression claim mischaracterizes GDS as in-storage compute. The bounce-buffer routing option describes the exact traditional bottleneck GDS was designed to eliminate.
Learning Objective: Explain the architectural data-path modification introduced by GPUDirect Storage compared to traditional CPU-mediated I/O
A computer vision training pipeline uses complex CPU-based JPEG decompression and multi-step data augmentations (color jitter, affine warping). Explain why adopting GPUDirect Storage (GDS) without moving decompression to the GPU yields minimal end-to-end throughput improvement.
Answer: GDS optimizes the payload data transfer path by enabling direct DMA from storage to GPU memory, eliminating host DRAM bounce copies. However, if the data is stored in compressed formats (like JPEG) that must be decoded and transformed by host CPU cores, the raw bytes must still pass through CPU registers and host memory for decompression before tensor assembly; bypassing host DRAM with GDS is only beneficial if the data is already in GPU-consumable format (uncompressed/tokenized tensors) or if decoding and augmentation are offloaded to GPU hardware decoders (such as NVIDIA DALI).
Learning Objective: Analyze the technical preconditions and workload characteristics required for GPUDirect Storage to deliver throughput gains
True or False: Enabling GPUDirect Storage (GDS) eliminates the physical round-trip network latency and P99 tail-latency spikes associated with fetching shards directly from remote cloud object storage endpoints.
Answer: False. GDS optimizes the local or RDMA-attached PCIe/NVMe-over-Fabrics data transfer path by eliminating CPU-mediated bounce-buffer copies. It has no effect on the underlying physical network latency, cross-datacenter transit times, or multi-tenant congestion inherent in remote cloud object storage services like Amazon S3 or Google Cloud Storage, which still require tiered prefetch buffering or local caching.
Learning Objective: Evaluate the architectural boundaries of GPUDirect Storage and distinguish local DMA acceleration from remote network latency
In a high-throughput vision training node with 8 GPUs processing a combined 64,000 images per second, traditional CPU-mediated I/O requires \(120\ \mu\text{s}\) of CPU time per image (consuming \(\approx 7.68\) CPU seconds per wall-clock second, or \(\approx 8\) dedicated CPU cores). GDS reduces CPU overhead to \(30\ \mu\text{s}\) per image (\(1.92\) CPU seconds per second, or \(\approx 2\) cores). What is the primary systems benefit of this ‘CPU bypass dividend’?
- It enables the cluster to eliminate all local NVMe SSDs in favor of remote tape archives.
- It frees approximately 6 CPU cores per node that can be reallocated to computationally intensive data augmentation and pipeline orchestration without adding hardware.
- It reduces GPU power consumption by \(75\%\) during tensor matrix multiplication.
- It doubles the physical PCIe bus bandwidth between the CPU socket and the GPU accelerators.
Answer: The correct answer is B. It frees approximately 6 CPU cores per node that can be reallocated to computationally intensive data augmentation and pipeline orchestration without adding hardware. By offloading raw memory-copy and interrupt-handling work to hardware DMA engines, GDS reduces per-transfer CPU overhead by \(75\%\) (from \(120\ \mu\text{s}\) to \(30\ \mu\text{s}\)), freeing CPU cores to perform complex data augmentations that improve model convergence without throttling the input pipeline. The tape archive option is absurd for active training feeds. The GPU power reduction claim is false because GDS changes storage transfer overhead, not GPU arithmetic energy. The PCIe bus bandwidth claim confuses hardware physical link capacity with software transfer efficiency.
Learning Objective: Calculate the CPU core savings delivered by GPUDirect Storage and evaluate its impact on host preprocessing capacity
Order the sequence of operations that occurs in the traditional (non-GDS) storage I/O path when an accelerator requests a batch from local NVMe: (1) The data loader process issues a POSIX read() system call traversing the VFS and filesystem drivers, (2) The NVMe controller initiates a DMA transfer of raw blocks into an OS kernel buffer in host DRAM, (3) The host CPU copies payload bytes from kernel space to user-space pinned memory, (4) The CPU programs a PCIe DMA transfer from host DRAM to GPU HBM, (5) The accelerator launches compute kernels on the newly arrived tensor resident in HBM.
Answer: The correct order is: (1) The data loader process issues a POSIX read() system call traversing the VFS and filesystem drivers, (2) The NVMe controller initiates a DMA transfer of raw blocks into an OS kernel buffer in host DRAM, (3) The host CPU copies payload bytes from kernel space to user-space pinned memory, (4) The CPU programs a PCIe DMA transfer from host DRAM to GPU HBM, (5) The accelerator launches compute kernels on the newly arrived tensor resident in HBM. The traditional path begins with a file-system read call (1), stages data into an OS kernel buffer via storage DMA (2), requires a CPU-mediated memory copy into user space (3), executes a second DMA transfer over PCIe to GPU memory (4), and finally enables GPU computation (5).
Learning Objective: Analyze the multi-hop data movement and CPU mediation steps in the traditional storage I/O path
Self-Check: Answer
A 256-node cluster saves a 175B-parameter resumable checkpoint (\(2.45\text{ TB}\) total: \(350\text{ GB}\) FP16 weights, \(700\text{ GB}\) FP32 master weights, and \(1.4\text{ TB}\) of Adam moments) every 10 minutes. Under tiered staging, each node writes its \(9.57\text{ GB}\) ZeRO-3 shard to local NVMe (\(28\text{ GB/s}\) local array) in \(\approx 0.34\text{ s}\), followed by an asynchronous background copy to a \(1\text{ TB/s}\) parallel file system taking \(\approx 2.45\text{ s}\). What is the exposed training pause time (\(T_{\text{write}}\)) per checkpoint?
- Roughly \(2.8\text{ s}\), because training must remain paused until both the local write and the durable PFS copy complete.
- Roughly \(0.34\text{ s}\), because the training barrier releases immediately after the fast local NVMe write completes, while the PFS replication proceeds asynchronously in the background.
- Zero seconds, because modern storage drivers execute zero-copy writes without interrupting GPU tensor execution.
- Roughly \(2.45\text{ s}\), because parallel file system latency determines the minimum barrier synchronization time across nodes.
Answer: The correct answer is B. Roughly \(0.34\text{ s}\), because the training barrier releases immediately after the fast local NVMe write completes, while PFS replication proceeds asynchronously. The synchronous phase is \(9.57\text{ GB} / 28\text{ GB/s} \approx 0.342\text{ s}\), about \(0.057\%\) of a 10-minute interval. The 2.8-second and 2.45-second options incorrectly block training on the shared-tier transfer. Zero seconds is impossible because the job must still capture and persist a consistent local snapshot. This is a local-write estimate excluding snapshot and coordination overhead. The checkpoint remains vulnerable to node loss until it reaches its durability boundary; retain the previous committed generation during background replication.
Learning Objective: Explain how tiered checkpoint staging minimizes the exposed training pause time by decoupling local NVMe writes from asynchronous durable replication
True or False: In distributed ML infrastructure, storage reliability is defined primarily as a write-completion property: once all nodes successfully execute and acknowledge their checkpoint write calls, the checkpoint can be guaranteed reliable for cluster recovery.
Answer: False. Storage reliability is a restore property, not a write property. A checkpoint is only reliable if the infrastructure continuously and automatically validates that saved shards can be located, reconstructed, schema-validated, and restored under realistic preemption and recovery conditions; unvalidated backups frequently fail during real incidents due to silent corruption, missing metadata, or software version mismatches.
Learning Objective: Evaluate the difference between write-completion acknowledgments and end-to-end restore validation in checkpoint reliability
A cluster of 1,024 accelerators trains a 70B-parameter model whose resumable checkpoint contains \(140\text{ GB}\) of FP16 weights, \(280\text{ GB}\) of FP32 master weights, and \(560\text{ GB}\) of Adam moments, or \(980\text{ GB}\) per full replica. Contrast naive full-replica checkpointing with ZeRO-3 sharded checkpointing across a \(100\text{ GB/s}\) shared storage fabric.
Answer: Naive full-replica checkpointing makes all 1,024 replicas write the same \(980\text{ GB}\) state, generating \(1{,}003.52\text{ TB}\) of traffic and taking roughly \(10{,}035\text{ s}\), or \(167.3\) minutes, across a \(100\text{ GB/s}\) fabric. ZeRO-3 writes one logical copy partitioned across the workers, collapsing total write volume to \(980\text{ GB}\) and shared-fabric time to roughly \(9.8\text{ s}\). Gradients are absent from both totals because the restored job recomputes them.
Learning Objective: Analyze how ZeRO-3 state sharding reduces cluster checkpoint write volume and eliminates multi-hour checkpoint storm stalls
A 30-day training run of a 175B model generates 4,320 resumable checkpoints totaling roughly \(10.6\text{ PB}\) of state data. Which retention policy balances rapid failure recovery, long-term auditability, and storage cost without exhausting the parallel file system budget?
- Retain all 4,320 checkpoints on the parallel file system to provide granular step-by-step rollback capabilities throughout the entire 30-day run.
- Delete all intermediate checkpoints immediately after each step and rely exclusively on live memory replication across peer nodes for fault tolerance.
- Retain the 3 most recent checkpoints on the parallel file system for fast local recovery, copy every 100th checkpoint to cloud object storage for long-term lineage, and purge older intermediate snapshots.
- Compress all checkpoints with gzip and write them directly to cold tape archive without maintaining any copies on NVMe or parallel file systems.
Answer: The correct answer is C. Keeping the 3 most recent checkpoints on the parallel file system bounds active high-performance storage to \(7.35\text{ TB}\) (\(3 \times 2.45\text{ TB}\)), while archiving every 100th checkpoint preserves 43 historical snapshots in object storage. Retaining all \(10.6\text{ PB}\) on the PFS wastes high-cost capacity; deleting all checkpoints eliminates restart protection; and tape-only retention imposes excessive recovery latency.
Learning Objective: Design a tiered checkpoint retention policy that balances rapid crash recovery against long-term storage capacity costs
Order the sequence of steps executed during a tiered asynchronous checkpointing operation: (1) Background daemons asynchronously transfer the local checkpoint shards from NVMe to the shared parallel file system, (2) The training orchestrator initiates a synchronized step barrier across all worker ranks, (3) Each rank snapshots its model weights and optimizer state shard into a local pinned DRAM buffer, (4) The training barrier releases and accelerators immediately resume forward-backward computation for the next step, (5) Each node flushes its pinned memory snapshot to local NVMe at full drive bandwidth.
Answer: The correct order is: (2) The training orchestrator initiates a synchronized step barrier across all worker ranks, (3) Each rank snapshots its model weights and optimizer state shard into a local pinned DRAM buffer, (5) Each node flushes its pinned memory snapshot to local NVMe at full drive bandwidth, (4) The training barrier releases and accelerators immediately resume forward-backward computation for the next step, (1) Background daemons asynchronously transfer the local checkpoint shards from NVMe to the shared parallel file system. The process begins with a coordinated barrier (2), creates a fast in-memory snapshot (3), writes the shard to local NVMe (5), releases the compute barrier to resume training (4), and asynchronously replicates the shard to shared storage in the background (1).
Learning Objective: Analyze the multi-stage execution workflow of tiered asynchronous checkpointing
Self-Check: Answer
A feature-pipeline worker writes the output row for click event
e42, then crashes before it records that the write succeeded. Its replacement cannot tell whether the row was committed. Which design lets the replacement reprocesse42without losing the event or counting it twice?- Write each output row under a stable key such as
(feature_version, e42), so a replay overwrites the same row instead of appending a second one. - Switch the stage to at-most-once processing, so uncertain events are never replayed.
- Deliver messages between workers over a reliable transport, so every message arrives exactly once.
- Lengthen the watermark delay, so late events have more time to arrive before the window closes.
Answer: The correct answer is A. The duplicate comes from the worker’s own replay, not from message delivery, so it must be removed at the output commit boundary: a replayed write under a stable key leaves the same result however many times it repeats. At-most-once processing loses
e42instead of duplicating it, a reliable transport cannot see the worker’s replay, and a watermark governs event-time completeness rather than replay correctness.Learning Objective: Apply stable, idempotent writes at the output commit boundary to make replay after a worker failure effectively exactly-once
- Write each output row under a stable key such as
A team generates a \(1\text{ TB}\) synthetic text dataset. Retained provenance adds \(40\%\) metadata overhead, and 3 verifier models each read the payload once without materializing another full copy. What persistent capacity and total pipeline traffic are required?
- \(1.4\text{ TB}\) of persistent capacity and \(4.4\text{ TB}\) of traffic: \(1\text{ TB}\) payload write, \(0.4\text{ TB}\) metadata write, and \(3\text{ TB}\) of verifier reads.
- Exactly \(1.0\text{ TB}\), because verifier models run entirely in GPU registers without generating persistent storage artifacts.
- Roughly \(0.4\text{ TB}\), because synthetic data compresses more efficiently than natural language text.
- Roughly \(14\text{ TB}\), because every verifier model stores a full \(350\text{ GB}\) copy of its internal neural activations for every sample.
Answer: The correct answer is A. Persistent capacity is \(1.4\text{ TB}\): the \(1\text{ TB}\) payload plus \(0.4\text{ TB}\) of provenance. Pipeline traffic is \(4.4\text{ TB}\): those \(1.4\text{ TB}\) of writes plus three \(1\text{ TB}\) verifier reads. Verification passes do not multiply capacity unless their outputs are materialized as additional full datasets.
Learning Objective: Distinguish persistent storage amplification from read and write traffic in a verified synthetic-data pipeline
Explain why synthetic training data pipelines must treat storage as an active ‘provenance engine’ by recording the generating model, filters, and verifier scores for each accepted sample, rather than storing plain text files.
Answer: If synthetic data is stored as unverified plain text without lineage, future models risk recursively training on uncurated, erroneous synthetic outputs produced by prior generations, triggering ‘model collapse’ where model diversity and output quality progressively degrade. Storing an immutable provenance chain (generating model ID, prompt template, rejection filters, and verifier reward scores) supports auditing so data can be filtered, re-weighted, or purged when a generator or judge model is found to possess systematic errors or biases.
Learning Objective: Justify retaining synthetic-sample provenance to support audits and filtering when recursive training degrades model quality
The degenerative failure mode where a machine learning model progressively degrades in quality and loses distributional diversity by recursively training on unverified synthetic data produced by earlier models is called model ____.
Answer: The correct term is collapse (or model collapse). Recursive training on generated data can degrade distributional diversity and output quality. Provenance supports audits, filtering, and removal of problematic samples; recording lineage alone does not prevent the degradation.
Learning Objective: Explain the mechanism of model collapse caused by recursive training on uncurated synthetic data
Self-Check: Answer
A team trains a vision model on a \(50\text{ TB}\) dataset stored in cloud object storage (\(\$0.02/\text{GB-month}\)) for 20 epochs across 4 training runs per year. Reading from object storage across a network boundary incurs a \(\$0.09/\text{GB}\) data egress fee. Staging the dataset onto local NVMe caches costs \(\$0.10/\text{GB-month}\). What does the economic analysis reveal about streaming vs. staging?
- Streaming directly from object storage every epoch is cheaper because local NVMe drives add unnecessary provisioned storage overhead.
- Egress fees are negligible compared to monthly storage costs, making tier selection purely a matter of operational convenience.
- Staging data once to local NVMe per run saves roughly \(\$282,000\) per year compared to streaming from object storage every epoch, breaking even after just 5 epochs per run.
- The team should migrate the dataset to cold tape archive to eliminate both egress fees and provisioned storage costs.
Answer: The correct answer is C. Staging data once to local NVMe per run saves roughly \(\$282,000\) per year compared to streaming from object storage every epoch, breaking even after just 5 epochs per run. Streaming \(50\text{ TB}\) across 20 epochs costs \(\$90,000\) in egress per run (\(\$360,000/\text{year}\) for 4 runs) plus \(\$12,000/\text{year}\) in object storage. Staging once per run incurs only \(\$18,000/\text{year}\) in egress plus \(\$60,000/\text{year}\) for local NVMe and \(\$12,000/\text{year}\) in object storage (total \(\$90,000/\text{year}\)), yielding \(\$282,000\) in net annual savings. The break-even point occurs at roughly 4.3 epochs per run. The streaming-is-cheaper option ignores the massive compounding cost of repeated multi-epoch egress. The egress-is-negligible claim inverts reality: egress charges dominate monthly capacity pricing. The tape archive suggestion is unviable for active multi-run training feeds.
Learning Objective: Calculate the break-even point and cost savings of local NVMe data staging versus repeated cloud object storage streaming
In a 1,000-GPU cluster where compute time is billed at \(\$2.00\) per GPU-hour, an undersized storage system introduces an additional 20 percentage points of input stalls (reducing the active compute fraction from \(90\%\) to \(70\%\)). Calculate the daily cost of this lost compute capacity and explain why investing in high-performance storage is economically rational.
Answer: At the stated rate, the cluster costs \(\$48,000\) per day. An additional 20 percentage points of wall-clock capacity lost to input stalls corresponds to \(\$9,600\) per day, or \(\$288,000\) over 30 days. This is a capacity-cost estimate, not guaranteed cash savings: a storage investment pays back only if its cost is below the value of stalls actually removed and the recovered capacity reduces runtime or serves useful work.
Learning Objective: Justify storage infrastructure capital investments by quantifying the opportunity cost of storage-induced accelerator idle time
An enterprise evaluates building an on-premises 1 PB parallel file system (\(\$3\text{M to } \$5\text{M}\) capex plus \(\$500\text{k/year}\) opex) versus storing the 1 PB corpus in cloud object storage (\(\$240\text{k/year}\) storage) and paying \(\$0.09/\text{GB}\) egress fees for 10 full-dataset reads per year (\(\$900\text{k/year}\) egress). What is the realistic financial payback horizon for building the on-premises system under these parameters?
- Between 4.7 and 7.8 years, because net annual cloud delivery savings (\(\$640\text{k/year}\)) require multiple years to amortize the multi-million dollar initial hardware expenditure.
- Less than 6 months, because cloud egress fees make any on-premises storage investment instantly profitable.
- Exactly 20 years, because on-premises operational overhead exceeds all cloud storage and egress fees combined.
- There is no payback horizon because cloud object storage is perpetually free for research and training workloads.
Answer: The correct answer is A. Between 4.7 and 7.8 years, because net annual cloud delivery savings (\(\$640\text{k/year}\)) require multiple years to amortize the multi-million dollar initial hardware expenditure. Cloud delivery costs \(\$1.14\text{M/year}\) (\(\$240\text{k}\) storage + \(\$900\text{k}\) egress). Subtracting on-premises annual operations (\(\$500\text{k}\)) leaves net annual savings of \(\$640\text{k/year}\). Dividing the \(\$3\text{M}\) to \(\$5\text{M}\) capex by \(\$640\text{k}\) gives a break-even range of roughly 4.7 to 7.8 years. The 6-month claim is overly optimistic and ignores fixed facility, power, and operational overheads. The 20-year claim fails to account for the \(\$900\text{k}\) annual egress cost in the cloud model. The perpetually free claim is factually false.
Learning Objective: Evaluate build-versus-buy trade-offs for large-scale storage infrastructure using capital expenditure, operational costs, and data egress fees
In cloud-based ML infrastructure, the recurring fee charged by providers per gigabyte of data transferred out of an object storage bucket across region or internet boundaries is called an ____ fee.
Answer: The correct term is egress (or data egress). Egress fees scale with the volume of data read rather than the volume stored, often exceeding monthly storage capacity costs for multi-epoch deep learning workloads.
Learning Objective: Explain the concept of data egress fees charged when reading datasets across cloud network boundaries
Self-Check: Answer
A serving node must load the \(350\text{ GB}\) of FP16 weights of a 175B-parameter model into accelerator memory. Which source gives the shortest cold start under the chapter’s stated rates?
- Eight Gen4 NVMe drives read in parallel, each supplying one \(43.75\text{ GB}\) shard at \(7\text{ GB/s}\), for about 6.2 seconds.
- A single Gen5 NVMe drive at \(14\text{ GB/s}\), for about 25 seconds.
- The node’s \(4\text{ GB/s}\) share of the parallel file system, for about 87.5 seconds.
- A single object-storage client at \(1\text{ GB/s}\), for about 5.8 minutes.
Answer: The correct answer is A. Striping the weights across eight drives divides the load into \(43.75\text{ GB}\) shards that load concurrently, so the load takes \(43.75 / 7 \approx 6.2\text{ s}\). One faster drive still moves all \(350\text{ GB}\) serially (\(350 / 14 = 25\text{ s}\)), and the shared tiers are slower still for a single node.
Learning Objective: Calculate cold-start load times for model weights from different storage tiers and explain why parallel striping shortens them
A warm replica keeps the \(350\text{ GB}\) of weights in host DRAM. Each GPU’s own host link could move its \(43.75\text{ GB}\) shard in about 0.7 seconds, yet the full load takes about 1.8 seconds. Explain why.
Answer: All eight shard transfers read from the same host memory, whose \(200\text{ GB/s}\) bandwidth must carry the whole \(350\text{ GB}\), which takes about 1.8 seconds. The per-GPU links run in parallel, so they are not the bottleneck; the shared host-memory bandwidth is. A warm replica therefore trades DRAM capacity for a host-memory-bound load that is still several times faster than a striped NVMe read.
Learning Objective: Identify the shared resource that bounds a parallel weight load from host memory
A serving fleet of 100 replicas of a 175B-parameter model deploys a new version, so all replicas must read \(35\text{ TB}\) of FP16 weights at once. Which statement correctly evaluates the shared sources?
- A \(100\text{ GB/s}\) object store finishes in about 5.8 minutes, while the \(1\text{ TB/s}\) parallel file system would take about 35 seconds but only by claiming the whole file system from co-tenant training jobs.
- The parallel file system is always the right source because 35 seconds is shorter, and serving reads cannot interfere with training jobs.
- The object store finishes in about 35 seconds because each replica reads only its own share of the weights.
- Rollout time is independent of the source tier because each replica’s load is limited by its own PCIe link.
Answer: The correct answer is A. The rollout reads \(35\text{ TB}\) in one burst, so time is volume divided by the aggregate rate the source can give the fleet: \(35\text{ TB} / 100\text{ GB/s} \approx 5.8\) minutes, or \(35\text{ TB} / 1\text{ TB/s} = 35\) seconds. The faster option starves every training job sharing the file system, the read-side mirror of a checkpoint storm, which is why fleets stage new versions locally, roll updates across replica groups, or let loaded replicas supply the rest.
Learning Objective: Size a fleet-wide model rollout against shared storage tiers and identify its interference with co-tenant training
How does the storage performance bottleneck for a graph-based vector retrieval index at billion-vector scale contrast with the primary bottleneck of an ML training data loader?
- Vector retrieval is bottlenecked by sequential streaming bandwidth (GB/s), whereas training data loaders are bottlenecked by random \(4\text{ KB}\) read IOPS.
- Vector retrieval requires continuous multi-terabyte burst writes, whereas training data loaders perform purely read-only operations.
- Vector retrieval is strictly compute-bound on matrix multiplication units and generates zero storage device interaction.
- Vector retrieval traverses high-dimensional graph structures requiring high random-access IOPS and low point-lookup latency, whereas training data loaders require sustained high-bandwidth sequential streaming.
Answer: The correct answer is D. Vector retrieval traverses high-dimensional graph structures requiring high random-access IOPS and low point-lookup latency, whereas training data loaders require sustained high-bandwidth sequential streaming. Retrieval-augmented generation inverts the training access pattern: instead of streaming large contiguous shards sequentially, vector search algorithms (like HNSW or DiskANN) navigate sparse high-dimensional graph adjacency lists, issuing thousands of small, non-sequential pointer lookups where latency and random IOPS govern query response time. The sequential-streaming option inverts the two workloads. The burst-write claim confuses retrieval query serving with training checkpointing. The zero-storage claim ignores that billion-scale vector indexes span terabytes of storage.
Learning Objective: Compare the storage performance bottlenecks of vector retrieval graph traversal against training data streaming
True or False: In graph-based approximate nearest-neighbor search such as HNSW or DiskANN, increasing target recall from \(90\%\) to \(99\%\) generally requires exploring more graph nodes, increasing random storage accesses and query latency.
Answer: True for graph-based ANN under otherwise comparable settings. Raising recall generally expands the search beam or visits more candidate nodes, increasing vector-distance computations and random DRAM or SSD accesses and therefore latency. This mechanism is specific to graph traversal; flat scans, IVF indexes, and PQ-based designs expose different controls and bottlenecks.
Learning Objective: Analyze the recall-latency-IOPS trade-off in graph-based high-dimensional vector search
A billion-entry vector index of 1536-dimensional FP32 embeddings consumes roughly \(6.1\text{ TB}\) of raw vector data plus graph adjacency overhead. Explain why systems migrate from pure in-memory indexes (HNSW) to disk-backed graph indexes (DiskANN), and identify the primary hardware trade-off involved.
Answer: The raw vectors alone occupy about \(6.1\text{ TB}\). At 50 to 100 adjacency bytes per entry, minimal graph links add only \(50\) to \(100\text{ GB}\); identifiers, allocator overhead, slack, and replication can add more. A disk-backed graph index keeps compact navigation representations in DRAM and fetches other data from SSD, trading lower DRAM capacity for random SSD access latency. The actual memory reduction and latency penalty depend on the representation, cache, and search settings.
Learning Objective: Compare in-memory (HNSW) and disk-backed (DiskANN) vector indexing architectures in terms of capacity cost and query latency trade-offs
Self-Check: Answer
A team selects RAID 5 for a disposable local training-data cache whose immutable source is durably stored elsewhere. The fleet can tolerate restaging after drive failure. Why might RAID 0 be a better throughput-and-capacity trade-off under this failure contract?
- RAID 5 cannot be formatted with modern Linux filesystems such as ext4 or XFS.
- RAID 5 disables hardware DMA transfers, preventing the GPU from accessing host DRAM.
- The cache can be reconstructed from its durable source, so RAID 0 can aggregate drives without parity overhead when restaging disruption is acceptable.
- RAID 5 increases drive endurance wear by \(10\times\) compared to single-drive configurations.
Answer: The correct answer is C. A disposable cache need not own durability when its source remains available. RAID 0 removes parity overhead but increases exposure to cache loss and restaging. RAID 5 can still be justified by availability requirements; checkpoints awaiting durable replication are not disposable. Filesystem support and DMA are not disabled by RAID 5, and the stated endurance multiplier is unsupported.
Learning Objective: Evaluate RAID parity and striping trade-offs for disposable ML caches under explicit durability and availability requirements
A training team upgrades its cluster from A100 to H100 GPUs, expecting a \(3\times\) end-to-end training speedup. However, wall-clock epoch time barely improves, and GPU utilization drops from \(85\%\) to \(35\%\). Traces show shorter uninterrupted compute time, unchanged measured input-delivery rate, and increased time waiting for ready input batches, while communication and checkpoint pauses remain unchanged. Diagnose the measured bottleneck and explain why faster compute exposed it.
Answer: The traces establish an input-delivery limit: compute finishes sooner, but the unchanged pipeline does not supply ready batches at the new consumption rate. More of the iteration is therefore exposed input wait. Prefetching can hide delays within its queue window but cannot overcome a sustained delivery-rate deficit. The utilization and epoch-time figures alone would not identify this cause; the supplied timing measurements distinguish it from communication or checkpoint pauses. Profile individual read, decode, and transfer stages before selecting a remedy.
Learning Objective: Analyze training throughput regressions following accelerator compute upgrades using the I/O wall framework
A team replaces a lighter codec with a denser codec on local-NVMe training shards. On this corpus, illustrative measurements give the lighter codec a 3:1 ratio and 1.5 GB/s decoded output per core, versus 4:1 and 0.5 GB/s for the denser codec. Before the change, worker profiles show decoding and augmentation saturating the host CPU and the ready-batch queue repeatedly draining. Afterward, decompression consumes more CPU time, the queue drains more often, and training step time increases although stored bytes decrease. What caused this measured regression?
- Compressed shards cannot be read by NVMe controllers because flash drives require raw uncompressed binary blocks.
- The pipeline was already CPU-bound on data decoding and augmentation, so adding heavy decompression work saturated the host CPU, starving the GPU of assembled batches.
- The denser codec introduces non-deterministic bit flips that cause stochastic gradient descent to diverge.
- The parallel file system rejects compressed shards larger than 1 GB due to POSIX file locking constraints.
Answer: The correct answer is B. The supplied worker profiles and ready-batch queues establish a host-processing limit before the change; additional decompression work further reduces completed-batch delivery. The denser codec saves stored bytes but requires more CPU work for the same decoded output under these corpus-specific measurements. These illustrative rates are not fixed properties of named compression levels. Compare output-equivalent stage rates and input wait when choosing a representation.
Learning Objective: Analyze the CPU-versus-I/O trade-offs of data compression and identify when decompression overhead degrades pipeline throughput
True or False: Sizing a data loader’s prefetch buffer depth based on average storage read latency ensures that training runs will not experience data stalls during multi-week training jobs on shared object storage.
Answer: False. Average latency does not bound tail stalls. A starting buffer budget is \(Q_{\text{prefetch}} = \lceil T_{\text{I/O,p99}} / T_{\text{compute}} \rceil\) plus margin, but longer or correlated delays can still drain it; sustained delivery bandwidth must also keep pace with consumption.
Learning Objective: Evaluate why prefetch queues sized to average latency fail to prevent accelerator stalls under tail-latency variance
A team creates full \(10\text{ TB}\) copies of a pretraining dataset for every snapshot version, creating 20 versions over six months (\(200\text{ TB}\) total storage). Explain how content-addressable storage or delta encoding optimizes this workflow when successive versions differ by only \(5\%\).
Answer: The first version requires \(10\text{ TB}\). Nineteen subsequent versions with \(5\%\) new content each add \(0.5\text{ TB}\), for \(19.5\text{ TB}\) total before metadata and replication, saving \(180.5\text{ TB}\) against 20 full copies. Content-addressable storage references unchanged blocks rather than copying them; the reduction assumes changes remain localized at the stored block or shard granularity.
Learning Objective: Compare naive full-copy dataset versioning against delta-encoded content-addressable snapshotting in terms of storage efficiency