🚧 DEVELOPMENT PREVIEW - Built from dev@aaa7266e • 2026-10-16 16:04 EDT • Stable version →
📘 PREVIEW — Volume II: Scaling. Distributed training, fleet operations, and responsible deployment. 📗 First time here? Start with Volume I: Foundations — open access, free forever. 🛠️ Alongside the book:TinyTorch (build) · Hardware Kits (deploy) · MLSys·im (model) · Labs (explore) · StaffML (practice) 📬 Newsletter: ML Systems insights & updates — Subscribe →
3 Network Fabrics
Purpose
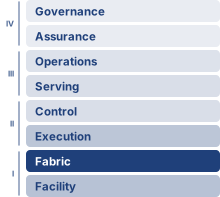
Fleet stack focus for this chapter.
Why can the network connecting accelerators matter more than the accelerators themselves at scale?
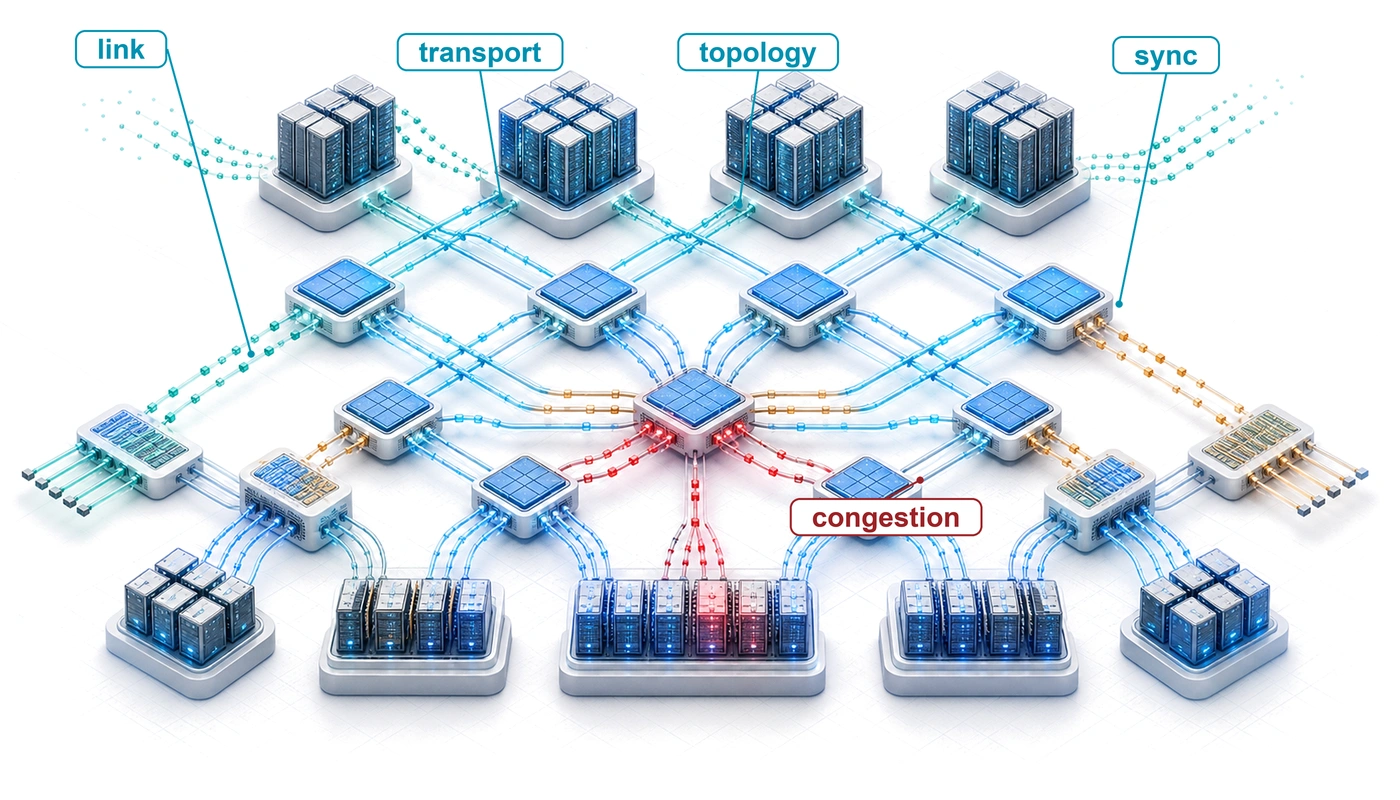
A single accelerator can perform trillions of operations per second, but distributed training requires devices to exchange results before dependent work can proceed. When network capacity cannot keep pace with computation, accelerators sit idle, and adding more devices can increase the waiting instead of shortening the run. The resulting cost extends beyond the network equipment: an inexpensive connection can leave expensive compute capacity unused throughout a long experiment. Single-node intuition is insufficient because data that once traveled through a local interconnect must now cross cables, switches, and shared paths. A fast connection between two machines does not establish that the same performance will hold when the entire fleet communicates at once. The arrangement of those paths determines which groups can exchange data together and where competing transfers accumulate. Large transfers need sustained bandwidth, while frequent dependent exchanges can remain limited by the time required to start and complete each message. A delayed participant can hold up others even when most links appear healthy. Network design therefore has to follow the workload’s communication pattern, and validation must reflect the traffic that will actually run. Choices about placement, sharing, and failure recovery affect whether available bandwidth becomes useful progress or recurring delay. In C³ terms, the fabric connects compute through communication, while coordination determines when the fleet must wait for that communication to finish.
Learning Objectives
Explain how synchronized collective traffic inverts data-center assumptions about flows, loss, and oversubscription
Model network communication cost using the \(\MessageStartupLatency\)-\(\LinkBandwidth\) framework and identify bandwidth-dominated vs. latency-dominated regimes
Compare high-performance transport protocols by latency, loss-recovery behavior, and operational complexity
Compare network topologies using \(\BisectionBandwidth\), hop count, and the workload’s collective communication pattern
Evaluate congestion-control mechanisms and their impact on tail latency during distributed training
Compare network partitioning and traffic-isolation mechanisms for concurrent training and inference workloads
Diagnose network performance bottlenecks using RDMA counters, link-level telemetry, and bandwidth testing tools
3.1 The Synchronization Backbone
One slow link stalls every peer that waits on it.
Compute Infrastructure traced the bandwidth hierarchy down to the node boundary, where each GPU’s NVLink bandwidth narrows to a single external network port. How much that narrowing costs depends on what the training job must push through the port, and how often. Consider the running instance of Archetype A (GPT-4/Llama-3), a 175B-parameter GPT-3-class dense transformer partitioned across the 1,024 GPUs of the reference cluster. Each training step must combine gradient contributions so that corresponding model replicas apply the same update. This operation, called AllReduce, returns the combined result to every participating worker. The model has 350 GB of gradient data at two bytes per parameter, the 16-bit gradients of mixed-precision training that this chapter assumes throughout (FP32 gradients would double the figure). That model-wide figure is not what any one GPU sends. When a reduction partitions the gradient across all 1,024 ranks, each rank owns a 1/1,024 share, a few hundred megabytes, which is the gradient-shard size the transport examples below use; the job’s tensor, pipeline, and data-parallel split (Distributed Training) sets each GPU’s actual payload. Worked examples that switch to another model, precision, or payload state their parameters explicitly. A delayed transfer on the step’s critical path can leave the other 1023 GPUs waiting at a job-wide synchronization boundary. The fabric’s contribution to training time therefore depends on which transfers the next computation needs and how much of their cost remains exposed. In that role the fabric is not auxiliary infrastructure; it is the synchronization backbone that decides whether the cluster trains as one machine.
Within the multi-tier fleet hierarchy framed by The Fleet Stack, the fabric turns isolated accelerator nodes into a coherent training system. Accelerators, power delivery, cooling, racks, and pods define what each node can compute in isolation; the fabric determines whether the nodes can act together before communication cost overwhelms computation. That design space organizes into a five-level model of co-dependent tiers, developed in section 3.2.1.
At scale, communication cost can dominate computation cost. The fleet-law decomposition in The Fleet Law makes this explicit: the nonoverlapped communication term \(\CommunicationTime(\DeviceCount) - \OverlappedTime\) determines how much of each training step is exposed to the network fabric. The fabric influences the layers above it by determining whether communication can run while independent computation continues, which collective algorithms are viable, and how network partitions interact with node failures. That concurrency, communication-computation overlap, is what the \(\OverlappedTime\) term credits, because transfer time that proceeds behind useful arithmetic does not lengthen the step.
↪ How layer-by-layer scheduling achieves that overlap, and how much communication it still leaves exposed, is developed in Communication-Computation Overlap.
A collective is a communication operation performed by a group of workers. Its name specifies the result each worker receives, while an algorithm determines the messages that produce that result. The physical network fabric carries three recurring collective communication patterns:
AllReduce: Combines corresponding values from all participants and returns the same result to each; synchronous training uses a sum, followed by normalization, to average gradient contributions across workers.
AllGather: Collects a distinct portion from each participant and returns the concatenated collection to every participant, as required when reconstructing a sharded parameter tensor.
AllToAll: Lets each participant send a distinct portion to every other participant, an exchange central to expert parallelism when workers host different expert subnetworks and must route tokens to their assigned destinations.
Collective communication algorithms orchestrate these patterns, while the fabric layer supplies the physical wires and switches that carry them. The distinction matters because the fabric’s physical properties (bandwidth, latency, and topology) determine which patterns are efficient and which become bottlenecks.
↪ The full set of collective primitives, with the output contract each one guarantees, is developed in The six core primitives.
Systems Perspective 3.1: The network as a gradient bus
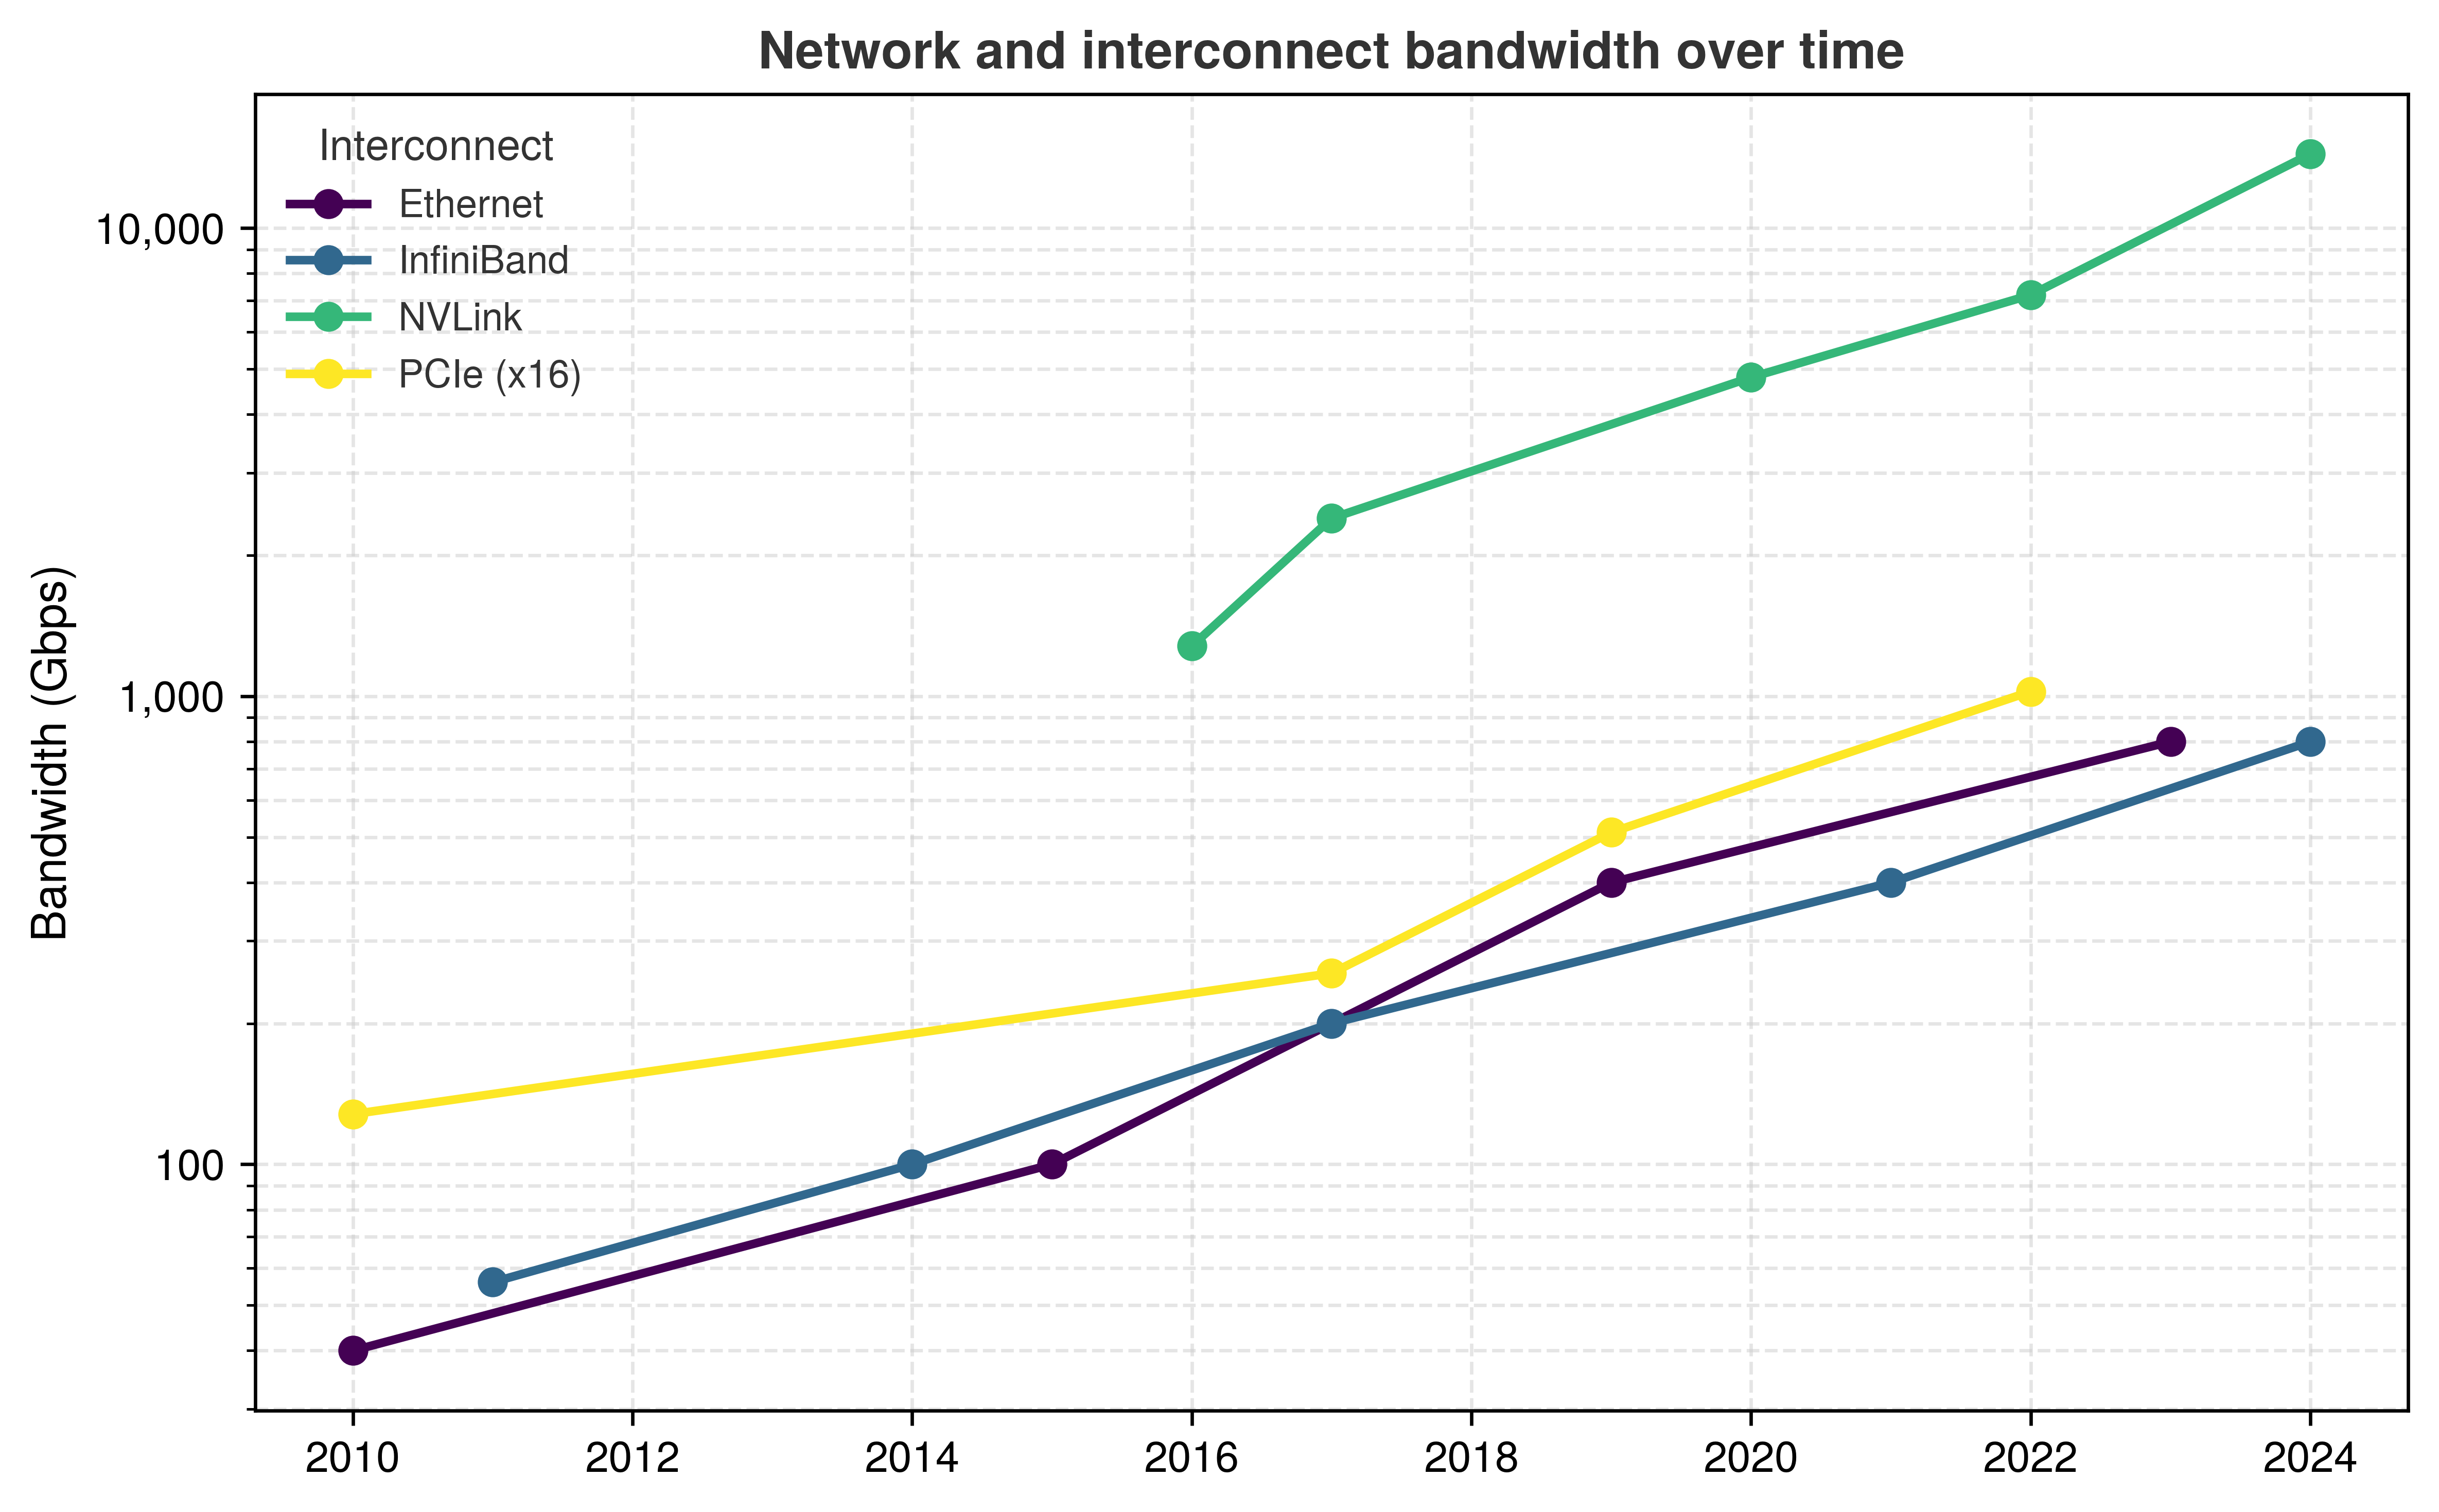
In a single machine, the memory bus moves data between the processor and memory. In a distributed training cluster, the network fabric serves an analogous role as the gradient bus that carries contributions between workers. When those exchanges limit progress, the job encounters the network wall mapped across the pod tier in The Four Infrastructure Walls. Protocols, topologies, congestion control, and collective schedules determine how effectively the job uses the available paths. This bus has a narrow segment. Since NVLink appeared, the external ports that join machines have offered less bandwidth than the interconnect inside each machine in every generation (figure 1). How much of that gap a job actually feels depends on its message sizes, port provisioning, routing, and contention, so the link ratio bounds the problem rather than predicting a transfer time.
Figure 1: Historical Network Bandwidth Scaling: Intra-node NVLink, inter-node InfiniBand and Ethernet, and the PCIe host bus, plotted per direction on a common log scale by the year each generation first shipped, 2010 to 2025. The aggregate NVLink budget exceeds the external-port budgets in these configurations; collective completion time also depends on payloads, provisioning, routing, and overlap. Rates and first-product years from IEEE 802.3, InfiniBand Trade Association, PCI-SIG, and NVIDIA specifications and product announcements.
The reference hardware gives the gradient bus analogy a concrete scale. A single H100 has a precision-specific FP16 peak of 989 TFLOP/s and memory bandwidth of 3.35 TB/s. Each GPU’s NVLink ports together provide 900 GB/s of bidirectional bandwidth to its peers within the node. The comparison that matters is per GPU and per direction. In the reference node each GPU has its own network interface card (NIC) with one NDR InfiniBand port, so a tensor leaving the node through that GPU drops from 450 GB/s of NVLink bandwidth to 50 GB/s at the port, the 9× gap that the bandwidth hierarchy of Bandwidth hierarchy already identified as the node boundary’s cliff. The model-wide 350 GB gradient state does not all pass through every 50 GB/s port; partitioning and the collective schedule determine each port’s traffic. Converting that gap into a step-time estimate requires the workload’s local payloads and communication dependencies.
↪ The network hierarchy ratio between intra-node and inter-node bandwidth, with the reference NVLink and InfiniBand values behind it, is developed in Numbers Every Fleet Engineer Should Know.
Which traffic must cross that gap depends on how the job is partitioned. The same hierarchy keeps tensor parallelism, with its per-layer exchanges, inside the NVLink domain and lets pipeline stages and data-parallel replicas span nodes, the combination called 3D parallelism whose schedules are developed in The 3D training loop. The fabric adds one lever to that placement. Each data-parallel replica can sum gradients over several microbatches before an exchange (gradient accumulation), reducing how often it must cross the node boundary at the cost of changing the batch and update schedule.
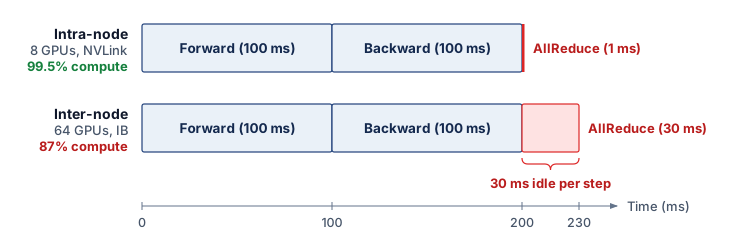
Exposed communication leaves gaps between dependent compute phases. Two assumed training schedules on a common 230 ms axis, each containing 100 ms forward and backward compute phases, make that cost visible (figure 2). The 8-GPU intra-node case assumes a 1 ms AllReduce and spends 99.5 percent of the step in those compute phases; the 64-GPU inter-node case assumes a 30 ms AllReduce and spends 87 percent in computation. The two AllReduce durations are illustrative inputs chosen to show the effect, not values derived from the link rates above, and the percentages are shares of the schedule rather than measured arithmetic utilization.
Figure 2: The Bandwidth Cliff in a Training Step: Illustrative timelines on a common millisecond axis for the same compute phases: an 8-GPU intra-node job (top) with an assumed 1 ms AllReduce, and a 64-GPU inter-node job (bottom) with an assumed 30 ms AllReduce. These durations illustrate an exposed communication cost rather than predict a particular fabric. The AllReduce phase (red) grows from a thin sliver to a larger share of the step. Without overlap, model computation waits during AllReduce. The compute phases occupy 99.5 percent and 87 percent of these illustrative schedules, a gap of 12.5 percentage points; these shares are not arithmetic utilization measurements.
In Fleet Law terms, the widened red block is the part of \(\CommunicationTime(\DeviceCount)\) that no \(\OverlappedTime\) has hidden. In the inter-node schedule it is 30 ms of every 230 ms step, about 13 percent, and that share applies to every accelerator-hour the cluster spends for the life of the run. Network fabric design therefore belongs at the center of distributed-training design rather than at its edge.
Self-Check: Question
On an H100 GPU server, why does moving gradient synchronization across node boundaries create a severe ‘bandwidth cliff,’ and by what factor does per-direction bandwidth drop when transitioning from local NVLink to a single NDR InfiniBand port?
Bandwidth drops by roughly \(2\times\) because optical conversion adds latency while maintaining similar wire transfer rates
Bandwidth drops by roughly \(50\times\) because inter-node links must encapsulate packets in kernel TCP/IP stacks
Bandwidth drops by roughly \(9\times\) (from \(450\text{ GB/s}\) per direction to \(50\text{ GB/s}\) per port) due to the physical distance and switching constraints of inter-node cables
Bandwidth drops by roughly \(100\times\) because inter-node communication requires staging all gradients through CPU system RAM
In a 1,024-GPU synchronous training job on a 175B-parameter model, a degraded inter-node link carries a required collective transfer. Explain when its delay can leave the other participating GPUs waiting, and why the link fault alone does not establish a job-wide slowdown.
True or False: AllToAll collective communication is less demanding on network fabric bisection bandwidth than AllReduce because each GPU only sends data to a single designated peer.
In a distributed training cluster, the network fabric functions as the global ______, analogous to the internal memory bus in a single workstation, moving parameter updates and activation tensors between accelerators.
3.2 How ML Networking Inverts Data-Center Assumptions
A network provisioned for many independent requests can encounter a different load when a training job releases gradient exchanges together. Statistical multiplexing relies on traffic peaks not all coinciding; synchronized workers can instead compete for the same paths at the same time. Web services also have dependency chains and tail-latency requirements, but a bulk-synchronous training job makes the participating workers’ shared completion boundary explicit.
The ML networking inversion in table 1 concerns this change in traffic dependencies. Synchronous collective phases can generate correlated bursts and long-lived flows whose completion gates the next computation. Fabric validation must therefore measure collective completion under the expected load; average per-flow throughput alone does not establish that the job can meet its step-time budget.
Table 1: ML Networking Inverts Traditional Data-Center Assumptions: The comparison contrasts independent-request traffic with synchronized collective phases. Correlated demand and shared completion boundaries change the fabric’s capacity and latency requirements.
Workload pattern
Traditional data-center assumption
ML reality
Traffic pattern
Independent requests can arrive asynchronously
Collective phases can release correlated bursts
Flow type
Many short transfers can share available paths
Large collective transfers can create persistent “elephant” flows
Performance metric
Per-request completion and throughput
Collective completion and exposed step time
Loss tolerance
Recovery delays affected requests
Recovery can delay dependent workers at a barrier
Congestion
Statistical multiplexing relies on noncoincident peaks
Shared paths and fan-in can concentrate synchronized traffic
The bulk synchronous parallel (BSP)1 model, the lockstep at step barriers already met at the scale of one node (The Node), makes the dependency in table 1 explicit. In the synchronous training example, all 1,024 GPUs must complete the required gradient exchange before the next step can proceed. A 100 ms transfer delay adds 100 ms to that step only if it extends the critical path by the full interval; other computation or communication may hide part of it. At a barrier that waits for the last required result, tail latency, the slow end of the completion-time distribution (commonly reported as its 99th percentile, p99), decides when the step ends, so at such a barrier the tail cannot be dismissed as an outlier.
1BSP (bulk synchronous parallel): Proposed by Valiant (1990) as a bridging model between parallel hardware and software. Synchronous data-parallel training follows the same barrier structure (Goyal et al. 2017; Li et al. 2020).
Valiant, Leslie G. 1990. “A Bridging Model for Parallel Computation.”Communications of the ACM 33 (8): 103–11. https://doi.org/10.1145/79173.79181.
Goyal, Priya, Piotr Dollár, Ross Girshick, Pieter Noordhuis, Lukasz Wesolowski, Aapo Kyrola, Andrew Tulloch, Yangqing Jia, and Kaiming He. 2017. “Accurate, Large Minibatch SGD: Training ImageNet in 1 Hour.”arXiv Preprint arXiv:1706.02677 abs/1706.02677.
Li, Shen, Yanli Zhao, Rohan Varma, Omkar Salpekar, Pieter Noordhuis, Teng Li, Adam Paszke, et al. 2020. “PyTorch Distributed: Experiences on Accelerating Data Parallel Training.”Proceedings of the VLDB Endowment 13 (12): 3005–18. https://doi.org/10.14778/3415478.3415530.
Definition 3.1: Bulk synchronous parallel (BSP)
Bulk synchronous parallel (BSP) is a parallel execution model in which every worker completes a local computation phase, exchanges the data required by the next phase, and then waits at a global barrier before any worker begins the next phase, which makes the slowest participant the pacing constraint for the entire cluster.
Significance: The slowest required computation or communication determines when a superstep can complete. Faster workers wait at the barrier, so a localized delay can consume idle accelerator time across the entire participating group.
Distinction: BSP organizes execution into synchronized supersteps; it does not itself prescribe a learning algorithm or a particular exchange pattern. Synchronous data-parallel updates match a single-device reference only under compatible global batches, update rules, and numerical assumptions.
Common pitfall: Removing barriers does not by itself establish faster time-to-quality. Asynchronous training trades waiting against stale updates, and the convergence and wall-clock comparison depends on the workload and update schedule.
2Elephant and mice flows: The model-wide gradient size is not the size of one network flow. A collective can split each worker’s local gradient shard across channels and transport connections; the resulting long-lived flows can still collide under ECMP when their static hashes select the same path.
The flow inversion compounds this problem. Traditional networks are designed for fairness among millions of “mice flows,”2 yet ML training is dominated by a few “elephant flows” corresponding to the gradient AllReduce. The full 175B model has 350 GB of gradient state at the assumed precision, but a sharded job distributes that state across workers. Each collective operates on its participating group and local payload; its algorithm determines how much each worker sends. Standard flow control and routing mechanisms like equal-cost multi-path (ECMP), which hash each flow onto one of several equal-cost paths, are poorly suited to this traffic pattern. A static hash cannot subdivide one elephant flow across all available links, and it can inadvertently map multiple elephant flows to the same link, creating massive congestion while other links sit idle.
The loss inversion completes the picture. TCP was designed to recover across an unreliable network, and an occasional retransmission delays only the request it belongs to. In a synchronous collective, a lost packet delays the transfer that every waiting worker needs, and some NICs that implement remote direct memory access (RDMA), called RDMA NICs or RNICs, recover by resending everything after the missing packet rather than only the lost region (Go-Back-N-style recovery). ML fabrics therefore aim to make loss rare and recovery bounded, either by preventing buffer overflow at the link layer or by building transports that recover quickly from it. Level 2 (section 3.4.3) develops both approaches.
Correlated demand also makes oversubscription, provisioning less uplink capacity at a switch tier than the downlink capacity it serves (written as a downlink:uplink ratio such as 2:1), a workload decision. A fabric with spare capacity under independent requests can become saturated when a collective releases traffic across the same cut. Designing for that traffic requires tracing the constraint from the wire through transport, topology, and congestion control to the job’s synchronization boundary.
3.2.1 The five-level model
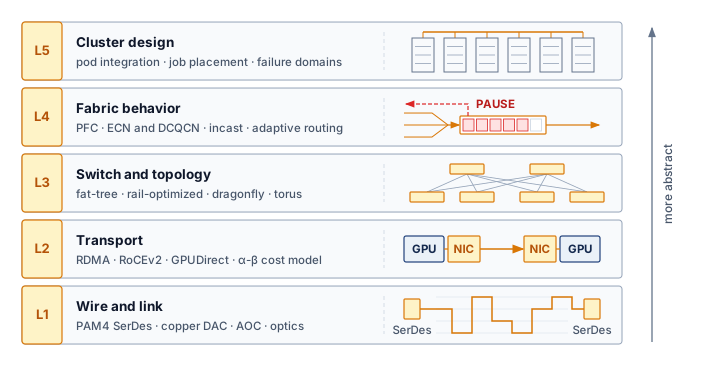
Provisioning fast NICs or buying a non-blocking switch tier in isolation routinely fails to speed up training: a 400 Gb/s link still stalls if host TCP copies starve the PCIe bus, an unaligned rack layout exhausts the copper link budget, or static ECMP hashing piles two elephant flows onto one spine port. Tracing why a collective slows down requires following the packet across five coupled layers, from serializer/deserializer (SerDes) signaling and copper or optical reach at Level 1 to the integration of a production cluster at Level 5 (figure 3). Each level is developed at the point where its physical or protocol limit becomes the binding constraint.
Figure 3: The Five-Level Network Model for ML Training: Read from the bottom up, each level builds on the one below and becomes more abstract. Level 1 moves bits over wires and optics; Level 2 turns links into reliable, low-overhead transfers between accelerators; Level 3 arranges switches into a topology; Level 4 governs how the fabric behaves under load and congestion; and Level 5 integrates all of them into a production cluster.
Each inversion of table 1 traces back to a specific physical or protocol constraint, and the five levels locate where each one is paid:
Level 1: wire and link (section 3.3). Signal integrity (PAM4, SerDes), forward error correction, and the reach of copper and optics impose hard constraints on per-hop latency and cluster geometry.
Level 2: transport (section 3.4). InfiniBand and RDMA over Converged Ethernet (RoCE) provide RDMA primitives; the \(\MessageStartupLatency\)-\(\LinkBandwidth\) model quantifies the latency-vs.-bandwidth trade-off for different message sizes.
Level 3: switch and topology (section 3.5). Fat-trees, rail-optimized designs, and dragonflies achieve the \(\BisectionBandwidth\) needed for global collectives through different structural trade-offs.
Level 4: fabric behavior (section 3.6). Link-level flow control and end-to-end congestion control determine whether theoretical bandwidth translates to realized throughput; adaptive routing and incast behavior determine whether that throughput survives real collective traffic (Alizadeh et al. 2010; Zhu et al. 2015; Li et al. 2019; Gangidi et al. 2024).
Level 5: cluster design (section 3.7). Production supercomputers like the NVIDIA SuperPOD and Meta Grand Teton integrate these layers into a unified gradient bus (NVIDIA 2023; Meta Engineering 2024).
Alizadeh, Mohammad, Albert Greenberg, David A. Maltz, Jitendra Padhye, Parveen Patel, Balaji Prabhakar, Sudipta Sengupta, and Murari Sridharan. 2010. “Data Center TCP (DCTCP).”Proceedings of the ACMSIGCOMM 2010 Conference, 63–74. https://doi.org/10.1145/1851182.1851192.
The levels are not an inventory of networking topics; they are the causal chain that turns synchronous ML traffic into infrastructure requirements. Large gradient messages first stress the wire and transport, then force topology choices that preserve bisection bandwidth, then expose congestion behavior that ordinary enterprise networks can hide, and finally determine whether the whole cluster behaves like one training machine.
The traffic pattern determines which fabric metric matters. A global reduction stresses bisection bandwidth and the slowest path; a point-to-point pipeline transfer sits on the critical path, so its full transfer time and hop count matter; an expert exchange stresses path diversity and egress balance; and checkpoint or tenant traffic stresses isolation from the synchronization path (table 2). The remaining levels develop each of these pairings in turn.
Table 2: Traffic Patterns Determine Fabric Metrics: Workload semantics translate into different physical bottlenecks, so no single link-rate benchmark predicts training performance. The table is a map of what follows; the mechanisms in its right two columns (transport offload, adaptive routing, virtual lanes, and the rest) are developed at Levels 2 through 5.
Traffic pattern
Fabric pressure
Metric that predicts performance
Primary design response
Global reduction
Sustained traffic across a cluster cut
delivered bisection bandwidth; slowest-path completion time
traffic classes (virtual lanes, QoS), admission control
Mapping workload semantics to physical constraints shows why ML fabric design must proceed from the physical layer up. Before higher-level topologies or routing protocols can organize traffic, the physical layer must reliably deliver bits between endpoints without excessive signal attenuation or prohibitive power consumption. Level 1 begins where all fabric architecture originates: at the physical wire.
Self-Check: Question
Why can standard Equal-Cost Multi-Path (ECMP) routing produce persistent hot spots when a distributed ML training job has a small number of large gradient flows?
ECMP hashes each flow to one path, so several large gradient flows can collide on one link while other equal-cost paths remain underused
ECMP introduces non-deterministic packet reordering that corrupts the internal state of GPU tensor cores
ECMP relies on centralized SDN controllers that cannot update routing tables at microsecond timescales
ECMP requires all switches in the fabric to maintain complete copies of the global model parameters
Contrast how packet loss is handled in traditional web-scale TCP/IP networks versus RDMA-based ML fabrics (such as RoCEv2), and explain why packet loss in an ML cluster can cause a large performance drop.
Arrange the five levels of the high-performance ML network fabric model in ascending order of abstraction, from physical signaling up to cluster orchestration:
Switch and Topology
Cluster Design
Wire and Link
Fabric Behavior
Transport and Performance Model
Which performance metric is the primary optimization target in an ML training network fabric, and why?
Average per-flow throughput, because web data centers maximize aggregate data volume across millions of independent users
Jitter buffer depth, because audio and video streaming protocols require bounded inter-packet arrival gaps
Maximum hop count across the core, because reducing total cable length minimizes physical fiber deployment costs
Collective completion time under load, because a Bulk Synchronous Parallel barrier waits for the last required transfer; p99 transfer latency helps characterize the tail
At 400 Gb/s and beyond, the physics of signal transmission imposes hard limits on cable length, power consumption, and error rates. Signal attenuation in copper and chromatic dispersion in fiber dictate how far an accelerator can sit from its switches before communication fails. Every higher-level protocol and topology is ultimately constrained by what the physical wire can carry; these limits shape the geometry of the entire cluster. To meet throughput demands without raising the signaling rate into worse attenuation, link designs must carry more bits in each transmitted symbol.
3.3.1 Signal integrity and PAM4
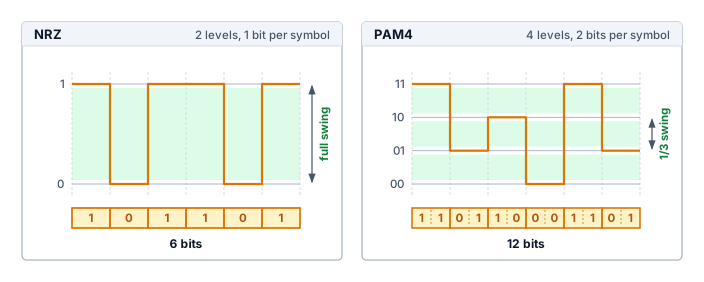
Achieving 400 Gb/s and higher line rates requires balancing signaling speed against channel loss and detection errors. The symbol rate counts transmitted symbols per second; consecutive symbols need not produce a voltage transition. Raising the symbol rate raises the frequencies the channel must carry, and copper loses more signal at higher frequencies. Carrying more bits in each symbol, by using more than two signal levels, raises the bit rate without that penalty, and PAM4 is the scheme high-speed links use to do it.
Definition 3.2: PAM4 signaling
PAM4 signaling is a modulation scheme that represents two bits per symbol with four signal levels, doubling the raw bit rate relative to binary signaling at the same symbol rate.
Significance: PAM4 increases the raw \(\Bandwidth\) available at a given symbol rate. The reduced separation between levels makes error-control design part of that gain. High-speed Ethernet uses forward error correction (FEC), including Reed-Solomon RS(544,514), with processing latency that depends on the physical-layer (PHY) design and implementation (Anslow 2016; Yin et al. 2022). FEC contributes to the fixed path budget modeled by the \(\MessageStartupLatency\) term in section 3.4.4; it is one component alongside propagation, switching, and endpoint processing.
Distinction: At equal symbol rate and voltage swing, NRZ (Non-Return-to-Zero) binary signaling carries one bit per symbol with greater separation between levels. PAM4 carries two bits per symbol with smaller level spacing; the link must compensate through its signal-quality and error-correction design.
Common pitfall: Doubling bits per symbol does not guarantee twice the usable payload throughput or a fixed latency penalty. Coding overhead, channel quality, and the chosen PHY implementation determine delivered performance.
Yin, Shuang, Xiang Zhou, and Cedric Lam. 2022. FEC Requirements for 800GbE/1.6TbE Optics: An Operator’s Perspective. IEEE 802.3df Task Force.
The price is noise margin. With four levels packed into the same voltage swing, the gap between adjacent levels in PAM4 shrinks to one third of the NRZ gap (figure 4), making the link highly susceptible to noise. Consequently, high-speed links operate near the physical limits of reliable detection and require forward error correction (FEC) at the physical layer, commonly using Reed-Solomon RS(544,514)-family codes in high-speed Ethernet designs (Anslow 2016; Ethernet Alliance 2025). FEC processing is an implementation-dependent latency term; IEEE 802.3df operator material treats roughly 100 ns of host-side FEC with the RS(544,514) code (called KP4 in the standard) and hundreds of nanoseconds of end-to-end module latency as meaningful at AI/HPC fabric timescales (Yin et al. 2022). Because each switch on a path decodes and re-encodes the signal, the FEC cost accumulates with the number of switches a packet traverses. A path’s length is its hop count, counted as switch traversals or as inter-switch links; where the two counts differ, each example states which one it uses. A packet that traverses three switches, the leaf-spine-leaf route of a two-tier fabric, incurs a scenario budget of 300 ns–600 ns of one-way FEC latency, or 600 ns–1200 ns for a round trip. Against the 350 GB gradient of the 175B job, a few hundred nanoseconds are negligible, because bulk transfers are governed by bandwidth. The cost lands instead on small, latency-bound messages, such as the control handoffs that coordinate pipeline stages, and on collectives whose many sequential steps each pay it. This physical-layer latency sets a floor on the fabric’s fixed startup latency, formalized in section 3.4.4 as the \(\MessageStartupLatency\) term, that no software optimization can remove.
Figure 4: From NRZ to PAM4 Signaling: Both panels send six symbols in the same time over the same total voltage swing. NRZ (left) uses two levels and carries one bit per symbol, 6 bits in all; PAM4 (right) uses four levels and carries two bits per symbol, 12 bits in all, doubling the data rate without raising the symbol rate. The cost is noise margin: adjacent PAM4 levels sit one third as far apart (arrows), so high-speed links need forward error correction (FEC), which adds to the fabric’s fixed \(\MessageStartupLatency\) latency.
Doubling line rate without doubling the symbol rate therefore trades signal-to-noise ratio (SNR) for bandwidth, and forward error correction is what lets the link operate that close to the channel limit. Because that tighter margin leaves less room for channel attenuation, it also shortens the distance a passive copper cable can span before the link must switch to optics.
3.3.2 Reach and medium for copper and optics
Past one to three meters, passive copper attenuates high-frequency PAM4 signals beyond what even FEC can recover, forcing any link that exits a rack onto active optical cables or pluggable optics at a steep jump in cost and power. The choice of physical medium therefore determines how far a link can reach before latency, power, and cabling budgets reshape the cluster geometry, and the recurring cable and optics options differ along exactly those attributes (table 3).
Table 3: Cable and Optics Placement Trade-Offs: Common interconnect media occupy different reach, latency, and cost points, so cluster designers use copper inside racks and optics as distance begins to dominate placement.
Medium
Reach
Cost profile
Latency impact
Typical placement
DAC (direct attach copper)
1 to 3 meters, shrinking as lane rate rises
Lowest cost (~$50) and no optical module power
Lowest media latency; no optical conversion, though high-speed lanes still pay FEC
Within a rack
AOC (active optical cable)
3 to 30 meters
Higher cost (~$500) from permanently attached transceivers (the modules that convert between electrical and optical signals)
Electrical/optical conversion adds latency on top of the forward error correction (FEC)
Rack-to-rack or row-scale links
Pluggable optics
More than 30 meters
Highest module and power cost, but replaceable optics and fiber cords
Optical conversion adds latency on top of FEC; distance enables topology reach
Network core and pod-scale links
The high-speed copper and optical paths considered here both include FEC, so choosing optics does not by itself remove error-correction overhead. The ranges in table 3 describe representative placements rather than fixed boundaries between media. Optical interconnects can extend the layout beyond a passive copper channel’s budget, while pluggable optics also permit separate replacement of modules and fiber. Reach, delivered latency, power, and serviceability jointly determine the choice.
Systems Perspective 3.2: The cost of distance
In an ML fleet, distance is money. Assuming two spine-layer optical links per accelerator, a cluster of 10,000 GPUs requires ~20,000 optical links at the spine layer alone. At $500 per complete link, that represents $10 million in cabling. For power, count one selected spine-side pluggable module per link at 20 W per module, giving 400 kW for those endpoints alone. Each optical link also has a module at its opposite end; this subtotal excludes those modules, switch electronics, and cooling, so it is not the full fabric power budget. The cost dictates cluster geometry: architects pack accelerators as densely as possible (70–100 kW per rack) to maximize cheap copper and minimize expensive optics.
3.3.3 SerDes, link budget, and power
Driving thousands of high-speed links across a cluster burns tens of kilowatts just to serialize bits onto the wire, rivaling a noticeable share of the accelerators’ own thermal budget. Every port depends on a serializer/deserializer (SerDes) circuit that converts parallel data from the switch application-specific integrated circuit (ASIC) into a serial stream, and its power cost accumulates across the provisioned ports. For the 1,024 GPUs reference cluster, assume a full-\(\BisectionBandwidth\) fabric with roughly 3,000 high-speed links across its host and switch tiers. Count one selected switch-side port per link in this power subtotal. Each counted 400 Gb/s port is assigned 25 W, more than the 20 W pluggable-module figure in the cost-of-distance estimate because it also counts the switch-side SerDes that drives the module. The model totals 75 kW, equivalent to 10.5 percent of the accelerators’ combined thermal design power. This comparison isolates the assumed power of the selected switch-side ports, excluding the opposite endpoints and the rest of the switch chassis; it does not establish total fabric power or the fraction of measured cluster energy consumed by networking.
The link budget allocates the signal loss a path can tolerate while meeting its error target. Losses are counted in decibels (dB), a logarithmic power ratio in which every 10 dB is a further tenfold attenuation (3 dB is roughly a halving), so the losses of cables and connectors in series add directly. In this simplified accounting, a lane has a 30 dB allowance. A 3-meter DAC cable contributing 18 dB of loss and connectors contributing 2 dB leave 10 dB of margin. Higher signaling frequencies increase copper loss, so preserving reach can require more signal conditioning, a different cable, or optics. Aggregate port speed alone does not determine cable reach; lane rate, channel construction, and active components matter. The design must meet both the signal-quality target and the power budget before the transport layer can rely on the link.
Self-Check: Question
What is the primary physical trade-off introduced by adopting PAM4 (Pulse Amplitude Modulation 4-level) instead of NRZ (Non-Return-to-Zero) signaling in \(400\text{ Gb/s}\) and \(800\text{ Gb/s}\) network fabrics?
PAM4 triples the baud rate on the physical wire but eliminates the need for receiver equalization
PAM4 doubles the data rate per symbol by using four voltage levels, but the reduced noise margin requires Forward Error Correction (FEC) with an implementation-dependent latency cost
PAM4 replaces electrical copper signaling with optical coherent modulation, restricting maximum cable length to under \(50\text{ cm}\)
PAM4 eliminates link-level bit errors entirely, removing the need for physical layer error detection at the cost of doubling SerDes power consumption
Why can increasing per-lane signaling rate shorten passive Direct Attach Copper reach, and how should the resulting link budget constrain AI rack design?
In a modern multi-thousand GPU cluster using \(400\text{ Gb/s}\) pluggable optical transceivers, why is transceiver power consumption a critical design constraint at the facility level?
Pluggable transceivers require cryogenic cooling to prevent optical fiber dispersion
Optical transceivers consume no power during active data transfer but draw high surge currents during idle states
Counting one selected spine-side module on each of 20,000 links at \(20\text{ W}\) per module gives a \(400\text{ kW}\) endpoint subtotal, before opposite-end modules and other fabric power
Optical modules dissipate heat directly into the switch ASIC die, reducing switch processing clock frequencies by \(50\%\)
True or False: Direct Attach Copper (DAC) cables introduce higher propagation and serialization latency than Active Optical Cables (AOC) over a 2-meter intra-rack link because copper has higher electrical resistance than optical fiber.
Large-scale training requires sustained, synchronized bulk transfers. A single AllReduce across 1,024 GPUs forwards every worker’s contribution through many links in lockstep. This pattern favors RDMA transport offload, reliable completion, and bounded loss-recovery time. A physically lossless fabric is one way to make that performance predictable, but it is not the only design.
3.4.1 RDMA and GPUDirect
A conventional kernel TCP path charges the host for every byte it moves. Interrupt processing, protocol work, and payload copies consume CPU cycles and memory bandwidth that the training process also needs for data loading and preprocessing, and the charge grows with aggregate I/O as many streams or NICs drive a host at 400 Gb/s link rates. Modern TCP stacks reduce the charge with segmentation offload, receive-side scaling, zero-copy interfaces, and careful non-uniform memory access (NUMA) placement, so a single stream need not exhaust a server’s memory bandwidth. They do not remove it, and the contention becomes harder to provision predictably as nodes add NICs.
Definition 3.3: Remote direct memory access (RDMA)
Remote direct memory access (RDMA) is a networking technology that offloads transport processing to network interface hardware, allowing access to registered remote memory without per-transfer kernel processing of the payload.
Significance: RDMA can reduce end-to-end message latency from tens of microseconds for a kernel TCP path to low-single-digit microseconds on a tuned fabric, shrinking the fixed startup cost that every message adds to the Fleet Law’s communication term \(\CommunicationTime(\DeviceCount)\).
Distinction: Unlike a conventional kernel TCP path, RDMA offloads transport processing to NIC hardware and permits user-space access to registered memory. The resulting CPU-core and memory-bandwidth savings depend on the host, NIC, I/O path, message size, and software configuration rather than on link rate alone.
Common pitfall: RDMA is an access and offload model, not one loss-recovery algorithm. Reliable InfiniBand and RoCE transports detect loss and retransmit (InfiniBand Trade Association 2000). Some RNIC generations use the Go-Back-N-style recovery noted with the loss inversion, which makes a drop expensive (section 3.4.3 quantifies the cost), while other designs support stronger selective recovery or tolerate lossy Ethernet without the link-layer pause mechanism (priority flow control) that many RoCE deployments rely on (Mittal et al. 2018). The requirement is reliable completion with a recovery tail that the synchronized workload can tolerate, not a physically lossless Ethernet fabric in every implementation.
3GPUDirect RDMA: Introduced by NVIDIA for Kepler-class GPUs and CUDA 5.0, GPUDirect RDMA enables a direct PCIe path between GPU memory and third-party peer devices such as network interfaces (NVIDIA 2026b). Before GPUDirect, every gradient transfer had to stage through host memory, consuming CPU memory bandwidth that competes with data loading. Eliminating this bounce path is one reason overlapping communication with backward-pass computation is feasible at scale.
NVIDIA. 2026b. GPUDirectRDMA.
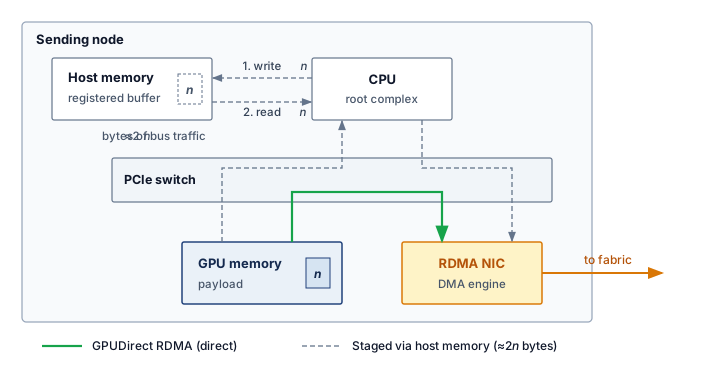
RDMA bypasses the kernel data path. Offloading transport logic to the NIC allows applications to read and write registered remote memory without per-message kernel intervention. For ML, GPUDirect RDMA,3 the path that dense nodes pair with one NIC per GPU (Dense node designs), extends this principle to accelerator memory (NVIDIA 2026b). Within a sending node (figure 5), GPUDirect RDMA routes an \(\PointToPointMessageSize\)-byte payload (what one participant sends, not the model-wide gradient state) along the solid green peer-to-peer path through the PCIe switch straight to the RDMA NIC, bypassing host memory entirely. Without this direct memory access (DMA) bypass, the dashed gray staging path must first copy \(\PointToPointMessageSize\) bytes from GPU memory into a registered host-memory buffer and subsequently read \(\PointToPointMessageSize\) bytes out to the NIC, generating roughly \(2\PointToPointMessageSize\) bytes of redundant host-memory bus traffic. The network still transfers the payload, and the PCIe path may comprise multiple DMA transactions; the optimization removes staging copies rather than collapsing the transfer into one transaction.
Figure 5: GPUDirect RDMA Data Path: Without GPUDirect (dashed), a sending node first writes the \(\PointToPointMessageSize\)-byte payload from GPU memory into a registered host-memory buffer and the NIC then reads it back out, about \(2\PointToPointMessageSize\) bytes of host-memory traffic per payload. With GPUDirect RDMA (solid), the NIC reads GPU memory directly over the PCIe peer-to-peer path, so the host-memory bounce disappears.
3.4.2 InfiniBand and RoCE
GPU clusters commonly choose between two RDMA transport stacks, and the decision is a reliability-versus-operations trade-off. Both stacks must keep switch buffers from overflowing under synchronized bursts, and they do so in different places. InfiniBand uses credit-based flow control. Each receiver advertises its free buffer space to the sender at the other end of the link in units called credits, and the sender transmits only into space that has been advertised. A buffer therefore cannot overflow; congestion appears as senders waiting for credits rather than as dropped packets. Ethernet was designed to drop packets when buffers fill, so RoCE deployments that want the same behavior add two mechanisms. Priority flow control (PFC) lets a filling switch port send a PAUSE frame that stops its upstream neighbor for one traffic class, and explicit congestion notification (ECN) marks packets that pass through a filling queue so that their senders slow down before a pause is needed. InfiniBand thus builds losslessness into the link layer, while RoCE assembles it from switch configuration and end-to-end congestion control (table 4); section 3.6.1 develops PFC’s failure modes.
Table 4: RDMA Transport Stack Trade-Offs: InfiniBand and RoCE expose RDMA semantics through different operational contracts, one built around native losslessness and the other around Ethernet compatibility.
Stack
Fabric behavior
Operational burden
Typical fit
InfiniBand (IB)
Purpose-built HPC switched fabric (InfiniBand Trade Association 2000) with credit-based flow control, so losslessness is native at the link layer
a central subnet manager computes routes, and virtual lanes (VLs), separate buffer and credit pools on one link, isolate traffic
Dedicated training clusters where predictable tail latency outweighs Ethernet ecosystem flexibility
RoCE (RDMA over Converged Ethernet)
RoCEv2 carries RDMA semantics by encapsulating InfiniBand transport headers in UDP/IP packets
PFC-based deployments suppress loss with PFC, ECN, and routing policy (Guo et al. 2016; Gangidi et al. 2024); PFC-free designs instead place more burden on end-to-end congestion control and loss recovery (Mittal et al. 2018)
Multi-vendor Ethernet fleets that can absorb more congestion-control tuning
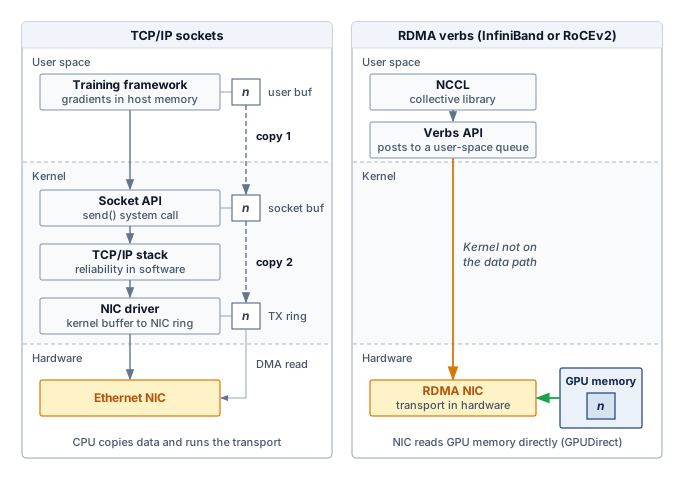
The InfiniBand4 row reflects a protocol heritage that favors hardware-managed losslessness over Ethernet compatibility, and this architectural choice is visible at the protocol boundary. Figure 6 partitions the protocol stack across user-space, kernel, and hardware bands, contrasting traditional socket overhead against direct verbs hardware offload. While the conventional copied TCP/IP path illustrated on the left uses two software copies across kernel buffer boundaries and software protocol execution, the RDMA stack (right) traces a single amber bypass arrow straight from the collective communication library (such as the NVIDIA Collective Communications Library, or NCCL) and the user-space verbs API to the RDMA NIC, keeping the operating system entirely off the active data path.
4InfiniBand: Formed in 1999 from the merger of two competing server I/O standards (Future I/O and NGIO), InfiniBand was originally designed to replace PCI as a general-purpose system interconnect. Its pivot to HPC networking preserved the credit-based, hardware-managed flow control that server I/O demanded, and that heritage is why InfiniBand provides native losslessness without the PFC fragility of Ethernet-based RDMA fabrics.
Figure 6: Traditional TCP/IP vs. RDMA Verbs Stacks: Read each stack top to bottom through the user-space, kernel, and hardware bands. In the illustrated copied TCP/IP socket path (left), a send enters the kernel through a system call, the payload is copied into kernel socket buffers and again toward the NIC’s transmit ring, and the CPU runs the transport protocol in software. With RDMA verbs over InfiniBand or RoCEv2 (right), the collective library posts work requests from user space, the kernel stays off the data path, and the RDMA NIC runs the reliable transport in hardware, reading GPU memory directly through GPUDirect instead of staging a host copy.
3.4.3 Reliable delivery and loss recovery
By routing the user-space verbs API directly to hardware (figure 6), the architecture decouples collective library calls from the operating system, leaving the transport hardware and fabric to arbitrate reliable delivery and packet loss. Reliable connected transports in both InfiniBand and RoCE detect loss and retransmit (InfiniBand Trade Association 2000); credits and PFC exist to make that retransmission rare (Guo et al. 2016; Gangidi et al. 2024). Losslessness is therefore a deployment contract rather than a property of RDMA as a family. Designs that operate over lossy Ethernet without PFC shift more responsibility to endpoint congestion control, packet reordering, and selective recovery (Mittal et al. 2018).
Recovery granularity therefore matters. On an RNIC with Go-Back-N-style recovery and no out-of-order retention, a lost packet invalidates every packet that arrives after it, and the sender must retransmit from the missing sequence point. The penalty is everything the sender transmitted between the lost packet and the moment it learned of the loss, so it equals link rate times detection delay. If the receiver’s negative acknowledgment reaches the sender after one 5 μs round trip, a sender at 50 GB/s has meanwhile sent 250 KB, all of which it must send again; a drop 900 MB into a 1 GB transfer wastes that window, not the 900 MB already delivered. When detection instead waits for a retransmission timeout, the delay, and with it the resent window, grows with that timeout. An RNIC with selective recovery retransmits only the missing packets, so the same physical loss produces a shorter tail (Mittal et al. 2018). Because the window is line rate times detection delay, resending it takes about as long as detecting the loss did, so a faster link resends more bytes per drop without shortening the stall. Either way the stall spans many packet wire times, and a synchronous collective exposes the slowest recovery to every waiting worker. Fabric designers can reduce that tail by suppressing drops with PFC, by using a loss-tolerant transport with bounded endpoint recovery, or by combining congestion control and admission policy so queues rarely overflow. Each choice moves state and failure modes between switches and endpoints.
3.4.4 The \(\MessageStartupLatency\)-\(\LinkBandwidth\) performance model
Protocol choice determines how the fabric provides reliable completion and bounds loss-recovery time; performance modeling then asks how fast it can carry a given message. The \(\MessageStartupLatency\)-\(\LinkBandwidth\) model (principle 5) decomposes message transfer time as \(\PointToPointTransferTime(\PointToPointMessageSize) = \MessageStartupLatency+ \PointToPointMessageSize/\LinkBandwidth\), where \(\PointToPointMessageSize\) is the message size in bytes, \(\MessageStartupLatency\) is the fixed startup latency, and \(\LinkBandwidth\) is the sustained bandwidth in bytes per unit time (Hockney 1994). The physical topology influences both parameters through path length and available capacity. A collective built from many sequential rounds of messages pays \(\MessageStartupLatency\) once per round, so its startup cost can grow with the number of participants even when the underlying fabric provides short physical paths.
Hockney, Roger W. 1994. “The Communication Challenge for MPP: Intel Paragon and Meiko CS-2.”Parallel Computing 20 (3): 389–98. https://doi.org/10.1016/s0167-8191(06)80021-9.
↪ The same decomposition, multiplied by each schedule’s round count and traffic factor, is developed for collective algorithms in Pricing Collectives by Rounds and Chunks.
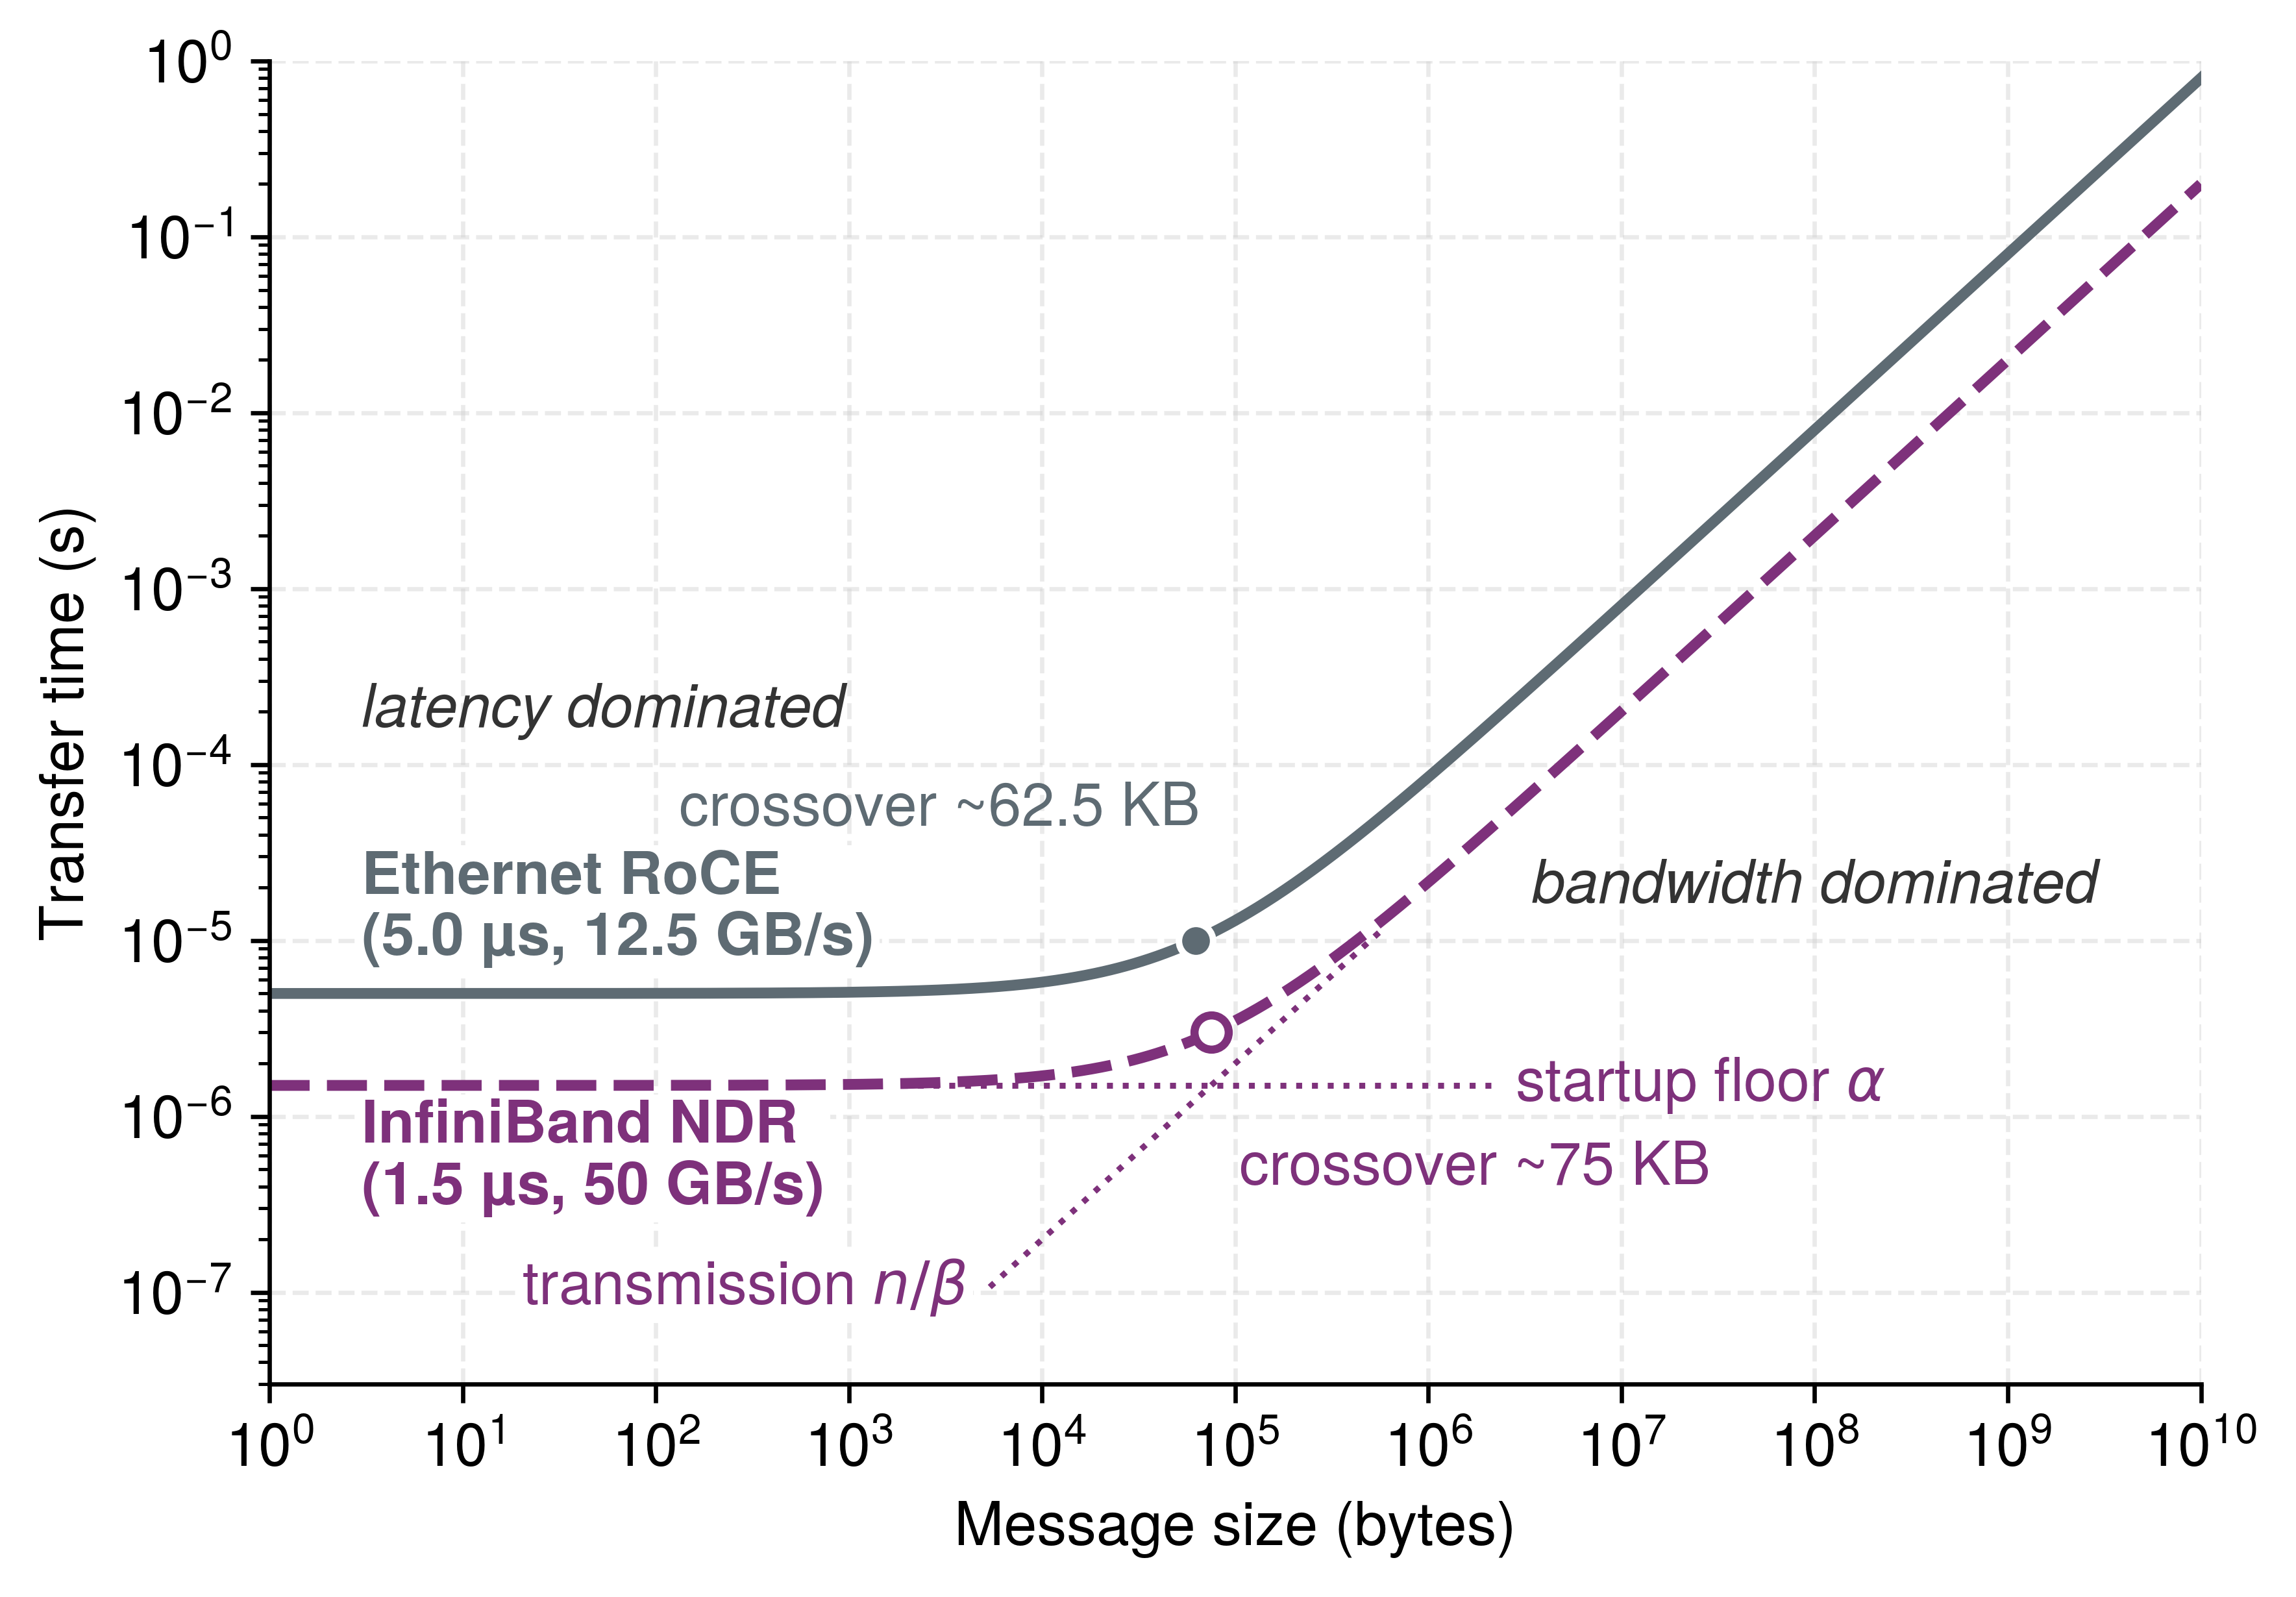
The model reveals two regimes that call for different engineering responses. When \(\PointToPointMessageSize< \MessageStartupLatency\LinkBandwidth\), the startup cost \(\MessageStartupLatency\) exceeds the transmission cost, placing small control messages deep in the latency-bound region, whereas when \(\PointToPointMessageSize> \MessageStartupLatency\LinkBandwidth\), the \(\PointToPointMessageSize/\LinkBandwidth\) term dominates and large gradient transfers sit deep in the bandwidth-bound region. Near the crossover both terms matter, and where a collective lands also depends on how its algorithm divides the payload into messages and schedules them across rounds.
↪ The crossover message size that separates the latency-dominated and bandwidth-dominated regimes, with a worked InfiniBand NDR example, is developed in Latency-dominated vs. bandwidth-dominated regimes.
For the modeled NDR InfiniBand path with \(\MessageStartupLatency=\) 1.5 μs and \(\LinkBandwidth=\) 50 GB/s, the crossover point \(\LatencyBandwidthCrossoverSize = \MessageStartupLatency\cdot \LinkBandwidth\approx\) 75 KB. Measured startup latency and delivered bandwidth vary with the NIC, switch path, software stack, and contention, so these parameters describe a scenario rather than a protocol constant. Far below the crossover, more bandwidth removes only a small part of transfer time; far above it, lower startup latency removes only a small part. Shorter paths can lower \(\MessageStartupLatency\), while additional delivered path bandwidth raises \(\LinkBandwidth\); their value depends on the message sizes the workload actually exchanges.
Napkin Math 3.1: The alpha-beta crossover
Problem: A fabric designer is comparing a modeled InfiniBand NDR path (1.5 μs, 50 GB/s) against a modeled RoCE path over slower Ethernet (5 μs, 12.5 GB/s). The comparison deliberately bundles a higher-latency stack with a slower link, so a third path, RoCE on a 400 Gb/s link, separates the two effects. For a 4 KB control message and a 350 MB gradient shard, which part of \(\PointToPointTransferTime(\PointToPointMessageSize)=\MessageStartupLatency+\PointToPointMessageSize/\LinkBandwidth\) dominates, and why does the first path help for different reasons in each regime?
Math: Apply \(\PointToPointTransferTime(\PointToPointMessageSize) = \MessageStartupLatency+ \PointToPointMessageSize/\LinkBandwidth\) for a 4 KB control message and a 350 MB gradient shard.
Result: Under these assumed path parameters, the NDR path is 3.4× faster because its modeled \(\MessageStartupLatency\) is lower.
Large message (350 MB):
InfiniBand: \(\PointToPointTransferTime= \MessageStartupLatency+ \PointToPointMessageSize/\LinkBandwidth=\) 7.0 ms
RoCE (100G): \(\PointToPointTransferTime= \MessageStartupLatency+ \PointToPointMessageSize/\LinkBandwidth=\) 28.01 ms
Result: Under these assumed path parameters, the NDR path is 4× faster because its modeled \(\LinkBandwidth\) is higher. That factor is the ratio of the two line rates, so it measures the faster link rather than the transport.
Same line rate (RoCE at 400 Gb/s, RoCE \(\MessageStartupLatency\)):
Small message: 5.08 μs, still 3.2× the NDR time, because \(\MessageStartupLatency\) alone separates the stacks.
Large message: 7.0 ms, essentially the NDR time, because at equal \(\LinkBandwidth\) nothing but a few microseconds of \(\MessageStartupLatency\) separates them.
Systems insight: This scenario places the crossover \((\LatencyBandwidthCrossoverSize = \MessageStartupLatency\LinkBandwidth)\) near 75 KB. Because gradients are megabytes to gigabytes, their transfers are usually bandwidth dominated, whereas pipeline coordination can remain latency dominated. A higher line rate produces little benefit for a message whose startup term dominates; transport processing, topology, and hop count then govern the improvement.
In the 175B training job, a 4 KB control message, such as the notification that tells a pipeline stage its next microbatch is ready, costs \(\PointToPointTransferTime(\PointToPointMessageSize) \approx\) 1.58 μs, with bandwidth contributing only 5.1 percent of the total. Faster links therefore offer little benefit for this handoff. A 350 MB gradient shard, roughly the share of the 350 GB gradient that each of the 1,024 GPUs owns when a reduction partitions it across the whole cluster, costs \(\PointToPointTransferTime(\PointToPointMessageSize) \approx\) 7.0 ms; doubling bandwidth to 100 GB/s would approximately halve its transfer time.
Across the full range of message sizes, each path traces a flat latency-dominated plateau that bends into a linear bandwidth-dominated regime (figure 7). On the modeled NDR path, the knee at 75 KB marks where transmission time overtakes the 1.5 μs startup latency; the 100 Gb/s RoCE path sits on a higher floor of 5 μs and bends near 62.5 KB. The exact positions reflect the assumed \(\MessageStartupLatency\) and \(\LinkBandwidth\) scenario parameters rather than invariant protocol constants. On both paths, startup latency governs sub-kilobyte control handoffs, whereas multi-megabyte gradient shards sit well inside the bandwidth-bound regime.
Figure 7: The \(\MessageStartupLatency\)-\(\LinkBandwidth\) Crossover: Modeled transfer time as a function of message size for an NDR InfiniBand path and a 100 Gb/s RoCE baseline using the scenario parameters in the text. Small messages are latency dominated (flat region), while large messages are bandwidth dominated (linear region); on the InfiniBand path the dotted asymptotes show the knee sitting where the two terms are equal. Measured crossover points vary with the end-to-end path.
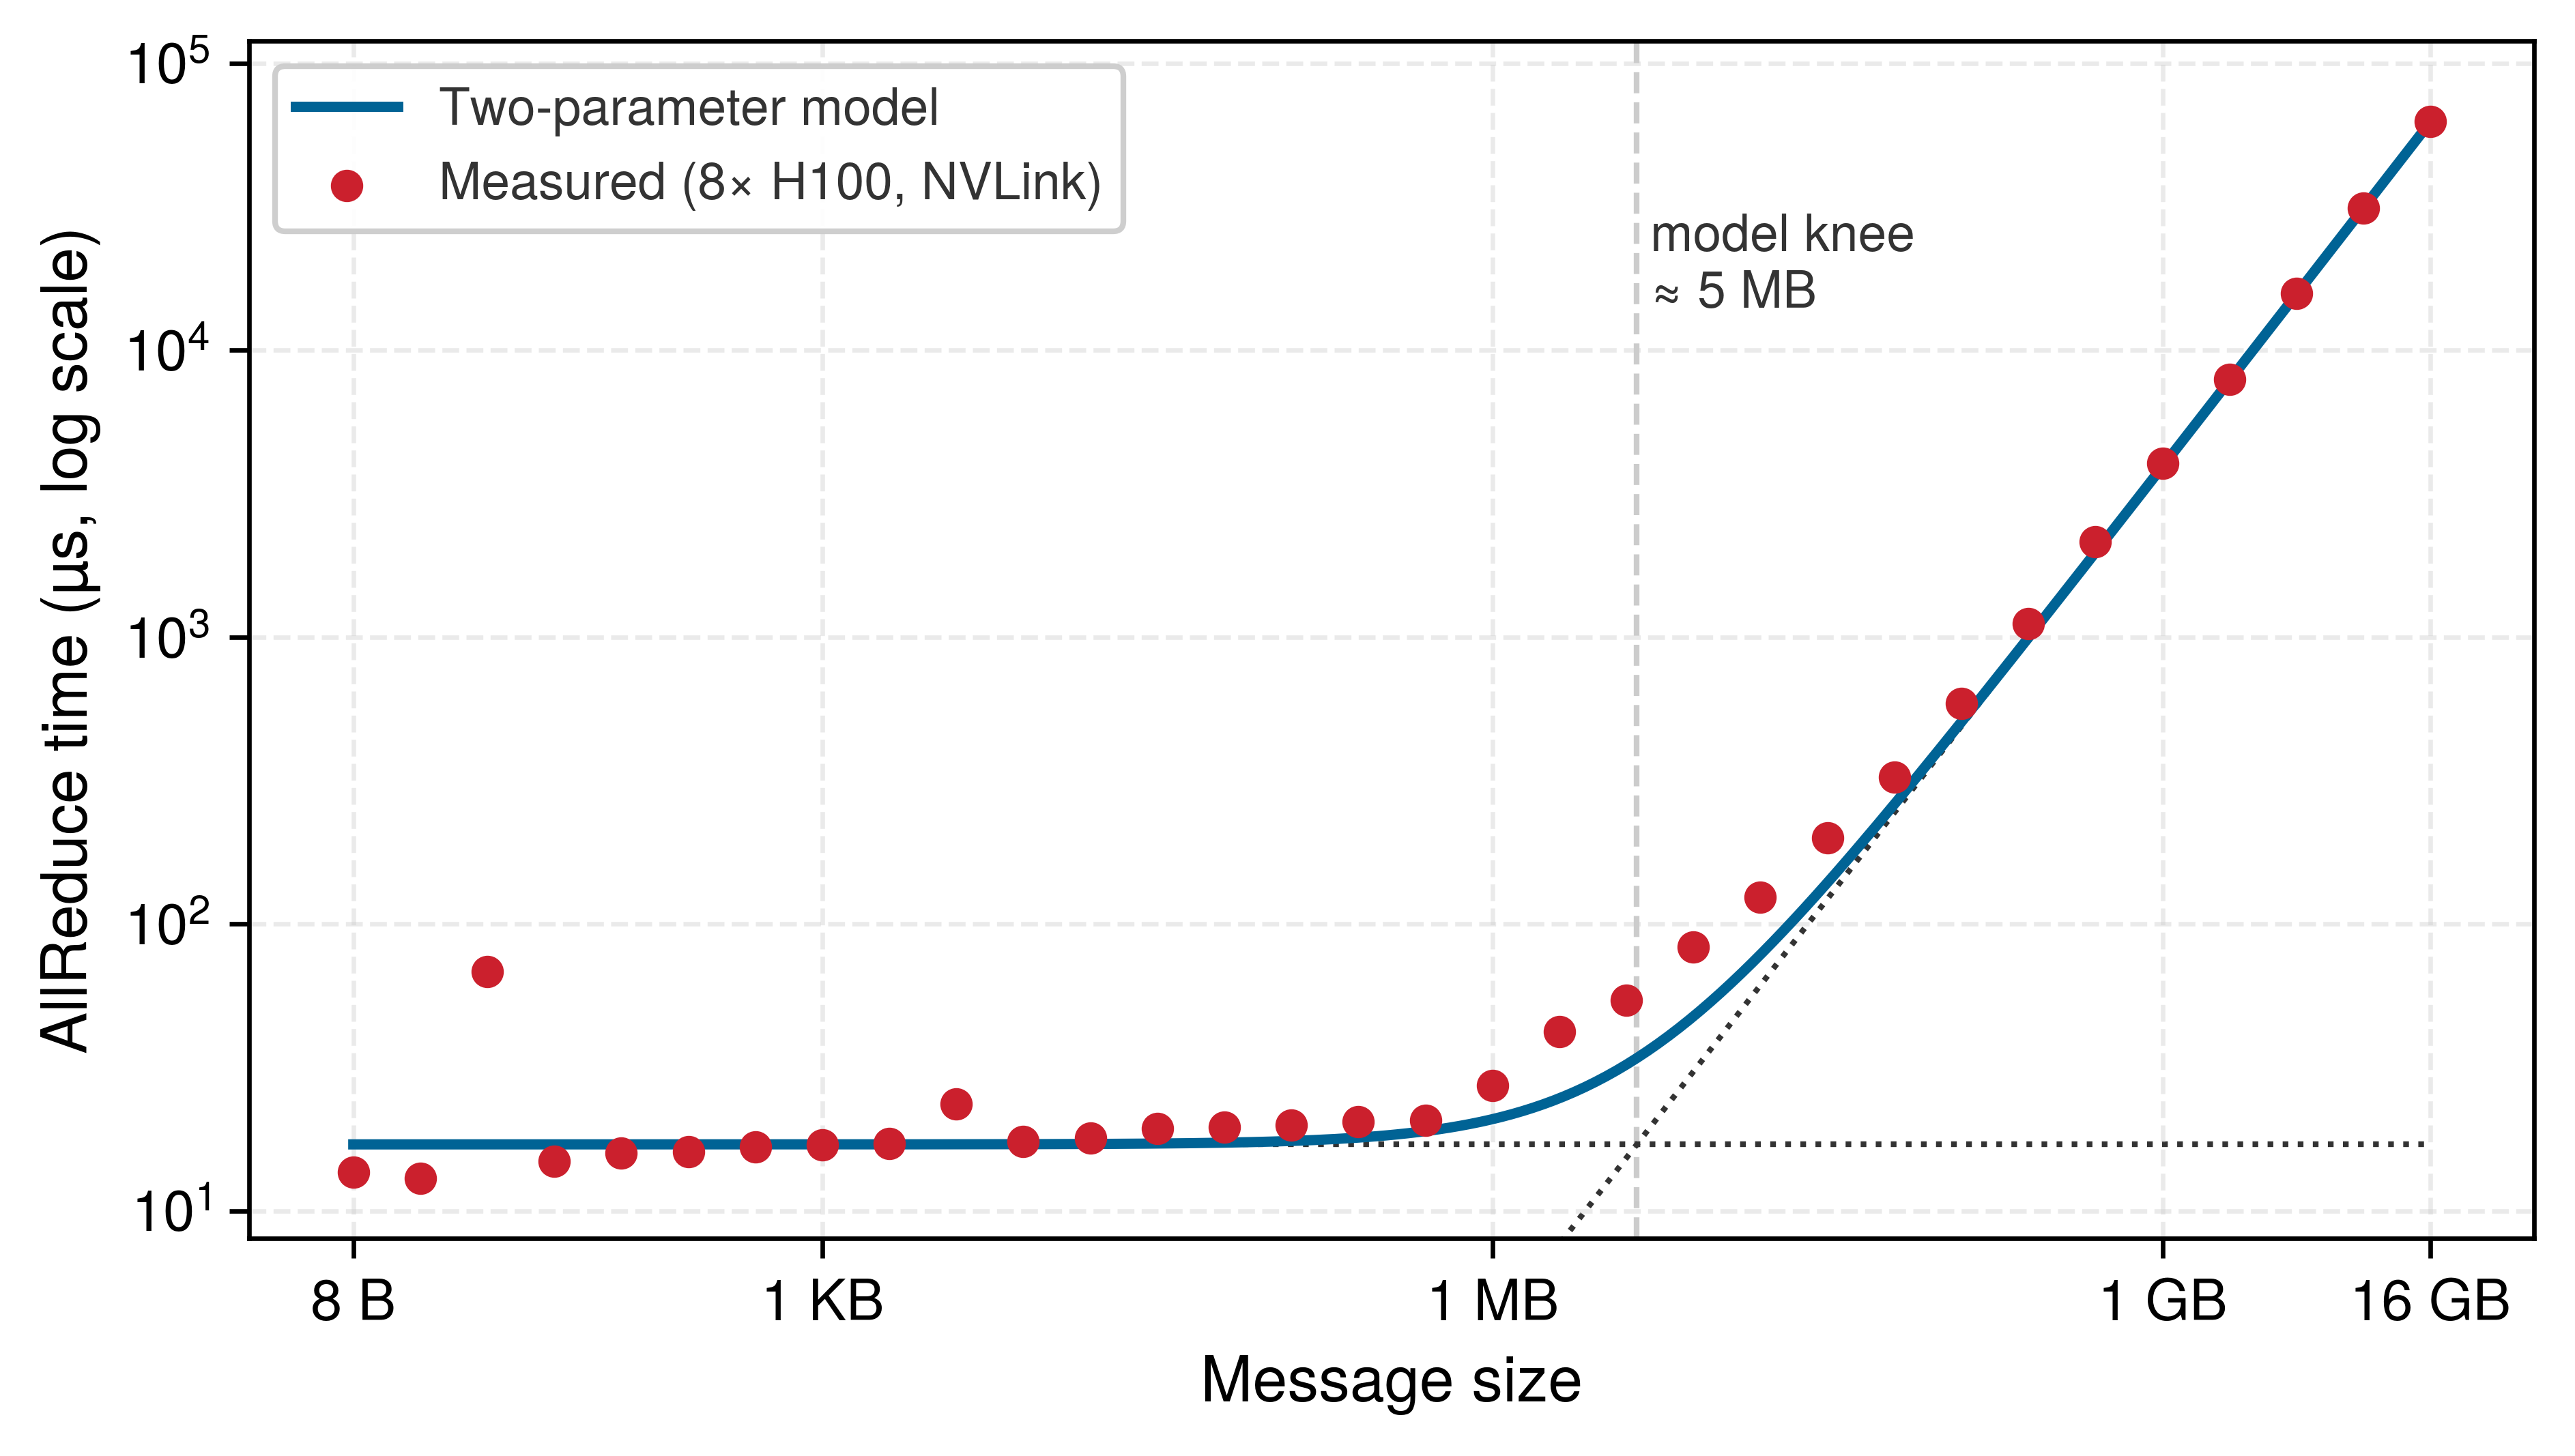
A measured collective shows both regimes and where the two-parameter model needs care. NVIDIA publishes the full output of the standard NCCL AllReduce benchmark on one node of eight H100 GPUs connected by NVLink, sweeping message sizes from 8 bytes to 16 GB (NVIDIA 2026a). The two-parameter model can be built from two summary values of that sweep, the median time of the small messages as \(\MessageStartupLatency\) and the delivered rate of the largest message as \(\LinkBandwidth\), and set beside the measured time (figure 8). The small messages sit on a floor of about 17 µs regardless of size, and the largest messages approach 274 GB/s of algorithm bandwidth (480 GB/s of bus bandwidth, the benchmark’s hardware-normalized rate). Between the two, the model places the knee near 5 MB, but the measured time runs up to 1.7× the model’s prediction for messages of 8 to 128 MB, where the delivered bandwidth is still ramping toward its peak. The model is therefore close at the two ends and optimistic in the middle, and that middle range is where the gradient buckets of data-parallel training often fall.
Figure 8: Measured AllReduce Time against the Two-Parameter Model: NCCL AllReduce time on one node of eight H100 GPUs over NVLink for message sizes from 8 bytes to 16 GB, on logarithmic axes (points), with the two-parameter model built from the measured small-message floor and the largest message’s delivered bandwidth (solid line) and its two asymptotes (dotted). The model is close at both ends; between roughly 1 MB and 1 GB the measurement runs above it. One early small-message point is a timing outlier. Data from NVIDIA (2026a); whether NVLink SHARP was enabled for this run is not stated.
Consider the 175B job on the 1,024-GPU reference cluster. Its gradient exchanges move messages of hundreds of megabytes, while its pipeline stages coordinate through frequent control messages of a few kilobytes.
Beyond classifying individual transfers, the same model identifies when communication overtakes computation. A ring AllReduce passes chunks around a logical cycle of participants, in a ReduceScatter phase and then an AllGather phase, with no requirement that the physical switches form a ring. The scaling laws that push training toward more parameters (AI Scaling Laws) enlarge, in direct proportion, the gradient that every data-parallel step must reduce, and the \(\MessageStartupLatency\)-\(\LinkBandwidth\) cost of each transfer, multiplied by the ring’s round count and traffic factor, decides when that collective outlasts the step’s computation and the network becomes the pacing constraint for the entire job.
↪ The ring AllReduce derivation, and the schedules that compete with it, are developed in Ring AllReduce.
The \(\MessageStartupLatency\)-\(\LinkBandwidth\) model quantifies the speed of a single link, but the 175B-parameter model requires 1,024 GPUs to work in concert. Scaling these transport primitives from a pair of nodes to a warehouse-scale supercomputer demands a network topology: a specific pattern of connections that maximizes \(\BisectionBandwidth\) while minimizing the hop count and cabling cost for global collective operations.
Self-Check: Question
How does GPUDirect RDMA optimize the end-to-end data path during a multi-node AllReduce gradient exchange compared to traditional host-staged network transfers?
It allows the network interface card (NIC) to read and write GPU High Bandwidth Memory directly over the PCIe bus without staging data through host CPU system RAM
It compresses floating-point tensors in GPU L2 cache before writing them directly to the optical switch buffer
It enables the GPU to execute TCP/IP checksum offloading in CUDA streaming multiprocessors
It re-routes inter-node gradient traffic over host SATA storage buses to bypass network switch congestion
An engineer observes that upgrading network links from \(200\text{ Gb/s}\) (HDR) to \(400\text{ Gb/s}\) (NDR) reduces the transfer time of a \(10\text{ KB}\) pipeline control message by only about \(11\%\), whereas the same upgrade halves the transfer time of a \(350\text{ MB}\) gradient tensor. How does the \(\alpha\)-\(\beta\) performance model explain this discrepancy?
Switch routing tables drop small packets more frequently than large packets due to flowlet timeouts
High-bandwidth optical transceivers disable forward error correction for messages larger than \(1\text{ MB}\)
PCIe bus arbitration introduces dynamic power throttling on transfers smaller than \(64\text{ KB}\)
The \(10\text{ KB}\) message falls below the crossover point (\(n^* = \alpha\beta \approx 75\text{ KB}\)), where fixed startup latency \(\alpha\) dominates, while the \(350\text{ MB}\) message is in the bandwidth-dominated regime (\(n \gg n^*\))
Given an InfiniBand fabric with startup latency \(\alpha = 1.5\,\mu\text{s}\) and bandwidth \(\beta = 50\text{ GB/s}\), calculate the crossover message size \(n^*\). Explain what architectural changes can reduce transfer time for messages below \(n^*\).
On an RNIC that discards out-of-order arrivals rather than retaining them, ______ recovery retransmits from the missing sequence point after packet loss.
True or False: InfiniBand and RoCEv2 achieve losslessness through identical mechanisms because both protocols expose the standard user-space Verbs API to the application.
A cluster can have thousands of fast links at the edge and still starve its AllReduce operations if the cross-sectional capacity at the narrowest point in the switching hierarchy is insufficient. The physical arrangement of switches determines whether that cross-section throttles collective communication or sustains full line-rate exchange across all participating workers. Two properties govern this capability: bisection bandwidth \(\BisectionBandwidth\) and whether the fabric is non-blocking, a constraint captured by the bisection bandwidth theorem (principle 6). Bisection bandwidth quantifies the worst-case throughput ceiling that the topology imposes on global collectives.
Definition 3.4: Bisection bandwidth
Bisection bandwidth is a network topology metric defined as the minimum aggregate link capacity crossing any partition that divides the cluster into two equal halves, representing the worst-case throughput ceiling for traffic that must cross that partition, including global collectives.
Significance: Bisection bandwidth \(\BisectionBandwidth\) directly sets the cluster-scale bandwidth ceiling for global synchronization. A 1,024-GPU fat-tree with 400 Gb/s links at 1:1 subscription provides \(\text{BW}_{\text{bisect}} = 512 \times 50\,\text{GB/s} = 25.6\,\text{TB/s}\) per direction; a 4:1 oversubscribed spine reduces this to 6.4 TB/s, increasing the transfer-time lower bound for a fixed cut-crossing payload by 4×. Actual AllReduce slowdown depends on rank placement, the collective schedule, and which links are saturated.
Distinction: Unlike aggregate bandwidth (the sum of all edge link speeds, which can be high even in a poorly connected topology), \(\BisectionBandwidth\) measures global connectivity. A star topology with 1,000 edge links all meeting at one central switch has high aggregate bandwidth but \(\BisectionBandwidth\) limited by that switch’s backplane capacity.
Common pitfall: A frequent misconception is that adding more leaf switches always increases \(\BisectionBandwidth\). In a three-tier fat-tree, oversubscribing the spine layer (giving each spine switch fewer uplinks to the core than downlinks to its leaves) reduces \(\BisectionBandwidth\) below the edge-link total regardless of how many leaf switches are present.
ML training includes global collectives and AllToAll phases that can drive traffic across topology partitions, making full \(\BisectionBandwidth\) a useful capacity target. A smaller cut becomes a bottleneck when the workload’s crossing traffic exceeds what it can deliver within the communication budget, and rank placement together with the collective schedule determines how much traffic crosses that cut.
Bisection bandwidth measures cut capacity; a non-blocking fabric provides paths that can sustain simultaneous input-output pairings at line rate with suitable routing. Full \(\BisectionBandwidth\) and balanced uplink capacity support that goal, but routing must also spread traffic across the available paths. In the oversubscribed designs considered here, reducing a cut’s capacity reduces its effective \(\BisectionBandwidth\), increasing the transfer-time bound for a fixed payload that saturates it, whereas a collective that keeps most traffic within each half need not experience the same slowdown.
↪ A slower cut lengthens the training step only when the extra transfer time cannot hide behind computation. The communication-to-compute diagnostic that tests this is developed in Compute \cap communication.
Definition 3.5: Non-blocking fabric
Non-blocking fabric is a network with sufficient internal path capacity to support any permutation of input-output port pairs simultaneously at full line rate under a suitable routing assignment.
Significance: In ML fleets, a non-blocking fabric can support full-rate permutation traffic with suitable routing, preserving the available \(\BisectionBandwidth\) term for global collectives. A 2:1 oversubscribed spine halves the effective \(\BisectionBandwidth\), doubling the communication time when that cut is the saturated bottleneck and dropping scaling efficiency \(\ScalingEfficiency\) accordingly. In a scenario workload assumed to spend 30 percent of each step communicating, doubling that share while the computation share stays fixed lengthens each step, and the longer step costs roughly 23.1 percent of total cluster throughput. This definition uses 2:1, a common data-center compromise, whereas the bisection definition above and notebook 3.2 use 4:1, a cost-optimized spine; the notebook writes out the throughput formula behind both results.
Distinction: The guarantee concerns a permutation, in which each input and output belongs to one pairing. It does not promise full line rate from every sender to every receiver at once, nor does it make an arbitrary routing assignment free of contention.
Common pitfall: A frequent misconception is that non-blocking means zero congestion. Endpoint congestion (incast) can still occur if multiple senders simultaneously target the same receiver port, regardless of how much internal fabric capacity is available.
Fat-trees build on Clos-style non-blocking network principles to supply full \(\BisectionBandwidth\)(Clos 1953), rail-optimized networks trade some global routing flexibility for lower cabling cost, and dragonfly topologies reduce optical link counts while introducing workload-placement constraints (Kim et al. 2008). This trade-off between guaranteed bisection bandwidth and cabling cost drives every topology decision in large-scale ML clusters, as the comparisons in section 3.5.2, section 3.5.3, and section 3.5.4 show.
3.5.1 Top-of-rack (ToR) and the failure domain
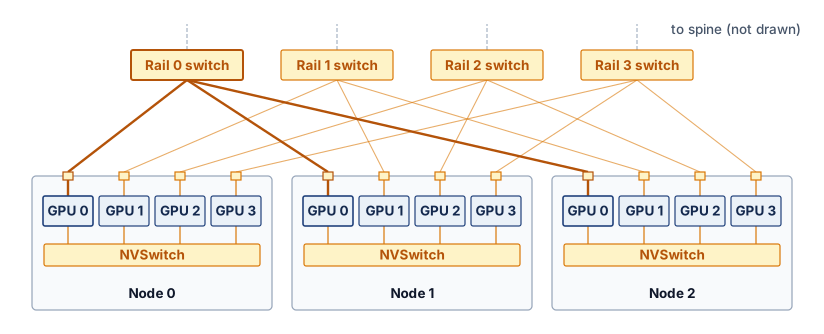
The top-of-rack (ToR) switch aggregates traffic and so becomes a shared failure domain, one level of the physical hierarchy defined in Node health and reliability. Consider a rack containing four nodes with eight GPUs each. If all 32 accelerators depend on one ToR with no alternate path, losing that switch disconnects them from the rest of the job, and recovery then depends on available paths, surviving state, and the job’s recovery policy. This one-switch-per-rack wiring is the simpler baseline used here to teach radix and failure domains; the reference cluster itself wires each GPU to a rail switch, a layout developed in section 3.5.3 that reshapes the failure domain, because losing one rail switch cuts one GPU in each of many nodes rather than every GPU in one rack.
The switch radix,5 its number of ports, determines how many endpoints and uplinks it can connect. In the reference allocation, a 64-port switch assigns 32 ports to servers, one for each of 32 GPUs, and 32 ports to the spine. With equal port rates, the 1:1 ratio avoids oversubscription at that boundary; delivered throughput still depends on forwarding and the paths beyond it. The 1,024 GPUs-GPU cluster therefore requires approximately 32 such endpoint groups, although the physical rack count also depends on node density and the cabling layout.
5Switch radix: High-end switches such as NVIDIA Quantum-2 offer a radix of 64 ports, each at 400 Gb/s. As model scale pushes toward 100,000 GPUs, higher radix (128 or 256 ports), larger local accelerator domains, or accepted topology constraints are the main ways to avoid adding switch tiers, each of which adds switch latency and cost.
The same boundary shapes state placement. To survive a rack-wide outage, a job needs recoverable state outside that rack and a way to resume on available capacity. Topology-aware scheduling must therefore consider both fast communication paths and the failures that several nearby resources share.
↪ Nested failure domains, and why redundant state must span them to survive a correlated rack or ToR outage, are developed in Correlated failures.
3.5.2 Fat-tree (Clos) networks
The ToR provides non-blocking bandwidth within a single rack, but connecting the reference cluster’s 32 endpoint groups into a cluster that preserves full \(\BisectionBandwidth\) across every possible communication pair requires a topology that scales cross-sectional capacity with cluster size. The fat-tree (also called a Clos network) achieves this by adding parallel spine switches at each tier, so the aggregate uplink capacity always matches the total edge bandwidth feeding into it. In this vocabulary, leaf switches attach servers or racks, spine switches connect leaves within a pod, and core switches connect multiple pods when a third tier is needed; other sources call the leaf and spine tiers edge and aggregation. A pod here is a switching domain, the group of leaves that one set of spines joins, which can be narrower than the multi-rack pod of The Pod. A multi-rack pod in that sense can contain several fat-tree pods.
Definition 3.6: Fat-tree
Fat-tree is a hierarchical ML cluster network topology in which the number of parallel paths (and therefore aggregate cross-sectional capacity) increases at each switch tier toward the spine, providing full \(\BisectionBandwidth\) and multiple equal-cost routes between any two nodes (Al-Fares et al. 2008).
Significance: A \(\SwitchRadix\)-ary fat-tree built from radix-\(\SwitchRadix\) switches supports \(\SwitchRadix^2/2\) hosts in a standalone two-tier configuration and \(\SwitchRadix^3/4\) hosts in a three-tier configuration with full \(\BisectionBandwidth\). With 64-port switches, a standalone two-tier fabric supports 2,048 GPUs and a three-tier fabric supports 65,536 hosts. This is a capacity bound for suitable routing and admissible traffic; it does not eliminate endpoint contention or guarantee that a particular AllReduce implementation reaches line rate.
Distinction: Unlike a standard tree (where bandwidth at the root is a single bottleneck shared by all leaves), a fat-tree replaces each root with multiple spine switches whose combined uplink capacity matches the total edge bandwidth, eliminating the bottleneck.
Common pitfall: A frequent misconception is that fat-trees guarantee zero network cost. They require \(\mathcal{O}(\TopologyEndpointCount\log \TopologyEndpointCount)\) switches and dense cabling, so a non-blocking three-tier fat-tree at the 4,000-GPU scale needs hundreds of switches and more than ten thousand links before a single accelerator is purchased.
Al-Fares, Mohammad, Alexander Loukissas, and Amin Vahdat. 2008. “A Scalable, Commodity Data Center Network Architecture.”ACM SIGCOMM Computer Communication Review 38 (4): 63–74. https://doi.org/10.1145/1402946.1402967.
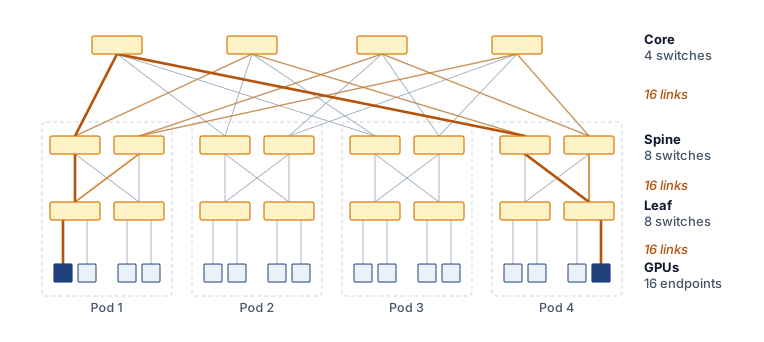
A three-tier radix-4 fabric (\(\SwitchRadix=4\)) shows the non-blocking structure at a scale small enough to draw (figure 9), with four core switches interconnecting four dashed pod modules. Leaf and spine switches split their ports between the tiers below and above; core switches use all their ports to connect pods. Each tier boundary therefore carries 16 links. The highlighted route traverses five switches and is one of \((\SwitchRadix/2)^2 = 4\) equal-cost routes from a GPU in Pod 1 to Pod 4. Parallel paths supply the capacity, while routing must distribute traffic across them to use it.
Figure 9: Non-blocking Fat-Tree Topology: A three-tier fat-tree built from radix-4 switches (\(\SwitchRadix=4\)) connects \(\SwitchRadix^3/4 = 16\) GPUs through four pods. Leaf and spine switches split their ports equally between the tiers below and above; core switches use all their ports to connect pods. Each tier boundary carries 16 links, supporting full \(\BisectionBandwidth\) with suitable routing. The highlighted leaf-spine-core-spine-leaf route between pod 1 and pod 4 is one of \((\SwitchRadix/2)^2 = 4\) equal-cost paths (the other three are drawn lighter), and exploiting those alternatives without excessive reordering requires compatible switch and endpoint mechanisms.
The fat-tree6 is a common default for ML clusters because a non-blocking design can provide full \(\BisectionBandwidth\) across arbitrary partitions. This capacity benefits global AllReduce even though implementations such as rings and trees do not require every pair of ranks to communicate at once. The number of hosts that the guarantee can cover depends on switch radix and tier count.
6Fat-tree (Clos network): The underlying multi-stage switching theory was invented by Clos (1953) at Bell Labs to minimize the number of electromechanical crosspoints in telephone exchanges. Leiserson (1985) at MIT generalized the concept as the “fat-tree,” where the tree is “fat” because link bandwidth increases toward the root, proving it could emulate any network of equal hardware volume. The same cost-minimization logic that drove 1950s telephony now drives ML cluster design: minimize switch count while guaranteeing non-blocking connectivity for global AllReduce.
Clos, C. 1953. “A Study of Non-Blocking Switching Networks.”Bell System Technical Journal 32 (2): 406–24. https://doi.org/10.1002/j.1538-7305.1953.tb01433.x.
Leiserson, Charles E. 1985. “Fat-Trees: Universal Networks for Hardware-Efficient Supercomputing.”IEEE Transactions on Computers C-34 (10): 892–901. https://doi.org/10.1109/tc.1985.6312192.
A fat-tree built from switches with radix \(\SwitchRadix\) supports \(\FatTreeHostCount= \SwitchRadix^{3}/4\) hosts at three tiers. A standalone two-tier non-blocking fabric can instead use \(\SwitchRadix\) leaves, each with \(\SwitchRadix/2\) host ports and \(\SwitchRadix/2\) uplinks, connected to \(\SwitchRadix/2\) spines. Each spine uses all \(\SwitchRadix\) ports to reach the leaves, providing \(\SwitchRadix^{2}/2 =\) 2,048 host ports for radix-64 switches. One pod of the three-tier design has only \(\SwitchRadix/2\) leaves and therefore \((\SwitchRadix/2)^2 =\) 1,024 host ports; its spine switches reserve ports for the core. These are different port allocations and switch counts rather than two ways of counting the same fabric, and while the 1,024-GPU reference cluster fits within a standalone two-tier design, the distinction matters as soon as a cluster outgrows that limit. A 4,096-GPU deployment cannot join two fully populated standalone 2,048-host fabrics at their spines, because every spine port is already occupied by a leaf connection; instead, it is built as four 1,024-host pods of the three-tier design, joined through a core tier. A concrete bisection estimate shows how quickly oversubscription at that spine or core boundary turns into synchronization delay.
Napkin Math 3.2: Bisection bandwidth: The cost of oversubscription
Problem: A cluster designer is choosing between a “non-blocking” (1:1) fat-tree and a “cost-optimized” (4:1) spine for a $300M cluster of 1024 GPUs. This is a separate economics scenario rather than the running 175B job: each GPU contributes a 5 GB gradient payload, and the workload is assumed to spend \(\CommunicationTimeFraction=\) 30 percent of each step communicating. That share is a scenario input. It is larger than the 13 percent of the illustrative schedule in figure 2 and far smaller than the exposed share in the introduction’s GPT-3 synchronization example (The energy accounting boundary), which assumes pure data parallelism with no overlap; none of the three is a measured share of the reference job. How much slower will the AllReduce be on the cheaper network, and what does that cost?
Math: Bisection bandwidth (\(\BisectionBandwidth\)) is the minimum pipe diameter between halves of the cluster. Assume a unidirectional ring whose ranks alternate between the two halves of the cluster. Every ring edge then crosses the cut, with \(\AcceleratorCount/2\) senders in each direction. Assume balanced routing, no competing traffic, and negligible startup latency. ReduceScatter plus AllGather contributes a traffic factor \(2(\AcceleratorCount-1)/\AcceleratorCount\) = 1.998 per GPU; multiplying by \(\AcceleratorCount/2\) gives the bytes crossing the cut in each direction. A ring that groups ranks within each half would have fewer crossing edges and a different cut-load bound.
Oversubscribed (4:1): \(\BisectionBandwidth =\) 25,600 GB/s divided by 4 = 6,400 GB/s per direction.
Time: 5,115 GB / 6,400 GB/s \(\approx\) 0.799 s.
Throughput: If the communication share stretches by the slowdown factor \(\CommunicationSlowdownFactor\) while computation stays fixed, then \(\text{relative throughput} = \frac{1}{(1-\CommunicationTimeFraction) + \CommunicationTimeFraction\,\CommunicationSlowdownFactor} = \frac{1}{0.70 + 0.30 \times 4} = \frac{1}{1.90} \approx 0.53\), a loss of about 47.4 percent of cluster throughput.
Cost: That loss times the $300M capital cost is about $142.1M.
Systems insight: For this cut-saturating placement, saving money on core switches creates a 4× bottleneck for global synchronization, and on a $300M cluster that bottleneck idles about $142.1M of compute. The same formula gives the 23.1 percent loss of the 2:1 spine in the non-blocking definition. This is an equivalent-capacity cost under the stated workload assumptions, not a direct equipment loss. Oversubscription must be evaluated against the collective traffic actually crossing the constrained cut.
The subscription ratio at each tier therefore determines whether a fat-tree can sustain global collectives, and the tier count determines how far it can grow. Scaling beyond the 2,048-host two-tier limit requires a three-tier architecture with core switches, enabling the fabric to reach 65,536 hosts, but the added scale carries both cost and latency. A non-blocking \(\SwitchRadix=64\) three-tier tree requires roughly \(5\SwitchRadix^2/4 \approx\) 5,120 switches across the core, spine, and leaf layers; at $10,000 to $50,000 per switch, the switching layer alone represents $51M to $256M. Typical hop counts also rise, from two inter-switch links and three switch traversals for intra-pod traffic (leaf-spine-leaf) to four inter-switch links and five switch traversals for inter-pod traffic (leaf-spine-core-spine-leaf), adding serialization delay and switch processing time to the \(\MessageStartupLatency\) latency term across thousands of synchronization steps. Rail-optimized topologies respond to both pressures by matching the physical cabling pattern to the collective communication pattern.
Checkpoint 3.2: Fat-tree topologies
These questions check whether hierarchical switch-fabric trade-offs are clear:
3.5.3 Rail-optimized topology
Rail-optimized topology begins from the communication pattern rather than from a generic switch hierarchy. Dense accelerator nodes partition GPUs by local slot position into independent horizontal rails (figure 10). In this physical cabling scheme, high-bandwidth internal NVSwitch planes bind the GPUs within each node, while external network ports route by slot position: GPU 0 in every node connects strictly to the Rail 0 switch, GPU 1 connects to Rail 1, and so on across the cluster.
Figure 10: Rail-Optimized Physical Wiring: In dense accelerator nodes such as the DGX H100, each GPU’s network port is cabled by local slot position: GPU 0 in every node connects to the rail 0 switch, GPU 1 to the rail 1 switch, and so on. Three nodes and four of each node’s eight GPUs are drawn, with the rail 0 cables emphasized; further nodes attach to the same rail switches. Tensor-parallel traffic stays on each node’s NVSwitch, same-rank data-parallel traffic stays on its own rail, and a spine layer (not drawn) bridges the rails for cross-rank traffic.
The wiring pattern connects corresponding GPUs across nodes (GPU 0 to GPU 0, GPU 1 to GPU 1) through dedicated rail switches rather than a shared ToR switch. This matters because data parallelism creates a deterministic and highly stratified communication pattern that standard topologies fail to exploit. When tensor-parallel groups stay inside each node, each replica assigns the corresponding model shard to the same local GPU rank. The slot number here is a local rank within a node; workers in the full distributed job also have distinct global ranks. GPU 0 on one node therefore synchronizes that shard’s gradients with GPU 0 on other nodes, but rarely with GPU 1 during this data-parallel exchange. A rail-optimized topology physically hardwires this logic by isolating these same-rank communication paths into dedicated networks. Instead of connecting all 8 GPUs in a node to a single ToR switch, the network connects all GPU 0s across the entire cluster to a dedicated “Rail 0” switch fabric, all GPU 1s to “Rail 1,” and so on. A simple hop-count estimate shows the payoff.
Napkin Math 3.3: The rail-optimized dividend
Problem: A team is synchronizing per-rank data-parallel gradients across 128 nodes. In a standard fat-tree, each message between same-rank GPUs traverses its source leaf switch, a spine switch, and the destination leaf switch (3 switch traversals). In a rail-optimized network built from rail switches with at least one port per node, all corresponding GPUs sit on the same rail switch (one traversal). On the reference cluster that requires rail switches with more ports than the radix-64 switch used so far, so the estimate describes a higher-radix design. How much latency dividend does the rail design earn when a rail fits on one switch?
Math: This estimate counts only the switch-traversal contribution to communication latency (\(\MessageStartupLatency\)), using the same assumed delay for each traversal.
Standard latency: 3 traversals \(\times\) 0.6 μs = 1.8 μs.
Systems insight: For synchronous data-parallel AllReduce, this 3× reduction applies to the modeled switch-latency contribution, not to total collective time. Its effect on scaling efficiency (\(\ScalingEfficiency\)) depends on payload size, delivered bandwidth, compute time, and overlap. The single-switch rail in this example avoids the spine traversal for same-rank traffic. The dividend is conditional. On the reference cluster’s radix-64 switches each rail outgrows one switch and regains the extra traversals, so what rails reliably buy there is isolation, developed below.
The hop saving is only part of the case for rails. Large language model fleets adopt the pattern because it matches how their parallelism plan divides traffic.
Lighthouse 3.1: Archetype A (GPT-4/Llama-3): The rail-optimized fleet
Archetype A’s use of 3D parallelism generates two distinct traffic patterns that pull in opposite directions: (1) large, bandwidth-hungry gradient averaging for data parallelism, and (2) high-frequency, latency-sensitive activation exchanges for tensor parallelism. Keeping tensor parallelism inside each node’s NVLink domain leaves data-parallel gradient traffic on the fabric, and rails give each same-rank data-parallel group its own switch network. A rail can provide a single switch hop between nodes when its endpoint count fits the available switch ports. Larger rails require additional switching stages, so rail alignment alone does not guarantee single-hop communication. Either way, the lesson for Archetype A is that how the fabric is wired to the parallelism plan matters as much as how many accelerators it connects.
For the cluster of 1,024 GPUs spanning 128 nodes, this creates 8 parallel networks of 128 GPUs each, requiring at least one switch port per endpoint in each rail. A single-switch realization therefore needs a radix at least as large as the rail endpoint count; the earlier radix-64 switch cannot realize this rail alone, which is why notebook 3.3 assumed higher-radix rail switches. Built from radix-64 switches instead, each rail becomes a small two-tier fabric that preserves rank alignment but adds hops. For the bandwidth-hungry gradient exchanges of data parallelism, the larger benefit is isolation: each rail carries only its own rank’s traffic, so the eight rail networks operate concurrently without competing for shared spine capacity. When a rail fits on one switch, the shorter path also trims the startup cost a ring pays on every round. That same isolation creates a sharp trade-off, because traffic that must reach GPUs of different ranks (such as expert routing in mixture of experts (MoE), or pipeline-stage handoffs that do not align with the rail wiring) requires bridging across rails. Large clusters therefore often employ a hybrid approach, using rail-optimized leaves for same-rank data-parallel traffic while bridging the rails with a full fat-tree spine to support cross-rank communication patterns.
Checkpoint 3.3: Rail-optimized networks
These questions check whether workload-specific network-design trade-offs are clear:
3.5.4 Dragonfly and torus alternatives
At tens of thousands of endpoints, a non-blocking three-tier fat-tree forces a third layer of core switches and tens of thousands of long optical cables into the budget, driving network capital expenditure into the tens or hundreds of millions of dollars. Two alternative topologies attack that cost wall from opposite directions: tapering the global switch tier or removing external fabric switches altogether. A dragonfly7 topology organizes high-radix routers (the dragonfly literature’s name for switches) into fully connected groups joined by global optical links. Each group has \(\DragonflyGroupRouterCount\) routers, and each router has \(\DragonflyTerminalPortCount\) terminal ports and \(\DragonflyGlobalChannelCount\) global channels. The ratio of \(\DragonflyGlobalChannelCount\) to \(\DragonflyTerminalPortCount\) sets how much global bandwidth each group receives relative to the traffic its terminals can inject, so global bandwidth is a design parameter rather than a fixed percentage of aggregate injection bandwidth. The balanced configuration analyzed by Kim et al. (2008), \(\DragonflyGroupRouterCount=2\DragonflyTerminalPortCount=2\DragonflyGlobalChannelCount\), is one setting of that knob. Because the routers in a group are fully connected and the groups are joined by global links, a minimal route between two groups takes at most one local hop to the router holding the right global link, one global hop, and one local hop in the destination group, so no minimal path exceeds three router-to-router hops regardless of system size. Short paths come cheaply, but performance for jobs spanning groups depends on the chosen \(\DragonflyTerminalPortCount/\DragonflyGlobalChannelCount\) ratio, routing, and traffic matrix, because every inter-group transfer shares the provisioned global links.
7Dragonfly topology: Introduced by Kim et al. (2008) at ISCA 2008, the dragonfly uses high-radix routers grouped into fully connected “super-nodes.” For systems with at least 16,000 terminals, the architecture achieves a 52 percent network-cost reduction relative to a folded Clos (the fat-tree of section 3.5.2) of equivalent bandwidth, though global optical link oversubscription can create AllToAll bottlenecks during MoE token routing.
Kim, J., W. J. Dally, S. Scott, and D. Abts. 2008. “Technology-Driven, Highly-Scalable Dragonfly Topology.”2008 International Symposium on Computer Architecture, 77–88. https://doi.org/10.1109/isca.2008.19.
A torus topology connects each node directly to its neighbors in a multidimensional grid, most commonly a 3D torus where every node links to its six adjacent peers (up/down, left/right, front/back). The design offers full local bandwidth with minimal switching hardware, because every neighbor is a single hop away. However, global communication requires traversing the diameter of the mesh (\(\mathcal{O}(\TopologyEndpointCount^{1/3})\) hops), making latency scale poorly with cluster size. Google adopted this architecture for its Tensor Processing Unit (TPU) pods because the collectives that dominate its training workloads can be scheduled as rings along each torus dimension, a nearest-neighbor pattern that maps naturally onto the physical grid. The limitation becomes apparent with MoE, which relies on AllToAll communication patterns. On a torus, these random permutations can congest the limited \(\BisectionBandwidth\) of the mesh and degrade performance relative to a non-blocking switch fabric.
The trade-off becomes concrete for the 4,096-endpoint deployment that the three-tier fat-tree reached with four pods. Arranged as a \(16 \times 16 \times 16\) torus with wraparound links, the same endpoints need no external switching stages, but only 512 links cross the bisection, against 2,048 in the non-blocking fat-tree. With 50 GB/s per link and direction, the torus offers 25.6 TB/s across the cut against the fat-tree’s 102.4 TB/s, a 4× gap, and its worst-case path crosses 24 neighbor hops against the fat-tree’s five switch traversals. Because a cubic torus’s cut grows only as \(\TopologyEndpointCount^{2/3}\) while its endpoint count grows as \(\TopologyEndpointCount\), that capacity gap widens at fixed link rate. Whether the gap matters depends on the traffic: a ring AllReduce scheduled along each torus dimension moves data only between neighbors and combines contributions before forwarding them, so it leans little on the narrow cut, whereas an MoE AllToAll or an embedding exchange sends a large share of its traffic between distant endpoints and drives it straight into the cut, with the exact pressure set by placement and message sizes. Consequently, the collective schedule and traffic matrix determine whether the torus’s lower cross-sectional capacity limits completion time.
↪ AllToAll schedules and their cost at scale, where every rank sends a distinct share to every other rank, are developed in AllToAll Exchanges at Scale.
At the scale of the 1,024-GPU reference cluster, the four families range in cut capacity from 25.6 TB/s in the non-blocking fat-tree down to 6.4 TB/s in a 3D torus, while an assumed interconnect cost runs from $1.5/Gb/s for the switchless torus to $4/Gb/s for the tapered dragonfly (figure 11). The cheapest capacity is also the least capacity, which is the trade every topology decision prices. The dragonfly’s assumed cost per Gb/s is the highest here because its savings come from replacing long optical runs and switch tiers at large scale, which Kim et al. (2008) reports for systems of at least 16,000 terminals; at 1,024 GPUs it has few such runs to replace. Radix, endpoint count, link speed, routing mechanisms, and equipment pricing all shift these trade-offs; the topology family alone dictates neither raw cross-sectional capacity nor operational capital cost.
Figure 11: An Illustrative Bandwidth-Cost Scenario for ML Network Topologies: \(\BisectionBandwidth\) (TB/s, horizontal axis) against assumed cost per Gb/s (vertical axis) for four topology configurations on a 1,024-GPU cluster: fat-tree (25.6 TB/s, $3/Gb/s), dragonfly with tapered global links (19.2 TB/s, $4), rail-optimized with a 2:1 bridging spine (12.8 TB/s, $2), and a 3D torus (6.4 TB/s, $1.5). The bandwidths follow from the stated structures at one link rate; the costs are scenario inputs that illustrate the comparison method rather than universal properties of each topology family.
3.5.5 Optical circuit switching and reconfigurable topology
Every topology so far is fixed when the fabric is cabled, and its switching is electrical. In clusters spanning tens of thousands of accelerators, multi-tier Clos networks, the switched leaf-and-spine family whose full-bisection form is the fat-tree of section 3.5.2, connect groups of endpoints through successive tiers of electrical packet switches. These switches inspect each packet and choose an outgoing link; the alternative considered here changes the physical connections between groups for a longer-lived workload allocation. Every network hop incurs an Optical-Electrical-Optical (OEO) conversion: incoming photons hit a photodiode, high-speed SerDes circuits deserialize the electrical signal, switch ASICs buffer and route packets across crossbars, and output SerDes drive lasers to re-transmit light over optical fiber.
At 800 Gb/s and 1.6 Tb/s per-port data rates, SerDes and transceiver electronics consume significant energy (section 3.3.3), and every additional switch tier repeats that conversion cost for each bit that crosses it. Fixed electrical Clos topologies are also cabled statically, locking the facility into a single oversubscription ratio and rigid bisection pattern regardless of whether the running workload is pipeline-dominated, data-parallel, or AllToAll expert-routed. A statically cabled torus is equally fixed. It suits the dimension-ordered rings described in section 3.5.4 but congests under MoE AllToAll traffic, and its wiring cannot change to match the job.
Definition 3.7: Optical circuit switching
Optical circuit switching (OCS) is a physical networking architecture that routes optical signals directly using Micro-Electro-Mechanical Systems (MEMS) mirror arrays without Optical-Electrical-Optical (OEO) conversion, enabling dynamic, software-defined topology reconfiguration and high energy efficiency at warehouse scale.
Significance: An optical circuit bypasses packet-by-packet electronic processing in the switching path. The complete system still consumes power for actuators, control, and transceivers. Its compatibility across line rates depends on optical loss, wavelengths, and endpoint budgets, so protocol transparency does not imply unrestricted upgrades.
Distinction: Unlike electrical packet switches (which inspect headers, buffer packets in SRAM, and make nanosecond routing decisions per packet), an OCS establishes semi-static physical optical circuits with millisecond-scale switching latency (\(10\)–\(30\) ms), making it suitable for topology-level reconfiguration rather than dynamic packet routing.
Common pitfall: Assuming OCS replaces packet switching entirely. OCS operates at circuit granularity: it configures cluster-scale topologies (such as 3D tori or job-specific sub-clusters) and routes around hardware faults, while packet switching or accelerator-native interconnects handle fine-grained, intra-step message routing.
Google’s TPU v4 supercomputer (Jouppi et al. 2023) deployed optical circuit switching in production. Instead of wiring 4,096 chips into an inflexible electrical fat-tree, the system groups accelerators into \(4{\times}4{\times}4\) node cubes and routes the inter-cube links through an array of 3D MEMS optical circuit switches (codenamed Palomar).
Jouppi, Norm, George Kurian, Sheng Li, Peter Ma, Rahul Nagarajan, Lifeng Nai, Nishant Patil, et al. 2023. “TPUv4: An Optically Reconfigurable Supercomputer for Machine Learning with Hardware Support for Embeddings.”Proceedings of the 50th Annual International Symposium on Computer Architecture, 1–14. https://doi.org/10.1145/3579371.3589350.
The optical layer serves two purposes, adapting the topology to the workload and recovering from faults. For workload adaptation, the physical interconnect can be reconfigured to match the communication structure of the running model. A training run using 1D pipeline parallelism can configure its slice as an elongated cylinder to streamline stage-to-stage transfers. Conversely, a 2D or 3D tensor-parallel partition can configure a compact cubic 3D torus that minimizes average hop count, while an MoE workload can maximize bisection bandwidth across specific expert groups.
Optical switching also supports fault isolation by changing connections around unavailable hardware where spare connectivity permits. The capability matters because in a statically cabled torus, a single failed link or node can break a ring along an entire dimension and degrade every job that spans it. With optical circuit switching, the mirrors can be redirected to bypass the failed cube or fiber and splice healthy cubes into a complete, smaller torus slice without manual recabling. The fabric manager must first detect the fault, choose a feasible allocation, and establish the new circuits, which means circuit-switching time is only one part of recovery; a training job may also need to rebuild its process groups and restore state before computation resumes, so optical reconfiguration latency alone does not specify recovery time.
The trade-off is switching latency. Because MEMS mirrors physically rotate to steer collimated light beams, reconfiguration occurs on a mechanical timescale that is much longer than packet forwarding in an established electrical path. Circuit setup changes connectivity, while packet forwarding uses connectivity already in place. Consequently, OCS raises the power and protocol ceiling of the switching layer while leaving reconfiguration latency as the binding constraint, so it is deployed for job-level topology allocation and fault isolation, not for per-message dynamic routing. Within that limit, OCS turns the choice of topology from a decision fixed when the fabric is cabled into one made for each job.
Each topology comparison so far has considered one traffic pattern at a time. In practice, clusters serve multiple workloads with different communication patterns, and topology selection must balance their competing demands.
Checkpoint 3.4: Topology selection for your workload
The choice of network topology dictates the upper bound of training efficiency. Warm up by matching each single-workload pattern to its ideal topology, then design a fabric that must serve several at once.
Single-workload picks
Designing for a mixed cluster
You are designing the network for a new ML cluster that will run two primary workloads: (1) training a 175B-parameter language model using 3D parallelism (tensor, pipeline, and data parallelism), and (2) serving a mixture-of-experts model that relies heavily on AllToAll communication to route tokens to the correct experts.
Topology provides the structural capacity for the cluster of 1,024 GPUs to communicate, but structure alone does not guarantee performance. When the 1,024 GPUs synchronize contributions to the model’s 350 GB gradient state, that theoretical capacity collides with the reality of fabric behavior: congestion control and routing dynamics determine whether this traffic flows smoothly or gridlocks under the strict synchronization of the BSP model.
Self-Check: Question
A cluster designer builds a three-tier non-blocking fat-tree network using radix-64 switches (\(k = 64\)). What is the maximum number of hosts this fabric can support at 1:1 bisection bandwidth subscription, and how many total switches are required across all tiers?
\(2{,}048\) hosts and \(128\) switches
\(16{,}384\) hosts and \(1{,}024\) switches
\(65{,}536\) hosts and \(5{,}120\) switches
\(262{,}144\) hosts and \(20{,}480\) switches
Why does a rail-optimized network topology significantly reduce synchronization latency for 3D-parallel training jobs compared to a standard uniform fat-tree?
It replaces optical fiber cables with liquid-cooled copper buses across all rows
It physically connects all GPUs of the same local rank (e.g., all GPU 0s) across server nodes to dedicated rail switches, allowing same-rail transfers within a leaf group to use a single switch hop
It eliminates the need for intra-node NVLink by routing all tensor-parallel traffic through Top-of-Rack switches
It dynamically routes all AllReduce packets through the GPU display engine to bypass PCIe contention
A cluster operator considers saving capital expenditure by building a \(4:1\) oversubscribed spine in a 1,024-GPU training cluster. Explain the quantitative and economic impact of this design on a 100 GB per GPU AllReduce collective during distributed training.
Why did Google adopt a 3D torus topology for its TPU Pods, and what communication workload exposes the primary structural limitation of this topology?
The 3D torus minimizes cabling cost and external switch hardware by leveraging direct neighbor-to-neighbor links that suit structured transformer collectives, but suffers high hop count (\(\mathcal{O}(N^{1/3})\)) and bisection congestion under irregular AllToAll traffic from Mixture-of-Experts (MoE) models
The 3D torus provides full non-blocking bisection bandwidth for random permutation traffic, but fails when running ring AllReduce due to cyclic buffer dependencies
The 3D torus eliminates Forward Error Correction requirements, but cannot support FP16 numerical precision
The 3D torus reduces power consumption by disabling physical link SerDes, but restricts cluster scale to 32 nodes
True or False: In a data center network, aggregate bandwidth (the sum of all endpoint link rates) and bisection bandwidth (\(\text{BW}_{\text{bisect}}\)) are identical metrics.
3.6 Level 4 Fabric Behavior, Congestion, and Routing
A collective can finish late even when the topology provides full \(\BisectionBandwidth\). Levels 1 through 3 determine how long a transfer takes on an unloaded path; fabric behavior determines how much longer it takes once the job’s own synchronized traffic loads that path. Competing flows can concentrate on one output path, and the BSP barrier introduced in section 3.2 exposes any delay that extends the last required transfer. The relevant paths are those used by the participating workers; a congested link elsewhere in the fleet need not affect the job. In the Fleet Law (equation 1.3), measured transfer durations contribute to \(\CommunicationTime(\DeviceCount)\), while residual waiting at synchronization contributes to \(\SynchronizationTime(\DeviceCount)\), the point where the communication axis of C³ hands its cost to the coordination axis. A timeline must assign each interval consistently so the same congestion delay is not counted twice.
The p99 tail latency introduced with the BSP barrier helps expose delays that an average hides, but a particular barrier waits for its last required participant, not for a percentile. Evaluating a fabric therefore requires both transfer-time distributions and the collective completion times they produce under load.
3.6.1 Priority flow control (PFC)
The BSP weakest-link property means that even a single dropped packet can trigger a retransmission timeout that stalls the global barrier for milliseconds, a delay that can rival the entire communication phase of a training step. PFC-based RoCEv2 fabrics prevent the drop in the first place by running PFC, the pause mechanism introduced with the RDMA stacks (section 3.4.2), in lossless mode, so that upstream senders stop before any buffer saturates (Guo et al. 2016; Gangidi et al. 2024).
Definition 3.8: Priority flow control
Priority flow control (PFC) is a link-layer mechanism used by RoCEv2 ML cluster fabrics to prevent switch buffer overflow by sending PAUSE frames to an upstream sender when a port’s queue depth crosses a configured threshold, throttling injection on a per-priority basis without dropping packets.
Significance: In PFC-based RoCEv2 deployments, PFC is the foundation for a lossless Ethernet service. A PFC PAUSE frame must reach the upstream sender before the buffer overflows, so each pause threshold must leave headroom for the data still in flight during roughly one link round trip.
Distinction: Unlike standard IEEE 802.3 flow control, which pauses all traffic classes on a link, PFC operates per priority class, allowing latency-sensitive control messages to continue flowing while only pausing the congested gradient data queue.
Common pitfall: A frequent misconception is that PFC solves congestion. It transforms packet loss into congestion spreading. PFC itself places no bound on how far PAUSE frames propagate, so a single faulty transceiver can pause traffic far from its own link unless a watchdog intervenes.
The danger of PFC lies in its cascading nature. When a switch port’s buffer fills, it sends a PAUSE frame upstream, which can move congestion into the upstream switch and trigger another PAUSE frame. A slow receiver, routing hot spot, or true fan-in burst can therefore pause links unrelated to the original queue. This behavior, known as congestion spreading, is the primary operational risk of PFC-based lossless Ethernet, and the flows it stalls without ever touching the congested queue are called victim flows. Fan-in is one trigger, but it is not intrinsic to every collective. A bandwidth-optimal ring exchanges data point to point, although multiple ring flows can still collide at a shared egress or an oversubscribed cut and create a hot spot without a single aggregation receiver (section 3.6.5).
PAUSE frames climb back tier by tier and stall senders far from the full port.
3.6.2 Lossless fabric hazards and watchdog recovery
While priority flow control provides the illusion of a lossless physical layer, relying on link-layer backpressure introduces structural failure modes that do not exist in loss-tolerant packet-switched networks. When switch queues cannot drop packets to relieve congestion, pressure propagates backward through the network graph, creating two distinct hyperscale failure modes: buffer-dependency deadlocks and PFC storms.
Definition 3.9: Cyclic buffer dependency deadlock
Cyclic buffer dependency deadlock is a permanent distributed lockup in a lossless network, whether its backpressure uses PFC PAUSE frames or InfiniBand credits, where a set of switch port queues form a closed dependency cycle, each holding packets destined for the next queue while simultaneously paused by backpressure from that same queue.
Significance: A single such deadlock permanently halts traffic across all participating ports and upstream links, requiring manual intervention or watchdog timeouts that discard packets to recover. InfiniBand fabrics prevent it through deadlock-free routing and virtual-lane assignment, and PFC-based Ethernet fabrics need the same discipline in their routing and priority configuration.
Distinction: Unlike a PFC storm (which is a transient cascade of backpressure triggered by a slow-draining endpoint), a buffer-dependency deadlock is a static, self-sustaining topological cycle that cannot resolve itself even after traffic injection stops.
Common pitfall: Assuming multi-stage Clos (fat-tree) fabrics are inherently immune to deadlocks. Dynamic multipath routing, link failures, and address resolution flooding can introduce cyclic forwarding dependencies across switch tiers.
The graph mechanics of buffer-dependency deadlocks
In a lossless network, a switch cannot forward a packet to downstream buffer \(\PacketBuffer_j\) if \(\PacketBuffer_j\) is full; instead, it holds the packet in upstream buffer \(\PacketBuffer_i\) and awaits credit or pause clearance. A directed buffer dependency graph \(\BufferDependencyGraph= (\BufferDependencyVertexSet, \BufferDependencyEdgeSet)\) formalizes this relationship, where each vertex \(\PacketBuffer_k \in \BufferDependencyVertexSet\) represents a packet buffer or virtual lane queue at a switch port, and a directed edge \((\PacketBuffer_i, \PacketBuffer_j) \in \BufferDependencyEdgeSet\) indicates that a packet currently occupying buffer \(\PacketBuffer_i\) requires buffer \(\PacketBuffer_j\) along its routing path to make forward progress.
A directed cycle in the buffer dependency graph is a necessary condition for a cyclic buffer dependency deadlock (definition 3.9), but a cycle alone does not establish that progress has stopped. The cyclic dependency in equation 1 becomes a deadlock when the occupied buffers cannot drain and every participant waits for its successor:
When each buffer in the cycle fills beyond its configured pause threshold, each port asserts a PFC PAUSE frame to its predecessor. Because no buffer can advance a packet into a paused successor, no buffer can drain, and no port can de-assert its PAUSE signal. The entire cycle freezes permanently. A four-switch ring whose queues (\(\PacketBuffer_1\) through \(\PacketBuffer_4\)) are completely full shows this mutual protocol interlock (figure 12). Solid gray arrows trace packet forwarding dependencies advancing clockwise (\(\PacketBuffer_1 \to \PacketBuffer_2 \to \PacketBuffer_3 \to \PacketBuffer_4 \to \PacketBuffer_1\)), while dashed red PAUSE frames propagate counterclockwise. Each full queue pauses its upstream predecessor while waiting for its downstream successor to drain, permanently freezing all four queues until an external watchdog intervenes to drop frames.
Figure 12: A PFC Deadlock from a Cyclic Buffer Dependency: Four switch queues form the cycle of equation 1. Follow the solid arrows clockwise: each full buffer holds packets that need space in the next. The dashed PAUSE frames run counterclockwise, so each full queue pauses its upstream predecessor while awaiting space in its downstream successor, and no queue can drain until a watchdog drops packets.
Routing changes and flooding can create the dependencies needed for deadlock. During link failure or Border Gateway Protocol (BGP) convergence, inconsistent forwarding tables can create transient loops. A lossy IP network eventually discards a looping packet when its time-to-live expires; a lossless class has no such release, so looping traffic can fill the buffers along the loop and hold them. If traffic occupies a cycle of mutually blocked queues, backpressure can prevent progress until recovery breaks the dependency. Multicast or broadcast replication can also fill queues whose dependencies intersect, while cross-connects and asymmetric failover paths can introduce cycles absent from the intended hierarchical route. None of these conditions alone proves a deadlock; the occupied buffers and pause states must form the closed waiting cycle described by the model. Microsoft’s production RoCE deployment encountered the flooding trigger directly (war story 3.1).
War Story 3.1: Microsoft's PFC deadlock (2016)
Context: A team led by Chuanxiong Guo at Microsoft Research deployed RoCEv2 across Microsoft’s data centers, a fleet operating at the scale of tens of thousands of servers, to support latency-sensitive services. Their design provided a lossless fabric with PFC, and the team developed a Differentiated Services Code Point (DSCP)-based PFC mechanism to extend the deployment beyond virtual local area network (VLAN) boundaries (Guo et al. 2016).
Mechanism: PFC interacted with Ethernet flooding to create a cyclic buffer dependency. A dead server with an incomplete mapping between an IP address and a media-access-control address caused upstream switches to flood lossless packets to every port; PFC PAUSE frames then propagated upstream in response to the flooded traffic, forming a closed loop of paused buffers.
Impact: Lossless traffic through the switches in the cycle stopped entirely and stayed stopped, because no buffer in the dependency loop could drain without outside intervention.
Fix: Microsoft blocked broadcast and multicast traffic from entering lossless traffic classes, and dropped lossless packets when the corresponding Address Resolution Protocol (ARP) entry was incomplete rather than falling back to flooding.
Systems lesson: PFC backpressure is a structural vulnerability of lossless Ethernet at hyperscale. RoCE fabrics require packet-class discipline, PFC pause telemetry, and hardware-level safeguards because a mechanism designed to avoid packet loss can itself become the failure mode. ML training fabrics built on RoCE inherit this risk directly. A single incomplete ARP entry can freeze the lossless class that carries a multi-thousand-GPU training run’s gradients, with the cluster appearing healthy while no gradient flows between workers.
Guo, Chuanxiong, Haitao Wu, Zhong Deng, Gaurav Soni, Jianxi Ye, Jitendra Padhye, and Marina Lipshteyn. 2016. “RDMA over Commodity Ethernet at Scale.”Proceedings of the 2016 ACMSIGCOMM Conference, 202–15. https://doi.org/10.1145/2934872.2934908.
PFC storms and victim flows
In contrast to a static topological cycle, a PFC storm is a dynamic, runaway amplification phenomenon triggered when a single “slow drainer” (an accelerator stalled by memory bus saturation, operating system preemption, or a degraded transceiver with elevated bit error rates) fails to consume packets at wire speed. The attached ToR switch queue fills and sends a PAUSE frame to the sender. Because multi-port switches aggregate traffic from many sources across shared packet buffers, the paused queue blocks buffer allocation for unrelated packets (head-of-line blocking). The spine switches feeding that ToR then fill their buffers and pause the other leaf switches that send through them, and each additional tier widens the set of paused links until traffic between node pairs that never communicated with the stalled worker also stops. These victim flows turn one slow endpoint into a job-wide barrier delay, because every data-parallel worker whose path crosses a paused spine port now arrives late at the barrier. Because a degraded transceiver is one such slow drainer, a component-exposure calculation shows how often a cluster should expect at least one, even though exposure alone does not estimate the probability of a PFC storm.
Napkin Math 3.4: Probability of at least one transceiver degradation
Problem: A 4096-GPU RoCE cluster, larger than the reference cluster, is in operation. If the probability that a given transceiver begins degrading on a given day is 0.001 percent, what is the chance that at least one transceiver degrades on a given day?
Math: Assume independent transceiver-degradation events with the same per-device probability.
Total exposure: 4096 \(\times\) 3 link tiers = 12,288 links, or 24,576 transceivers.
Probability of zero transceiver degradations: \(\Pr(\text{no degradation}) = (1 - 0.00001)^{24,576} \approx 0.782\).
Probability of at least one degradation: \(\Pr(\text{at least one degradation}) = 1 - 0.782 = \mathbf{0.218}\) (about 21.8 percent).
Systems insight: Under these assumptions, a large RoCE cluster has a 21.8 percent daily chance of at least one degraded transceiver. This result motivates hardware telemetry and automated remediation, but estimating fabric-wide freeze risk additionally requires the conditional probability that a degradation triggers and propagates a PFC storm.
Watchdog recovery and the lossy alternative
Switches can use PFC watchdog timers to detect prolonged pause states and trigger recovery without a full reboot. The configured threshold \(\PfcWatchdogTimeout\) must fit the deployment’s pause and recovery budgets; a range such as \(50\text{--}200\text{ ms}\) is a configuration example, not a universal requirement. Exceeding it indicates stalled progress, not proof of a cyclic deadlock. Depending on the implementation, mitigation can disable pause handling or discard affected traffic so blocked queues can drain. The transport must then recover any lost data, with the completion penalty determined by retransmission behavior, outstanding traffic, and the collective’s dependencies. On an RNIC with Go-Back-N-style recovery (section 3.4.3), each discarded packet also costs the in-flight window behind it, so breaking a pause converts a stalled queue into a retransmission tail that the waiting collective absorbs.
This systemic brittleness is driving hyperscale operators toward next-generation architectures such as the Ultra Ethernet Consortium (UEC) (Ultra Ethernet Consortium 2025), detailed in section 3.10.1, and loss-tolerant RDMA designs (Mittal et al. 2018). Designs that combine packet spraying with congestion control and selective retransmission can operate without link-layer PFC. Removing PFC removes its pause-based deadlocks and storms, but endpoint recovery must still bound the completion-time penalty of congestion and loss.
Mittal, Radhika, Alexander Shpiner, Aurojit Panda, Eitan Zahavi, Arvind Krishnamurthy, Sylvia Ratnasamy, and Scott Shenker. 2018. “Revisiting Network Support for RDMA.”Proceedings of the 2018 Conference of the ACM Special Interest Group on Data Communication, 313–26. https://doi.org/10.1145/3230543.3230557.
3.6.3 End-to-end congestion control with DCQCN and HPCC
End-to-end congestion control adjusts injection rates before queues reach their pause or overflow thresholds. For a BSP workload with a completion-time target, this is a latency requirement rather than an optional throughput optimization. Delaying a required transfer can extend the synchronization boundary, so the controller must balance delivered throughput against queueing and recovery tails.
The first widely deployed solution, DCQCN,8 operates as a reactive feedback loop using ECN (Zhu et al. 2015). When a switch’s queue depth exceeds a configured threshold, it marks the ECN bit in the packet header. The receiver echoes this mark back to the sender via a congestion notification packet (CNP), prompting the sender to reduce its injection rate using a multiplicative-decrease algorithm. DCQCN is widely supported, but production AI collectives expose a tuning problem. ECN thresholds and NIC firmware behavior can trade off PFC avoidance, throughput, visibility, and tail latency rather than offering one stable optimum (Gangidi et al. 2024).
8DCQCN (data center quantized congestion notification): Introduced by Zhu et al. (2015) (Microsoft and Mellanox) at SIGCOMM 2015 for large-scale RDMA fabrics, its binary ECN/CNP feedback loop is simpler to deploy than telemetry-rich schemes. However, it creates a delicate tuning surface for training collectives: Meta’s 2024 RoCE deployment showed that aggressive ECN marking reduces PFC pauses but degrades collective completion time (Gangidi et al. 2024).
Zhu, Y., H. Eran, D. Firestone, C. Guo, M. Lipshteyn, Y. Liron, J. Padhye, S. Raindel, M. H. Yahia, and M. Zhang. 2015. “Congestion Control for Large-Scale RDMA Deployments.”ACM SIGCOMM Computer Communication Review 45 (4): 523–36. https://doi.org/10.1145/2829988.2787484.
Gangidi, Adi, Rui Miao, Sandeep Hebbani, Gaya Nagarajan, Omar Baldonado, Lixin Gao, Hany Morsy Goes, et al. 2024. “RDMA over Ethernet for Distributed AI Training at Meta Scale.”Proceedings of the ACMSIGCOMM 2024 Conference, 56–69. https://doi.org/10.1145/3651890.3672233.
9HPCC (high precision congestion control): Introduced by Li et al. (2019) (Alibaba) at SIGCOMM 2019, HPCC requires programmable switch ASICs that append INT metadata to packets at line rate, a hardware dependency that limits the fabrics able to deploy it.
Li, Yuliang, Rui Miao, Hongqiang Harry Liu, Yan Zhuang, Fei Feng, Lingbo Tang, Zheng Cao, et al. 2019. “HPCC: High Precision Congestion Control.”Proceedings of the ACM Special Interest Group on Data Communication (SIGCOMM), 44–58. https://doi.org/10.1145/3341302.3342085.
HPCC9 uses in-network telemetry (INT) to give the sender more information about path load (Li et al. 2019). Switch measurements of queue occupancy and transmitted traffic let the controller estimate an appropriate injection rate rather than react only to a binary congestion mark. That information still arrives after a feedback delay, so the controller must account for changing load and avoid overreaction. The evaluated design reduces queue buildup and tail latency, but requires switch telemetry support and compatible endpoint processing. DCQCN needs less detailed switch feedback, trading that simpler deployment requirement against a different tuning problem.
3.6.4 Adaptive routing
Static routing protocols like ECMP10 distribute traffic by hashing flow headers to fixed paths. This approach works well for many small flows but can create persistent collisions among the small number of elephant flows typical of ML training. In a scenario with 4 equal-cost paths and 8 large gradient flows, an even distribution would place 2 flows on each link, whereas static hashing can place 4 flows on one link while another sits idle. In a synchronized training step, that overloaded link then determines completion time and can halve useful bandwidth.
10ECMP (equal-cost multi-path): ECMP selects a path by hashing on the 5-tuple (source/destination IP, source/destination port, protocol), which means the same flow always takes the same path. This determinism is a feature for packet ordering but a liability for ML. Because a single AllReduce ring produces a small number of persistent flows, hash collisions are not transient statistical events but hot spots that last as long as those flows do.
11Packet spraying: Unlike standard Ethernet (which hashes flows to single paths to avoid reordering), packet spraying sends individual packets of a single flow across multiple paths. This can improve use of the available \(\BisectionBandwidth\) by AllReduce elephant flows when the transport can tolerate or repair reordering. The Ultra Ethernet Consortium (UEC) specification design explicitly includes multi-path packet spraying and flexible ordering to reduce the ECMP collision problem for AI/HPC traffic (Ultra Ethernet Consortium 2025).
Adaptive routing mitigates this problem by allowing switches to select among eligible output paths using congestion information rather than only a static hash. The implementation is protocol- and device-dependent. Packet-level spraying11 can send packets of one connection over different paths, so the receiver may observe reordering. Compatible endpoint support must accept out-of-order placement or restore the transport’s required ordering; the presence of InfiniBand alone does not guarantee arbitrary spraying across every path.
Ethernet fabrics can also employ flowlet switching, which changes a flow’s path between bursts separated by a gap large enough to preserve packet order across the candidate paths, so its usefulness depends on how often the workload leaves such gaps relative to path delay differences. MoE expert exchanges illustrate why path diversity matters: a dense exchange among 64 expert-parallel ranks contains at most \(64(64-1)=4{,}032\) directed remote rank pairs after excluding self-transfers, with active traffic governed by expert placement and token-routing sparsity. Where static-hash collisions concentrate that traffic onto a few links, adaptive routing spreads it across the provisioned \(\BisectionBandwidth\). Archetype B (DLRM at Scale) creates similar exchanges when batches of embedding requests and results move among table shards, although batch and shard placement determine the traffic matrix rather than every individual lookup requiring a global exchange.
3.6.5 The incast problem in ML
Congestion control and adaptive routing manage flows that traverse the interior of the fabric. A different failure mode occurs at the edge, where the traffic pattern itself overwhelms a single port regardless of how much capacity the fabric interior provides.
Definition 3.10: Incast
Incast is a many-to-one ML cluster traffic pattern in which a large number of senders simultaneously transmit data to a single receiver port, concentrating line-rate traffic from multiple sources into a single switch queue and potentially overflowing the buffer if the burst outlasts available buffering and control response, even when the rest of the fabric is uncongested.
Significance: Flat aggregation, synchronized storage reads, or other fan-in phases can direct many senders toward one receiver. The deliberately worst-case scenario here assumes a RoCE fabric whose ports all run at 400 Gb/s. In it, 256 senders each transmit at 50 GB/s toward one switch egress, producing 12.8 TB/s of offered load against a 400 Gb/s port. A 32 MB buffer then overflows in about 2.5 μs under the stated assumptions, after which the switch either drops packets or, in a PFC deployment, pauses its upstream neighbors. The example is a stress bound, not the traffic matrix of a ring AllReduce.
Distinction: Unlike general congestion (which occurs on shared internal links when aggregate traffic exceeds link capacity), incast is an endpoint bottleneck. It occurs even if every internal spine and leaf link is completely uncongested, because the bottleneck is the single destination port, not the fabric interior.
Common pitfall: Incast is not necessarily rare or unpredictable. Training jobs create it on a schedule, whenever many GPUs read dataset shards from or write checkpoints to the same storage node, and in the aggregation step of a tree or hierarchical reduction, where several ranks send partial sums to one parent. A gradient ring is different; its point-to-point flows can still collide at a shared egress, but that is a hot spot rather than many-to-one incast. The severity depends on the collective algorithm, topology, routing, and oversubscription, so it must be measured and mitigated rather than treated as an edge case.
In a worst-case incast, 12.8 TB/s of offered traffic from 256 senders converges on a single 400 Gb/s (50 GB/s) egress (figure 13). Each sender injects at 50 GB/s. The buffer fills over a finite interval; control feedback can reduce arrivals, drops can discard excess traffic, or backpressure can move the queueing upstream. Whether that pressure spreads depends on shared queues and the paths carrying the traffic. Let the aggregate arrival rate to one egress be \(\EgressArrivalRate\), the egress service rate be \(\EgressServiceRate\), and the instantaneous queue occupancy be \(\EgressQueueOccupancy(\TimeInstant)\). While a burst persists and \(\EgressArrivalRate > \EgressServiceRate\), the queue grows at the net rate
where \(\EgressBufferCapacity\) is the finite buffer capacity. The ratio \(\EgressPortUtilization=\EgressArrivalRate/\EgressServiceRate\) distinguishes a drainable workload from sustained overload: for \(\EgressPortUtilization<1\), idle intervals can drain the queue; as long-run \(\EgressPortUtilization\) approaches one, less slack remains to absorb bursts; and for \(\EgressPortUtilization>1\), occupancy must reach a control threshold or the buffer limit if the overload persists. This is a packet queue, distinct from the request queues of an inference server. Serialization and propagation set the unloaded path latency, whereas queued bytes add approximately \(\EgressQueueOccupancy/\EgressServiceRate\) of waiting time.
⇄ Contrast: Request queues, whose arrival and service rates set serving latency rather than switch buffer occupancy, are developed in Queuing theory for batched inference.
In the deliberately worst-case incast above, \(\EgressPortUtilization\) is 256×, so the 32 MB buffer fills in about 2.5 μs. Once full, that buffer represents 640 μs of egress waiting time. By contrast, the bandwidth-delay product for the 400 Gb/s egress and an illustrative 5 μs feedback round trip is only 250 KB; it measures data in flight on the path, not the buffering needed to absorb an arbitrary fan-in burst. ECN must mark early enough for feedback to arrive before exhaustion; PFC can prevent a drop, but its backpressure can spread congestion. A larger buffer extends the reaction window at the cost of a larger tail-latency bound.
Figure 13: A True Incast Burst: This deliberately worst-case fan-in scenario sends 256 sources at 50 GB/s toward one 400 Gb/s (50 GB/s) egress with a 32 MB buffer. The 12.8 TB/s offered load oversubscribes the destination egress by 256×. Flat aggregation or synchronized reads can create this pattern; bandwidth-optimal ring AllReduce does not, because each rank exchanges point-to-point chunks.
Synchronized ML traffic is susceptible to both true fan-in and shared-egress hot spots. When a layer finishes backward computation, many ranks can inject traffic at once, and flat or hierarchical aggregation phases can create true fan-in. Production clusters mitigate both cases along three complementary dimensions:
Time. Layer-staggering triggers each gradient bucket’s AllReduce as soon as backpropagation produces it. Final-layer gradients reduce while earlier layers are still computing, so communication is spread across the backward pass instead of released as one synchronized burst. The same staggering is communication-computation overlap, so it also hides transfer time behind the backward computation that remains.
Space. Collective algorithm selection bounds fan-in at individual switch ports. Hierarchical and rail-local reductions aggregate gradients in stages so that no single port must absorb all senders at once, and topology-aware placement keeps concurrent ring flows off oversubscribed ports.
Priority. Quality of service (QoS) classification tags gradient traffic with the highest service class to reduce interference from background storage or management traffic; shared links, buffers, and arbitration still constrain isolation.
These mitigations spread the burst in time, space, and priority, but they do not eliminate congestion or tail latency. The question becomes how to build end-to-end clusters that perform despite these realities.
Self-Check: Question
In a RoCEv2 fabric, what is ‘congestion spreading’, which stalls victim flows, and what mechanism causes it?
Optical dispersion in fiber cables causing packet corruption across adjacent wavelength channels
High ambient temperatures in switch chassis causing SerDes circuits to throttle line rates across all ports
Software hypervisors duplicating tenant packets across multiple Virtual Functions
Priority Flow Control (PFC) PAUSE frames propagating upstream from a single congested egress port, filling upstream switch buffers and pausing unrelated flows that share those intermediate switches
How does High Precision Congestion Control (HPCC) achieve faster convergence and lower queue buildup during incast bursts compared to DCQCN?
HPCC drops all out-of-order packets at the edge switch and forces senders to switch to TCP cubic
HPCC uses In-Network Telemetry (INT) to append precise switch queue depth, link utilization, and timestamps to packet headers, allowing senders to estimate available capacity and adjust rates rapidly
HPCC disables Priority Flow Control and relies exclusively on application-level checkpointing to tolerate packet loss
HPCC increases switch buffer sizes to \(10\text{ GB}\) per port to eliminate the possibility of buffer overflows
During a synchronized fan-in phase such as flat gradient aggregation, describe the physical conditions that create the ‘incast problem’ at a switch port, and calculate the time required to overflow a \(32\text{ MB}\) switch buffer when 256 GPUs each transmit at \(50\text{ GB/s}\) toward a single \(50\text{ GB/s}\) (\(400\text{ Gb/s}\)) egress port.
Why does packet spraying improve fabric bisection bandwidth utilization in InfiniBand networks, and why is standard Ethernet historically hesitant to use it?
Packet spraying distributes individual packets of an elephant flow across all available equal-cost paths to eliminate hash collisions; suitable InfiniBand implementations support this through routing and endpoint ordering mechanisms, whereas standard Ethernet avoids reordering due to the high software/NIC cost of reassembly
Packet spraying encrypts packets with unique keys across paths, which InfiniBand decrypts in hardware while Ethernet lacks AES accelerators
Packet spraying routes packets over wireless backup links, which Ethernet switches do not support
Packet spraying reduces packet header size from 40 bytes to 4 bytes, doubling Ethernet wire efficiency
Place the following events in order to illustrate how an incast burst escalates into a cluster-wide PFC congestion storm in a RoCEv2 fabric:
The downstream switch buffer reaches its high-water mark and emits PFC PAUSE frames upstream
Upstream switches pause their transmission queues, causing their own ingress buffers to fill with traffic destined for other ports
Multiple GPU senders simultaneously initiate flat-aggregation transfers targeting a common aggregation node
Second-tier upstream switches emit PAUSE frames to unrelated sender nodes, freezing victim flows across the fabric
The common destination switch egress queue is oversubscribed by the combined line-rate traffic
The final level of the stack is cluster design, where wires, transport, topology, and congestion control combine into a coherent system. The goal of cluster design is to provide an end-to-end gradient bus that makes thousands of distributed GPUs feel like a single machine. At this level, the abstraction layers collapse into concrete engineering decisions: which cables to buy, how to wire the racks, which protocol to deploy, and how to validate that the resulting fabric delivers the bandwidth the training job expects. Two representative large-scale architectures, one built on InfiniBand and one on Ethernet, illuminate the trade-offs that define ML infrastructure (NVIDIA 2023; Meta Engineering 2024; Gangidi et al. 2024).
3.7.1 The GPU-to-GPU “gradient bus”
In a well-designed cluster, the network fabric acts as a scheduler-aware extension of the system bus, not a passive pipe. The ~9× per-direction cliff between NVLink and one external port, measured at the start of this chapter, is the gap the cluster must hide. Communication-computation overlap, which the Fleet Law credits as \(\OverlappedTime\), is the first mechanism for hiding it, through the same layer-staggered AllReduce launch that spreads incast bursts in section 3.6.5. Overlap cannot hide the last mile of the exchange, because the gradients computed at the end of backpropagation have little computation left behind which to hide their transfer (Communication-Computation Overlap).
Placement is the second mechanism, because it decides which communication crosses each boundary. The placement that the bandwidth hierarchy of Bandwidth hierarchy sets, tensor parallelism inside the NVLink domain with pipeline stages and data-parallel replicas spanning nodes, becomes a wiring rule at cluster scale, because each fabric tier must be provisioned for the traffic placed on it. The links between nodes must meet the pipeline’s activation-transfer budget, which physical adjacency alone does not guarantee. The full fabric carries the data-parallel exchanges, which gradient accumulation makes less frequent and overlap partly hides. Production designs therefore differ mainly in how they provision that outermost tier, as the two that follow show.
3.7.2 NVIDIA DGX SuperPOD architecture
The NVIDIA DGX SuperPOD, a concrete implementation of the gradient bus, provisions the outermost tier by obtaining losslessness from the link layer and aligning the wiring with the data-parallel ranks, so that the fabric’s tail behavior depends on hardware mechanisms rather than on congestion tuning. It connects DGX H100 nodes using an NDR InfiniBand network (NVIDIA 2023). Each node acts as a dense compute island, with eight H100 GPUs connected via NVSwitch to provide 900 GB/s of internal bandwidth. Externally, each GPU pairs with a ConnectX-7 NIC delivering 400 Gb/s of injection bandwidth. Across a standard scalable unit of 32 nodes (256 GPUs), this yields an aggregate injection bandwidth of 12.8 TB/s (256 \(\times\) 50 GB/s), the rate the scalable unit can offer the fabric when every GPU transmits at once.
NVIDIA. 2023. NVIDIADGXSuperPOD: Next Generation Scalable Infrastructure for AI Leadership. RA-11333-001 V11. NVIDIA.
This architecture connects all five levels of the network model into a single chain. At the wire (Level 1), it standardizes on 400 Gb/s NDR links, choosing copper or optics by the reach between each node and its leaf and between leaf and spine. Because those links run InfiniBand’s native credit-based flow control at the transport layer (Level 2), they provide a lossless medium without the pause-cascade fragility of Ethernet PFC. Above the transport, the topology (Level 3) arranges the switches as a rail-optimized fat-tree, aligning GPU rails across each scalable unit so that same-rail traffic stays close while cross-rail traffic traverses the spine layer (replacing the simpler per-rack ToR allocation used earlier to illustrate switch radix). When cross-rank traffic climbs to the spine, hardware-based adaptive routing (Level 4) selects among spine paths to preserve bisection behavior. Finally, at the cluster level (Level 5), additional switching joins multiple SuperPOD scalable units into larger fleets (NVIDIA 2023): for the 175B-parameter model, four SuperPOD scalable units wire together so that 1,024 GPUs function as a single synchronous instrument.
3.7.3 Meta Grand Teton platform
Meta’s Grand Teton clusters take the opposite approach, accepting Ethernet’s congestion-tuning burden in exchange for multi-vendor supply and shared operations. Meta disclosed two Grand Teton-based 24,576-H100 clusters: one using RoCE over an Arista/OCP Ethernet fabric and one using NVIDIA Quantum-2 InfiniBand, both with 400 Gb/s endpoints. Meta used both for Llama 3 training and reported ongoing Llama 3 training on the RoCE cluster (Meta Engineering 2024). Ethernet lets Meta source switches from multiple vendors and reuse the optical infrastructure and management tooling of its front-end serving fleet, avoiding the operational silo of a dedicated InfiniBand island.
Meta Engineering. 2024. Building Meta’s GenAI Infrastructure. Engineering at Meta Blog.
Meta’s RoCE study shows how Level 4 choices affect the complete fabric. It describes PFC watchdogs for long-duration pause events, iterative routing designs beyond plain ECMP, future-oriented flowlet switching experiments, and a 400G deployment in which DCQCN tuning proved difficult enough that Meta proceeded without DCQCN while relying on PFC plus higher-layer collective controls (Gangidi et al. 2024). The lesson is to validate the combination of endpoint behavior, routing, and flow control under the intended collective traffic. Large-transfer throughput alone does not establish small-message latency or recovery tails, and those results cannot be inferred from the Ethernet or InfiniBand label. Small-message latency matters in training through frequent small exchanges, which expose startup cost even when a full step lasts seconds, and in serving to a degree set by model partitioning, request shape, and service-level objectives (SLOs).
These case studies close the five-level stack by showing how the physical wire, transport protocol, topology, and congestion controls become one production fabric. The remaining operational problem is not how to build a single fast cluster, but how to share that expensive substrate across teams and workloads without sacrificing the predictable performance that training demands.
Self-Check: Question
In a 3D-parallel training architecture (combining Tensor, Pipeline, and Data Parallelism) across a cluster of 8-GPU nodes, how should each parallelism dimension be mapped to the network hierarchy to optimize communication efficiency?
Data Parallelism within the node over NVLink, Pipeline Parallelism across the leaf switches, and Tensor Parallelism across the core spine switches
Tensor Parallelism within the node over high-bandwidth NVLink, Pipeline Parallelism across immediate inter-node links, and Data Parallelism across the cluster fabric with backward-pass overlap
Tensor Parallelism across the multi-hop core network, Data Parallelism within the CPU socket, and Pipeline Parallelism over PCIe storage buses
All three parallelism dimensions mapped uniformly across all network tiers using round-robin flow allocation
Why can communication-computation overlap not hide the last mile of the gradient exchange in distributed training, and what does that leave on the critical path?
What is the primary operational and architectural motivation for Meta adopting RoCEv2 over commodity Ethernet in its Grand Teton clusters rather than dedicated InfiniBand?
RoCEv2 provides lower physical-layer forward error correction latency than InfiniBand
Ethernet cabling is physically immune to transceiver symbol errors
Commodity Ethernet enables multi-vendor switch and optics sourcing, supply chain resilience, and unified management tooling with web serving infrastructure, despite requiring careful PFC and routing tuning
InfiniBand switches cannot support link rates exceeding \(100\text{ Gb/s}\)
True or False: An NVIDIA DGX SuperPOD scalable unit eliminates inter-node optical transceiver costs by connecting all 32 DGX nodes in the scalable unit using passive direct-attach copper cables to the core spine switches.
When a single training job leaves racks or spine links idle between runs, operators carve the cluster among multiple tenants and jobs, only to discover that a neighbor’s checkpoint burst or evaluation sweep can starve a synchronous AllReduce across shared NICs and switch buffers. Network virtualization must make sharing compatible with bandwidth allocations, latency targets, and access isolation. These requirements interact because tenants still share physical links and buffers. A proposed policy might reserve 80 percent of the cluster’s \(\BisectionBandwidth\) for training and allocate the remaining 20 percent to inference and preprocessing. Enforcing that policy requires admission control and compatible scheduling along the relevant paths; a virtual NIC or separate traffic class alone does not guarantee the end-to-end share.
3.8.1 Hardware NIC virtualization with SR-IOV
Routing multi-tenant traffic through a hypervisor’s software virtual switch reintroduces the exact host-CPU overhead and microsecond jitter that RDMA was built to bypass. Cloud providers instead expose NIC resources to virtualized GPU instances through single-root I/O virtualization (SR-IOV), a standard that allows a physical NIC to present multiple virtual functions (VFs). Each VF exposes its own hardware queues, doorbell registers, and DMA mappings, which software can assign to a workload. A directly assigned VF can remove host software mediation from the active DMA path, while drivers and virtualization software still configure access and manage the device. Performance depends on the NIC, I/O placement, and competing traffic. Because VFs share physical resources, placement logic must reserve NIC capacity and QoS policy alongside GPUs rather than treat the network as an unbounded pool.
However, hardware-level isolation still needs explicit bandwidth policy. SR-IOV exposes multiple VFs that share the NIC’s physical resources; administrators can add per-VF or per-group QoS policies to cap or guarantee bandwidth, such as assigning eight VFs 50 Gb/s each on a 400 Gb/s NIC. For the 175B-parameter model training on a multi-tenant cluster, that configured partitioning can prevent a neighboring tenant from stealing bandwidth, but it also enforces a hard ceiling on peak throughput. The training job must be architected to operate within this slice, as no amount of software optimization can burst beyond the configured VF limit.
3.8.2 Traffic isolation and quality of service
Per-VF rate caps bound what each tenant injects at the NIC, but traffic from different tenants still merges on the fabric’s shared switch buffers and spine links. When the 175B model is midway through a gradient AllReduce and a neighboring job initiates a 100 GB checkpoint save, that burst occupies a 400 Gb/s port for 2 s at full line rate and can claim a large share of the shared spine links for that interval, stretching every AllReduce whose traffic crosses them. To prevent this noisy-neighbor effect inside the fabric, high-performance switches rely on quality of service (QoS) mechanisms that enforce fairness at the packet and queue level.
InfiniBand isolates traffic through virtual lanes (VLs), which maintain separate credit and buffer state within a physical link across up to 16 lanes (one of them reserved for subnet management) (InfiniBand Trade Association 2000); if a storage burst exhausts the credits of its own lane, a gradient lane with available credits can continue transmitting, even though both lanes still share link bandwidth and arbitration. Ethernet and RoCE fabrics achieve a similar separation through device-dependent traffic class mappings and queue policies, where enhanced transmission selection allocates service among traffic classes and switches may also partition buffer and forwarding resources into network slices. Across both stacks, these mechanisms reduce interference only when classification, resource allocation, and scheduling agree along the entire path, because shared priorities or buffer pools can still couple tenants.
Virtualization solves the sharing problem but makes performance diagnosis harder. When a training job slows down on a multi-tenant cluster, the cause could be a physical link degradation, a noisy neighbor exceeding its bandwidth allocation, or a misconfigured QoS policy. Systematic monitoring is essential to distinguish these cases.
Self-Check: Question
How does Single Root I/O Virtualization (SR-IOV) enable near-bare-metal RDMA performance in multi-tenant cloud GPU environments?
It allows a physical NIC to present multiple independent Virtual Functions (VFs) directly to guest VMs or containers, bypassing the host hypervisor and OS kernel for DMA operations
It emulates a 10 GbE software NIC inside the KVM kernel module to buffer gradient bursts
It compresses tenant network streams using the host CPU’s AVX-512 vector units before transmission
It dynamically converts InfiniBand packets into TCP/IP frames at the virtual switch layer
Explain how Virtual Lanes (VLs) in InfiniBand (or Traffic Classes in RoCEv2) reduce the impact of a multi-gigabyte storage checkpoint burst on the iteration time of an active distributed training job on a shared cluster.
True or False: Configuring SR-IOV Virtual Functions (VFs) with strict bandwidth limits (such as capping each VF at \(50\text{ Gb/s}\) on a \(400\text{ Gb/s}\) NIC) allows a training job to dynamically burst up to \(400\text{ Gb/s}\) during AllReduce if other VFs on the host are idle.
In InfiniBand fabrics, traffic isolation is achieved using independent logical channels called ______, which maintain separate credit-based buffer management on the same physical link.
Network performance problems in ML clusters are insidious because they show up as silent waste rather than explicit failures. A degraded transceiver causing a 10 percent reduction in effective bandwidth might slow each training iteration by only 2–3 percent. The slowdown is small because the lost bandwidth stretches only the exposed communication share of the step (the 30 percent assumed in the oversubscription estimate, less whatever overlap hides), and stretches it by roughly the inverse of the bandwidth that remains. A drift that small is easily masked by the natural variance of checkpointing or data loading. Over a 30-day training run on 1,024 GPUs, this invisible drag accumulates to roughly 15,000–22,000 wasted GPU-hours, burning about $30,000–$44,000 at $2/GPU-hour without triggering a single alarm. Traditional IT monitoring tools like SNMP or ICMP ping measure connectivity, not the sustained throughput required by RDMA. Effective observability requires a three-layer approach: physical monitoring (FEC errors, signal attenuation), transport monitoring (PFC pause frames, retransmission rates), and application monitoring (NCCL algorithmic bandwidth) (Jeaugey 2017; Gangidi et al. 2024). The three layers retrace the five-level model from the top down. Application monitoring observes the collective that Level 5 integrates, transport monitoring observes the Level 2 recovery and Level 4 congestion machinery, and physical monitoring observes the Level 1 wire. Only by correlating signals across these layers can operators detect that a “slow training run” is caused by a single degraded cable in one rack.
Hardware counters test whether the deployed path still behaves as assumed. Switch and NIC port counters report transmitted and received data, transmit discards, symbol errors, and link-down events; on InfiniBand a utility such as perfquery reads them, and Ethernet/RoCE devices expose the equivalent telemetry through their own management interfaces (Linux man-pages project 2026). Data counters measure utilization, discards warrant investigation against the port’s traffic and recovery policy, and symbol errors and link-down events are evidence of a degrading signal. Correlating those counters with link rate, lane state, and transport behavior narrows the cause; a counter alone does not identify a defective cable or transceiver.
Linux man-pages project. 2026. Perfquery(8): Query InfiniBand Port Counters on a Single Port.
Polling link state alongside traffic counters can reveal silent degradation. A link operating at HDR (200 Gb/s) rather than the expected NDR rate (400 Gb/s) can remain connected while offering half the expected bandwidth. A link that trains with two of its four lanes active after a connector fault fails the same way: it stays up while its bandwidth is halved. Both cases are visible only when negotiated rate and lane state are compared with the deployment baseline. For 1,024 GPUs and roughly 3,000 links, the assumed 0.1 percent point-in-time degradation probability gives 3 degraded links in expectation and, under independent events, a 95 percent probability of at least one degradation. This probability measures something different from the daily figure in notebook 3.4. That notebook asks how often a new degradation begins; this one asks how many degraded links are present at any moment. Standing prevalence is roughly the onset rate times how long a degraded link stays in service, and silent degradation, by definition, stays in service until someone looks, so prevalence can far exceed what a small daily onset rate suggests. Both rates are scenario assumptions rather than measured fleet data. A job slows when an affected path limits its required traffic; fleet-wide exposure alone does not determine the job’s slowdown. When the degraded link lies on a ring AllReduce’s path, however, the cost reaches every participant, because each round waits for its slowest hop and the whole ring proceeds at the pace of that one link.
↪ Gray failure, the general case of a component that degrades without failing, and why a synchronous job feels it as a straggler, is developed in Stragglers versus fail-stop failures.
3.9.2 Bandwidth and latency validation
Validation must test the bandwidth and latency the job can use, even when counters show no visible fault. The raw NDR rate of 50 GB/s is a reference ceiling; payload throughput also depends on protocol overhead and the complete host-to-host path. Pairwise tests such as ib_write_bw can populate an all-pairs bandwidth matrix, or a sampled subset for a large fleet (linux-rdma project 2026). A low-throughput pair identifies a path to investigate. Comparing the affected pairs with routing and physical telemetry helps distinguish a shared switch or cable problem from endpoint limitations.
For latency-sensitive synchronization, ib_write_lat runs a ping-pong test with small RDMA writes and reports half the measured round-trip time as one-way latency. Values such as 2 \(\MicroUnitPrefix\)s, 5 \(\MicroUnitPrefix\)s, or 100 \(\MicroUnitPrefix\)s must be compared with a baseline for the same endpoints, message size, path, and load; they are not universal fault thresholds or evidence of a particular fallback. Application-level tests such as nccl-tests then exercise collective communication across the intended worker group. Point-to-point results establish a path baseline, while collective tests reveal costs from concurrent traffic and scheduling that isolated pairs cannot expose.
3.9.3 Systematic debugging workflow
When a training job reports lower-than-expected throughput, the diagnostic order should preserve the layer model rather than starting with cables. The following sequence moves from application symptoms toward physical causes:
Check GPU utilization: Rule out compute bottlenecks with accelerator telemetry (nvidia-smi, for example). High SM utilization alone does not rule out a network bottleneck, because communication kernels can also keep SMs active. Correlate utilization with the compute and collective portions of the step timeline. Low utilization does not automatically implicate the fabric, however. A starved input pipeline (data loading or storage) produces the same symptom, so confirm the data path is keeping the accelerators fed before investigating the network.
Inspect collective-library logs: Enable the library’s debug output (NCCL_DEBUG=INFO in NCCL, for example) to reveal which network transport was selected, the detected bandwidth between nodes, and any fallbacks to slower protocols.
Run point-to-point tests: Run a pairwise bandwidth test (such as ib_write_bw) between specific nodes in the job. A single degraded link can bottleneck the entire ring in a ring AllReduce.
Check PFC/ECN counters: Inspect switch counters along the path. Sustained PFC activity indicates persistent congestion that should be investigated at the scheduler or routing level.
Validate physical layer: Check symbol errors and CRC counts to identify failing transceivers or cables.
In this order, application symptoms identify the failing path, transport counters show whether congestion or fallback is involved, and physical telemetry confirms whether the wire itself is degrading. Applying the sequence to a concrete slowdown shows how each layer narrows the search before any hardware is replaced.
Checkpoint 3.5: Diagnosing a training slowdown
Your 175B model training job has been running for 3 days on the 1,024-GPU reference cluster. You notice that the iteration time has gradually increased from 4.2 s to 4.8 s (a 14 percent slowdown). The GPU utilization reported by nvidia-smi has dropped from 92 percent to 85 percent.
Self-Check: Question
A training job has slowed by a few percent. On one link, the port counters show a rising symbol-error count, and its data counters show lower throughput than links serving comparable traffic. What does this counter evidence establish on its own?
The transceiver on that link is defective and must be replaced before the job resumes
The link is a candidate cause, to be confirmed by correlating its negotiated rate, lane state, and transport behavior with the job’s slow collective
The fabric is congested, so PFC and ECN thresholds must be retuned
Nothing useful, because port counters cannot reflect training performance
Explain the concept of ‘silent degradation’ in an AI cluster fabric, give a concrete physical example of how it occurs, and describe its economic impact on a large synchronous training run.
What is the primary purpose of constructing an ‘All-Pairs Bandwidth Matrix’ before launching a distributed training job?
To run point-to-point bandwidth benchmarks (such as ib_write_bw) across all node pairs and visualize a heatmap of underperforming node pairs that warrant investigation of paths and endpoints
To pre-allocate GPU memory buffers for all possible tensor-parallel communication patterns
To calculate the exact gradient loss trajectory of the neural network architecture
To calibrate the clock frequency of the CPU PCIe root complex
Order the recommended diagnostic steps when investigating an unexpected slowdown in a multi-node GPU training job, moving from application symptoms down to physical causes:
Inspect switch PFC pause and ECN congestion counters along the network path
Run point-to-point RDMA bandwidth tests (ib_write_bw) between candidate nodes
Check GPU compute and SM utilization (using nvidia-smi or dcgmi)
Validate physical layer health by checking symbol errors and CRC discard counters
Enable NCCL debug logging (NCCL_DEBUG=INFO) to identify transport selection and detected topology
True or False: In a healthy, properly configured lossless InfiniBand or RoCEv2 fabric, the PortXmitDiscards counter on switch ports should periodically increment under heavy AllReduce traffic to signal senders to back off.
Monitoring keeps deployed fabrics honest, but it cannot push past the physical ceilings it measures, such as the reach and power limits that copper approaches at high signaling rates. New fabric technologies earn attention only when they move one of those bounds. As clusters scale toward 100,000 nodes, the durable design variables are power per bit, reach, and the ratio of compute to memory to network capacity, not the product names attached to a particular roadmap.
3.10.1 Protocol convergence and link density
Standard RoCEv2 forces operators to wrestle with fragile PFC pause thresholds and ECMP hash collisions that were never designed for synchronized elephant flows, while InfiniBand locks the fabric into a single-vendor stack. The Ultra Ethernet Consortium (UEC) addresses these reliability and load-balancing limits for AI/HPC traffic over Ethernet. Its Ultra Ethernet Transport design combines packet spraying across multiple paths, flexible ordering, multiple transport delivery services, congestion-control changes, and telemetry (Ultra Ethernet Consortium 2025). The architectural question is how the selected service delivers the required completion and ordering semantics under congestion or loss. Packet trimming (cutting an overflowing packet down to its header instead of dropping it, so the receiver learns of the loss at once), retry, and endpoint recovery should therefore be judged by their effect on completion-time tails and resource cost, rather than by whether the design reproduces a lossless-fabric mechanism.
Broadcom Inc. 2025. Broadcom Ships Tomahawk 6: World’s First 102.4 Tbps Switch. Broadcom press release.
Higher switch capacity attacks hop count as well as raw bandwidth. XDR InfiniBand pushes 800 Gb/s per port, and Ethernet roadmaps include 800GbE and 1.6TbE link speeds (NVIDIA 2026c; Ethernet Alliance 2025). Ethernet switch silicon with 1.6 Tb/s ports pushes aggregate capacity to 102.4 Tb/s in current Tomahawk 6-class designs (Broadcom Inc. 2025). A single 1.6 Tb/s port delivers the bandwidth of 4 400G ports, so the same ASIC can instead expose 4 times as many 400G ports. Spending that capacity on radix rather than port rate is what flattens the topology, because fat-tree host count grows as \(\SwitchRadix^2/2\) at two tiers and \(\SwitchRadix^3/4\) at three. A cluster that previously required three tiers of switches may then be served by two when radix, port rate, and placement constraints line up, potentially reducing the number of optical links and switching stages. The transceiver savings require explicit port and cable accounting; removing one tier does not automatically halve the module count, and the latency benefit depends on the resulting paths and traffic.
3.10.2 Optical interconnects
Each extra meter pushes the fabric from copper toward optics.
Optical interconnects attack the power-per-bit and reach terms that copper makes worse as data rates increase. Each doubling of the per-lane signaling rate, from the 100 Gb/s-class lanes of current NDR and 800G Ethernet ports to the 200 Gb/s class now arriving, raises the insertion loss per meter of passive copper. The usable reach shrinks, as the link-budget example in section 3.3.3 showed, and the SerDes must spend more energy per bit on equalization to recover the signal. Active electrical cables, which add retimer chips to regenerate the signal mid-cable, extend that reach but add latency and power of their own.
Co-packaged optics (CPO) places optical engines close to the switch or accelerator on a shared package substrate. Moving the optical engine from the switch faceplate to the package shortens the SerDes-to-optics electrical path from centimeters of board trace to millimeters, which reduces the signal-conditioning burden before transmission over fiber. The receiving optical engine converts the signal back to electrical form. Fiber still introduces propagation delay and has a loss budget; packaging the optics closer to the processor does not remove those constraints.
Co-packaged optics therefore changes the electrical portion of the link budget while retaining the reach advantages of optical transmission. Usable reach still depends on the fiber, connectors, optical power, and receiver design. The relevant comparison holds payload capacity and error targets fixed, then measures the power saved by the shorter electrical path against the packaging and maintenance costs of integration. The power side of that comparison can be estimated port by port for a single switch.
Napkin Math 3.5: The optical dividend
Problem: Calculate the power savings of moving a 51.2 Tb/s switch from pluggable transceivers to co-packaged optics.
Pluggable architecture: 128 ports \(\times\) 20 W = 2.56 kW for optics alone.
CPO architecture: 128 engines \(\times\) 10 W = 1.28 kW.
Savings: The savings reach 1.28 kW of power per switch.
Systems insight: Across 1,000 switches, the assumed pluggable modules consume 2.56 MW. The modeled CPO configuration saves 1.28 MW, equivalent to the reference power budget of roughly 1,800 H100 GPUs. That equivalence measures the scale of the saving; using it for additional accelerators also requires compute capacity, power delivery, and cooling in the right locations. Optics power constrains both operating cost and the equipment a facility can support.
The spine example for 10,000 GPUs assigns 400 kW to pluggable optics. That subtotal counts only the selected spine-side endpoints. Applying the same fractional saving to those endpoints would require a CPO implementation with the assumed per-port power and capacity; opposite-end optics remain outside the comparison. Integration also changes serviceability: replacing a failed optical component may involve a larger assembly than swapping a pluggable module. The energy benefit must be evaluated alongside packaging, repair, and spare-capacity costs.
For ML infrastructure, CPO could flatten the bandwidth hierarchy by narrowing the gap between intra-node and inter-node bandwidth. If inter-node links achieve bandwidth comparable to NVLink-class local fabrics (hundreds of GB/s per GPU), the bandwidth penalty for extending tensor parallelism beyond a single node would shrink. Cross-node tensor parallelism would then become economical for more workloads, provided that startup latency and collective frequency also fit the step-time budget.
However, CPO introduces new challenges. Optical components are sensitive to temperature (laser wavelength shifts with temperature, requiring active thermal management), and integrating photonics on the same package as a 1,000 W GPU creates a hostile thermal environment for the optical components. The manufacturing processes for silicon photonics and CMOS transistors are similar but not identical, requiring separate fabrication steps that increase package cost and complexity. Hybrid integration, which places the photonics chiplet on a cooler region of the package substrate and thermally isolates it from the GPU die, is one way to manage that environment, at the cost of a longer electrical path than full co-location.
3.10.3 Disaggregated and composable architectures
A fixed node configuration can leave compute or memory underused when workloads need different resource ratios. Compute Express Link (CXL) memory pooling allows supported hosts to access assigned memory capacity through a CXL path, while disaggregated designs make some resource allocations independent of the chassis boundary. This changes which links lie on the workload’s critical path. It does not merge CXL memory access, NVLink communication, and InfiniBand transport into one interchangeable service; each path retains its own supported operations, bandwidth, and latency.
↩︎ CXL memory pooling, which makes node memory capacity less rigid but remains a capacity tier rather than a high-bandwidth memory (HBM) replacement, is established in Compute express link (CXL).
A composed node therefore needs a new traffic budget. The \(\MessageStartupLatency\)-\(\LinkBandwidth\) distinction between startup and transfer cost remains useful, but each path requires its own parameters and access model. Remote memory traffic can compete with other transfers, and fine-grained dependent accesses can expose latency that a bulk-bandwidth estimate hides. Disaggregation improves resource flexibility only when these added costs fit the workload’s execution budget. Composition relocates the synchronization backbone onto new paths rather than eliminating it.
Self-Check: Question
How does Co-Packaged Optics (CPO) physically reduce interconnect power consumption compared to traditional pluggable optical transceivers?
It replaces optical lasers with superconducting RF antennas that operate without electrical resistance
It integrates silicon photonics directly onto the processor or switch package substrate, shortening the electrical SerDes trace from centimeters to millimeters and eliminating power-hungry signal conditioning
It removes the need for fiber optic cables by transmitting data through free-space infrared beams inside the server rack
It downsamples 16-bit floating-point tensors to 1-bit integers directly inside the optical waveguide
How does increasing switch ASIC capacity to \(102.4\text{ Tb/s}\) with \(1.6\text{ Tb/s}\) ports impact the topology and latency of a multi-thousand GPU cluster compared to building the same cluster with \(400\text{ Gb/s}\) switches?
What is the primary design goal of the Ultra Ethernet Consortium (UEC) transport specification for AI and HPC workloads?
To mandate standard TCP Reno congestion control across all high-performance computing clusters
To replace physical Ethernet cabling with proprietary wireless mesh interconnects
To develop an open, multi-vendor Ethernet transport featuring multi-path packet spraying, flexible packet ordering, and improved congestion control and recovery to reduce reliance on PFC
To deprecate GPU-to-GPU direct memory access in favor of host CPU centralized message queues
True or False: Disaggregated composable architectures using CXL memory pooling eliminate the \(\alpha\)-\(\beta\) communication costs between processors and remote memory pools.
Designing and operating high-performance fabrics for ML requires unlearning assumptions from traditional data-center networking. The following fallacies and pitfalls capture the most common errors that stall training and degrade cluster productivity.
Fallacy: More bandwidth always means faster training.
Engineers assume upgrading from HDR (200 Gb/s) to NDR (400 Gb/s) will yield proportional gains, but the \(\MessageStartupLatency\)-\(\LinkBandwidth\) model (section 3.4.4) reveals this is only true in the bandwidth-dominated regime. For small models or the small-message phases of pipeline parallelism, the startup term \(\MessageStartupLatency\) (1.5 μs in this chapter’s NDR scenario, including NIC processing, switch hops, and FEC) dictates performance. If a workload is latency-bound, a 2\(\times\) bandwidth increase may deliver only a small fraction of the line-rate gain while adding substantial power and transceiver cost.
Consider a 10 KB message (typical for control synchronization). On 200 Gb/s InfiniBand, it takes 1.90 μs. Upgrading to 400 Gb/s reduces this to 1.70 μs, a 10.5 percent improvement despite doubling the link rate.
Fallacy: Lossless Ethernet is as reliable as InfiniBand.
RoCE over Ethernet can achieve throughput comparable to InfiniBand for large transfers, but lossless operation depends on the configuration and interaction of PFC, ECN, routing, buffers, and NIC behavior (section 3.6.1). A forwarding loop, cyclic buffer dependency, or firmware defect can trigger a PFC storm, where PAUSE frames spread beyond the original queue. InfiniBand’s per-hop credit mechanism avoids this specific reactive PAUSE-frame cascade, but the fabric still requires deadlock-free routing, sound virtual-lane configuration, and congestion management (InfiniBand Trade Association 2000). Both fabrics require validation and telemetry; RoCE adds particular sensitivity to the configuration of Ethernet losslessness. Procurement should therefore compare complete transport stacks rather than link rates, because the stack determines where flow-control state and operational risk reside even when nominal rates match.
Pitfall: Accepting data-center oversubscription ratios for synchronous training.
Oversubscription relies on the traffic crossing a shared boundary fitting its available capacity. Bulk-synchronous training can violate that assumption with coordinated bursts. In the cut-saturating scenario of section 3.5.2, 4:1 oversubscription increases the modeled communication bound by 4×. Applied to a $300M cluster with the assumed 30 percent communication fraction, the resulting idle-capacity estimate exceeds $142.1M. This is an equivalent-capacity comparison under the stated schedule, not an equipment loss or a universal penalty for every collective.
Fallacy: TCP bandwidth tests are sufficient for ML fabric validation.
Standard benchmarks like iperf measure kernel-based TCP/IP performance. TCP throughput depends on host processing, offloads, and tuning as well as wire speed; it has no fixed throughput ceiling independent of that configuration. An RDMA training job exercises a different data path, so a low TCP result does not establish that the RDMA path is slow, and a high TCP result does not validate collective performance. Validation protocols must use RDMA-specific tools from the perftest suite to match the workload’s data path.
Pitfall: Relying on adaptive routing instead of topology-aware placement.
Adaptive routing can distribute traffic across available paths, but it cannot increase their total capacity. For a 1,024-GPU job spanning two oversubscribed spine groups, the group-to-group links become limiting when the collective sends more crossing traffic than those links can carry within its time budget. Placement can reduce that traffic, and routing can reduce path imbalance. Both must be evaluated against the actual collective schedule.
↪ Topology-aware gang placement that keeps collective traffic off contended cross-rack paths is developed in Placement algorithms.
Fallacy: Network fabric problems always appear as hard failures.
Network performance issues in ML clusters often show up as subtle training slowdowns rather than errors, because jobs continue to run while gradients arrive late. The silent-waste estimate in section 3.9 shows how a small bandwidth loss accumulates into wasted GPU-hours over a long run without raising a single alarm. Detection therefore depends on comparing delivered throughput with a baseline, not on waiting for an error.
Pitfall: Treating PFC and ECN counters as optional production details.
Discard counters and PFC pause durations should be correlated with collective completion time and the affected paths. Rising values can reveal queue pressure or recovery activity, but they do not establish a failing transceiver or predict an inevitable job failure. Physical error counters, traffic load, routing, and configured watchdog actions help distinguish the causes and select a response.
Self-Check: Question
Why is using standard TCP benchmark tools like iperf to validate an ML cluster network fabric considered a major operational fallacy?
iperf measures the TCP path, whose throughput depends on host processing, offloads, and tuning; it does not validate the RDMA path exercised by distributed training
iperf only operates over wireless IEEE 802.11 interfaces and cannot bind to physical QSFP56 ports
iperf automatically enables InfiniBand credit-based flow control on standard Ethernet switches
iperf encrypts all network packets with 4096-bit RSA keys, causing false GPU thermal throttling
An infrastructure team claims: ‘Adaptive routing completely eliminates the need for topology-aware job placement in our GPU cluster.’ Why is this assertion a critical pitfall?
Adaptive routing only functions when all GPU servers are manufactured by the same vendor
Adaptive routing disables link-layer CRC error checking on optical switches
Adaptive routing forces all AllReduce operations to execute sequentially across a single ring
Adaptive routing balances traffic across existing paths, but it cannot synthesize bisection bandwidth that does not exist if a job is split across an oversubscribed or constrained network boundary
Explain why upgrading an InfiniBand fabric from HDR (\(200\text{ Gb/s}\)) to NDR (\(400\text{ Gb/s}\)) yields less than a \(15\%\) reduction in transfer time for a \(10\text{ KB}\) control message, and state the condition under which bandwidth upgrades deliver linear performance gains.
True or False: Lossless RoCEv2 Ethernet fabrics provide the exact same operational simplicity and fault immunity as InfiniBand fabrics because both support zero-packet-loss guarantees.
The five-level model of figure 3 bridges physical reach, transport primitives, switch topologies, congestion dynamics, and cluster integration into a single system contract. A fabric must provide both enough capacity for the workload’s traffic and predictable completion at its synchronization boundaries. InfiniBand and RoCE distribute this responsibility differently across links, endpoints, and operational policy; the production cases show why neither port rate nor protocol name determines delivered performance.
Three numerical anchors show how to apply the model. One GPU’s NVLink bandwidth exceeds its own external port’s per-direction bandwidth by 9×; the modeled NDR path has equal startup and transmission costs near 75 KB; and the 4:1 oversubscribed cut increases the fixed-payload transfer bound by 4×. Each result depends on its stated configuration and traffic assumptions. In the Fleet Law, transfer time contributes to \(\CommunicationTime(\DeviceCount)\) and residual synchronization waiting to \(\SynchronizationTime(\DeviceCount)\); consistent timeline accounting prevents counting one delay in both. The communication and coordination axes of C³ meet where those dependencies determine useful compute progress.
The same model guides design and diagnosis. Message sizes determine whether startup latency or bandwidth dominates; communication patterns determine which paths must carry that traffic. During operation, application throughput, transport counters, and physical telemetry distinguish inadequate capacity from contention or a degraded component. These measurements also test whether a proposed optical or composable architecture removes the binding constraint or merely moves it.
Key Takeaways: The fabric decides useful compute
Synchronous training inverts data-center traffic: A bulk-synchronous step releases a few large, correlated flows whose completion gates a barrier, so the fabric is judged by collective completion time and its p99 tail rather than by average per-flow throughput, and static ECMP hashing turns flow collisions into persistent hot spots.
Link speed is not fabric speed: For traffic that crosses a fabric cut, available capacity bounds transfer time (principle 6). Workload placement and collective schedules determine how much data must cross, so advertised port speed alone cannot predict useful training throughput.
Latency and bandwidth bind differently: The \(\MessageStartupLatency\)-\(\LinkBandwidth\) model of section 3.4.4 separates startup cost from per-byte transfer cost, with \(\LatencyBandwidthCrossoverSize = \MessageStartupLatency\cdot \LinkBandwidth\) marking the regime change. Message-size distributions, not vendor peak numbers, determine whether to optimize software latency or hardware bandwidth.
Reliable delivery moves the risk: RDMA transports need reliable completion and bounded recovery, not one universal lossless-fabric mechanism. InfiniBand normally suppresses loss with link-level credits; many RoCE deployments use PFC and ECN, while PFC-free designs place more recovery responsibility at the endpoints. Each choice trades hardware flexibility against tail latency and operational complexity.
Topology must match traffic: Fat-trees buy flexible bisection bandwidth, rail-optimized designs give same-rank AllReduce traffic its own isolated switch network, and dragonfly or torus designs trade cabling and locality differently. The right fabric depends on whether the workload stresses AllReduce, AllToAll, or multi-tenant sharing.
Losslessness and load create their own failures: PFC prevents drops by pausing senders, which can spread one slow drainer’s congestion to victim flows or freeze a lossless class in a cyclic buffer dependency. Under synchronized load, end-to-end congestion control is a latency requirement, adaptive routing repairs hash collisions without adding capacity, and incast is spread in time, space, and priority rather than eliminated.
Telemetry saves GPU-hours: PFC counters, link error rates, bandwidth baselines, and application throughput must be correlated across layers. Without that observability, a degraded transceiver or congestion storm silently converts a high-end fleet into a queue of waiting accelerators.
At fleet scale, the interconnect is part of the computer. Its value lies in how much useful computation it allows the participating accelerators to complete together. A fabric decision therefore has to be judged against the workload’s communication pattern and synchronization schedule, because additional capacity helps only where those dependencies expose a communication limit.
What’s Next: From wires to data pipelines
A fabric that completes every collective on time still leaves two flows of bytes unaccounted for. Each step needs its next input batch in place before the accelerators ask for it, and the fleet’s training state must outlive the next hardware failure, which at this scale means writing multi-terabyte checkpoints on a schedule. Those checkpoint bursts are the traffic class this chapter isolated from the synchronization path, and for text pretraining they can outweigh the training corpus itself. Data Storage treats storage as the fleet’s fuel line, sizing the tiers and pipelines that deliver inputs ahead of demand and persist model state without stalling the step.
3.13 Self-Check Answers
Self-Check: Answer
On an H100 GPU server, why does moving gradient synchronization across node boundaries create a severe ‘bandwidth cliff,’ and by what factor does per-direction bandwidth drop when transitioning from local NVLink to a single NDR InfiniBand port?
Bandwidth drops by roughly \(2\times\) because optical conversion adds latency while maintaining similar wire transfer rates
Bandwidth drops by roughly \(50\times\) because inter-node links must encapsulate packets in kernel TCP/IP stacks
Bandwidth drops by roughly \(9\times\) (from \(450\text{ GB/s}\) per direction to \(50\text{ GB/s}\) per port) due to the physical distance and switching constraints of inter-node cables
Bandwidth drops by roughly \(100\times\) because inter-node communication requires staging all gradients through CPU system RAM
Answer: The correct answer is C. On an H100 system, per-direction NVLink bandwidth is \(450\text{ GB/s}\) (half of its \(900\text{ GB/s}\) bidirectional total), whereas a single NDR InfiniBand port delivers \(50\text{ GB/s}\) (\(400\text{ Gb/s}\)), representing an approximate \(9\times\) bandwidth cliff. The assertion of a \(2\times\) drop significantly underestimates the physical disparity between on-chassis copper traces and multi-meter inter-node cabling. The claim of a \(50\times\) drop mistakenly assumes inter-node traffic uses kernel TCP/IP rather than RDMA. The assertion of a \(100\times\) drop confuses GPUDirect RDMA transfers with legacy CPU bounce buffering.
Learning Objective: Compare intra-node and inter-node interconnect bandwidths across GPU generations.
In a 1,024-GPU synchronous training job on a 175B-parameter model, a degraded inter-node link carries a required collective transfer. Explain when its delay can leave the other participating GPUs waiting, and why the link fault alone does not establish a job-wide slowdown.
Answer: If the degraded link delays the last required collective completion on the job’s critical path, workers that finish their dependent work earlier wait at the synchronization boundary. The exposed delay depends on the participating group, routing, collective schedule, and overlap with independent computation; a fault on an unused path or a transfer whose delay remains hidden need not lengthen the step. The relevant evidence is a matched step and transfer timeline, not the existence of a degraded link elsewhere in the fleet.
Learning Objective: Explain how synchronous collective communication creates a bulk-synchronous bottleneck in multi-GPU training.
True or False: AllToAll collective communication is less demanding on network fabric bisection bandwidth than AllReduce because each GPU only sends data to a single designated peer.
Answer: False. In AllToAll, each participant sends a distinct portion to every other participant, creating many simultaneous source-destination pairs. This can stress bisection bandwidth and path diversity. Ring AllReduce exchanges with logical neighbors at each step, but its physical cross-sectional traffic still depends on rank placement and routing.
Learning Objective: Analyze the communication demands of AllToAll versus AllReduce collective patterns.
In a distributed training cluster, the network fabric functions as the global ______, analogous to the internal memory bus in a single workstation, moving parameter updates and activation tensors between accelerators.
Answer: gradient bus. The fabric carries parameter updates between workers, making its bandwidth and synchronization delays central constraints on distributed training throughput.
Learning Objective: Identify the conceptual role of the network fabric in distributed machine learning architectures.
Why can standard Equal-Cost Multi-Path (ECMP) routing produce persistent hot spots when a distributed ML training job has a small number of large gradient flows?
ECMP hashes each flow to one path, so several large gradient flows can collide on one link while other equal-cost paths remain underused
ECMP introduces non-deterministic packet reordering that corrupts the internal state of GPU tensor cores
ECMP relies on centralized SDN controllers that cannot update routing tables at microsecond timescales
ECMP requires all switches in the fabric to maintain complete copies of the global model parameters
Answer: The correct answer is A. A large population of independent small flows can distribute load more evenly under hashing, but ECMP does not guarantee balance. With few long-lived gradient flows, several hashes can select the same path, and the imbalance can persist through the collective while other paths remain underused. The actual result depends on the flow population, hashes, traffic volumes, and provisioned paths. The statement regarding packet reordering corrupting GPU tensor cores misattributes network-layer reordering to hardware compute corruption. The option referencing slow centralized SDN controllers confuses distributed IP routing with SDN control planes. The claim about switch hardware holding model parameters confuses network routing state with accelerator memory.
Learning Objective: Evaluate why static flow hashing fails under large-scale ML collective traffic.
Contrast how packet loss is handled in traditional web-scale TCP/IP networks versus RDMA-based ML fabrics (such as RoCEv2), and explain why packet loss in an ML cluster can cause a large performance drop.
Answer: TCP with selective acknowledgments can retransmit missing regions. Reliable RDMA transports also recover loss, but the recovery granularity depends on the RNIC implementation. A Go-Back-N-style RNIC can retransmit data after the missing packet, extending the completion tail seen by synchronized workers; selective-recovery implementations can repair a smaller region. The performance penalty therefore depends on recovery behavior and the collective critical path, rather than following from RDMA alone.
Learning Objective: Compare packet loss recovery mechanisms and their performance implications in TCP/IP versus RDMA fabrics.
**Arrange the five levels of the high-performance ML network fabric model in ascending order of abstraction, from physical signaling up to cluster orchestration:
Switch and Topology
Cluster Design
Wire and Link
Fabric Behavior
Transport and Performance Model**
Answer: The correct sequence is: (3) Wire and Link -> (5) Transport and Performance Model -> (1) Switch and Topology -> (4) Fabric Behavior -> (2) Cluster Design.
Learning Objective: Classify networking mechanisms within the five-level ML fabric model.
Which performance metric is the primary optimization target in an ML training network fabric, and why?
Average per-flow throughput, because web data centers maximize aggregate data volume across millions of independent users
Jitter buffer depth, because audio and video streaming protocols require bounded inter-packet arrival gaps
Maximum hop count across the core, because reducing total cable length minimizes physical fiber deployment costs
Collective completion time under load, because a Bulk Synchronous Parallel barrier waits for the last required transfer; p99 transfer latency helps characterize the tail
Answer: The correct answer is D. In distributed ML training under the Bulk Synchronous Parallel (BSP) paradigm, all GPUs must reach a synchronization barrier before any worker can proceed. Consequently, the last required transfer can determine barrier completion and extend the step. The p99 transfer latency summarizes a distribution; it is not the maximum completion time of a particular collective. The choice focusing on average per-flow throughput reflects traditional web-service optimization rather than synchronous ML collectives. The option mentioning jitter buffers pertains to real-time multimedia streaming rather than RDMA bulk transfers. The choice concerning physical fiber deployment costs addresses cabling economics rather than the operational performance metric governing synchronization.
Learning Objective: Analyze why tail latency dominates network fabric design under synchronous training workloads.
What is the primary physical trade-off introduced by adopting PAM4 (Pulse Amplitude Modulation 4-level) instead of NRZ (Non-Return-to-Zero) signaling in \(400\text{ Gb/s}\) and \(800\text{ Gb/s}\) network fabrics?
PAM4 triples the baud rate on the physical wire but eliminates the need for receiver equalization
PAM4 doubles the data rate per symbol by using four voltage levels, but the reduced noise margin requires Forward Error Correction (FEC) with an implementation-dependent latency cost
PAM4 replaces electrical copper signaling with optical coherent modulation, restricting maximum cable length to under \(50\text{ cm}\)
PAM4 eliminates link-level bit errors entirely, removing the need for physical layer error detection at the cost of doubling SerDes power consumption
Answer: The correct answer is B. PAM4 transmits 2 bits per symbol using 4 discrete voltage levels, doubling throughput without doubling the symbol rate. However, the voltage gap between adjacent levels shrinks by a factor of 3 compared to NRZ, requiring Reed-Solomon Forward Error Correction (RS-FEC) whose processing latency depends on the PHY and module implementation. The choice claiming PAM4 triples the baud rate while eliminating equalization is incorrect because PAM4 maintains the symbol rate while requiring more complex equalization. The option stating PAM4 replaces copper with optical coherent modulation confuses electrical modulation with optical transceivers. The assertion that PAM4 eliminates bit errors contradicts the physical reality that smaller noise margins increase raw bit error rates.
Learning Objective: Evaluate the trade-offs between PAM4 and NRZ signaling in high-speed network fabrics.
Why can increasing per-lane signaling rate shorten passive Direct Attach Copper reach, and how should the resulting link budget constrain AI rack design?
Answer: Higher signaling frequencies increase copper attenuation, consuming the available loss margin. Usable reach depends on lane rate, cable construction, connectors, and active components rather than aggregate port rate alone. Designers keep passive paths within the validated channel budget and consider active cables or optics when the required distance exceeds it; a rack boundary by itself does not determine the medium.
Learning Objective: Analyze link budget and attenuation constraints on high-speed copper cabling in dense AI racks.
In a modern multi-thousand GPU cluster using \(400\text{ Gb/s}\) pluggable optical transceivers, why is transceiver power consumption a critical design constraint at the facility level?
Pluggable transceivers require cryogenic cooling to prevent optical fiber dispersion
Optical transceivers consume no power during active data transfer but draw high surge currents during idle states
Counting one selected spine-side module on each of 20,000 links at \(20\text{ W}\) per module gives a \(400\text{ kW}\) endpoint subtotal, before opposite-end modules and other fabric power
Optical modules dissipate heat directly into the switch ASIC die, reducing switch processing clock frequencies by \(50\%\)
Answer: The correct answer is C. The scenario counts one selected spine-side module per physical link, giving \(20{,}000 \times 20\text{ W} = 400\text{ kW}\) for those endpoints. A complete optical link has a module at each end; the opposite endpoints, switch electronics, and cooling are outside this subtotal. The separate \(25\text{ W}\) per-port budget also includes the selected switch-side SerDes. Standard datacom optics do not require cryogenic cooling, and active conversion consumes power while data moves.
Learning Objective: Calculate and evaluate the power overhead of optical interconnects in large-scale AI clusters.
True or False: Direct Attach Copper (DAC) cables introduce higher propagation and serialization latency than Active Optical Cables (AOC) over a 2-meter intra-rack link because copper has higher electrical resistance than optical fiber.
Answer: False. Passive DAC avoids electrical-to-optical and optical-to-electrical conversion, but both high-speed copper and optical paths can include PHY and FEC processing. Actual latency depends on the complete path, signaling, and implementation; electrical resistance alone does not establish a latency ordering or a universal under-3-meter winner.
Learning Objective: Compare latency profiles of Direct Attach Copper versus optical cabling.
How does GPUDirect RDMA optimize the end-to-end data path during a multi-node AllReduce gradient exchange compared to traditional host-staged network transfers?
It allows the network interface card (NIC) to read and write GPU High Bandwidth Memory directly over the PCIe bus without staging data through host CPU system RAM
It compresses floating-point tensors in GPU L2 cache before writing them directly to the optical switch buffer
It enables the GPU to execute TCP/IP checksum offloading in CUDA streaming multiprocessors
It re-routes inter-node gradient traffic over host SATA storage buses to bypass network switch congestion
Answer: The correct answer is A. Traditional network transfers require copying gradient data from GPU memory to CPU system RAM, and then through the OS kernel buffer before reaching the NIC. GPUDirect RDMA enables peer-to-peer DMA over PCIe between the GPU memory and the NIC, eliminating intermediate host copies, reducing CPU utilization and host-staging overhead. The choice claiming tensor compression in GPU L2 cache describes a data compression technique rather than RDMA DMA bypass. The option regarding GPU-executed TCP/IP checksums is incorrect because GPUDirect RDMA offloads the data path to the NIC rather than executing transport checksums on GPU cores. The claim regarding SATA storage buses confuses storage interfaces with accelerator network interconnects.
Learning Objective: Explain the architectural mechanism and performance benefits of GPUDirect RDMA.
An engineer observes that upgrading network links from \(200\text{ Gb/s}\) (HDR) to \(400\text{ Gb/s}\) (NDR) reduces the transfer time of a \(10\text{ KB}\) pipeline control message by only about \(11\%\), whereas the same upgrade halves the transfer time of a \(350\text{ MB}\) gradient tensor. How does the \(\alpha\)-\(\beta\) performance model explain this discrepancy?
Switch routing tables drop small packets more frequently than large packets due to flowlet timeouts
High-bandwidth optical transceivers disable forward error correction for messages larger than \(1\text{ MB}\)
PCIe bus arbitration introduces dynamic power throttling on transfers smaller than \(64\text{ KB}\)
The \(10\text{ KB}\) message falls below the crossover point (\(n^* = \alpha\beta \approx 75\text{ KB}\)), where fixed startup latency \(\alpha\) dominates, while the \(350\text{ MB}\) message is in the bandwidth-dominated regime (\(n \gg n^*\))
Answer: The correct answer is D. In the Hockney \(\alpha\)-\(\beta\) model (\(T(n) = \alpha + n/\beta\)), the crossover point \(n^* = \alpha\beta\) marks the transition between regimes. For NDR InfiniBand (\(\alpha \approx 1.5\,\mu\text{s}\), \(\beta \approx 50\text{ GB/s}\)), \(n^* \approx 75\text{ KB}\). A \(10\text{ KB}\) message is in the latency-dominated regime (\(n < n^*\)), where fixed startup overhead \(\alpha\) (SerDes, FEC, switch hops) accounts for nearly all transfer time, so doubling \(\beta\) provides negligible benefit. A \(350\text{ MB}\) message is deeply bandwidth-dominated (\(n \gg n^*\)), so transfer time scales inversely with \(\beta\). The option regarding switch routing tables dropping small packets confuses routing policies with transfer time physics. The claim about transceivers disabling FEC for large messages is factually false. The choice suggesting PCIe power throttling on small transfers misidentifies the source of the latency floor.
Learning Objective: Apply the \(\alpha\)-\(\beta\) performance model to differentiate latency-dominated and bandwidth-dominated transfer regimes.
Given an InfiniBand fabric with startup latency \(\alpha = 1.5\,\mu\text{s}\) and bandwidth \(\beta = 50\text{ GB/s}\), calculate the crossover message size \(n^*\). Explain what architectural changes can reduce transfer time for messages below \(n^*\).
Answer: The crossover message size is calculated as \(n^* = \alpha \cdot \beta = 1.5\,\mu\text{s} \times 50\text{ GB/s} = 75\text{ KB}\). For messages smaller than \(75\text{ KB}\), transfer time is dominated by the fixed startup latency \(\alpha\) rather than link bandwidth. To reduce transfer time in this regime, architects must reduce \(\alpha\) by minimizing switch hop counts (such as using rail-optimized or flatter topologies), decreasing physical cable propagation distances, or reducing physical-layer FEC overhead, rather than increasing link bandwidth.
Learning Objective: Calculate the \(\alpha\)-\(\beta\) crossover point and determine architectural strategies for latency-dominated transfers.
On an RNIC that discards out-of-order arrivals rather than retaining them, ______ recovery retransmits from the missing sequence point after packet loss.
Answer: Go-Back-N. This recovery scheme retransmits from the missing packet, potentially repeating later data; other RNIC designs support more selective recovery.
Learning Objective: Identify the packet recovery mechanism used by RDMA over Converged Ethernet.
True or False: InfiniBand and RoCEv2 achieve losslessness through identical mechanisms because both protocols expose the standard user-space Verbs API to the application.
Answer: False. InfiniBand normally prevents buffer-overflow loss through link-level credits. Many RoCE deployments instead combine PFC with congestion control, while PFC-free designs rely on stronger endpoint recovery. A shared Verbs API does not specify identical flow-control or recovery mechanisms.
Learning Objective: Compare hardware and link-layer losslessness mechanisms in InfiniBand and RoCEv2.
A cluster designer builds a three-tier non-blocking fat-tree network using radix-64 switches (\(k = 64\)). What is the maximum number of hosts this fabric can support at 1:1 bisection bandwidth subscription, and how many total switches are required across all tiers?
\(2{,}048\) hosts and \(128\) switches
\(16{,}384\) hosts and \(1{,}024\) switches
\(65{,}536\) hosts and \(5{,}120\) switches
\(262{,}144\) hosts and \(20{,}480\) switches
Answer: The correct answer is C. For a \(k\)-ary three-tier non-blocking fat-tree, the maximum host count is given by \(N_{\text{hosts}} = k^3 / 4 = (64)^3 / 4 = 262{,}144 / 4 = 65{,}536\). The total switch count across core, aggregation, and edge tiers is \(5k^2 / 4 = 5(4{,}096) / 4 = 5{,}120\) switches. The choice of 2,048 hosts matches a standalone two-tier fabric (\(k^2/2\) hosts, which needs only \(k + k/2 = 96\) switches), not a full three-tier fabric. The choices of 16,384 hosts and 262,144 hosts represent arithmetic miscalculations of the cubic Clos scaling formula.
Learning Objective: Calculate host capacity and switch count for multi-tier Clos fat-tree topologies.
Why does a rail-optimized network topology significantly reduce synchronization latency for 3D-parallel training jobs compared to a standard uniform fat-tree?
It replaces optical fiber cables with liquid-cooled copper buses across all rows
It physically connects all GPUs of the same local rank (e.g., all GPU 0s) across server nodes to dedicated rail switches, allowing same-rail transfers within a leaf group to use a single switch hop
It eliminates the need for intra-node NVLink by routing all tensor-parallel traffic through Top-of-Rack switches
It dynamically routes all AllReduce packets through the GPU display engine to bypass PCIe contention
Answer: The correct answer is B. In 3D-parallel LLM training, data-parallel AllReduce occurs exclusively between GPUs holding the same model shard (identical local ranks). Rail-optimized topologies dedicate separate switch planes (rails) to each GPU rank index, allowing same-rank transfers within a leaf group to complete in a single switch traversal; larger rails and cross-group transfers still traverse additional switches. The option mentioning liquid-cooled copper buses confuses physical packaging with network topology. The choice claiming it eliminates intra-node NVLink is incorrect because a fast local fabric remains advantageous for intra-node tensor parallelism. The option proposing routing packets through the GPU display engine is technically absurd.
Learning Objective: Analyze the structural design and latency benefits of rail-optimized network topologies.
A cluster operator considers saving capital expenditure by building a \(4:1\) oversubscribed spine in a 1,024-GPU training cluster. Explain the quantitative and economic impact of this design on a 100 GB per GPU AllReduce collective during distributed training.
Answer: A \(4:1\) oversubscribed spine reduces the available bisection capacity by a factor of four, from \(25.6\text{ TB/s}\) to \(6.4\text{ TB/s}\) in this example. The bandwidth-bound portion of an AllReduce crossing that cut can consequently take up to four times as long under saturation. The actual penalty depends on placement, collective algorithm, and overlap; the 100 GB payload alone does not establish a dollar loss. The economic comparison must include added accelerator waiting time alongside switch savings.
Learning Objective: Evaluate the performance and economic cost of network spine oversubscription on distributed collectives.
Why did Google adopt a 3D torus topology for its TPU Pods, and what communication workload exposes the primary structural limitation of this topology?
The 3D torus minimizes cabling cost and external switch hardware by leveraging direct neighbor-to-neighbor links that suit structured transformer collectives, but suffers high hop count (\(\mathcal{O}(N^{1/3})\)) and bisection congestion under irregular AllToAll traffic from Mixture-of-Experts (MoE) models
The 3D torus provides full non-blocking bisection bandwidth for random permutation traffic, but fails when running ring AllReduce due to cyclic buffer dependencies
The 3D torus eliminates Forward Error Correction requirements, but cannot support FP16 numerical precision
The 3D torus reduces power consumption by disabling physical link SerDes, but restricts cluster scale to 32 nodes
Answer: The correct answer is A. A 3D torus connects nodes directly to adjacent grid neighbors without external switches, offering low cabling cost and excellent locality for structured 2D/3D nearest-neighbor collectives (such as pipeline and data-parallel rings in standard transformers). However, global communication requires traversing the mesh diameter (\(\mathcal{O}(N^{1/3})\) hops), and irregular AllToAll token routing in MoE models congests the limited bisection bandwidth (\(N^{2/3}\) scaling). The option claiming torus provides non-blocking bisection bandwidth contradicts the mesh bisection constraint. The choice regarding FEC and numerical precision confuses physical transport with numerical representations. The option claiming SerDes is disabled is physically impossible for high-speed interconnects.
Learning Objective: Compare 3D torus and fat-tree topologies across regular versus irregular collective communication patterns.
True or False: In a data center network, aggregate bandwidth (the sum of all endpoint link rates) and bisection bandwidth (\(\text{BW}_{\text{bisect}}\)) are identical metrics.
Answer: False. Aggregate bandwidth is the sum of all edge link capacities connected to servers, whereas bisection bandwidth (\(\text{BW}_{\text{bisect}}\)) is the minimum capacity across any cut that divides the cluster into two equal halves. A star topology with 1,000 \(400\text{ Gb/s}\) endpoints has high aggregate bandwidth (\(400\text{ Tb/s}\)), but its bisection bandwidth is constrained by the central switch’s cross-sectional capacity, which may be significantly lower if oversubscribed.
Learning Objective: Distinguish aggregate edge bandwidth from bisection bandwidth in network topologies.
In a RoCEv2 fabric, what is ‘congestion spreading’, which stalls victim flows, and what mechanism causes it?
Optical dispersion in fiber cables causing packet corruption across adjacent wavelength channels
High ambient temperatures in switch chassis causing SerDes circuits to throttle line rates across all ports
Software hypervisors duplicating tenant packets across multiple Virtual Functions
Priority Flow Control (PFC) PAUSE frames propagating upstream from a single congested egress port, filling upstream switch buffers and pausing unrelated flows that share those intermediate switches
Answer: The correct answer is D. When a switch port experiences buffer buildup (e.g., from an incast burst), PFC emits PAUSE frames upstream to prevent packet loss. As upstream buffers fill with paused traffic, those switches in turn send PAUSE frames to their upstream neighbors. This backpressure cascade can propagate across multiple switch tiers, blocking unrelated traffic (victim flows) that happens to traverse the paused intermediate switches. The option citing optical dispersion confuses physical-layer fiber physics with link-layer flow control. The choice attributing slowdown to thermal SerDes throttling describes a hardware thermal response rather than network congestion. The option describing hypervisor packet duplication confuses virtualization routing with link backpressure.
Learning Objective: Analyze the mechanism and system risks of PFC congestion spreading in lossless Ethernet fabrics.
How does High Precision Congestion Control (HPCC) achieve faster convergence and lower queue buildup during incast bursts compared to DCQCN?
HPCC drops all out-of-order packets at the edge switch and forces senders to switch to TCP cubic
HPCC uses In-Network Telemetry (INT) to append precise switch queue depth, link utilization, and timestamps to packet headers, allowing senders to estimate available capacity and adjust rates rapidly
HPCC disables Priority Flow Control and relies exclusively on application-level checkpointing to tolerate packet loss
HPCC increases switch buffer sizes to \(10\text{ GB}\) per port to eliminate the possibility of buffer overflows
Answer: The correct answer is B. DCQCN relies on coarse, binary Explicit Congestion Notification (ECN) marking and reactive Congestion Notification Packets (CNP), requiring multiple RTTs to converge via heuristic multiplicative decrease. HPCC leverages In-Network Telemetry (INT) where programmable switch ASICs embed precise metadata (exact queue depth, link load, timestamps) directly into packet headers, enabling senders to estimate available capacity and adjust rates rapidly rather than infer congestion from binary marks alone. The choice stating HPCC drops packets and falls back to TCP cubic contradicts RDMA design principles. The option claiming PFC is disabled with reliance on checkpointing misrepresents congestion control. The option suggesting \(10\text{ GB}\) switch buffers is economically and physically infeasible on high-radix switch silicon.
Learning Objective: Compare telemetry-based end-to-end congestion control (HPCC) with binary ECN marking (DCQCN).
During a synchronized fan-in phase such as flat gradient aggregation, describe the physical conditions that create the ‘incast problem’ at a switch port, and calculate the time required to overflow a \(32\text{ MB}\) switch buffer when 256 GPUs each transmit at \(50\text{ GB/s}\) toward a single \(50\text{ GB/s}\) (\(400\text{ Gb/s}\)) egress port.
Answer: Incast occurs during synchronized fan-in phases (flat aggregation or synchronized reads, not bandwidth-optimal ring AllReduce) when multiple senders simultaneously transmit line-rate traffic to a single destination or aggregation port. With 256 senders at \(50\text{ GB/s}\), the aggregate offered load is \(256 \times 50\text{ GB/s} = 12.8\text{ TB/s}\). The egress port drains data at \(50\text{ GB/s}\), resulting in a net buffer fill rate of \(12.8\text{ TB/s} - 0.05\text{ TB/s} = 12.75\text{ TB/s}\). The time to overflow a \(32\text{ MB}\) buffer is: \(t_{\text{overflow}} = 32\text{ MB} / 12.75\text{ TB/s} \approx 2.51\,\mu\text{s}\). This microsecond-scale overflow instantly triggers PFC pause cascades or packet drops.
Learning Objective: Calculate buffer overflow time during many-to-one incast bursts and explain the underlying traffic dynamics.
Why does packet spraying improve fabric bisection bandwidth utilization in InfiniBand networks, and why is standard Ethernet historically hesitant to use it?
Packet spraying distributes individual packets of an elephant flow across all available equal-cost paths to eliminate hash collisions; suitable InfiniBand implementations support this through routing and endpoint ordering mechanisms, whereas standard Ethernet avoids reordering due to the high software/NIC cost of reassembly
Packet spraying encrypts packets with unique keys across paths, which InfiniBand decrypts in hardware while Ethernet lacks AES accelerators
Packet spraying routes packets over wireless backup links, which Ethernet switches do not support
Packet spraying reduces packet header size from 40 bytes to 4 bytes, doubling Ethernet wire efficiency
Answer: The correct answer is A. Packet spraying eliminates ECMP hot spots by distributing packets of a single elephant flow across multiple parallel paths. Suitable InfiniBand routing and endpoint implementations preserve the required ordering while using multiple paths; arbitrary packet spraying is not safe without that support. Standard Ethernet historically avoided packet spraying because out-of-order delivery triggers false packet loss assumptions in TCP or requires large on-chip reassembly buffers in RoCE NICs (prompting alternatives like flowlet switching or UEC next-gen transports). The option alleging encryption across paths confuses load balancing with cryptographic security. The choice mentioning wireless backup links is unrelated to data center fabrics. The option claiming header reduction from 40 to 4 bytes confuses routing with packet compression.
Learning Objective: Explain packet spraying load balancing and contrast transport-layer reordering requirements across InfiniBand and Ethernet.
**Place the following events in order to illustrate how an incast burst escalates into a cluster-wide PFC congestion storm in a RoCEv2 fabric:
The downstream switch buffer reaches its high-water mark and emits PFC PAUSE frames upstream
Upstream switches pause their transmission queues, causing their own ingress buffers to fill with traffic destined for other ports
Multiple GPU senders simultaneously initiate flat-aggregation transfers targeting a common aggregation node
Second-tier upstream switches emit PAUSE frames to unrelated sender nodes, freezing victim flows across the fabric
The common destination switch egress queue is oversubscribed by the combined line-rate traffic**
Answer: The correct sequence is: (3) Multiple GPU senders simultaneously initiate flat-aggregation transfers targeting a common aggregation node -> (5) The common destination switch egress queue is oversubscribed by the combined line-rate traffic -> (1) The downstream switch buffer reaches its high-water mark and emits PFC PAUSE frames upstream -> (2) Upstream switches pause their transmission queues, causing their own ingress buffers to fill with traffic destined for other ports -> (4) Second-tier upstream switches emit PAUSE frames to unrelated sender nodes, freezing victim flows across the fabric.
Learning Objective: Order the escalation of link-layer backpressure from localized incast to cluster-wide PFC freeze.
In a 3D-parallel training architecture (combining Tensor, Pipeline, and Data Parallelism) across a cluster of 8-GPU nodes, how should each parallelism dimension be mapped to the network hierarchy to optimize communication efficiency?
Data Parallelism within the node over NVLink, Pipeline Parallelism across the leaf switches, and Tensor Parallelism across the core spine switches
Tensor Parallelism within the node over high-bandwidth NVLink, Pipeline Parallelism across immediate inter-node links, and Data Parallelism across the cluster fabric with backward-pass overlap
Tensor Parallelism across the multi-hop core network, Data Parallelism within the CPU socket, and Pipeline Parallelism over PCIe storage buses
All three parallelism dimensions mapped uniformly across all network tiers using round-robin flow allocation
Answer: The correct answer is B. Tensor Parallelism requires continuous, low-latency all-gather/reduce-scatter of activations at every layer, making the ultra-high-bandwidth NVLink domain of a single node a preferred placement (\(900\text{ GB/s}\) aggregate bidirectional, or \(450\text{ GB/s}\) per direction). Pipeline Parallelism exchanges activations only at pipeline stage boundaries (point-to-point transfers), easily mapping across inter-node links. Data Parallelism exchanges full gradient tensors across all replicas, which can be overlapped with backward computation across the broader cluster fabric. The option placing Tensor Parallelism across spine switches adds inter-node transfer costs to fine-grained activation exchanges. The choice involving CPU sockets and PCIe storage buses misidentifies accelerator data paths. The option suggesting uniform round-robin mapping ignores the per-direction \(9\times\) bandwidth cliff between the local fabric and a single inter-node port.
Learning Objective: Design optimal mappings of 3D parallelism strategies onto the hierarchical network fabric.
Why can communication-computation overlap not hide the last mile of the gradient exchange in distributed training, and what does that leave on the critical path?
Answer: During backpropagation, gradients are computed in reverse order, from the final layers to the first. Gradients computed early in the backward pass can overlap their AllReduce with the backward computation still to come. The gradients computed at the end of backpropagation have little computation left behind which to hide their transfer, so that last part of the exchange is exposed on the critical path and every GPU waits for it before the next step.
Learning Objective: Explain the fundamental limit of communication-computation overlap during backpropagation.
What is the primary operational and architectural motivation for Meta adopting RoCEv2 over commodity Ethernet in its Grand Teton clusters rather than dedicated InfiniBand?
RoCEv2 provides lower physical-layer forward error correction latency than InfiniBand
Ethernet cabling is physically immune to transceiver symbol errors
Commodity Ethernet enables multi-vendor switch and optics sourcing, supply chain resilience, and unified management tooling with web serving infrastructure, despite requiring careful PFC and routing tuning
InfiniBand switches cannot support link rates exceeding \(100\text{ Gb/s}\)
Answer: The correct answer is C. Meta deployed 400G RoCEv2 clusters (such as Grand Teton for Llama 3) to leverage multi-vendor hardware availability (e.g., Arista, OCP switches), avoid proprietary hardware single-sourcing, and integrate network management into existing data-center monitoring stacks. The trade-off is higher operational complexity: tuning PFC watchdogs, collective routing, and congestion control to approximate InfiniBand’s native hardware losslessness. The option claiming RoCEv2 has lower FEC latency is false, as physical signaling for equivalent line rates incurs a similar FEC latency overhead. The choice claiming Ethernet cabling is immune to symbol errors is physically inaccurate. The assertion that InfiniBand caps at \(100\text{ Gb/s}\) is false, as InfiniBand NDR operates at \(400\text{ Gb/s}\) and XDR at \(800\text{ Gb/s}\).
Learning Objective: Compare the architectural and operational trade-offs of deploying RoCEv2 Ethernet versus InfiniBand at hyperscale.
True or False: An NVIDIA DGX SuperPOD scalable unit eliminates inter-node optical transceiver costs by connecting all 32 DGX nodes in the scalable unit using passive direct-attach copper cables to the core spine switches.
Answer: False. In the stated multi-rack, row-scale layout, paths to the spine exceed the representative passive DAC reach and require an appropriate active cable or optical medium. Reach depends on per-lane signaling, cable construction, connectors, and the actual path length; copper is not categorically prohibited by crossing a rack boundary.
Learning Objective: Analyze physical media placement in modular AI cluster architectures.
How does Single Root I/O Virtualization (SR-IOV) enable near-bare-metal RDMA performance in multi-tenant cloud GPU environments?
It allows a physical NIC to present multiple independent Virtual Functions (VFs) directly to guest VMs or containers, bypassing the host hypervisor and OS kernel for DMA operations
It emulates a 10 GbE software NIC inside the KVM kernel module to buffer gradient bursts
It compresses tenant network streams using the host CPU’s AVX-512 vector units before transmission
It dynamically converts InfiniBand packets into TCP/IP frames at the virtual switch layer
Answer: The correct answer is A. SR-IOV allows a single physical PCIe NIC to instantiate multiple hardware-level Virtual Functions (VFs), each equipped with dedicated queue pairs, doorbell registers, and DMA channels. By assigning a VF directly to a virtual machine via PCIe passthrough, the guest OS initiates direct RDMA DMA transactions without hypervisor interception, achieving within a few percent of bare-metal performance. The choice describing 10 GbE software emulation introduces massive CPU overhead and high latency. The option suggesting CPU AVX-512 compression describes software payload processing rather than NIC hardware virtualization. The option proposing InfiniBand-to-TCP packet conversion violates RDMA kernel-bypass operation.
Learning Objective: Explain the hardware virtualization mechanism of SR-IOV and Virtual Functions in RDMA fabrics.
Explain how Virtual Lanes (VLs) in InfiniBand (or Traffic Classes in RoCEv2) reduce the impact of a multi-gigabyte storage checkpoint burst on the iteration time of an active distributed training job on a shared cluster.
Answer: InfiniBand virtual lanes maintain separate buffering and credit state, so a storage lane exhausting its credits need not block a gradient lane. Mapping traffic to separate lanes must be paired with arbitration and bandwidth policy because both still share the physical link. RoCE uses Ethernet traffic classes and configured QoS mechanisms for an analogous separation. These mechanisms reduce interference; they do not create additional capacity or guarantee zero queuing delay.
Learning Objective: Analyze traffic isolation and QoS mechanisms in multi-tenant ML networks.
True or False: Configuring SR-IOV Virtual Functions (VFs) with strict bandwidth limits (such as capping each VF at \(50\text{ Gb/s}\) on a \(400\text{ Gb/s}\) NIC) allows a training job to dynamically burst up to \(400\text{ Gb/s}\) during AllReduce if other VFs on the host are idle.
Answer: False. When strict rate limiting or static bandwidth partitioning is configured on an SR-IOV Virtual Function at the hardware NIC level, the NIC hardware enforces a hard transmission ceiling. The tenant workload cannot exceed its allocated slice (e.g., \(50\text{ Gb/s}\)), even if all other VFs on the physical port are completely idle, unless dynamic bandwidth-sharing policies (such as Enhanced Transmission Selection with excess credit sharing) are explicitly configured.
Learning Objective: Evaluate bandwidth partitioning and burst limitations in hardware-enforced NIC virtualization.
In InfiniBand fabrics, traffic isolation is achieved using independent logical channels called ______, which maintain separate credit-based buffer management on the same physical link.
Answer: virtual lanes. Separate buffer and credit state isolate backpressure between traffic classes while sharing the physical link and its finite bandwidth.
Learning Objective: Identify the InfiniBand hardware mechanism used for traffic isolation and QoS.
A training job has slowed by a few percent. On one link, the port counters show a rising symbol-error count, and its data counters show lower throughput than links serving comparable traffic. What does this counter evidence establish on its own?
The transceiver on that link is defective and must be replaced before the job resumes
The link is a candidate cause, to be confirmed by correlating its negotiated rate, lane state, and transport behavior with the job’s slow collective
The fabric is congested, so PFC and ECN thresholds must be retuned
Nothing useful, because port counters cannot reflect training performance
Answer: The correct answer is B. Symbol errors and reduced data counts are evidence of a degrading signal on that link, but a counter alone does not identify a defective cable or transceiver. Correlating the counters with negotiated rate, lane state, and transport behavior, and checking that the link lies on the slow collective’s path, narrows the cause. Replacing hardware on counter evidence alone skips that confirmation, retuning PFC and ECN assumes congestion that the symbol errors do not show, and dismissing the counters ignores the physical-layer evidence they carry.
Learning Objective: Interpret fabric port counters as evidence to correlate across layers rather than as a diagnosis.
Explain the concept of ‘silent degradation’ in an AI cluster fabric, give a concrete physical example of how it occurs, and describe its economic impact on a large synchronous training run.
Answer: Silent degradation occurs when a network link suffers severe bandwidth or latency degradation without failing completely or generating an explicit link-down alert. For example, a damaged connector pin or optical transceiver fault may cause a link to negotiate at HDR (\(200\text{ Gb/s}\)) instead of NDR (\(400\text{ Gb/s}\)), or silently drop from 4 physical lanes to 2. If the affected path limits a required collective transfer and extends its critical path, the participating workers can lose useful compute time while waiting. The chapter’s assumed \(2\text{--}3\%\) iteration slowdown illustrates the resulting GPU-hour and dollar cost over a month-long 1,024-GPU run; neither that slowdown nor its propagation to every worker follows from the link fault alone.
Learning Objective: Analyze silent network degradation and evaluate its economic impact on synchronous training.
What is the primary purpose of constructing an ‘All-Pairs Bandwidth Matrix’ before launching a distributed training job?
To run point-to-point bandwidth benchmarks (such as ib_write_bw) across all node pairs and visualize a heatmap of underperforming node pairs that warrant investigation of paths and endpoints
To pre-allocate GPU memory buffers for all possible tensor-parallel communication patterns
To calculate the exact gradient loss trajectory of the neural network architecture
To calibrate the clock frequency of the CPU PCIe root complex
Answer: The correct answer is A. An All-Pairs Bandwidth Matrix is generated by executing point-to-point RDMA throughput tests (e.g., using ib_write_bw) between every pair of nodes in a cluster allocation. The resulting heatmap identifies underperforming node pairs for investigation before a multi-week training job. Routing information and matched physical, transport, and endpoint telemetry are needed to distinguish a shared switch or cable problem from endpoint limitations; the matrix alone does not identify the failed component. The option proposing pre-allocation of GPU memory buffers describes a runtime memory pool task rather than network validation. The choice regarding gradient loss trajectory confuses training convergence with network testing. The option regarding CPU PCIe clock calibration is unrelated to cluster-wide network benchmarking.
**Order the recommended diagnostic steps when investigating an unexpected slowdown in a multi-node GPU training job, moving from application symptoms down to physical causes:
Inspect switch PFC pause and ECN congestion counters along the network path
Run point-to-point RDMA bandwidth tests (ib_write_bw) between candidate nodes
Check GPU compute and SM utilization (using nvidia-smi or dcgmi)
Validate physical layer health by checking symbol errors and CRC discard counters
Enable NCCL debug logging (NCCL_DEBUG=INFO) to identify transport selection and detected topology**
Answer: The correct sequence is: (3) Check GPU compute and SM utilization (using nvidia-smi or dcgmi) -> (5) Enable NCCL debug logging (NCCL_DEBUG=INFO) to identify transport selection and detected topology -> (2) Run point-to-point RDMA bandwidth tests (ib_write_bw) between candidate nodes -> (1) Inspect switch PFC pause and ECN congestion counters along the network path -> (4) Validate physical layer health by checking symbol errors and CRC discard counters.
Learning Objective: Order the systematic debugging workflow for distributed training network bottlenecks.
True or False: In a healthy, properly configured lossless InfiniBand or RoCEv2 fabric, the PortXmitDiscards counter on switch ports should periodically increment under heavy AllReduce traffic to signal senders to back off.
Answer: False. Packet discards are not the intended congestion signal in a fabric configured to avoid overflow loss. Operators should investigate new discard increments, while checking the counter definition and interval. Credits, ECN, and configured PFC provide the normal flow-control and congestion signals; a historical nonzero counter alone does not diagnose an active fault.
Learning Objective: Evaluate error and discard counter baselines in lossless network fabrics.
How does Co-Packaged Optics (CPO) physically reduce interconnect power consumption compared to traditional pluggable optical transceivers?
It replaces optical lasers with superconducting RF antennas that operate without electrical resistance
It integrates silicon photonics directly onto the processor or switch package substrate, shortening the electrical SerDes trace from centimeters to millimeters and eliminating power-hungry signal conditioning
It removes the need for fiber optic cables by transmitting data through free-space infrared beams inside the server rack
It downsamples 16-bit floating-point tensors to 1-bit integers directly inside the optical waveguide
Answer: The correct answer is B. In traditional pluggable architectures, high-speed electrical signals must travel several centimeters across PCBs from the switch ASIC to the faceplate transceiver, requiring high-power SerDes equalization and retimers. Co-Packaged Optics (CPO) integrates silicon photonics chiplets directly onto the same substrate as the switch/compute ASIC, reducing the electrical trace to millimeters and saving approximately \(50\%\) of transceiver power (roughly \(1.28\text{ kW}\) per \(51.2\text{ Tb/s}\) switch). The option alleging superconducting RF antennas is science fiction. The choice proposing free-space infrared beams inside racks misidentifies guided optical fiber architectures. The option describing tensor downsampling inside waveguides confuses optical transmission with algorithmic quantization.
Learning Objective: Explain the physical mechanism and efficiency gains of Co-Packaged Optics.
How does increasing switch ASIC capacity to \(102.4\text{ Tb/s}\) with \(1.6\text{ Tb/s}\) ports impact the topology and latency of a multi-thousand GPU cluster compared to building the same cluster with \(400\text{ Gb/s}\) switches?
Answer: A \(102.4\text{ Tb/s}\) ASIC offers aggregate capacity equivalent to 256 ports at \(400\text{ Gb/s}\), or 64 ports at \(1.6\text{ Tb/s}\). These are bandwidth equivalents, not automatically interchangeable physical port counts. A flatter topology becomes possible when usable radix, breakout support, endpoint rates, and placement permit it. Removing a tier then reduces switch traversals and optical links, but neither a two-tier design nor a halving of transceiver count follows from aggregate ASIC bandwidth alone.
Learning Objective: Analyze the topological and latency impact of higher-radix, next-generation switch silicon.
What is the primary design goal of the Ultra Ethernet Consortium (UEC) transport specification for AI and HPC workloads?
To mandate standard TCP Reno congestion control across all high-performance computing clusters
To replace physical Ethernet cabling with proprietary wireless mesh interconnects
To develop an open, multi-vendor Ethernet transport featuring multi-path packet spraying, flexible packet ordering, and improved congestion control and recovery to reduce reliance on PFC
To deprecate GPU-to-GPU direct memory access in favor of host CPU centralized message queues
Answer: The correct answer is C. Ultra Ethernet Transport combines multipath packet spraying, flexible ordering, congestion-control changes, and AI/HPC telemetry within an open Ethernet ecosystem. Its reliability goal is to bound the completion-time penalty of congestion and loss while reducing dependence on PFC. These design goals do not guarantee immunity from every congestion or recovery failure. TCP Reno and centralized host message queues do not describe this transport architecture.
Learning Objective: Evaluate the architecture and design goals of the Ultra Ethernet Consortium (UEC) specification.
True or False: Disaggregated composable architectures using CXL memory pooling eliminate the \(\alpha\)-\(\beta\) communication costs between processors and remote memory pools.
Answer: False. While CXL memory pooling decouples compute and memory into composable resource pools with load/store semantics, cross-chassis memory access still traverses physical wires and switches. It remains governed by physical \(\alpha\)-\(\beta\) latency and bandwidth constraints, SerDes power limits, and bisection capacity; disaggregation relocates the synchronization boundary rather than eliminating physical transfer costs.
Learning Objective: Evaluate physical communication limits in disaggregated and composable architectures.
Why is using standard TCP benchmark tools like iperf to validate an ML cluster network fabric considered a major operational fallacy?
iperf measures the TCP path, whose throughput depends on host processing, offloads, and tuning; it does not validate the RDMA path exercised by distributed training
iperf only operates over wireless IEEE 802.11 interfaces and cannot bind to physical QSFP56 ports
iperf automatically enables InfiniBand credit-based flow control on standard Ethernet switches
iperf encrypts all network packets with 4096-bit RSA keys, causing false GPU thermal throttling
Answer: The correct answer is A. TCP and RDMA exercise different transport and host-processing paths, so a TCP benchmark cannot establish RDMA or collective performance. TCP throughput depends on host configuration and has no universal fixed ceiling. RDMA-specific tools such as ib_write_bw test the relevant data path; collective benchmarks then test synchronization and topology effects. The wireless-only and automatic InfiniBand flow-control claims are incorrect.
Learning Objective: Analyze why TCP benchmarks are inadequate for validating RDMA-based ML fabrics.
An infrastructure team claims: ‘Adaptive routing completely eliminates the need for topology-aware job placement in our GPU cluster.’ Why is this assertion a critical pitfall?
Adaptive routing only functions when all GPU servers are manufactured by the same vendor
Adaptive routing disables link-layer CRC error checking on optical switches
Adaptive routing forces all AllReduce operations to execute sequentially across a single ring
Adaptive routing balances traffic across existing paths, but it cannot synthesize bisection bandwidth that does not exist if a job is split across an oversubscribed or constrained network boundary
Answer: The correct answer is D. Adaptive routing can direct packets away from congested queues onto less loaded eligible paths, reducing imbalance from static hash collisions. However, it cannot generate physical bandwidth where none exists. For a tightly coupled 1,024-GPU job spanning two spine pods, a collective is limited by their boundary when its crossing traffic exceeds what the boundary can deliver within the communication budget. Adaptive routing can reduce path imbalance but cannot increase that capacity; topology-aware placement can reduce crossing traffic. Both must be evaluated against the actual collective schedule, and neither guarantees efficient delivery by itself. The choices claiming single-vendor restrictions, CRC disabling, or forced sequential ring execution are factually incorrect.
Learning Objective: Evaluate the complementary roles and limitations of adaptive routing versus topology-aware scheduling.
Explain why upgrading an InfiniBand fabric from HDR (\(200\text{ Gb/s}\)) to NDR (\(400\text{ Gb/s}\)) yields less than a \(15\%\) reduction in transfer time for a \(10\text{ KB}\) control message, and state the condition under which bandwidth upgrades deliver linear performance gains.
Answer: For a \(10\text{ KB}\) message, transfer time is governed by the \(\alpha\)-\(\beta\) model (\(T(n) = \alpha + n/\beta\)). With the same assumed \(\alpha = 1.5\,\mu\text{s}\) on both paths, HDR takes \(1.5 + 0.4 = 1.9\,\mu\text{s}\) and NDR takes \(1.5 + 0.2 = 1.7\,\mu\text{s}\), a reduction of about \(10.5\%\). Startup contributes about \(79\%\) of the HDR total and \(88\%\) of the NDR total. Doubling bandwidth halves the transmission term while leaving startup unchanged. Bandwidth upgrades deliver near-linear speedups only in the bandwidth-dominated regime (\(n \gg n^*\)), such as multi-megabyte to gigabyte gradient AllReduce transfers.
Learning Objective: Explain the diminishing returns of network bandwidth upgrades in latency-dominated regimes.
True or False: Lossless RoCEv2 Ethernet fabrics provide the exact same operational simplicity and fault immunity as InfiniBand fabrics because both support zero-packet-loss guarantees.
Answer: False. InfiniBand uses native credit-based flow control, while many RoCE deployments use Ethernet PFC with endpoint congestion control and recovery. PFC introduces pause-based storms and cyclic-dependency risks, but credits alone do not make InfiniBand immune to deadlock: routing and resource dependencies still matter. PFC-free RoCE designs make a different recovery trade-off.
Learning Objective: Compare operational risk and failure modes in lossless Ethernet versus InfiniBand.