7 Fault Tolerance
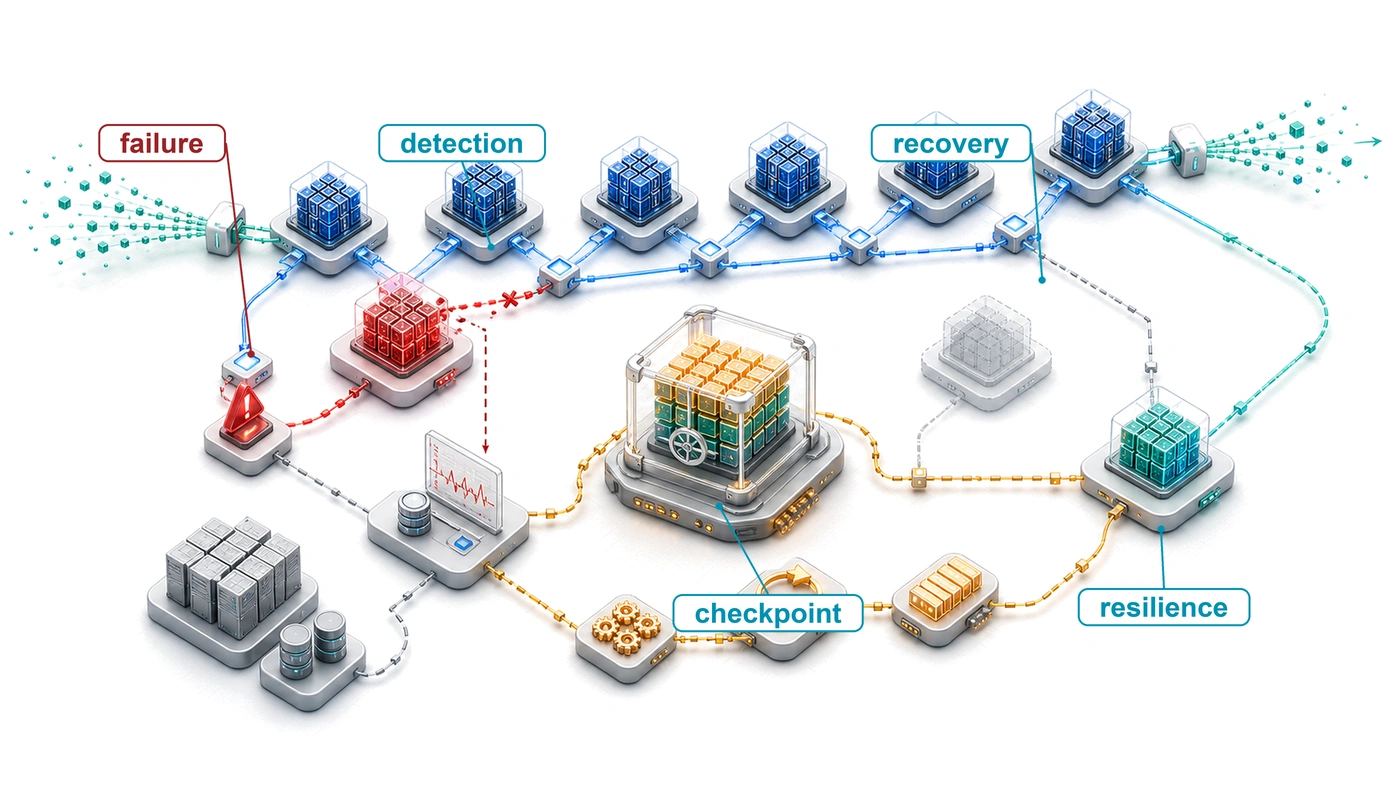
Purpose
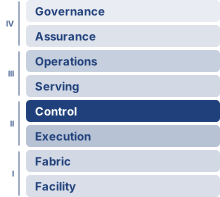
Fleet stack focus for this chapter.
Why does scale transform hardware failure from rare exception to routine condition that systems must absorb continuously?
A single accelerator can run for years between hardware failures. A thousand accelerators turn that same component risk into failures every couple of days, and ten thousand see failures every few hours, while shared power and network faults can interrupt many workers at once. Individual devices need not become less reliable for the fleet to experience failures routinely. A program on one machine can often stop and restart when a component fails; a distributed training job must also recover agreement among surviving workers about which progress remains valid. Restarting quickly is of little value if the restored state silently changes the computation. Preserving more state reduces the work at risk, but consumes storage bandwidth and memory while the job is healthy. Waiting longer between saves reduces that overhead while increasing the progress a failure can erase. Serving imposes a different consequence: users may abandon a request before recovery completes, and replacing a worker may leave the request’s context unavailable. A response that arrives on time can still be unacceptable if recovery has discarded information needed to produce it. Engineers must therefore bound lost work and recovery delay while preserving the validity of training and the usefulness of service. The goal is continued useful execution despite repeated failures, with the costs and limits of recovery made explicit. In C³ terms, fault tolerance spends compute and communication on coordination so that component failures do not routinely become failures of the entire workload.
Learning Objectives
- Calculate mean time between fleet failures from component rates and estimate interruption frequency for large training clusters
- Classify hardware, software, silent-data-corruption, and slow-but-alive failures by detectability, blast radius, and recovery path
- Select checkpoint intervals that balance write overhead against acceptable lost work and recovery delay
- Design distributed checkpointing and elastic recovery plans for multi-terabyte model state across accelerator fleets
- Design serving redundancy, failover, and state-recovery policies under latency budgets and partial failures
- Select graceful degradation strategies that preserve useful service when models, features, regions, or capacity fail
- Evaluate detection timeouts, restart strategies, and fault-injection evidence against a per-failure recovery-time budget
7.1 Failure Analysis at Scale
Imagine a 10,000-GPU cluster midway through a three-month training run for a new foundation model. The parallel training plan and the communication layer beneath it have done their job, and thousands of devices exchange gradients through AllReduce, AllGather, and AllToAll as if they were one machine. Then the arithmetic of scale catches up. A GPU fails every few hours, and if the system cannot absorb that ordinary physical event, synchronized training halts while compute worth about $0.5M a day sits idle. Fault tolerance is the system property that lets distributed execution continue making useful progress when components fail, degrade, or disappear. In the fleet stack of The Fleet Stack, fault tolerance occupies the Reliability & Control row of the Distribution band, where it protects the progress that parallelism and communication produce.
That fragility is the direct consequence of successful synchronization. Every collective in Collective Communication assumed that all ranks in its process group arrive, and each dependent consumer waits for every contribution. One stalled device can therefore stop progress in its synchronous training group, even while unrelated jobs continue elsewhere in the fleet. Fault-tolerant ML systems preserve progress by detecting failure, checkpointing recoverable state, restarting or elastically reshaping jobs, and treating hardware churn as normal execution rather than an exceptional path. That reliability envelope covers both halves of the fleet’s work. Training needs recovery that preserves weeks of accumulated progress, while serving needs redundancy, failover, and graceful degradation that preserve a latency contract, and both draw their spare capacity from a shared fleet pool.
↪ How the scheduler holds spare capacity for failed jobs and prepositions replacement nodes while a missed heartbeat is confirmed is developed in Failure as a scheduling input.
Not every failure announces itself. A component can stop outright, slow down while still answering liveness checks, or keep running while it computes wrong values, and the quiet cases pair low detection rates with a high blast radius, because the system keeps running on state it should no longer trust. The recovery target here is therefore trustworthy execution: preserving valid training progress and restoring a service after its infrastructure or software fails. A restored model can still make poor predictions on changed inputs even when every component executes correctly. Evaluating that behavioral robustness requires a separate contract for model quality under distribution shifts and adversarial inputs, developed in Robust AI. The distinction lets us use model-quality signals to diagnose a fault without treating every quality regression as evidence of failed hardware.
Because failures cannot be eliminated at this scale, fault-tolerant systems verify completion rather than assume it, treat failure as a normal code path, exercise recovery continuously, and account for partial failures that naive error handling may not anticipate. These techniques draw on decades of distributed systems research, but ML workloads change the economics. Training checkpoints are large but can be sized from the model and optimizer state, while some optimization algorithms tolerate bounded numerical perturbations without requiring bitwise replay. That tolerance must be established for the training method; stochasticity does not make arbitrary corruption or inconsistent recovery safe. A recovery design can exploit approximate execution only while preserving its declared convergence and quality requirements. Making failure a routine part of operation starts with knowing how often failures arrive, and the mathematics that follows makes the shift from rare exception to routine occurrence precise.
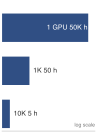
Fleet mean time between failures (MTBF) collapses from 50,000 h to 5 h as GPUs multiply.
Self-Check: Question
A production cluster operates 10,000 GPUs, where each individual GPU exhibits an independent MTTF of 50,000 hours and an availability of 99.99%. What is the resulting GPU-only cluster MTBF, and what is the probability that all 10,000 GPUs are simultaneously operational at any random instant?
- Cluster MTBF is 50 hours; simultaneous cluster availability is approximately 90.5%.
- Cluster MTBF is 500 hours; simultaneous cluster availability is approximately 99.0%.
- Cluster MTBF is 5.0 hours; simultaneous cluster availability is approximately 36.8%.
- Cluster MTBF is 0.5 hours; simultaneous cluster availability is approximately 1.0%.
Using an illustrative unprotected-memory soft-error rate of 250 FIT/Mbit and 80 GiB of HBM per device, explain why a 1,024-GPU training cluster needs ECC protection.
7.2 The Mathematics of Inevitable Failure
A single data-center GPU can run for years without a hardware fault, yet a synchronous job spanning ten thousand of those same GPUs is interrupted every few hours. System reliability engineering explains why individual device longevity erodes so quickly when thousands of components must stay healthy at the same time (Birolini 2017). Each component has a failure rate \(\ComponentFailureRate\),1 measured in failures per unit time. When \(\ComponentFailureRate\) is constant, the probability that a single component survives without failure until time \(\TimeInstant\) follows an exponential distribution,2 as in equation 1:
1 Failure rate (\(\ComponentFailureRate\)): Expressed in FITs (Failures In Time), where 1 FIT equals one failure per billion device-hours. A data center GPU with a 50,000-hour mean time to failure has \(\text{FIT} = 20{,}000\), corresponding to \(\HourlyComponentFailureRate = 2.0 \times 10^{-5}\) failures/hour. That seems negligible for one device but becomes dominant at fleet scale: a cluster with 10,000 GPUs accumulates 200,000,000 FITs from GPUs alone, translating to an expected GPU failure every 5 hours.
2 Poisson process: A statistical model for events occurring independently at a constant average rate. In this model, event counts follow a Poisson distribution and waiting times follow an exponential distribution, giving the survival function \(\ComponentReliability(\TimeInstant) = e^{-\ComponentFailureRate \TimeInstant}\). With independent identical component hazards, the probability of at least one failure in a 10,000-component cluster is \(1 - e^{-\RequiredComponentCount\ComponentFailureRate \TimeInstant}\). The aggregate hazard \(\RequiredComponentCount\ComponentFailureRate\) scales linearly with component count; the failure probability is nonlinear in both \(\RequiredComponentCount\) and \(\TimeInstant\), approaching \(\RequiredComponentCount\ComponentFailureRate \TimeInstant\) only when that product is small.
\[ \ComponentReliability(\TimeInstant) = e^{-\ComponentFailureRate \TimeInstant} \tag{1}\]
↪ The independence, exponential-lifetime, and Poisson results this failure arithmetic rests on are developed in Probability tools for failure analysis.
3 GPU MTTF variation: This chapter uses 50,000 hours as a planning constant for current data center GPUs (A100 and H100 class), not as a guarantee for every deployed GPU. Published fleet studies from Google TPUv4 pods and Meta GPU clusters report that field reliability depends on topology, cooling, workload, and operational practice (Zu et al. 2024; Kokolis et al. 2025; Dubey et al. 2024). The planning constant therefore anchors the arithmetic, while operators should substitute measured fleet rates when they have them.
Zu, Y., A. Ghaffarkhah, H.-V. Dang, B. Towles, S. Hand, S. Huda, A. Bello, et al. 2024. “Resiliency at Scale: Managing Google’s TPUv4 Machine Learning Supercomputer.” 21st USENIX Symposium on Networked Systems Design and Implementation (NSDI 24), 761–74.
Kokolis, Apostolos, Michael Kuchnik, John Hoffman, Adithya Kumar, Parth Malani, Faye Ma, Zach DeVito, Shubho Sengupta, Kalyan Saladi, and Carole-Jean Wu. 2025. “Revisiting Reliability in Large-Scale Machine Learning Research Clusters.” 2025 IEEE International Symposium on High Performance Computer Architecture (HPCA), 1259–74. https://doi.org/10.1109/hpca61900.2025.00096.
Dubey, Abhimanyu, Abhinav Jauhri, Abhinav Pandey, Abhishek Kadian, et al. 2024. The Llama 3 Herd of Models. arXiv preprint arXiv:2407.21783.
The expected time to failure of this component equals \(1/\ComponentFailureRate\). In this book’s convention, mean time to failure (MTTF) names a single component’s expected time to its first failure while MTBF names the repairable system’s expected operating time between successive failures, excluding recovery downtime. Under the constant-rate exponential model used here the two coincide numerically, and the fault-tolerance model uses MTTF for per-component constants and MTBF for composed system rates. Data center GPUs often use planning MTTF values in the tens of thousands of hours, with field behavior depending on operating conditions, cooling effectiveness, manufacturing variation, and workload stress.3 Component failure rates catalogs the reference per-component FIT and MTTF values (GPU, high-bandwidth memory (HBM), network interface card (NIC), power supply, PCIe switch, optical cable, ToR switch) that anchor these \(\ComponentFailureRate\) and FIT figures, so a reader can substitute the constant for any device and reproduce the rates used throughout the fault-tolerance analysis.
When multiple independent components operate in a system where any single failure causes system failure, equation 2 formalizes how system reliability becomes the product of individual component reliabilities:
\[ \SystemReliability(\TimeInstant) = \prod_{i=1}^{\RequiredComponentCount} {\ComponentReliability}_i(\TimeInstant) = \prod_{i=1}^{\RequiredComponentCount} e^{-\ComponentFailureRate_i \TimeInstant} \tag{2}\]
For \(\RequiredComponentCount\) identical components with individual failure rate \(\ComponentFailureRate\), equation 3 gives the identical-component simplification:
\[ \SystemReliability(\TimeInstant) = e^{-\RequiredComponentCount\ComponentFailureRate \TimeInstant} \tag{3}\]
The system failure rate becomes \(\RequiredComponentCount\ComponentFailureRate\), and equation 4 expresses how the system MTBF scales inversely with component count. This inverse scaling explains why per-device reliability that looks excellent in isolation erodes at cluster scale:
\[ \SystemMtbf = \frac{1}{\RequiredComponentCount\ComponentFailureRate} = \frac{\ComponentMttf}{\RequiredComponentCount} \tag{4}\]
The consequence is a gap between failure cadence and job length. At 10,000 GPUs, the GPU-only calculation gives an expected interval of 5 hours, so a training run measured in weeks accumulates dozens of expected failures and one measured in months accumulates hundreds. These are planning averages, not a schedule of incidents; a shorter job can finish without failure even when its expected failure count exceeds one. Once the expected time between failures falls below the length of the job, fault tolerance becomes part of the execution budget for long-running fleet work. Applied to the landmark training runs of The Scale Moment, whose accelerator counts grew by about four orders of magnitude between 2012 and 2024, the same per-device planning rate puts the largest of them, with more than ten thousand GPUs, below a 10-hour system MTBF, which is why recovery becomes an active scheduling constraint rather than a reliability feature.
7.2.1 Composing component reliability
The GPU-only calculation of equation 4 supplies the scale intuition; a real training system then composes GPUs, HBM, links, power supplies, storage paths, and redundancy into one failure budget. Component rates are usually quoted in the FIT units introduced with the failure rate, so the 50,000-hour GPU contributes 20,000 FIT to whatever system contains it. The new question is how different component rates compose, and the composition rule depends on the redundancy structure and the independence assumptions. For series systems (for example, a node where all 8 GPUs must work), failure of any component fails the whole. With independent constant-rate failures, the reliabilities multiply as in equation 2, so the rates add even when the components differ: \[\SystemMtbf = \frac{1}{\sum \ComponentFailureRate_i}\] Under this additive failure-rate law, the system failure rate grows linearly with component count while system MTBF falls in inverse proportion. Every unredundanted component on the critical path adds its FIT contribution directly to the denominator.
The same product governs instantaneous availability, a different quantity from the survival function \(\ComponentReliability(\TimeInstant)\). Availability \(\SteadyStateAvailability\) is the probability that a component is up at a randomly chosen instant, counting repairs, whereas \(\ComponentReliability(\TimeInstant)\) is the probability that it has not yet failed by time \(\TimeInstant\). If each GPU is independently up with probability \(\GpuAvailability\), all \(\RequiredComponentCount\) are up together with probability \((\GpuAvailability)^\RequiredComponentCount\), which is the reliability gap of equation 1.2. For the chapter’s 10,000-GPU cluster, a per-GPU availability of 99.99 percent (only 52.6 minutes of downtime per year) leaves about a 37 percent chance that every GPU is up at the same instant. That power erodes even highly reliable hardware once \(\RequiredComponentCount\) reaches fleet scale, so software must handle failures automatically.
Systems Perspective 7.1: Scale transforms failure
A cluster of 10,000 GPUs turns a per-GPU MTTF of 50,000 hours into a system MTBF of 5 hours. For a repairable system, steady-state availability is \(\SteadyStateAvailability= \MeanTimeBetweenFailures/(\MeanTimeBetweenFailures+\MeanTimeToRepair)\), where mean time to recovery (MTTR) is the recovery interval. Cutting MTTR from 30 minutes to 5 minutes raises availability from 90.91 percent to 98.36 percent. This stationary two-state model assumes unconstrained repair capacity and complete outage; correlated incidents, repair contention, and degraded operation require direct measurement (Birolini 2017). Systems must engineer recovery, not merely improve components.
Engineering faster recovery is one response to that arithmetic; redundancy is the other. For parallel systems providing redundancy, suppose that any surviving component can satisfy the required service. With independent failures and no repair during the observation interval, the system survives until every component has failed: \[\SystemReliability(\TimeInstant) = 1 - \prod_{i=1}^{\RedundantComponentCount} (1 - {\ComponentReliability}_i(\TimeInstant))\]
Series composition is the training job’s problem, because a synchronous step needs every participant. Parallel composition is the serving fleet’s lever, and it returns when interchangeable replicas protect a latency contract. Both rules, however, describe whatever the model calls a component, and the fault rate assigned to that component depends on which protections sit inside it.
Lighthouse 7.1: Archetype A (GPT-4/Llama-3): Memory soft-error scale
Composition makes the distinction between raw faults and job interruptions essential. Memory soft-error rates are quoted per megabit of storage rather than per device, so the exposure grows with memory capacity. As an illustrative raw-bit-error budget, assume 250 FIT per megabit across 1,024 GPUs with 80 GB each, the size of the Archetype A reference cluster. The resulting interval between raw memory errors is roughly 20 seconds. This is not a measured job-failure interval. Error-correcting code (ECC) protection can correct covered error patterns before they affect computation, while detected uncorrectable errors and escaped corruption require different recovery paths. At that raw rate, unprotected memory in the reference cluster would corrupt training state many times per hour, so ECC is a precondition for large-scale training rather than an option. A fleet reliability budget therefore needs the residual job-interrupting and silent-corruption rates under its actual protection scheme; raw bit-error rates alone cannot establish whether memory, logic, or interconnect dominates.
These raw bit-error rates justify ECC, but they are not the interruption rates that set checkpoint cadence; the worked cascade that follows uses device MTTF values that already include the effect of that protection. The cascade also treats its GPU, PCIe, power, and network contributions as separate categories, so a measured whole-node rate that already includes those paths cannot be added to them again.
7.2.2 Cluster MTBF calculation
Consider a training cluster designed for large language model development, roughly ten times the 1,024-GPU Archetype A reference cluster, with the following specifications:
- 10,000 NVIDIA H100 GPUs
- Individual GPU MTTF: 50,000 hours
- Each GPU connected to host via PCIe (MTTF: 200,000 hours)
- Each node contains 8 GPUs fed by 6 power supply units (MTTF: 100,000 hours each) in 4+2 redundancy, so the node keeps full performance with any 2 of them failed
- Network infrastructure per node (NIC, cables): MTTF 150,000 hours
Each GPU operates within a failure domain that includes the GPU itself, its PCIe connection, and a proportional share of the node’s network infrastructure. Power enters the sum only through supplies whose single failure stops the node, counted as \(\SeriesPsuCount\) in the power equation. With the node’s supplies in redundant sets, no single unit qualifies, so the power term below is zero in this first-order calculation. The approximation omits the residual risk that additional independent failures exhaust redundancy before repair. A fault upstream of the chassis, such as the loss of the circuits feeding it, can also take down the whole node; that risk belongs to the correlated failures treated later in this chapter. The four subsystem rates follow from their MTTF values:
\[ \GpuFailureRate = \frac{1}{50{,}000} = 2.0 \times 10^{-5} \text{ failures/hour} \]
\[ \PcieLinkFailureRate = \frac{1}{200{,}000} = 0.5 \times 10^{-5} \text{ failures/hour} \]
\[ \PerGpuPowerFailureRate = \frac{\SeriesPsuCount}{8} \times \frac{1}{100{,}000} = \frac{0}{8} \times \frac{1}{100{,}000} = 0 \text{ failures/hour} \]
\[ \PerGpuNetworkFailureRate = \frac{1}{8} \times \frac{1}{150{,}000} = 0.083 \times 10^{-5} \text{ failures/hour} \]
Because the subsystems sit in series, their rates add to a per-GPU total:
\[ \PerGpuTotalFailureRate = (2.0 + 0.5 + 0.083) \times 10^{-5} = 2.583 \times 10^{-5} \text{ failures/hour} \]
Multiplying that total by the cluster size gives the system failure rate, whose reciprocal is the cluster MTBF:
\[ \SystemFailureRate = 10{,}000 \times 2.583 \times 10^{-5} = 0.2583 \text{ failures/hour} \]
\[ \SystemMtbf = \frac{1}{0.2583} = 3.87 \text{ hours} \]
Under the model, the cluster experiences a failure every 3.9 hours on average. The expected failure cadence is 6.2 failures/day; a training run lasting one week has an expected count of 43 failures. Actual incident times vary, but the expected loss is large enough that recovery must be part of normal execution planning.
↪ The step-by-step composition of per-component failure rates into a fleet-wide system MTBF, reusable for any node design or cluster size, is developed in The MTBF cascade.
The cluster MTBF scaling in table 1 isolates the GPU-only baseline across cluster sizes. The full-system calculation is lower once PCIe and network failure domains are included. The same 10,000-GPU cluster therefore carries three MTBF values in this chapter, and each later calculation names the one it uses: the GPU-only 5 hours of this table, the full-system 3.9 hours of the cascade above, and the two-to-three-hour cadence that somewhat larger production runs report below. Two running scenarios carry the rest of the chapter. The 1,024-GPU Archetype A reference cluster sizes per-node state, restore paths, and the elastic and straggler examples, while the 10,000-GPU cluster of the cascade sets failure cadence and checkpoint intervals. The full-system MTBF is the default input; a calculation that uses the GPU-only value says so, usually because it compares cluster sizes on the common basis of table 1, and its failure count is then a lower bound.
| Cluster size (GPUs) | Individual GPU MTTF | Cluster MTBF | Expected failures per day |
|---|---|---|---|
| 8 | 50,000 hours | 6,250 hours (260 days) | 0.004 |
| 64 | 50,000 hours | 781 hours (33 days) | 0.03 |
| 512 | 50,000 hours | 98 hours (4 days) | 0.25 |
| 1,000 | 50,000 hours | 50 hours (2 days) | 0.48 |
| 4,000 | 50,000 hours | 12 hours | 1.9 |
| 10,000 | 50,000 hours | 5 hours | 4.8 |
| 25,000 | 50,000 hours | 2 hours | 12 |
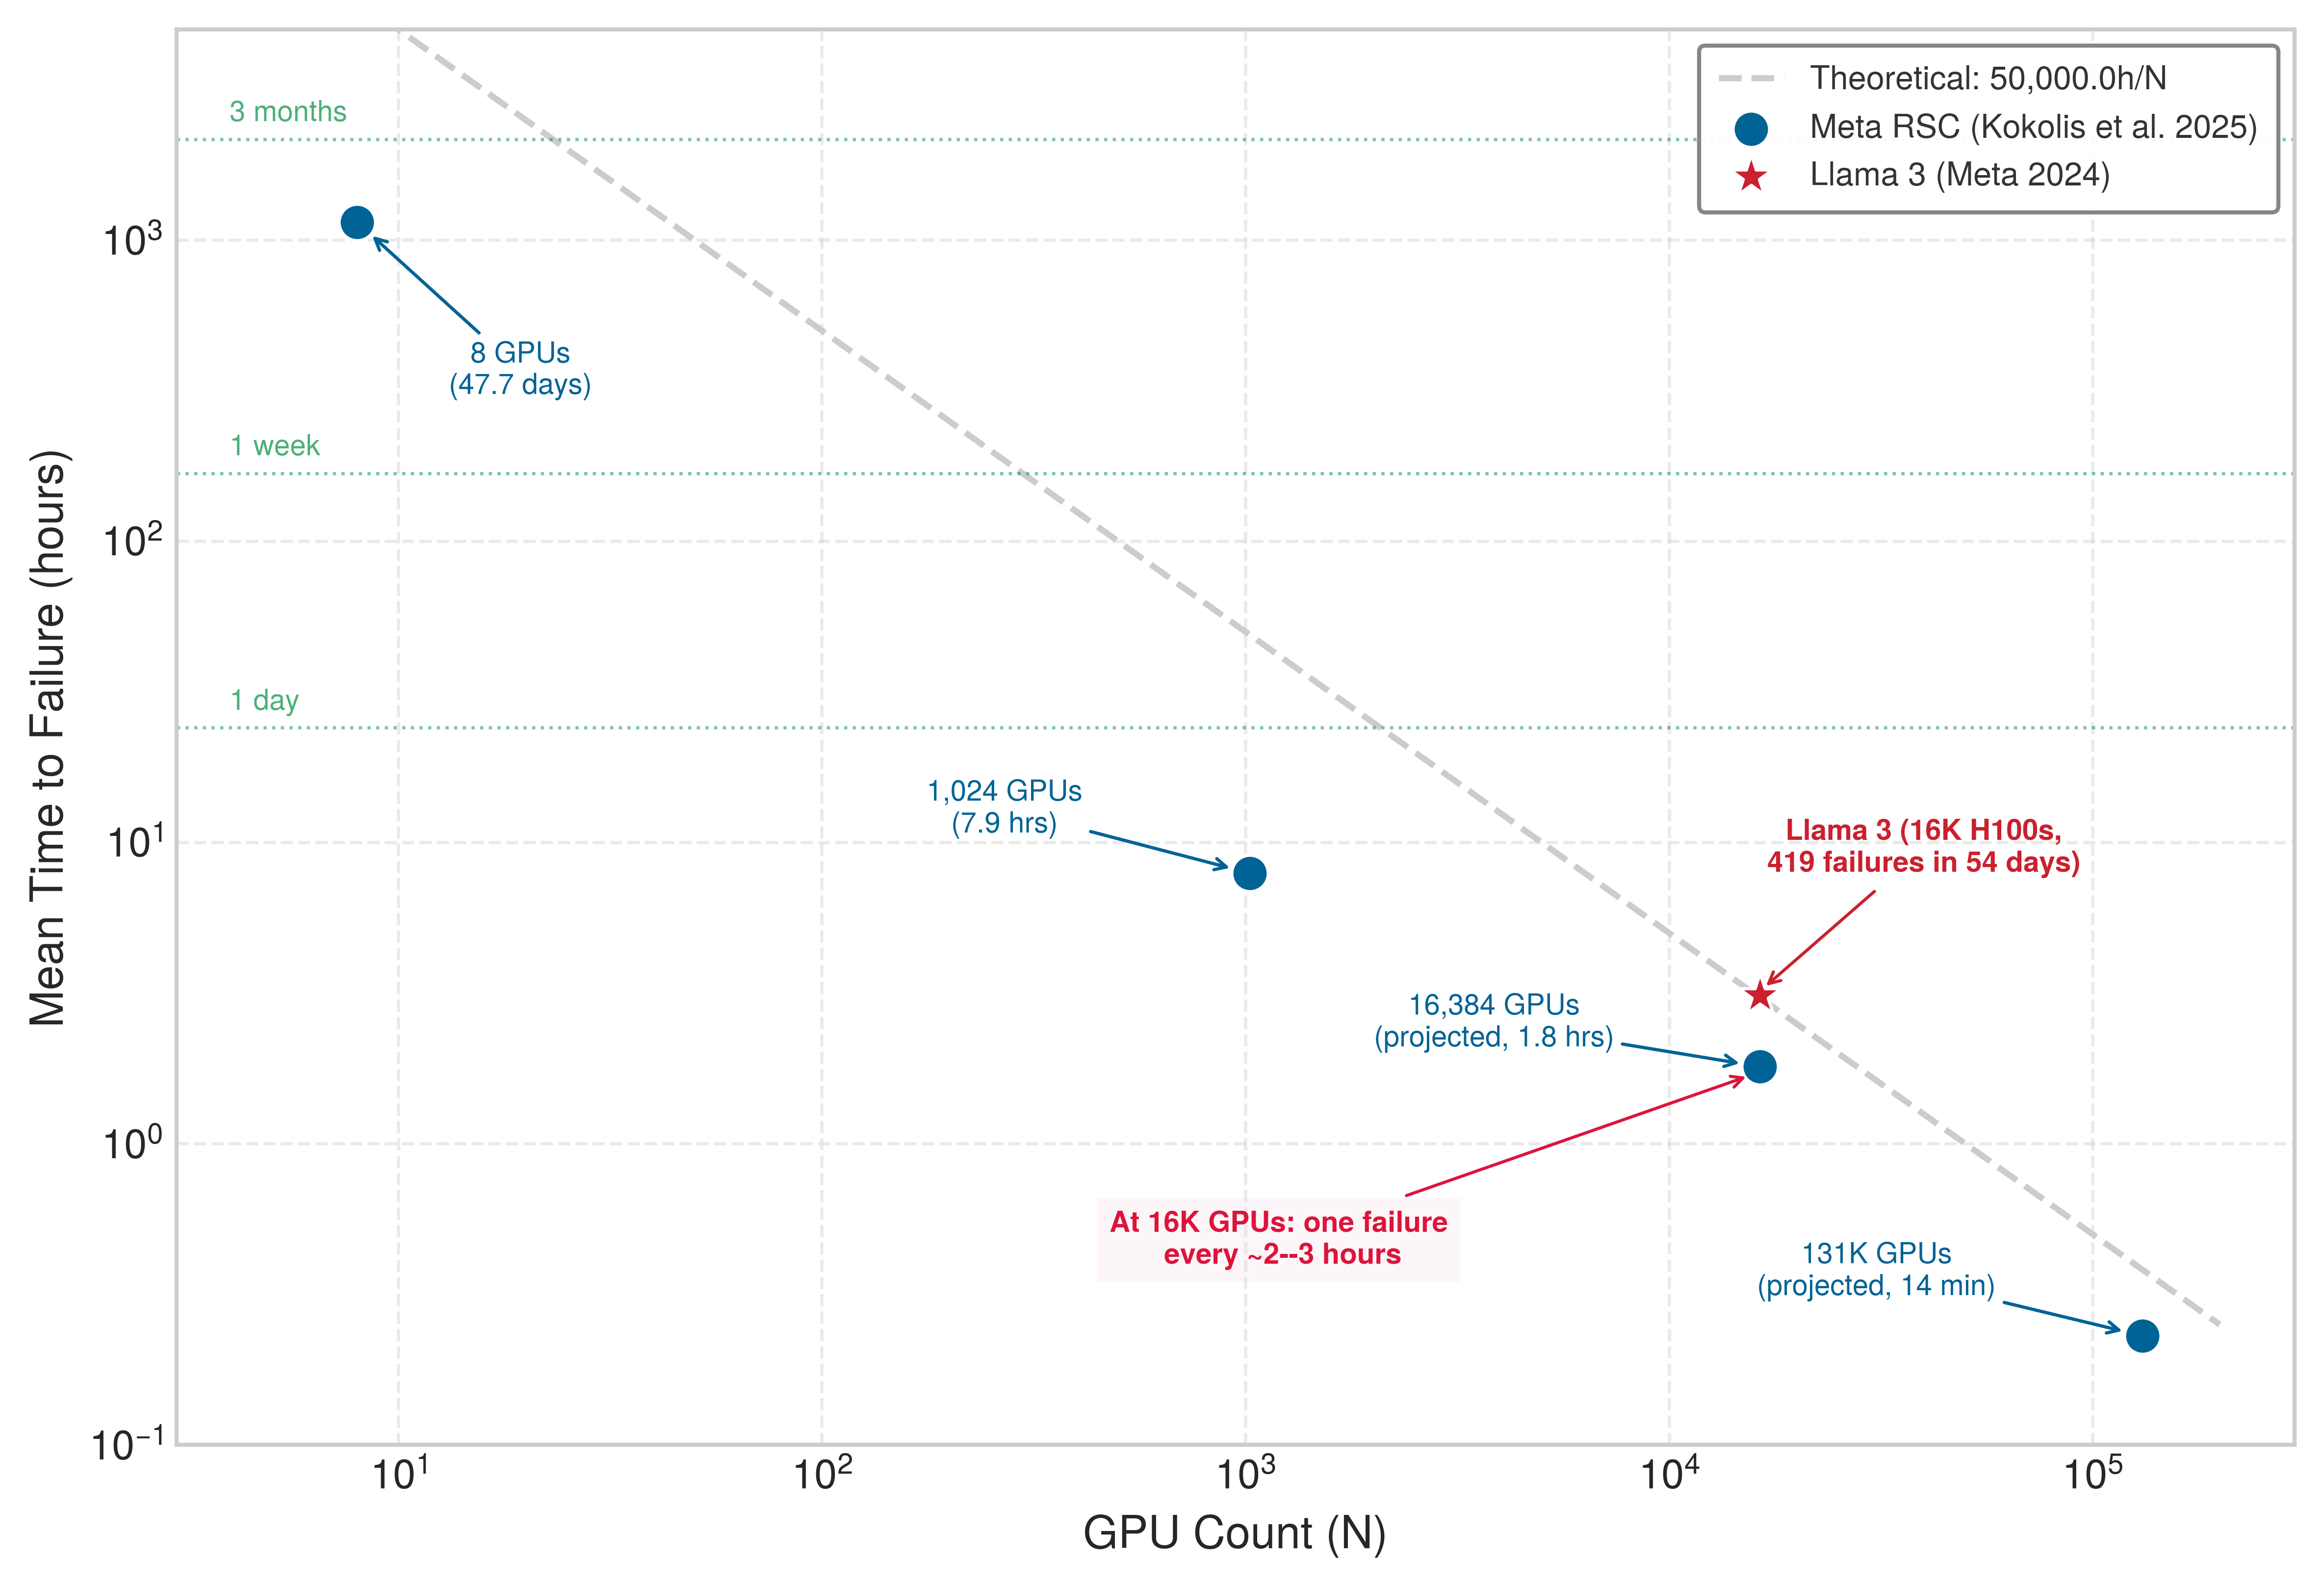
Production measurements confirm the \(1/\AcceleratorCount\) trend of table 1 and show that the GPU-only line is optimistic. Plotted on log-log axes, measured MTTF values and fitted projections from Meta’s clusters follow the slope of the \(50{,}000\,\text{h}/\AcceleratorCount\) line across more than three orders of magnitude in job size but sit below it, because a job can be interrupted by far more than its GPUs (figure 1). The Kokolis et al. (2025) study of Meta’s Research SuperCluster reported measured MTTF values for observed RSC job sizes and projected a 1.8-hour MTTF for 16,384-GPU jobs. That projection lands next to the Llama 3 run previewed in The Scale Moment (war story 7.2 follows its recovery), whose 419 unexpected interruptions across a 54-day snapshot on 16,384 H100 GPUs give an observed MTTF of about 3.1 hours. Together, the measured Llama run and Kokolis projection put 16,384-GPU training on a failure cadence of roughly two to three hours, bracketed by the 1.8-hour projection and the 3.1-hour measurement. This evidence turns the idealized \(1/\AcceleratorCount\) relation into an engineering constraint that determines checkpoint frequency, recovery architecture, and infrastructure investment.
7.3 Failure Taxonomy
A network partition that clears in seconds and a permanent GPU failure both interrupt a training step, yet retrying the first succeeds while retrying the second wastes cluster time on dead silicon. Silent memory corruption that produces wrong gradients demands a different defense again from a node crash that stops responding altogether. While the MTBF calculations quantify how often interruptions arrive—setting checkpoint intervals and spare-pool sizes—choosing the right recovery action requires distinguishing what kind of failure has occurred. In standard reliability terms, a fault is the underlying defect or disturbance, an error is the corrupted internal state it produces, and a failure is the externally visible misbehavior that the training or serving system must handle (Avizienis et al. 2004).
Avizienis, Algirdas, Jean-Claude Laprie, Brian Randell, and Carl Landwehr. 2004. “Basic Concepts and Taxonomy of Dependable and Secure Computing.” IEEE Transactions on Dependable and Secure Computing 1 (1): 11–33. https://doi.org/10.1109/TDSC.2004.2.
No single label captures all of these differences. Reliability decisions require three orthogonal axes: persistence (transient, intermittent, or permanent), manifestation (fail-stop, degraded, or value-corrupting), and failure scope (one device, one node, a rack or power domain, or the whole job). Two manifestations need names because liveness checks cannot see them. A gray failure is a component that stays alive but runs slowly or erratically, so it keeps answering the liveness checks that would flag a crash while every peer that waits on it slows down. Silent data corruption (SDC) goes further, producing wrong values with no error at all. A transient fault can therefore manifest as either a detected crash or silent corruption, while a permanent switch failure can remain confined to one rack or partition an entire job. The four subsections that follow are therefore not four parallel classes or mutually exclusive buckets (Constantinescu 2008; Lamport et al. 1982). Each takes the value of one axis that most changes recovery. Transient failures come from the persistence axis, because they show why a fault that clears can still leave state to repair. Fail-stop and Byzantine (value-corrupting) failures come from the manifestation axis, and correlated failures come from the scope axis. Two parts of the space are developed where they drive decisions. The intermittent and permanent persistence classes return with hardware faults (section 7.4.1), where persistence selects retry, quarantine, or replacement. The degraded manifestation returns with stragglers (section 7.9.5).
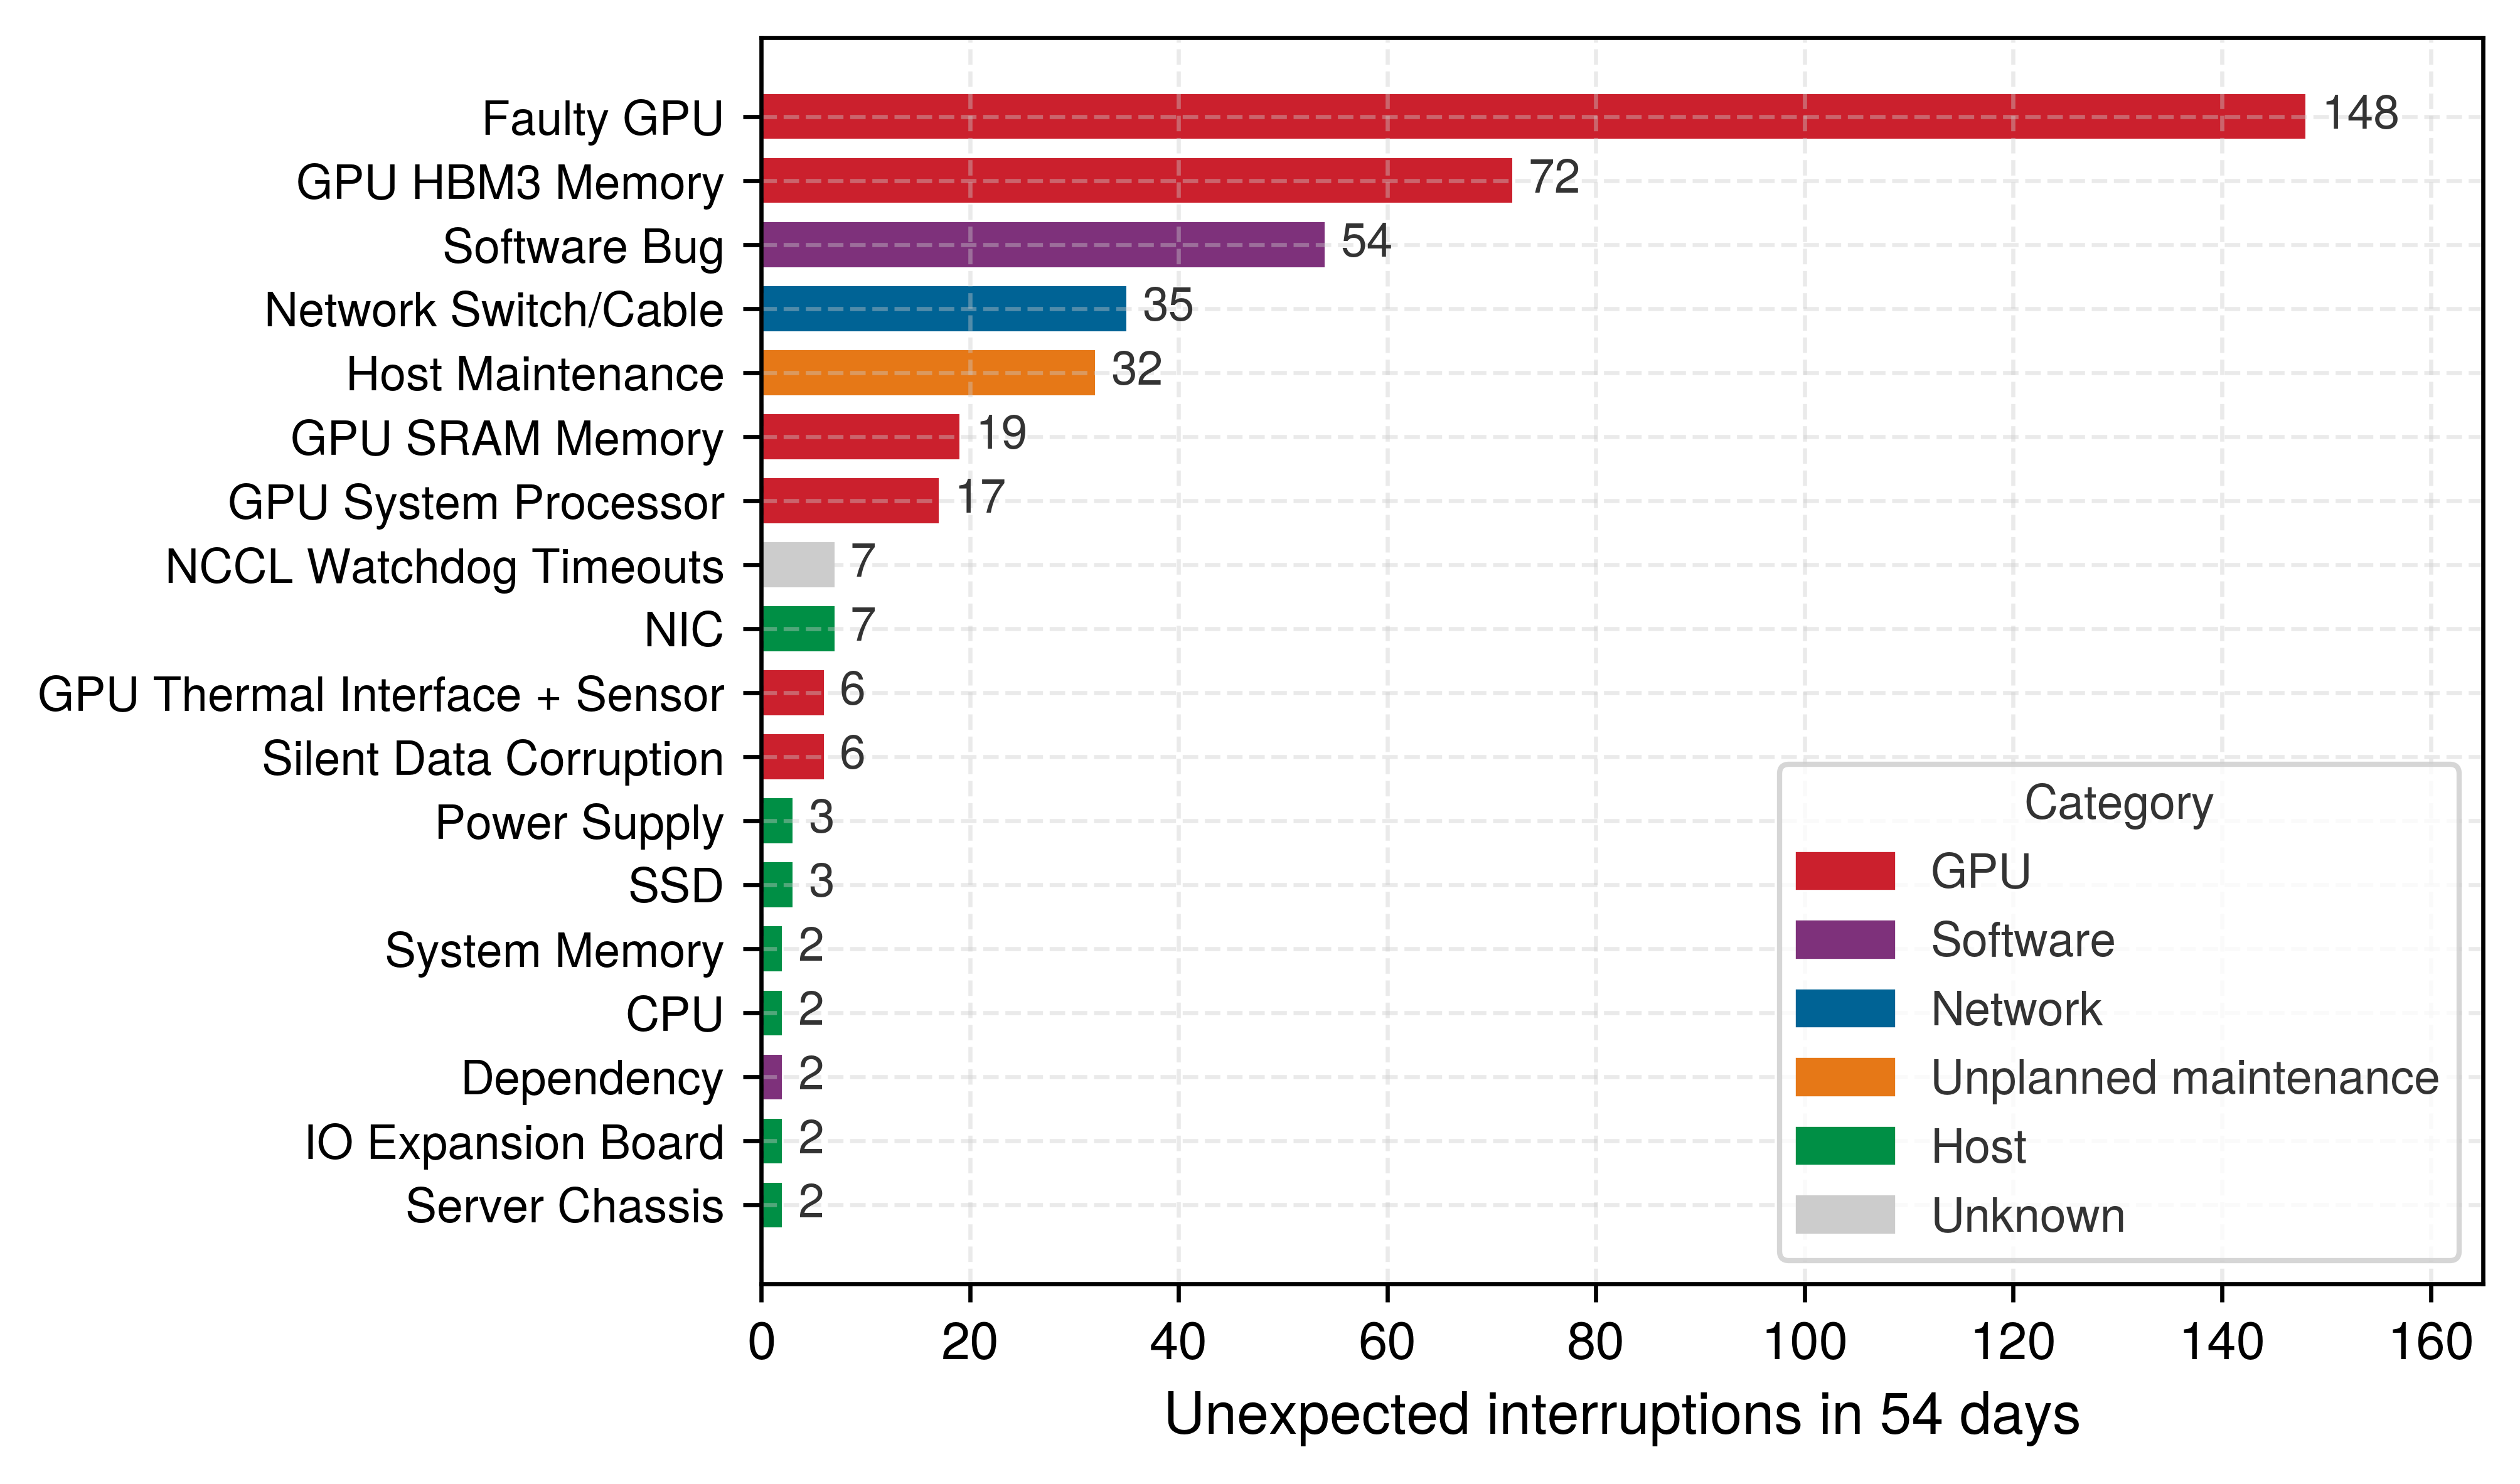
Production logs show which of these failures a large run actually meets. During a 54-day period of Llama 3 405B pretraining on 16,384 H100 GPUs, Meta traced each of 419 unexpected interruptions to a root cause (Dubey et al. 2024). Grouped by cause in figure 2, GPU components account for 268 of them, about 64 percent, led by 148 faulty GPUs and 72 HBM memory failures. Software bugs caused 54, network switches and cables 35, and the remaining host hardware, from NICs to power supplies, 21 between them. Only 6 interruptions were attributed to silent data corruption, and that count includes only corruption that was caught. Most fault-tolerance effort therefore goes to frequent, detectable accelerator failures, while the rare silent ones demand a different kind of defense.
7.3.1 Transient failures
A transient fault clears without physical repair, but the state it corrupts can persist after the disturbance ends, forcing recovery to retry or validate affected work before relying on that state. In large-scale training systems, temporary disruptions range from network packet loss, where dropped packets are recovered by transport retransmission, to memory bit flips triggered by cosmic-ray-induced single-event upsets.4 Timing disturbances can be equally disruptive without corrupting bits directly: under temperature spikes, thermal throttling reduces compute throughput without halting execution, while software timeouts fire when transient contention delays a collective beyond its allotted window.
4 Single-event upset (SEU): From particle physics, where “upset” denotes a nondestructive state change. Cosmic rays and alpha particles from chip packaging can flip bits in memory and logic; the observed rate depends on altitude, process technology, packaging materials, shielding, and workload (Ziegler et al. 1996; Baumann 2005). ECC memory corrects single-bit errors but cannot handle every multi-bit upset in the same word, leaving a residual silent-corruption risk that compounds across the terabytes of state in large-scale ML training.
Ziegler, J. F., H. W. Curtis, H. P. Muhlfeld, C. J. Montrose, B. Chin, M. Nicewicz, C. A. Russell, et al. 1996. “IBM Experiments in Soft Fails in Computer Electronics (1978–1994).” IBM Journal of Research and Development 40 (1): 3–18. https://doi.org/10.1147/rd.401.0003.
Baumann, R. 2005. “Soft Errors in Advanced Computer Systems.” IEEE Design and Test of Computers 22 (3): 258–66. https://doi.org/10.1109/mdt.2005.69.
Transient faults are particularly difficult to diagnose in ML training when they leave no explicit error signal. If hardware protection and the computation itself do not mask a memory bit flip during gradient computation, the corrupted value propagates into later updates while training continues. Large-scale SDC studies document such escaped corruption in production processors, and DRAM field studies confirm that memory errors occur frequently enough to require fleet-level monitoring (Dixit et al. 2021; Sridharan et al. 2015; Schroeder et al. 2009). In ML training, that undetected corruption surfaces as degraded gradients, anomalous loss curves, or rollback-worthy checkpoints rather than an explicit crash.
How the system responds to a transient failure therefore depends on whether the fault announces itself. Errors that raise explicit exceptions can be handled through bounded retry logic, whereas silent corruption requires end-to-end validation: checksums catch altered bytes in storage or transport, cross-rank digests expose disagreement across a supposedly identical reduced buffer, and statistical or replay checks test whether the computation itself remains plausible. Because a rank that computes the wrong local gradient and then checksums those wrong bytes will pass an ordinary transport check, only independent recomputation, invariants, or model-level evidence can expose the error.
7.3.2 Fail-stop failures
In synchronous distributed training, a single participant that goes silent stalls the entire group’s next update: a conventional AllReduce cannot complete until every rank supplies its input, so one dead GPU in a 10,000-GPU job can leave the other 9,999 accelerators waiting at the barrier until recovery begins. Smaller communication groups limit the immediate dependency, although pipeline or data-parallel stages soon propagate the stall across the rest of the job. Such fail-stop failures occur when a component ceases operation outright and stops responding to requests. A GPU hardware failure renders an individual accelerator unresponsive, a host node crash terminates all training processes on the machine, a network partition severs communication between a healthy node and the cluster, and a storage failure blocks workers from reading or writing checkpoint shards.
A stopped component gives a clearer symptom than one that keeps returning plausible but incorrect values, yet because a stopped rank announces itself only through silence, detection rests on timeouts that must separate an outright crash from a slow or isolated host, such as a GPU still writing a large checkpoint while the collective waits. Once a timeout flags the missing participant, the recovery system replaces or restarts it and restores the most recent valid checkpoint; section 7.9.1 sets that timeout threshold once the full recovery-time budget is in view.
7.3.3 Byzantine failures
Where a fail-stop component ceases to participate, a value-corrupting component can keep running while returning incorrect results, as when a GPU returns wrong gradients without raising an error, a link delivers a corrupted packet whose error pattern the CRC happens not to cover, or a worker computes different results for identical inputs and state. Byzantine failures allow arbitrary behavior, including inconsistent messages to different participants (Lamport et al. 1982). ML systems can encounter this broader failure model through silent data corruption or adversarial corruption. Numerical instability and determinism violations also require validation when they break the execution contract, but ordinary rounding differences or intentionally stochastic outputs are not themselves evidence of a faulty worker. The recovery concern is a participant whose accepted contribution can corrupt shared state without a visible crash.
Lamport, Leslie, Robert Shostak, and Marshall Pease. 1982. “The Byzantine Generals Problem.” ACM Transactions on Programming Languages and Systems 4 (3): 382–401. https://doi.org/10.1145/357172.357176.
The two models leave different evidence (figure 3). A fail-stop worker such as W2 falls silent, and its missing heartbeats make it suspect. A Byzantine worker such as W6 keeps sending messages on schedule, so it passes every liveness check while the values it sends are wrong.
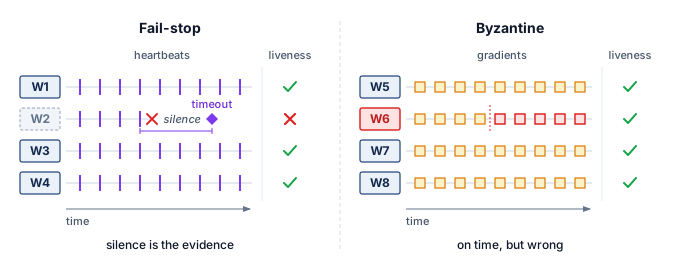
In an ML fleet, the most common source of value corruption is not an adversary but hardware that changes a value without raising an error, the silent data corruption already met among transient failures; its physical causes, the training signals that expose it, and the verification and hot-spare defenses that contain it are developed together in section 7.5, after the hardware faults that produce it. Whatever its source, a Byzantine contribution violates a contract that liveness checks never test. Ordinary data-parallel workers process different batches and need not produce identical local gradients; the required contract is that each contribution correctly represents its assigned computation. A single Byzantine worker can violate that contract and corrupt the averaged gradient, potentially causing training to diverge or converge to a poor solution.
Redundant computation supplies one form of evidence against Byzantine failures. Workers repeating a computation from matching inputs, state, and random-number streams can compare results under a stated numerical tolerance. Statistical outlier detection and invariants provide additional evidence without fully repeating the computation. Each method has a coverage limit. Agreement can miss shared faults, while a statistical anomaly can arise from legitimate data variation. Detection overhead must therefore be evaluated together with the faults the method can expose.
Byzantine-resilient distributed training algorithms exist but impose significant overhead. Krum (Blanchard et al. 2017) keeps the single worker gradient whose nearest neighbors lie closest to it and discards the rest, while coordinate-wise trimmed mean (Yin et al. 2018) drops the largest and smallest values in each coordinate before averaging what remains. Both compute aggregates that stay robust to a bounded number of Byzantine workers, but they require more communication and computation than simple averaging. Without such protection, corrupted gradients can push the optimizer toward an unreliable model state while the training job appears healthy. Reliability must therefore protect semantic correctness rather than process liveness alone.5
Yin, Dong, Yudong Chen, Kannan Ramchandran, and Peter Bartlett. 2018. “Byzantine-Robust Distributed Learning: Towards Optimal Statistical Rates.” International Conference on Machine Learning (ICML), 5650–59.
5 Byzantine-resilient ML: Named after Lamport’s 1982 “Byzantine Generals Problem,” these algorithms (Krum, trimmed mean, and signSGD, which aggregates only the signs of gradient coordinates by majority vote) tolerate a bounded fraction of corrupted workers, with the exact bound depending on the rule and its assumptions. Krum’s original analysis requires \(2\ByzantineClientCount + 2 < \KrumClientCount\) for \(\ByzantineClientCount\) Byzantine workers among \(\KrumClientCount\), while coordinate-wise median and trimmed mean rest on different robustness assumptions, so the tolerated fraction depends on the aggregation rule, dimensionality, and statistical model. For \(\KrumClientCount\) workers, Krum requires pairwise distance computations over worker gradients, so overhead grows quadratically with worker count and directly competes with the throughput gains of data parallelism (Blanchard et al. 2017).
Blanchard, Peva, El Mahdi El Mhamdi, Rachid Guerraoui, and Julien Stainer. 2017. “Machine Learning with Adversaries: Byzantine Tolerant Gradient Descent.” Advances in Neural Information Processing Systems (NeurIPS), 119–29.
7.3.4 Correlated failures
The reliability calculations in section 7.2 assume independent failures, yet real systems depart sharply from this assumption when common physical or operational dependencies take down multiple components at once. Within a single node, a power fault that exhausts the chassis’s redundant supplies, such as the loss of its feed circuits, removes every GPU in the chassis; across a cluster, a top-of-rack network switch failure isolates all attached nodes, while a cooling system failure can trigger thermal shutdowns down an entire row of racks. Shared software and operational dependencies widen the blast radius even further, because a software bug in an updated CUDA driver can crash processes across nodes whenever they exercise the affected code path, and operator error during cluster reconfiguration can render an entire fleet unreachable.
Correlated failures violate the independence assumption underlying equation 3. A model that counts only independent device failures omits shared hazards and their potentially larger blast radius; incident frequency and the number of affected devices must be modeled separately. Correlated failures can also defeat redundancy strategies. Three replicas of a model provide no protection against a shared power failure if all three run on the same power domain.
Defending against correlated failures requires classifying each failure by its scope, the failure domain it takes down, and ensuring that redundancy spans independent domains. Common failure domains in ML infrastructure range from a single GPU to an entire data center region, and each calls for its own mitigation (table 2). These domains nest, so a physical disruption scales upward from one eight-GPU node to a rack and then to a multi-rack power and network envelope (figure 4).
| Failure domain | Impact scope | Typical recovery time | Mitigation strategy |
|---|---|---|---|
| Single GPU | 1 GPU | Seconds (spare) | Hot spare, elastic training |
| Node (power/OS) | 8 GPUs | Minutes | Checkpoint, node replacement |
| Rack (ToR switch) | 32–64 GPUs | Minutes to hours | Cross-rack redundancy |
| Power domain | 100–500 GPUs | Hours | Multiple power feeds |
| Data center region | All GPUs | Hours to days | Geographic distribution |
| Software version | All GPUs running version | Minutes (rollback) | Staged rollouts |
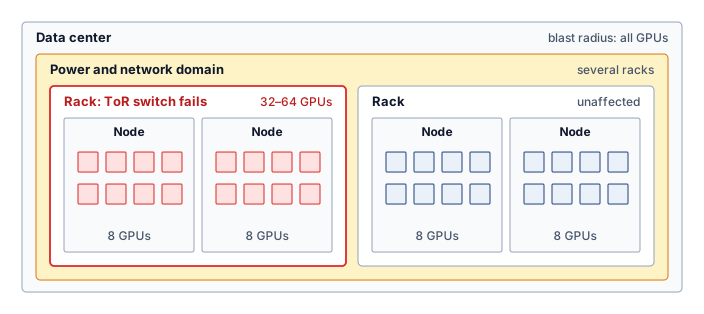
The containment hierarchy in table 2 and figure 4 explains why replica placement must match the fault being tolerated: placing replicas within the same domain provides zero protection against that domain’s failure mode. The highlighted rack in figure 4 contains nodes that share a top-of-rack (ToR) switch, so that switch’s loss can disconnect every attached node from the job. A neighboring rack with a separate switch can remain reachable during that event even if both racks share a power domain, yet that same placement does not protect against loss of their shared power source. Redundancy must therefore cross the relevant failure boundary, not merely occupy different devices.
↩︎ The failure domain and its physical nesting from node to rack to building are established in Node health and reliability.
Checkpoint 7.1: Mapping failure domains
Verify your understanding of how failure domains nest and their operational impact:
War Story 7.1: The supercomputer that swapped in spare cubes (2024)
Context: Google’s Tensor Processing Unit (TPU) v4 machine-learning supercomputer used 4,096 TPU chips connected by a custom 3D torus inter-chip interconnect (ICI) fabric, and Google engineers published their operating experience with automatic fault resiliency and hardware recovery (Zu et al. 2024).
Mechanism: At 4,096-chip scale, machine and link failures could remove participants or paths required by a job’s configured communication topology.
Impact: Losing a required participant can interrupt the synchronous job across the slice. Losing a link instead raises a routing question: whether the remaining fabric can still provide the required communication paths.
Fix: Google used optical circuit switches (OCS) to assemble replacement slices from spare healthy TPU cubes, the pod’s building blocks of chips wired as a \(4{\times}4{\times}4\) mesh, for machine outages, together with fault-tolerant routing for supported OCS outage patterns. The response depended on which resource failed.
Systems lesson: Fault tolerance is a topology-management problem. In tightly coupled accelerator fleets, recovery must preserve the communication graph, not merely replace an individual component; otherwise one local hardware fault can become a cluster-wide training interruption.
Self-Check: Question
- Sequence the following failure domains in ascending order of their physical containment hierarchy and typical blast radius (from smallest number of affected GPUs to largest):
- Top-of-rack (ToR) switch failure isolating 32–64 GPUs
- Single GPU hardware lockup affecting 1 GPU
- Multi-rack Power Distribution Unit (PDU) failure affecting 100–500 GPUs
- Node-level power loss (a fault that exhausts a node’s redundant PSUs) affecting 8 GPUs
- Regional power grid disruption affecting all GPUs in a data center
During a distributed AllReduce operation, a single GPU rank experiences a silent bit flip in an exponent calculation. The rank does not crash, passes network timeouts, and contributes an anomalously large gradient to the collective average. How is this failure categorized, and what is its primary danger to the training run?
- Byzantine failure; it silently poisons model weights and gradients while bypassing standard process-liveness and timeout detection.
- Fail-stop failure; it immediately halts the AllReduce collective and triggers an automated container restart.
- Transient network failure; it is automatically corrected by underlying InfiniBand packet retransmission protocols.
- Benign gray failure; it is absorbed by stochastic gradient descent with zero impact on final convergence.
7.4 Hardware Faults at Fleet Scale
A cosmic ray that flips one bit in a GPU’s high-bandwidth memory and a solder joint that cracks under thermal cycling are physical events, but the recovery system never observes them directly. It observes symptoms: a gradient spike with no process crash, a rank that disappears from the collective, or a node that fails only after it heats under sustained load. The failure taxonomy of section 7.3 already classifies such events by persistence, manifestation, and scope. For hardware, persistence carries most of the operational weight because it decides whether the fleet should retry, quarantine, or replace a component, while manifestation decides whether the fleet notices the fault at all.
ML workloads raise the stakes of each fault. A training step performs trillions of arithmetic operations on state that persists into later steps, so a wrong value can survive beyond the computation that produced it. The damage depends on the affected value and its later use. Under the IEEE 754 format,6 a sign-bit flip inverts a weight, while an exponent-bit flip can move a small gradient by many orders of magnitude. Fault-injection studies show that network resilience varies with model, layer, and bit position, so a few faults in vulnerable locations can cost disproportionate accuracy (Reagen et al. 2018). A valid-looking corrupted value can enter learned state without triggering the process failure that would otherwise initiate recovery.
6 IEEE 754: The IEEE 754 floating-point standard defines the binary32 format with 1 sign bit, 8 exponent bits, and 23 fraction bits (IEEE Standards Association 2019). Because bit positions differ so much in consequence, resilience mechanisms often prioritize the sign and exponent bits rather than treating all bits as equally important.
IEEE Standards Association. 2019. IEEE 754-2019: Standard for Floating-Point Arithmetic. https://doi.org/10.1109/IEEESTD.2019.8766229.
Reagen, B., U. Gupta, L. Pentecost, P. Whatmough, S. K. Lee, N. Mulholland, D. Brooks, and G.-Y. Wei. 2018. “Ares: A Framework for Quantifying the Resilience of Deep Neural Networks.” 2018 55th ACM/ESDA/IEEE Design Automation Conference (DAC), 1–6. https://doi.org/10.1109/dac.2018.8465834.
↪ How an FP16 exponent-bit flip rescales a value by \(2^{16}\) and can saturate an attention softmax is developed in Silent Data Corruption in Attention.
Fleet scale turns these rare device events into routine operating conditions. Smaller geometries and lower operating voltages can reduce the charge needed to disturb a stored value (Baumann 2005), and fleet studies at Google and Meta found that a small but persistent population of processors, on the order of a few per several thousand machines, computes wrong results without raising any error (Hochschild et al. 2021; Dixit et al. 2021). Studies of accelerator training fleets reach the same conclusion: rare hardware faults appear often enough that software-level detection and recovery become part of the training system design (He et al. 2023). ML system architects must therefore treat hardware as an unreliable substrate and budget for end-to-end integrity checks, replayed computation on high-value paths, and periodic consistency checks as system requirements rather than high-performance computing specialties.
7.4.1 Fault persistence and the fleet response
Each persistence class from the taxonomy maps to a different fleet action, from retry for a fault that leaves nothing to repair, through quarantine for one that returns under load, to replacement for one that repeats on every attempt (figure 5). A transient fault, as section 7.3.1 established, leaves no lasting defect from that event, so the fleet’s question is only whether its effect escaped. A single-event upset, a voltage droop on an unstable power path (Reddi and Gupta 2013), a timing violation, or a soft error in combinational logic (Mukherjee et al. 2005) can corrupt a tensor, packet, or instruction. Detection and correction can prevent propagation; affected state may otherwise require rollback. During training, an undetected error in weights or gradients can compromise convergence and contaminate subsequent checkpoints (He et al. 2023). During stateless inference, an activation error can remain confined to one request (Mahmoud et al. 2020). If that activation enters retained state such as a KV cache, later outputs can also depend on it.
Reddi, Vijay Janapa, and Meeta Sharma Gupta. 2013. Resilient Architecture Design for Voltage Variation. Synthesis Lectures on Computer Architecture. Springer International Publishing. https://doi.org/10.1007/978-3-031-01739-1.
Mukherjee, S. S., J. Emer, and S. K. Reinhardt. 2005. “The Soft Error Problem: An Architectural Perspective.” 11th International Symposium on High-Performance Computer Architecture, 243–47. https://doi.org/10.1109/hpca.2005.37.
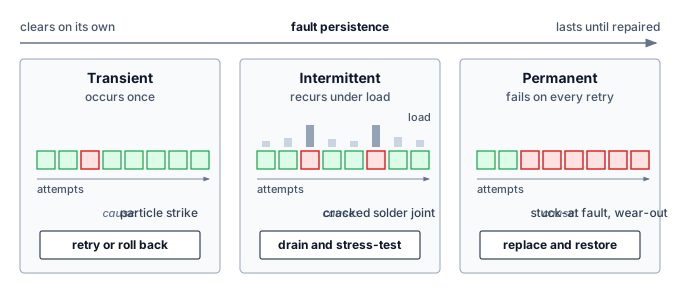
A permanent fault announces itself through repeatability. The same accelerator, memory cell, or link fails again after retry, often at the same address or in the same workload phase. Manufacturing defects and wear-out mechanisms such as electromigration7 and oxide breakdown produce this signature, and the stuck-at fault, in which a signal remains fixed at 0 or 1 regardless of input, is its standard abstract model (Seong et al. 2010). Repeatability helps locate the defect but does not make the result trustworthy. A permanent datapath fault keeps producing wrong gradients until the device is drained from the cluster (He et al. 2023), and rerunning the computation on the same device reproduces the error instead of exposing it. The fleet must stop trusting the component, quarantine it, and restore from a checkpoint that predates its first bad write.
7 Electromigration: Gradual displacement of metal atoms in conductors by electron momentum transfer, first characterized in early electromigration studies and later modeled in Black’s reliability equation (Black 1969). Mean time to failure decreases with higher current density and higher temperature, so sustained high-power accelerator workloads make thermal management a direct determinant of fleet lifespan.
Black, James R. 1969. “Electromigration–a Brief Survey and Some Recent Results.” IEEE Transactions on Electron Devices 16 (4): 338–47. https://doi.org/10.1109/T-ED.1969.16754.
Seong, N. H., D. H. Woo, V. Srinivasan, J. A. Rivers, and H.-H. S. Lee. 2010. “SAFER: Stuck-at-Fault Error Recovery for Memories.” 2010 43rd Annual IEEE/ACM International Symposium on Microarchitecture, 115–24. https://doi.org/10.1109/micro.2010.46.
He, Yi, Mike Hutton, Steven Chan, Robert De Gruijl, Rama Govindaraju, Nishant Patil, and Yanjing Li. 2023. “Understanding and Mitigating Hardware Failures in Deep Learning Training Systems.” Proceedings of the 50th Annual International Symposium on Computer Architecture, 1–16. https://doi.org/10.1145/3579371.3589105.
Rashid, Layali, Karthik Pattabiraman, and Sathish Gopalakrishnan. 2015. “Characterizing the Impact of Intermittent Hardware Faults on Programs.” IEEE Transactions on Reliability 64 (1): 297–310. https://doi.org/10.1109/tr.2014.2363152.
Zhang, Jeff, Kartheek Rangineni, Zahra Ghodsi, and Siddharth Garg. 2018. “ThUnderVolt: Enabling Aggressive Voltage Underscaling and Timing Error Resilience for Energy Efficient Deep Learning Accelerators.” 2018 55th ACM/ESDA/IEEE Design Automation Conference (DAC), 1–6. https://doi.org/10.1109/dac.2018.8465918.
Intermittent faults create the most operational ambiguity because they produce evidence and then disappear. A node may pass a reboot test, rejoin the fleet, and fail again only when the next job drives the package into the same thermal, voltage, or communication regime. Cracked solder joints, aging packages, and contamination between contacts create these load-dependent conditions (Constantinescu 2008; Rashid et al. 2015), and reduced voltage margins cause timing errors that are hard to reproduce (Zhang et al. 2018). Sporadic errors of this kind can accumulate across iterations and degrade convergence without any explicit failure (Rashid et al. 2015). An intermittent node should therefore remain suspect until evidence clears it. The fleet drains it from long jobs, correlates its error logs, and readmits it only after it passes stress tests under the load that exposed the fault; otherwise one marginal component can make validation and recovery untrustworthy for every job that lands on it. Across the three persistence classes, the evidence that exposes a fault also determines the fleet’s response (table 3).
Constantinescu, C. 2008. “Intermittent Faults and Effects on Reliability of Integrated Circuits.” 2008 Annual Reliability and Maintainability Symposium, 370–74. https://doi.org/10.1109/rams.2008.4925824.
| Persistence | Fleet signature | Detection evidence | Fleet response |
|---|---|---|---|
| Transient | One-time wrong value or lost message; retry succeeds | Corrected-error counters, checksum mismatches, gradient spikes | Correct or retry; roll back if durable state was contaminated |
| Intermittent | Recurring errors under specific load, heat, or voltage | Correlated error logs and repeated anomalies on one node | Drain and quarantine; readmit only after screening under load |
| Permanent | Reproducible failure at the same device, address, or link | Failed self-test or replay mismatch on the same device | Replace the component; restore from a checkpoint before the fault |
7.4.2 Hardware lifecycle and the hazard rate
Persistence classifies a fault once it has occurred; the hazard rate describes when over an accelerator’s operating lifespan faults are most likely to strike. Figure 6 plots the hazard function \(\ComponentHazardRate(\TimeInstant)\) across component lifecycles, partitioning operational longevity into three distinct reliability regimes. The first phase, infant mortality, brings elevated failure rates from manufacturing defects, improper installation, and early-life failure of marginal components; for electronic components it typically lasts days to weeks, which is why burn-in testing8 stresses hardware before deployment to precipitate those early failures prior to production use.
8 Burn-in testing: A controlled screening procedure stresses components before deployment to expose early-life defects. Temperature, voltage, duration, and acceptance criteria depend on the component and its qualified test procedure; a generic semiconductor screening recipe is not an operating specification for an assembled accelerator. Screening reduces the defective population entering service but does not certify every later workload or fault mode.
Birolini, A. 2017. Reliability Engineering: Theory and Practice. 8th ed. Springer Berlin Heidelberg. https://doi.org/10.1007/978-3-662-54209-5.
Klutke, G., P. C. Kiessler, and M. A. Wortman. 2003. “A Critical Look at the Bathtub Curve.” IEEE Transactions on Reliability 52 (1): 125–29. https://doi.org/10.1109/tr.2002.804492.
After surviving infant mortality, components enter the useful-life phase, where failure rates remain relatively constant under the standard reliability-engineering model (Birolini 2017; Klutke et al. 2003). This phase spans the longest portion of a component’s lifetime and is the regime where the exponential reliability model in equation 1 applies most accurately. For data center GPUs, the useful-life window is an operational planning concept shaped by refresh cycles, cooling, utilization, and observed fleet health rather than a fixed physical duration.
As components age, they enter the wear-out phase, where failure rates increase due to accumulated wear. For GPUs, wear mechanisms include electromigration in circuits, thermal cycling stress on solder joints, and degradation of thermal interface materials. The onset of wear-out depends heavily on operating conditions; components operated at high temperatures or with frequent thermal cycling enter wear-out earlier.
The practical implication for ML systems is that fleet-wide failure rates can depend on age distribution. Under the bathtub model, a new cohort passes through elevated early-life risk, a relatively stable period, and eventual wear-out. Screening, operating conditions, and replacement policy determine how much of that pattern appears in field data. Mixed-age fleets combine cohorts at different stages, so their aggregate hazard need not follow the curve of a single cohort.
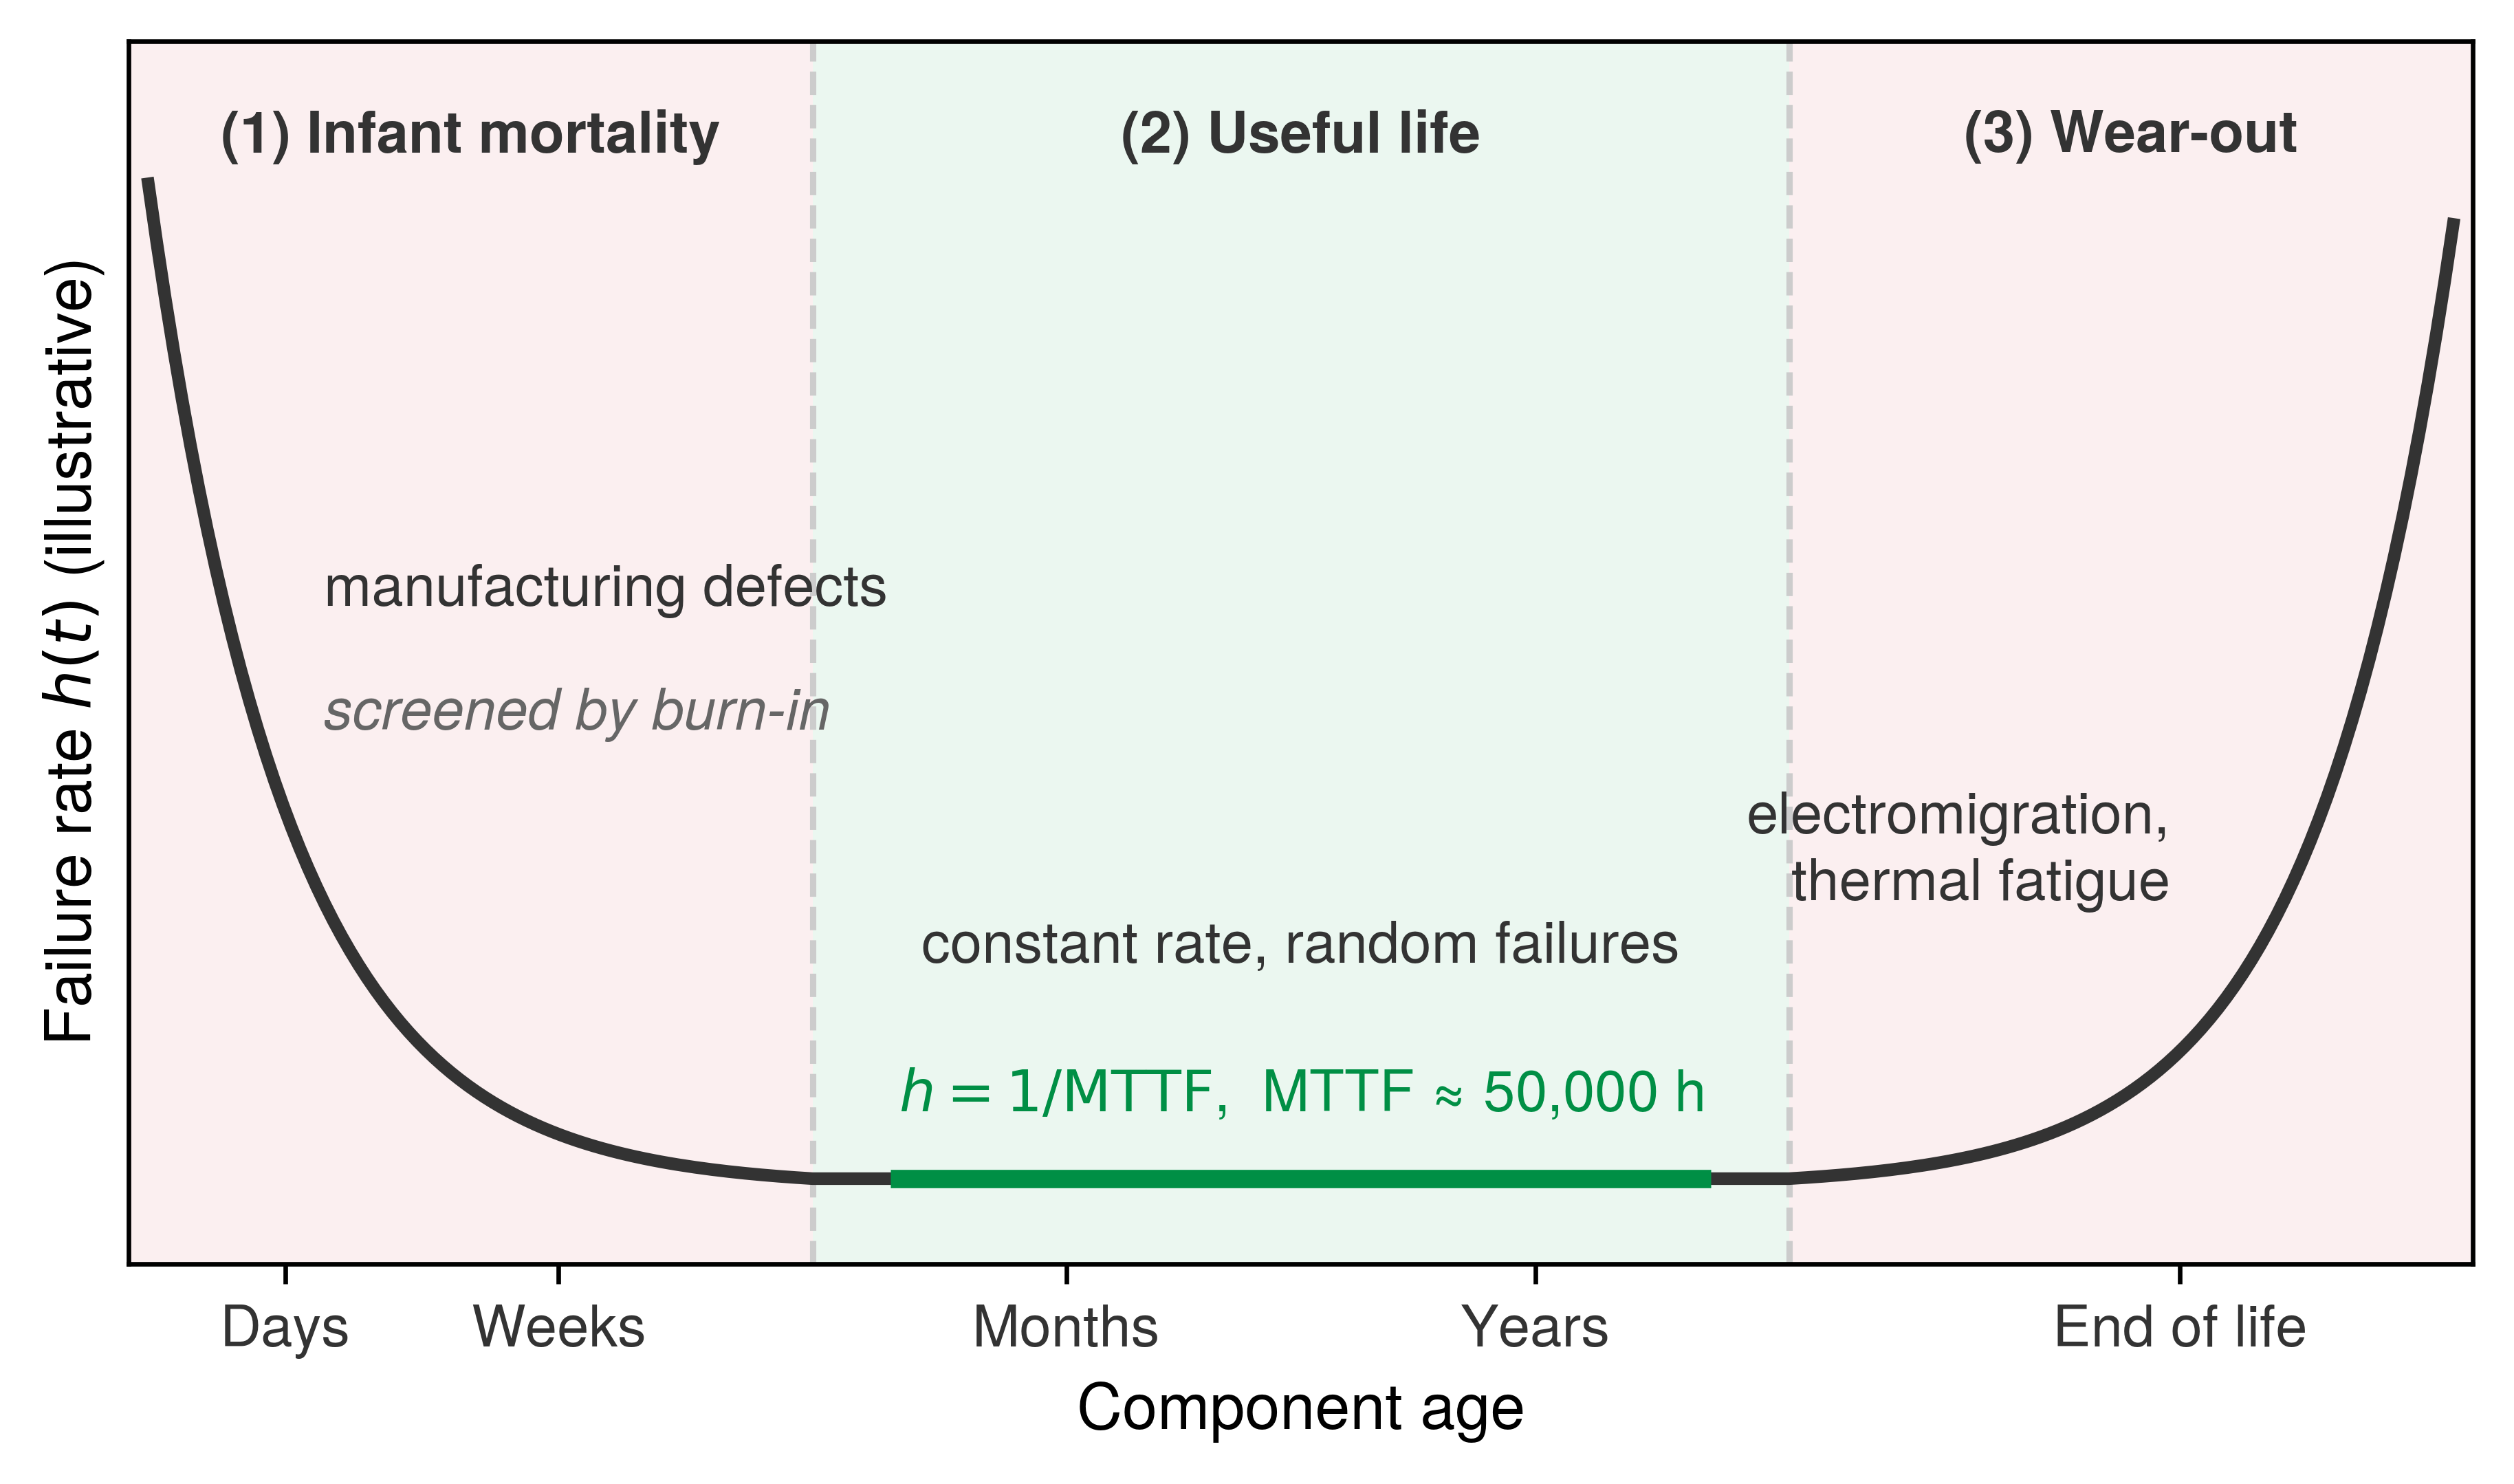
These three hazard regimes in figure 6 translate directly into admission control and maintenance policies. Before assigning new or repaired nodes to a long training run, operators use matrix-multiply, memory, and communication stress tests to expose marginal components. During service, temperature trends, error counts, and performance degradation help identify devices for scheduled replacement. Screening moves failures out of expensive production runs. An infant-mortality failure caught during a few hours of stress testing costs only idle time, while the same failure weeks into a pretraining run forces a checkpoint rollback, which is why operators often route fresh or repaired nodes to short jobs first. Monitoring then checks whether the constant-rate model remains appropriate as the fleet ages.
7.4.3 Fleet-scale detection and mitigation
Fault rates drive fleet decisions through compounding. The analysis in section 7.2 shows how per-device failure rates become fleet interruption rates, and memory errors compound in the same way. Field studies of DRAM in large data centers found errors frequent enough that error-correcting memory, background scrubbing, and error-rate monitoring are standard fleet practice rather than optional hardening (Schroeder et al. 2009; Sridharan et al. 2015). Protection consumes some capacity and bandwidth for check bits and scrubbing, but that cost is small compared with a corrupted multi-week run.
Schroeder, Bianca, Eduardo Pinheiro, and Wolf-Dietrich Weber. 2009. “DRAM Errors in the Wild: A Large-Scale Field Study.” ACM SIGMETRICS Performance Evaluation Review 37 (1): 193–204. https://doi.org/10.1145/2492101.1555372.
9 Hamming codes (1950): Richard Hamming developed error-correcting codes at Bell Labs after relay computers repeatedly detected errors in his unattended weekend jobs and abandoned them rather than repairing them. A Hamming code uses parity checks to locate a single-bit error with \(\mathcal{O}(\log \HammingDataBitCount)\) check-bit overhead; adding an overall parity bit yields the extended single-error-correcting, double-error-detecting form. Memory ECC implementations vary in code and coverage, so the system must account for both corrected errors and residual faults outside that coverage.
Hamming, R. W. 1950. “Error Detecting and Error Correcting Codes.” Bell System Technical Journal 29 (2): 147–60. https://doi.org/10.1002/j.1538-7305.1950.tb00463.x.
10 CRC (cyclic redundancy check): Polynomial checksum family introduced by Peterson and Brown (1961). CRC coverage depends on the polynomial, frame length, and error model; it is best understood as a low-cost detection layer rather than a universal guarantee. In distributed ML training, checksums or hashes can validate gradient payloads exchanged during collectives; without a verification layer, a corrupted gradient packet can silently poison the parameter update for every worker in the collective.
Peterson, W. W., and D. T. Brown. 1961. “Cyclic Codes for Error Detection.” Proceedings of the IRE 49 (1): 228–35. https://doi.org/10.1109/jrproc.1961.287814.
Bushnell, Michael L, and Vishwani D Agrawal. 2002. “Built-in Self-Test.” Essentials of Electronic Testing for Digital, Memory and Mixed-Signal VLSI Circuits 1: 489–548. https://doi.org/10.1007/0-306-47040-3_15.
Hochschild, Peter H., Paul Turner, Jeffrey C. Mogul, Rama Govindaraju, Parthasarathy Ranganathan, David E. Culler, and Amin Vahdat. 2021. “Cores That Don’t Count.” Proceedings of the Workshop on Hot Topics in Operating Systems, 9–16. https://doi.org/10.1145/3458336.3465297.
Detection works in layers with different coverage and cost. At the hardware layer, error-correcting codes9 (Hamming 1950) correct and detect the memory-error patterns covered by the implemented code, and link-level CRCs10 check corruption in transit. These protections operate within their enabled storage and transport boundaries; they do not validate an incorrect arithmetic result merely because its bytes arrive intact. Before deployment, built-in self-test and the burn-in screening of the hardware lifecycle expose manufacturing defects and permanent faults (Bushnell and Agrawal 2002). During service, operators periodically pull nodes from production and run known-answer stress tests on arithmetic, memory, and interconnect, because defective processors often fail only on particular instruction mixes, data patterns, or operating points (Hochschild et al. 2021; Dixit et al. 2021).
The software layer draws its cheapest evidence from metrics the training loop already emits. Statistical checks on loss, gradient norms, and activations flag silent drift (Chandola et al. 2009), missed heartbeats identify suspected failures (Kawazoe Aguilera et al. 1997), and watchdog timers catch tasks that stall without crashing (Pont and Ong 2002). A node that stays alive but runs slowly or erratically, the gray failure of the failure taxonomy, can degrade progress while still meeting a liveness timeout, so section 7.9.5 treats it through straggler detection. Redundant computation adds stronger evidence on selected paths, either periodically or in response to an anomaly, by replaying a step on another device or comparing independently computed results. Its frequency depends on the residual corruption risk, the value of the protected state, and the cost of detecting an error late.
Chandola, Varun, Arindam Banerjee, and Vipin Kumar. 2009. “Anomaly Detection: A Survey.” ACM Computing Surveys 41 (3): 1–58. https://doi.org/10.1145/1541880.1541882.
Kawazoe Aguilera, Marcos, Wei Chen, and Sam Toueg. 1997. “Heartbeat: A Timeout-Free Failure Detector for Quiescent Reliable Communication.” In Lect. Notes Comput. Sci. Springer Berlin Heidelberg. https://doi.org/10.1007/bfb0030680.
Pont, Michael J, and Royan HL Ong. 2002. “Using Watchdog Timers to Improve the Reliability of Single-Processor Embedded Systems: Seven New Patterns and a Case Study.” Proceedings of the First Nordic Conference on Pattern Languages of Programs, 159–200.
Checkpoint 7.2: Classifying a hardware fault
Verify your understanding of the transient, permanent, and intermittent fault categories and the fault, error, failure progression:
Self-Check: Question
A cluster node passes cold-boot diagnostics and memory tests during morning maintenance, but repeatedly produces incorrect matrix multiplication results under sustained thermal load during large-batch backward passes. What type of fault does this represent, and what is the appropriate operational response?
- Transient fault; retry the exact batch on the same node since the fault will disappear automatically.
- Intermittent fault; collect runtime telemetry under load, quarantine the node, and replace or repair it rather than returning it directly to production.
- Permanent stuck-at-0 fault; immediately discard all training checkpoints because the device cannot execute any instructions.
- Software race condition; upgrade the host OS kernel and increase the AllReduce heartbeat timeout threshold.
Compare the impact of a single-bit flip in the sign bit versus a single-bit flip in the exponent bits of an IEEE 754 floating-point weight or gradient tensor during neural network training.
A node that stays alive and keeps answering heartbeats but runs slowly or erratically, so that timeouts never fire, is said to suffer a ____ failure.
How does a permanent stuck-at fault in a specialized accelerator’s Tensor Core multiply-accumulate unit manifest differently during training compared to a traditional processor crash?
- It causes an immediate kernel execution timeout that terminates the local process group within milliseconds.
- It corrupts operating system page tables, forcing an immediate kernel panic and node reboot.
- It triggers a PCIe bus reset that automatically redirects subsequent GEMM operations to host CPU memory.
- It can produce repeatable incorrect values in computations using the defective datapath while the process remains alive.
Because electronic components exhibit a constant failure rate during their useful life phase under the exponential reliability model, cluster operators should assign newly delivered accelerator nodes directly to multi-week foundation model pretraining runs without prior burn-in testing.
7.5 Check-and-Verify Defenses Against Silent Data Corruption
Of the hardware faults just classified, the costliest are the ones whose manifestation is silent. A corrupted value that raises no error passes every liveness check the fleet runs, and training keeps building on it. Defending against silent data corruption therefore requires checks that establish a correct result, not merely a live process, and choosing those checks starts with where the corruption comes from and how it surfaces in training.
7.5.1 The physics of silent corruption
Digital hardware implements deterministic operations, but physical fault occurrence requires a probabilistic reliability model. Two mechanisms illustrate the distinction. Single-event upsets (SEUs), the particle strikes introduced with transient failures, create fleet exposure that grows with device count and operating time even when the per-device rate is low. Manufacturing variances can leave “marginal” chips that pass initial QA but fail under particular inputs or operating conditions. Voltage and temperature margins matter, including supply disturbances during rapid current changes (\(d\AcceleratorSupplyCurrent/d\TimeInstant\)). These defects can produce repeatable errors, so a probabilistic fleet model does not imply that every individual fault is random.
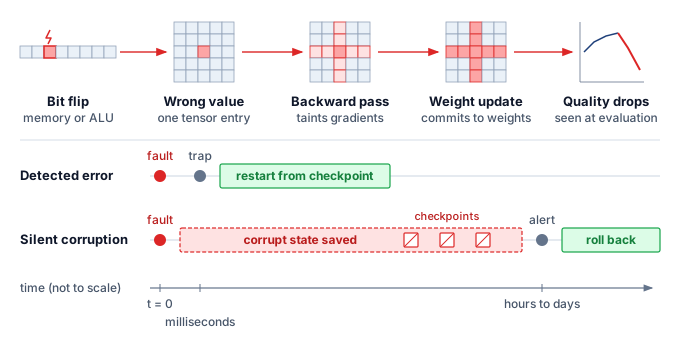
Facebook documented a pervasive SDC issue where a hardware fault caused a valid file to be reported as “size zero” during decompression (Dixit et al. 2021); the system “worked” without crashing, but data was silently deleted. In ML, the same failure manifests as valid-looking but numerically corrupted gradients. The pipeline trace in figure 7 follows a single ALU or memory bit flip as it corrupts an individual tensor entry, taints gradient reduction during the backward pass, commits into weights, and finally surfaces as degraded quality at evaluation. The comparative timelines beneath contrast this silent latency with a standard detected error: while a hardware trap halts within milliseconds to restart cleanly from the last checkpoint, silent corruption commits contaminated state into checkpoints over hours or days before an evaluation alert forces a costly rollback.
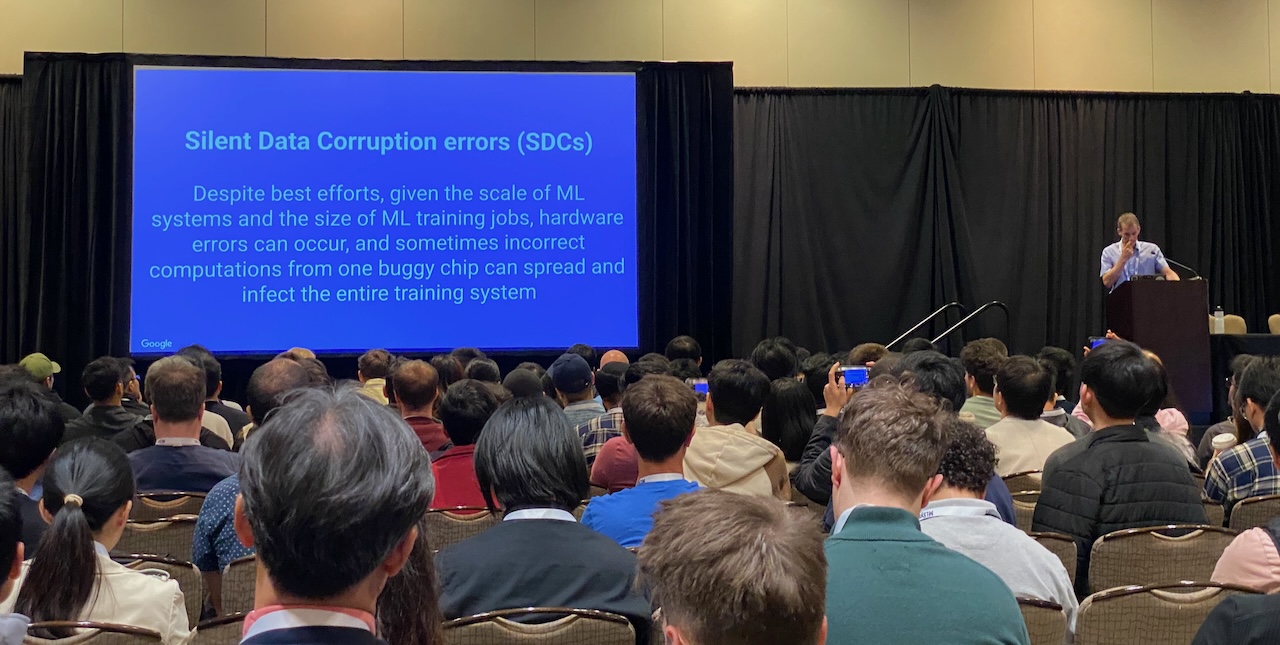
Telemetry from production training fleets shows this corruption is routine rather than anomalous. At modern training scales, hardware bit flips occur regularly, and erroneous computations from a single malfunctioning accelerator can propagate into the global model state, as Jeff Dean documented in his MLSys 2024 keynote on silent data corruption (Dean 2024) (figure 8).
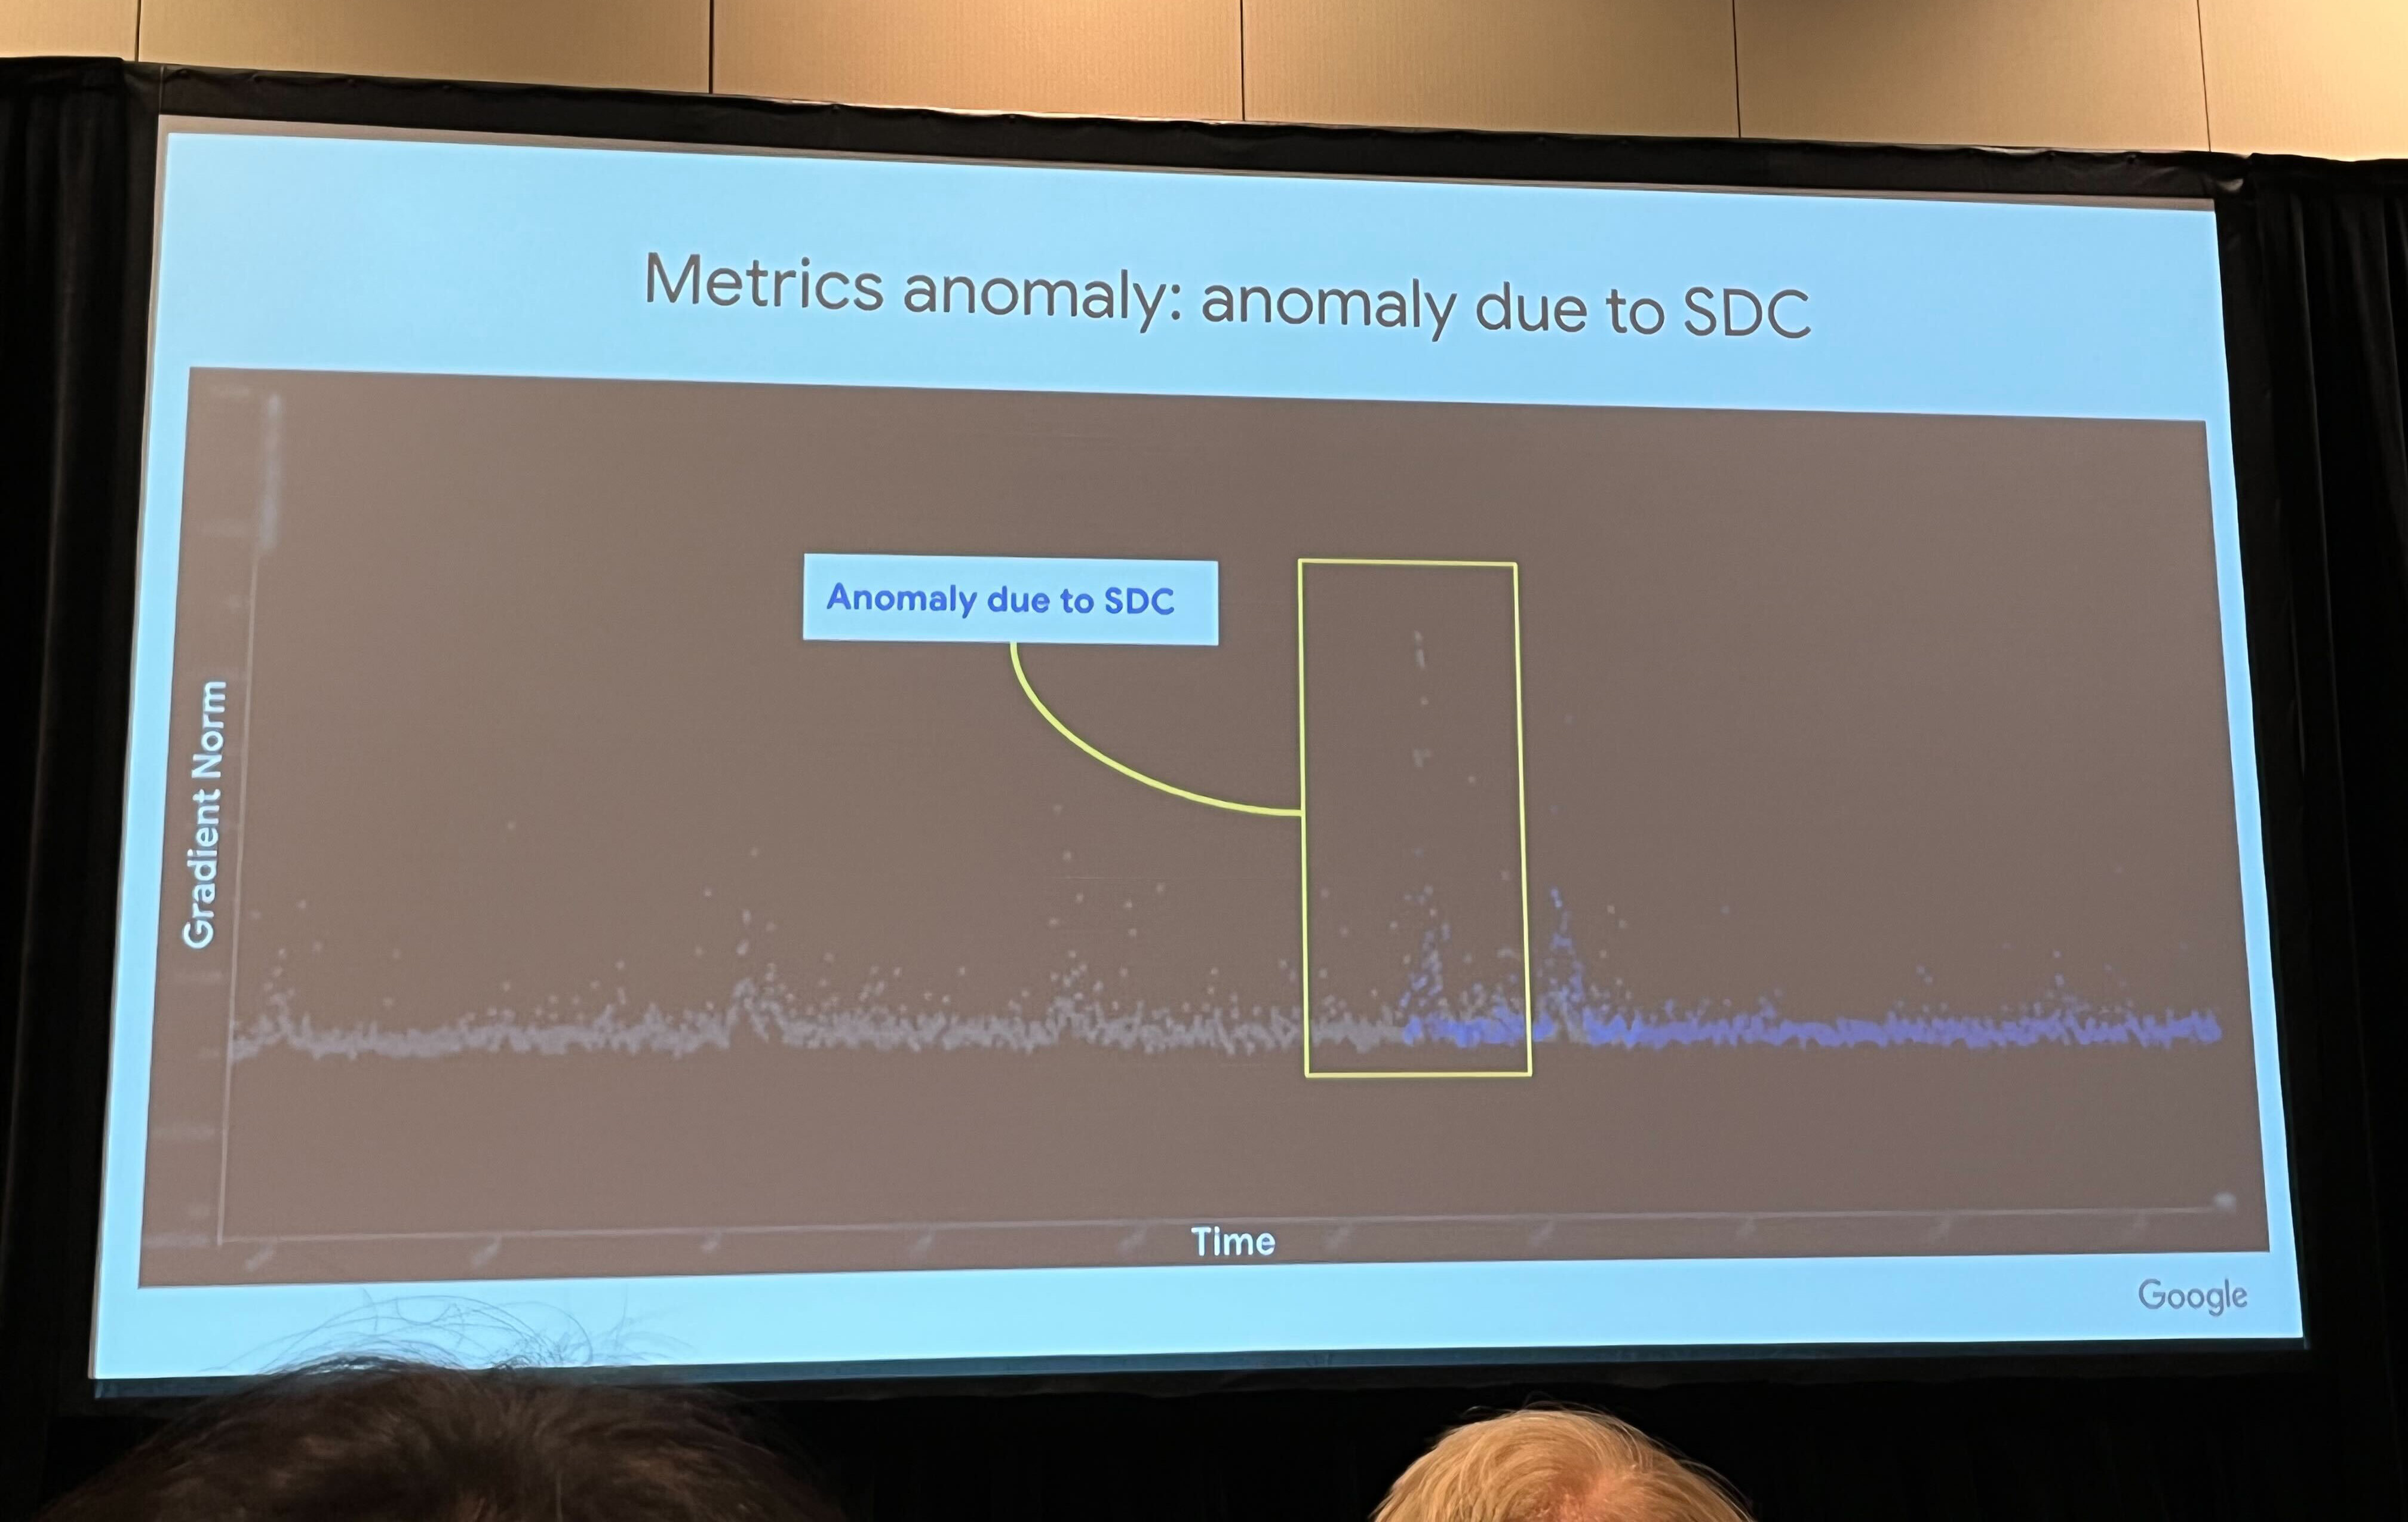
In the Google training telemetry presented by Dean (2024), figure 9 identifies an abrupt gradient-norm anomaly as an SDC event. The plot shows the symptom without identifying the damaged bit or circuit. Corrupting a floating-point exponent is one mechanism that can greatly change a tensor value and subsequent updates. Gradient clipping can limit update magnitude, but it does not reconstruct the correct gradient; an anomaly detector must trigger validation or recovery before suspect state is accepted.
7.5.2 Verification at fleet scale
Cumulative SDC probability nears certainty over a long run.
Even a small per-GPU SDC rate accumulates across repeated collective operations, and the accumulation grows with fleet size. Any single collective is unlikely to contain an SDC event. Under the illustrative rate used in the analysis that follows, the per-step probability remains small while the cumulative probability grows over a long training run, reaching \(1 - e^{-1} \approx 63\) percent once the expected number of events reaches one. On the chapter’s 10,000-GPU cluster, that rate gives one expected event roughly every 100 hours, or about 22 over the three-month run of the chapter opening. The notebook below scales the same estimate to a fleet ten times larger to show where the trend leads, since the expected interval shrinks in proportion to fleet size. Standard AllReduce reduces the supplied contributions; it does not establish that an alive worker computed a correct gradient. The fleet therefore needs validation appropriate to its fault model in addition to liveness checks.
Check-and-verify methods test data-path invariants, subject to the boundary drawn for transient failures in section 7.3.1. Digests test byte integrity and agreement within their error-detection limits; they cannot establish that the original computation was correct. Independent computation, an algorithmic invariant, or replay tests that additional claim under a declared fault model. A quick estimate shows how much exposure those checks must cover.
Napkin Math 7.1: SDC risk accumulation
Problem: Under an illustrative generic SDC-rate assumption, calculate the probability that at least one GPU in a 100,000-GPU fleet experiences an SDC event during a single 2 s training step.
- Fleet size: 100,000 accelerators.
- Individual risk: \(10^{-6}\) per GPU-hour (an illustrative generic SDC-rate assumption).
- The exposure: In a 2-second window, the fleet has \(100{,}000 \times (2/3600) \approx 56\) “GPU-hours” of exposure.
- The probability: \(\Pr(\text{at least one SDC}) \approx\) 0.0056 percent.
Systems insight: Under this illustrative constant-rate assumption, a 100k-GPU fleet expects one SDC event every 18,000 steps (roughly every 10 hours), even though the per-step probability is only 0.0056 percent. A CRC or hash can protect each shard or reduced buffer against corruption in transit or storage, while a redundant reduction can test the arithmetic path independently. Robustness moves from being a restart problem to a verification problem only when the verification covers the failure mechanism being claimed.
Full replication protects a broader computation path at a correspondingly high resource cost. Dual modular redundancy runs every computation twice and compares the results, and triple modular redundancy runs it three times and takes a majority vote, paying 100 and 200 percent hardware overhead to detect or mask a fault within a single control deadline (Sheaffer et al. 2007; Arifeen et al. 2020). These guarantees depend on the replicas avoiding a shared fault. The price is justified in safety-critical embedded control, such as a vehicle’s onboard computers, where one wrong output can endanger people and the replicated hardware is a small computer. For fleet training, duplicating every step of a run on 10,000 GPUs doubles the compute devoted to those steps, before comparison and coordination costs. When corruption is rare and rollback can recover valid state, selective redundancy can protect useful progress at lower cost. Screening removes suspect devices, statistical checks run continuously, standby pools absorb drained nodes, and periodic or triggered recomputation checks selected execution paths.
Sheaffer, J. W., D. P. Luebke, and K. Skadron. 2007. “A Hardware Redundancy and Recovery Mechanism for Reliable Scientific Computation on Graphics Processors.” Graphics Hardware 2007: 55–64. https://doi.org/10.2312/eggh/eggh07/055-064.
Arifeen, Tooba, Abdus Sami Hassan, and Jeong-A Lee. 2020. “Approximate Triple Modular Redundancy: A Survey.” IEEE Access 8: 139851–67. https://doi.org/10.1109/access.2020.3012673.
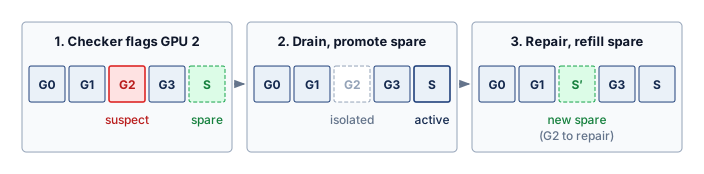
Google’s reactive hot-spare protocol shows how those pieces combine in three stages (figure 10). When runtime monitors flag an anomalous gradient and replay implicates a suspect accelerator (G2), the scheduler isolates that device, promotes a standby hot spare (S) into the active ring, and provisions a replacement spare (S’) while the suspect unit undergoes hardware diagnostics (Dean 2024). The fleet pays in advance for one idle device per pool rather than for a duplicate of every computation, and the protocol shifts the burden of correctness from unverified hardware to system-level auditing. Even so, these hardware checks reduce only the risk of an unreliable physical substrate; they do not protect against faults that the software stack introduces itself, bugs that look like valid computation while corrupting the ML pipeline.
Dean, Jeff. 2024. Exciting Directions in Systems for Machine Learning. MLSys 2024 invited talk.
Checkpoint 7.3: Detecting silent corruption
Verify your understanding of Byzantine failures and SDC:
Self-Check: Question
In a 100,000-GPU training cluster where each device has an illustrative SDC probability of \(10^{-6}\) per GPU-hour, what is the expected SDC exposure and failure cadence during continuous AllReduce training with 2-second step times?
- The cluster experiences roughly 55.6 GPU-hours of exposure per 2-second step, resulting in an expected SDC event approximately every 18,000 steps (every ~10 hours).
- The cluster experiences an SDC event on every single step because 100,000 GPUs exceed the reliability threshold.
- The cluster experiences an SDC event once every 1,000 days because \(10^{-6}\) is negligible for 2-second steps.
- The cluster experiences an SDC event exactly every 50,000 hours regardless of cluster size.
Explain what gradient checksums and redundant computation can each detect during AllReduce, and why checksums alone cannot establish the arithmetic correctness of every worker contribution.
Safety-critical embedded systems use dual or triple modular redundancy to detect or mask hardware faults. Explain why the same approach does not transfer to a 10,000-GPU training fleet, and describe how fleets spend redundancy instead.
A component that remains active but sends arbitrary, corrupted, or conflicting data requires ____ fault tolerance reasoning rather than only fail-stop detection.
7.6 Software Faults
A team spends three months testing a large language model (LLM) against complex prompt-level failure cases, only to realize that its preprocessing script kept only the last 512 tokens of each input, silently discarding the system prompt on long requests. The example exposes an ordinary source of ML failure that algorithmic testing can miss. A logic error in a data loader or prompt assembler can preserve valid tensor shapes while changing the computation’s meaning, allowing the pipeline to continue without a crash.
Software faults require a different recovery lens from hardware failures. Hardware faults enter from silicon, electrons, and physical wear; software faults enter through design choices, dependency versions, and pipeline glue. The fault-tolerance problem shifts from replacing a failed component to identifying which valid-looking transformation corrupted data, gradients, or predictions, and every boundary between framework, library, runtime, and distributed system is a place where such a transformation can hide.
7.6.1 Software fault properties and propagation
Software faults in ML frameworks range from logic errors to resource leaks, concurrency bugs, and integration failures, and they propagate across system boundaries. A tensor leaked on every iteration lets a correctly sized job drift toward the device memory limit over hundreds of steps and then fail with an out-of-memory error, which makes root-cause attribution difficult without per-layer memory profiling. Race conditions in asynchronous updates can lose or overwrite parameter updates, and deadlocks11 leave workers waiting on messages that never arrive. Some of these faults appear only under high load, on particular hardware, or with a specific pairing of a high-level library and a low-level numerical library such as cuDNN, so root-cause analysis must treat the model code, the runtime, and its dependencies as one versioned artifact.
11 Pipeline deadlock: In pipelined training, a deadlock can form when stage 1 waits for a free buffer to send activations to stage 2 while stage 2 waits for stage 1 to accept its backward gradients. Neither stage can proceed, and because every other stage depends on them, the whole job stalls with no error raised, which a collective timeout eventually converts into a detectable failure.
7.6.2 Software fault detection and prevention
Because many software faults leave the pipeline running while corrupting gradients, reliability evidence must establish which invariant failed and which recovery action is now safe. Several tests verify recovery guarantees that later sections build in full, and each needs only the invariant it protects. A restore drill checks a manifest, the record that names every checkpoint shard and the training step they share. A membership test kills or partitions a worker and checks that, once it has been replaced, it can no longer write state the job will trust. Every such test is judged against two bounds that a recovery must meet, how much completed work it may lose and how long it may take before useful work resumes. Checkpointing turns those bounds into the formal recovery objectives of section 7.8. Later sections of this chapter build the guarantees themselves, the manifest protocol in section 7.8.5.2 and the epochs, leases, and write fencing that stop a replaced worker in section 7.9.2.
The prompt-truncation bug from the opening example should never survive until runtime. A unit test should catch the tokenizer boundary, an integration replay should catch the batch shape and metadata path, and a fault-injection test should verify that the resulting alert blocks publication or rolls back to a known-good state for the injected case. Each gate earns its place through the recovery claim it supports, from rejecting a change before distributed execution to authorizing an automated rollback (table 4).
| Reliability evidence | Invariant exercised | Decision enabled |
|---|---|---|
| Boundary unit test | Tokenizer limits, tensor shapes, masks, and step metadata remain valid | Reject the change before distributed execution |
| Deterministic replay | A recorded batch produces equivalent state on known-good hardware | Separate input or software defects from suspect hardware |
| Checkpoint restore drill | A committed manifest restores every shard and resumes at its named step | Accept the generation as satisfying the recovery contract |
| Membership fault injection | A killed or partitioned worker loses ownership and cannot write after replacement | Validate ownership handoff and communicator rebuild |
| Corruption injection | A changed shard, reduced buffer, or checkpoint fails the intended verifier | Block the optimizer step or roll back before propagation |
| Dependency rollback test | A versioned runtime and artifact set can return to the last known-good combination | Authorize automated rollback instead of manual repair |
These safeguards matter only when each gate targets a concrete corruption path. A test that checks only whether the tokenizer runs is too weak; it must assert that system prompts, labels, masks, and sequence-length metadata survive preprocessing with the intended semantics. Integration replay then follows one recorded batch through loading, sharding, collation, and model input construction. Fault injection tests whether the detector fires before the protected commit and whether recovery stays within the named bounds on lost work and recovery time for the injected fault. Restore drills, stale-writer rejection, and corrupted-shard rejection therefore provide evidence that generic build success cannot supply, and section 7.14 exercises those claims directly once the recovery paths themselves have been built. Before building those paths, however, a fleet must decide how much protection each workload is worth.
Self-Check: Question
Why are GPU memory leaks in 70B+ parameter distributed training pipelines particularly destructive and difficult to diagnose compared to standard CPU memory leaks?
- GPU memory is dynamically swapped to NVMe disk automatically, causing unpredictable I/O thrashing rather than out-of-memory errors.
- GPU allocators immediately throw segmentation faults upon the first unreleased tensor, preventing any batch execution.
- Accelerator memory is scarce (40–80 GB per device) and shared across weights, optimizer state, and activations; a small leak per batch gradually builds over hundreds of steps until triggering an un-checkpointed OOM crash mid-run.
- GPU memory leaks only occur when using mixed-precision BF16 formats and disappear entirely when switching to FP32 weights.
Contrast a pipeline deadlock with a data race condition in distributed parallel training in terms of their system symptoms and impact on model convergence.
Justify why a silent data preprocessing defect (such as unintended prompt truncation or incorrect token masking) presents a much higher compute and financial risk than a syntax error that crashes on the first batch.
A preprocessing change silently truncates prompts and discards the system prompt. Sequence the reliability gates in the order that should catch the defect, from earliest and cheapest to the final proof that recovery works:
- A fault-injection test showing that the resulting alert blocks publication or rolls back to a known-good state
- A boundary unit test asserting that tokenizer limits, system prompts, and masks survive preprocessing
- An integration replay that follows one recorded batch through loading, sharding, collation, and model input construction
7.7 The Cost of Failure
Hardware, silent corruption, and software together set how often a fleet fails and in what ways. What each failure costs depends on the work it destroys, and a defense is worth buying only where it removes more of that cost than it adds. The price of a single failure already varies by orders of magnitude across workloads.
7.7.1 Failure cost by workload
While the mathematics of failure rates apply universally, the failure impact by model type differs dramatically. The impact of losing an hour of training depends on what that training costs, how much state must be recovered, and how long recovery takes. These factors vary by orders of magnitude across model architectures, from LLMs, where a lost day of progress costs hundreds of thousands of dollars in compute, to vision models that lose modest amounts of progress (table 5).
| Model type | Typical training duration | Checkpoint size | State sensitivity | Failure cost |
|---|---|---|---|---|
| Archetype A (GPT-4/Llama-3) | Weeks to months | 2.45 TB (175B) | High (position in data order) | $0.5M compute per 24 hr loss |
| Vision (ViT-Large) | 1–3 days | 1.2 GB | Medium (augmentation state) | $10–50K per day loss |
| Archetype B (DLRM at Scale) | Continuous | 10 TB+ (embeddings) | Very High (embedding freshness) | Revenue impact per hour |
| Speech (Whisper-scale) | 3–7 days | 5–10 GB | Medium | $50–200K per day loss |
| Scientific (AlphaFold) | Days to weeks | 10–50 GB | High (exploration state) | Research delay |
Large language model training illustrates how a costly allocation magnifies each hour of lost progress. The chapter’s 10,000-GPU cluster at approximately $2/GPU-hour incurs $0.5M in compute costs per day. A job checkpointed only once a day can lose up to a full day of progress to one failure, which costs $0.5M in wasted compute plus schedule delay. At the checkpoint interval derived in section 7.8.1, the same failure costs minutes of rework instead of a day. The checkpoint overhead is correspondingly large. At the 14-byte-per-parameter resumable format that the checkpointing analysis uses (BF16 weights, FP32 master weights, and two FP32 Adaptive Moment Estimation (Adam) moments), the 175B-parameter running example writes 2.45 TB at every save.
7.7.2 Investing in protection
Every GPU cycle, network byte, and storage drive dedicated to checkpointing, standby nodes, or verification is a resource that is not training the model, yet skimping on protection leaves a multi-million-dollar run exposed to day-long rollbacks. Rational investment in fault tolerance therefore weighs what a failure destroys against what the defense costs to run.
When a failure strikes, its bill extends well beyond the GPU-hours burned on steps that must be replayed. Repeating lost work delays the delivery of the trained model, ties up accelerators that could have run other jobs, and pulls engineers away from research to diagnose faults and nurse manual restarts. On the other side of the cost account, prevention carries a continuous overhead even when the cluster is healthy: checkpoint storage scales with model size and save frequency, checkpoint writes compete for memory and network bandwidth, hot spares and automated recovery controllers consume standing infrastructure, and fault-tolerant coordination adds software complexity that must be maintained and debugged.
Optimal investment balances these two curves against cluster scale. For a small job on a few GPUs where hardware failures are weeks apart, infrequent checkpoints and manual restarts are cheaper than standing recovery infrastructure. On thousands of GPUs where failures arrive several times a day, frequent checkpoints, automated failover, and elastic resizing pay back their overhead many times over. The checkpoint interval derived in section 7.8.1 applies this exact marginal balance to a single decision variable, choosing the cadence where the cost of one more save equals the expected rework it prevents.
Equation 5 presents a simplified economic model for expected cost per training run:
\[ \TotalTrainingRunCost= \BaseTrainingComputeCost+ \mathbb{E}[\TrainingFailureCount] \times \FailureEventCost+ \FaultToleranceCost \tag{5}\]
where \(\BaseTrainingComputeCost\) is the base compute cost, \(\mathbb{E}[\TrainingFailureCount]\) is the expected number of failures during training, \(\FailureEventCost\) is the cost per failure, and \(\FaultToleranceCost\) is the cost of fault tolerance mechanisms. The cost per failure includes wasted compute plus overhead.
Equation 6 formalizes when fault tolerance investment is justified:
\[ \frac{\partial \FaultToleranceCost}{\partial \FaultToleranceInvestment} < -\frac{\partial (\mathbb{E}[\TrainingFailureCount] \times \FailureEventCost)}{\partial \FaultToleranceInvestment} \tag{6}\]
where \(\FaultToleranceInvestment\) represents investment in fault tolerance mechanisms and the base compute cost is held fixed. The negative derivative on the right is the marginal reduction in expected failure cost. Additional protection reduces total expected cost while this reduction exceeds its marginal cost; an interior optimum equates the two when the cost functions have a suitable minimum.
One investment worked through the criterion shows what it decides. Let \(\FaultToleranceInvestment\) be a hot-spare node held idle beside the chapter’s 10,000-GPU cluster, so that a failed node’s replacement no longer waits for the scheduler to find capacity. Its marginal cost is 8 GPUs idling all day, about $384 per day. Its marginal benefit is the recovery time it removes from each failure while every other GPU waits. At the cascade’s 6.2 failures/day, each minute removed from every recovery is worth about $2,100 per day, so the spare pays for itself once it shortens each recovery by about 11 seconds, provided it is refilled before the next failure arrives some 3.9 hours later. The same node beside an eight-GPU job, whose GPU-only MTBF in table 1 is 6,250 hours (260 days), would sit idle far longer than it could ever save. Scale reverses the verdict on the same hardware, and three foundational principles distill how that shift guides design across the rest of this chapter.
Systems Perspective 7.2: Three rules of failure at scale
- At scale, failures are continuous, not exceptional. A 10,000-GPU cluster experiences a failure every 3.9 hours on average. Systems must be designed expecting failure as normal operation.
- Checkpoint intervals have an optimum. The Young-Daly interval (developed in section 7.8.1) sets checkpoint frequency from write time and system MTBF under its stated assumptions, and it shrinks only with the square root of a falling MTBF.
- Training and serving have fundamentally different fault tolerance requirements. A long training job can budget minutes for recovery while preserving accumulated progress; an interactive serving request may have only milliseconds left before its deadline. Those budgets motivate checkpoint recovery for training and ready alternate capacity for serving.
The rest of the chapter puts these rules to work. Training recovery comes first; checkpointing, detection and restart, and elastic resizing apply rules 1 and 2. Serving fault tolerance and graceful degradation then answer rule 3, and distributed debugging and fault injection supply the evidence that each recovery path works. The first mechanism is the saved state that every training recovery falls back on.
Self-Check: Question
The expected cost of a training run is modeled as base compute, plus expected failures times the cost per failure, plus the cost of fault-tolerance mechanisms. Under this model, when does one more unit of fault-tolerance investment lower the total expected cost?
- Whenever it reduces the expected number of failures, regardless of what it costs.
- Whenever the cluster is large enough to fail several times per day.
- While the reduction in expected failure cost it buys exceeds its own marginal cost.
- Whenever total fault-tolerance spending stays below the base compute cost of the run.
A 175B-parameter language model trains on 10,000 GPUs at about $2 per GPU-hour, and a ViT-Large model trains for two days on a much smaller allocation. Both checkpoint once a day. Why can one failure cost the language model run roughly $0.5M of compute but the vision run only tens of thousands of dollars?
- Each GPU in the language model run fails more often, so every failure destroys more work.
- Lost progress is priced by what the allocation costs per hour and how much state must be recovered, so up to a day of rework on a 10,000-GPU allocation costs about $0.5M while a smaller allocation loses far less per day.
- Vision checkpoints are larger than language model checkpoints, which shortens vision recovery.
- Vision runs carry no state beyond their weights, so they can resume from any data position at no cost.
On the 10,000-GPU cluster, about 6.2 failures per day each stall every GPU during recovery, at about $2 per GPU-hour. An idle eight-GPU hot-spare node costs about $384 per day. Estimate how much recovery time the spare must save per failure to pay for itself, and state the condition attached to that estimate.
True or False: A hot-spare node that pays for itself beside a 10,000-GPU training cluster is also a sound investment beside an eight-GPU job, because the node and its daily cost are identical.
7.8 Checkpointing and Progress Preservation
When a top-of-rack switch dies two weeks into the training run of a 175-billion-parameter model, the cluster loses 64 GPUs instantly. The system cannot simply restart from scratch; the sunk cost of weeks of compute is too high. The failure analysis in section 7.1 established that large-scale training systems will experience such failures frequently, requiring robust mechanisms to preserve and resume progress.
Training fault tolerance has three obligations: preserve state, detect and classify failures, and resume or resize the job. Checkpointing supplies the first obligation. The sections that follow then build the rest of the recovery model: detection supplies evidence for a recovery decision, recovery procedures restore a consistent process group, and elastic recovery determines whether the job can continue with a changed worker set. Every one of those paths falls back on the saved copy that checkpointing produces, so the first question is what that copy must contain.
Definition 7.1: Checkpointing
Checkpointing is the periodic serialization of the complete training state (parameters, optimizer state, data loader position, and random state) to persistent storage at a recorded training step.
- Significance: It minimizes lost work after a system failure by trading checkpoint I/O against rework. Writing too often wastes accelerator time on storage traffic; writing too rarely risks replaying many completed steps after a failure. The Young-Daly interval developed in this section chooses the cadence that balances write cost against expected lost work.
- Distinction: A resumable checkpoint captures a consistent execution state, including optimizer state, random-number generator state, data position, and learning rate schedules. It can use full or incremental storage; bitwise replay additionally requires compatible deterministic execution.
- Common pitfall: A frequent misconception is that checkpointing is “just writing to disk.” For large models it is a storage-system stress test, because the simultaneous write from thousands of GPUs can trigger a checkpoint storm (definition 4.5) that saturates the shared network and storage bandwidth \((\Bandwidth)\).
A checkpoint is useful only if it resumes the recorded step consistently. In distributed training, every shard must belong to the same recoverable state; a collection of files from different steps does not preserve progress. For the interval model, assume that writing a checkpoint completes durably before it becomes available for recovery and that a failure discards the work performed since the last completed checkpoint.
Two recovery objectives turn those obligations into a contract. The recovery point objective (RPO) bounds acceptable lost progress, so checkpoint age and replication lag must fit within it. The recovery time objective (RTO) bounds the delay until useful work resumes, which covers detection, resource replacement, restore, and warmup. A 20-minute checkpoint interval cannot promise an RPO below 20 minutes without a more frequent durable log or replica, and asynchronous flushing can leave the last durable generation older still. A five-minute RTO is impossible if checkpoint reload alone takes eight minutes. These objectives apply to a stated fault model. Corruption discovered after several saves can require rollback beyond the newest durable checkpoint. The Young-Daly interval derived next minimizes expected waste; RPO and RTO impose service constraints that the expected-value optimum must still satisfy (Beyer et al. 2016).
7.8.1 The Young-Daly checkpoint interval
When failures are expected during a job, the key engineering decision is how often to write that state, because every save costs I/O time and every unsaved step is work a failure can erase. The Young-Daly formula12 (principle 13) gives a first-order estimate of that balance through a square-root rule:
12 Young-Daly formula: Young (1974) derived the first-order optimal checkpoint interval, and Daly (2006) independently refined it with tighter second-order bounds.
Young, John W. 1974. “A First Order Approximation to the Optimum Checkpoint Interval.” Communications of the ACM 17 (9): 530–31. https://doi.org/10.1145/361147.361115.
Daly, J. T. 2006. “A Higher Order Estimate of the Optimum Checkpoint Interval for Restart Dumps.” Future Generation Computer Systems 22 (3): 303–12. https://doi.org/10.1016/j.future.2004.11.016.
\[ \OptimalCheckpointInterval = \sqrt{2 \cdot \CheckpointWriteTime \cdot \SystemMtbf} \tag{7}\]
\(\CheckpointWriteTime\) in distributed ML training is not the time to flush a small process state; it includes transferring model weights and optimizer state to durable storage. The reference format here stores BF16 weights, separate FP32 master weights, and two FP32 moment tensors per parameter for Adam. A single resumable checkpoint for a 70B-parameter model therefore approaches a terabyte at 14 bytes per parameter; for the later 175B-parameter running example, it exceeds two terabytes. Of those 14 bytes per parameter, the optimizer state13 dominates the payload, exactly as in the storage sizing of the same resumable checkpoint in Checkpoint Storage, so the optimizer state rather than the model weights sets most of \(\CheckpointWriteTime\). Reducing \(\CheckpointWriteTime\) therefore requires a smaller payload or higher sustained write bandwidth, and \(\CheckpointWriteTime\) itself is the central constraint that determines how tightly the checkpoint interval can be set before I/O overhead displaces productive training compute.
13 Adam optimizer state: Adam’s per-parameter first-moment (\(\AdamFirstMoment\)) and second-moment (\(\AdamSecondMoment\)) estimates are two FP32 values, 8 of the 14 bytes per parameter in the resumable checkpoint; with the FP32 master weights, optimizer-side state accounts for all but the 2 bytes of BF16 weights. For a 175B parameter model, the two moments alone reach 1.4 TB, which typically dominates checkpoint size and recovery time, making optimizer state the primary bottleneck in checkpoint I/O design.

Optimizer state, not weights, dominates checkpoint size.
To see the balance, consider an interval between saves. Doubling that interval approximately halves the checkpoint writes per unit of training, but a failure then loses twice as much work on average. Under the constant-rate, rare-failure approximation, failure occurs approximately uniformly within an interval, so the average lost work is half the interval. When write time is small relative to the interval, the wasted fraction from saving and replaying work is approximately the sum below. Detection, allocation, and restoration time require a separate recovery budget.
\[ \CheckpointWasteFraction(\CheckpointInterval) \approx \frac{\CheckpointWriteTime}{\CheckpointInterval} + \frac{\CheckpointInterval}{2 \cdot \SystemMtbf} \tag{8}\]
Setting the first derivative to zero (\(\frac{d\CheckpointWasteFraction}{d\CheckpointInterval} = -\frac{\CheckpointWriteTime}{\CheckpointInterval^2} + \frac{1}{2 \cdot \SystemMtbf} = 0\)) directly yields the square-root minimum of equation 7. As clusters grow, system MTBF drops, so the optimal interval shrinks, demanding higher-bandwidth storage to keep \(\CheckpointWriteTime\) small before checkpoint overhead consumes the cluster’s compute capacity. Because the relationship is a square root, halving MTBF tightens the interval by only \(\sqrt{2}\approx 1.4\times\), so doubling cluster size does not demand doubling checkpoint I/O bandwidth when checkpoint size and the other assumptions stay fixed. Substituting the optimum back into equation 8 gives a minimum waste of \(\sqrt{2\CheckpointWriteTime/\SystemMtbf}\). Because \(\SystemMtbf\) falls as \(1/\DeviceCount\) under independent failures, that optimized overhead grows as \(\sqrt{\DeviceCount}\), and doubling the cluster raises it by a factor of \(\sqrt{2}\) even though the interval itself adapts.
↩︎ The per-tier storage bandwidths that bound how quickly a checkpoint can be written are established in The ML Storage Hierarchy.
7.8.2 Checkpoint interval from failure analysis
The Young-Daly interval of equation 7 needs two inputs, the system MTBF and the write time \(\CheckpointWriteTime\), and the chapter’s 10,000-GPU cluster supplies both as computed values. The worked cascade (section 7.2.2) put full-system MTBF, including PCIe and network failures (the redundant power supplies add no term), at 3.87 hours. For the write time, the 175B running example’s 2.45 TB resumable checkpoint drains to shared storage at the sustained aggregate write bandwidth this chapter assumes for the cluster, 100 GB/s, which takes 24.5 s. Substituting these into the Young-Daly formula gives a candidate interval for this cluster, which must still satisfy its RPO and RTO.
Napkin Math 7.2: The Young-Daly optimal interval
Problem: A 10,000-GPU cluster has an MTBF of 3.87 hours. A full model checkpoint takes 24.5 s to write. What is the optimal checkpoint frequency?
Math: Apply the Young-Daly interval of equation 7 (principle 13).
- Convert to common units: \(\SystemMtbf =\) 3.87 hours \(\times\) 3600 s/hour = 13932 s.
- Substitute and solve: With \(\CheckpointWriteTime =\) 24.5 s and \(\SystemMtbf =\) 13932 s, the formula gives \(\OptimalCheckpointInterval \approx\) 826.2 s, or about 13.8 min.
Systems insight: At this interval, the checkpoint overhead (time spent saving plus time spent recomputing) is minimized to approximately 5.9 percent. Checkpointing every hour instead would lengthen the expected rework after each failure, wasting about 13.6 percent of the cluster’s capacity.
The result connects measured or estimated interruption rates to checkpoint policy. At this interval, saving and expected replay together consume approximately 5.9 percent of training time in the first-order model, half from writes and half from replay, because at the square-root optimum the two terms of equation 8 are equal. Plotting those two terms for this cluster shows how forgiving the optimum is (figure 11). Write overhead falls hyperbolically and expected rework climbs linearly, so their sum has a shallow floor around 14 min. An interval somewhat off the optimum costs little, while one several times too short or too long costs far more, which is why a rough MTBF estimate still yields a usable schedule; how far the estimate itself can be trusted depends on the simplifying assumptions behind it.
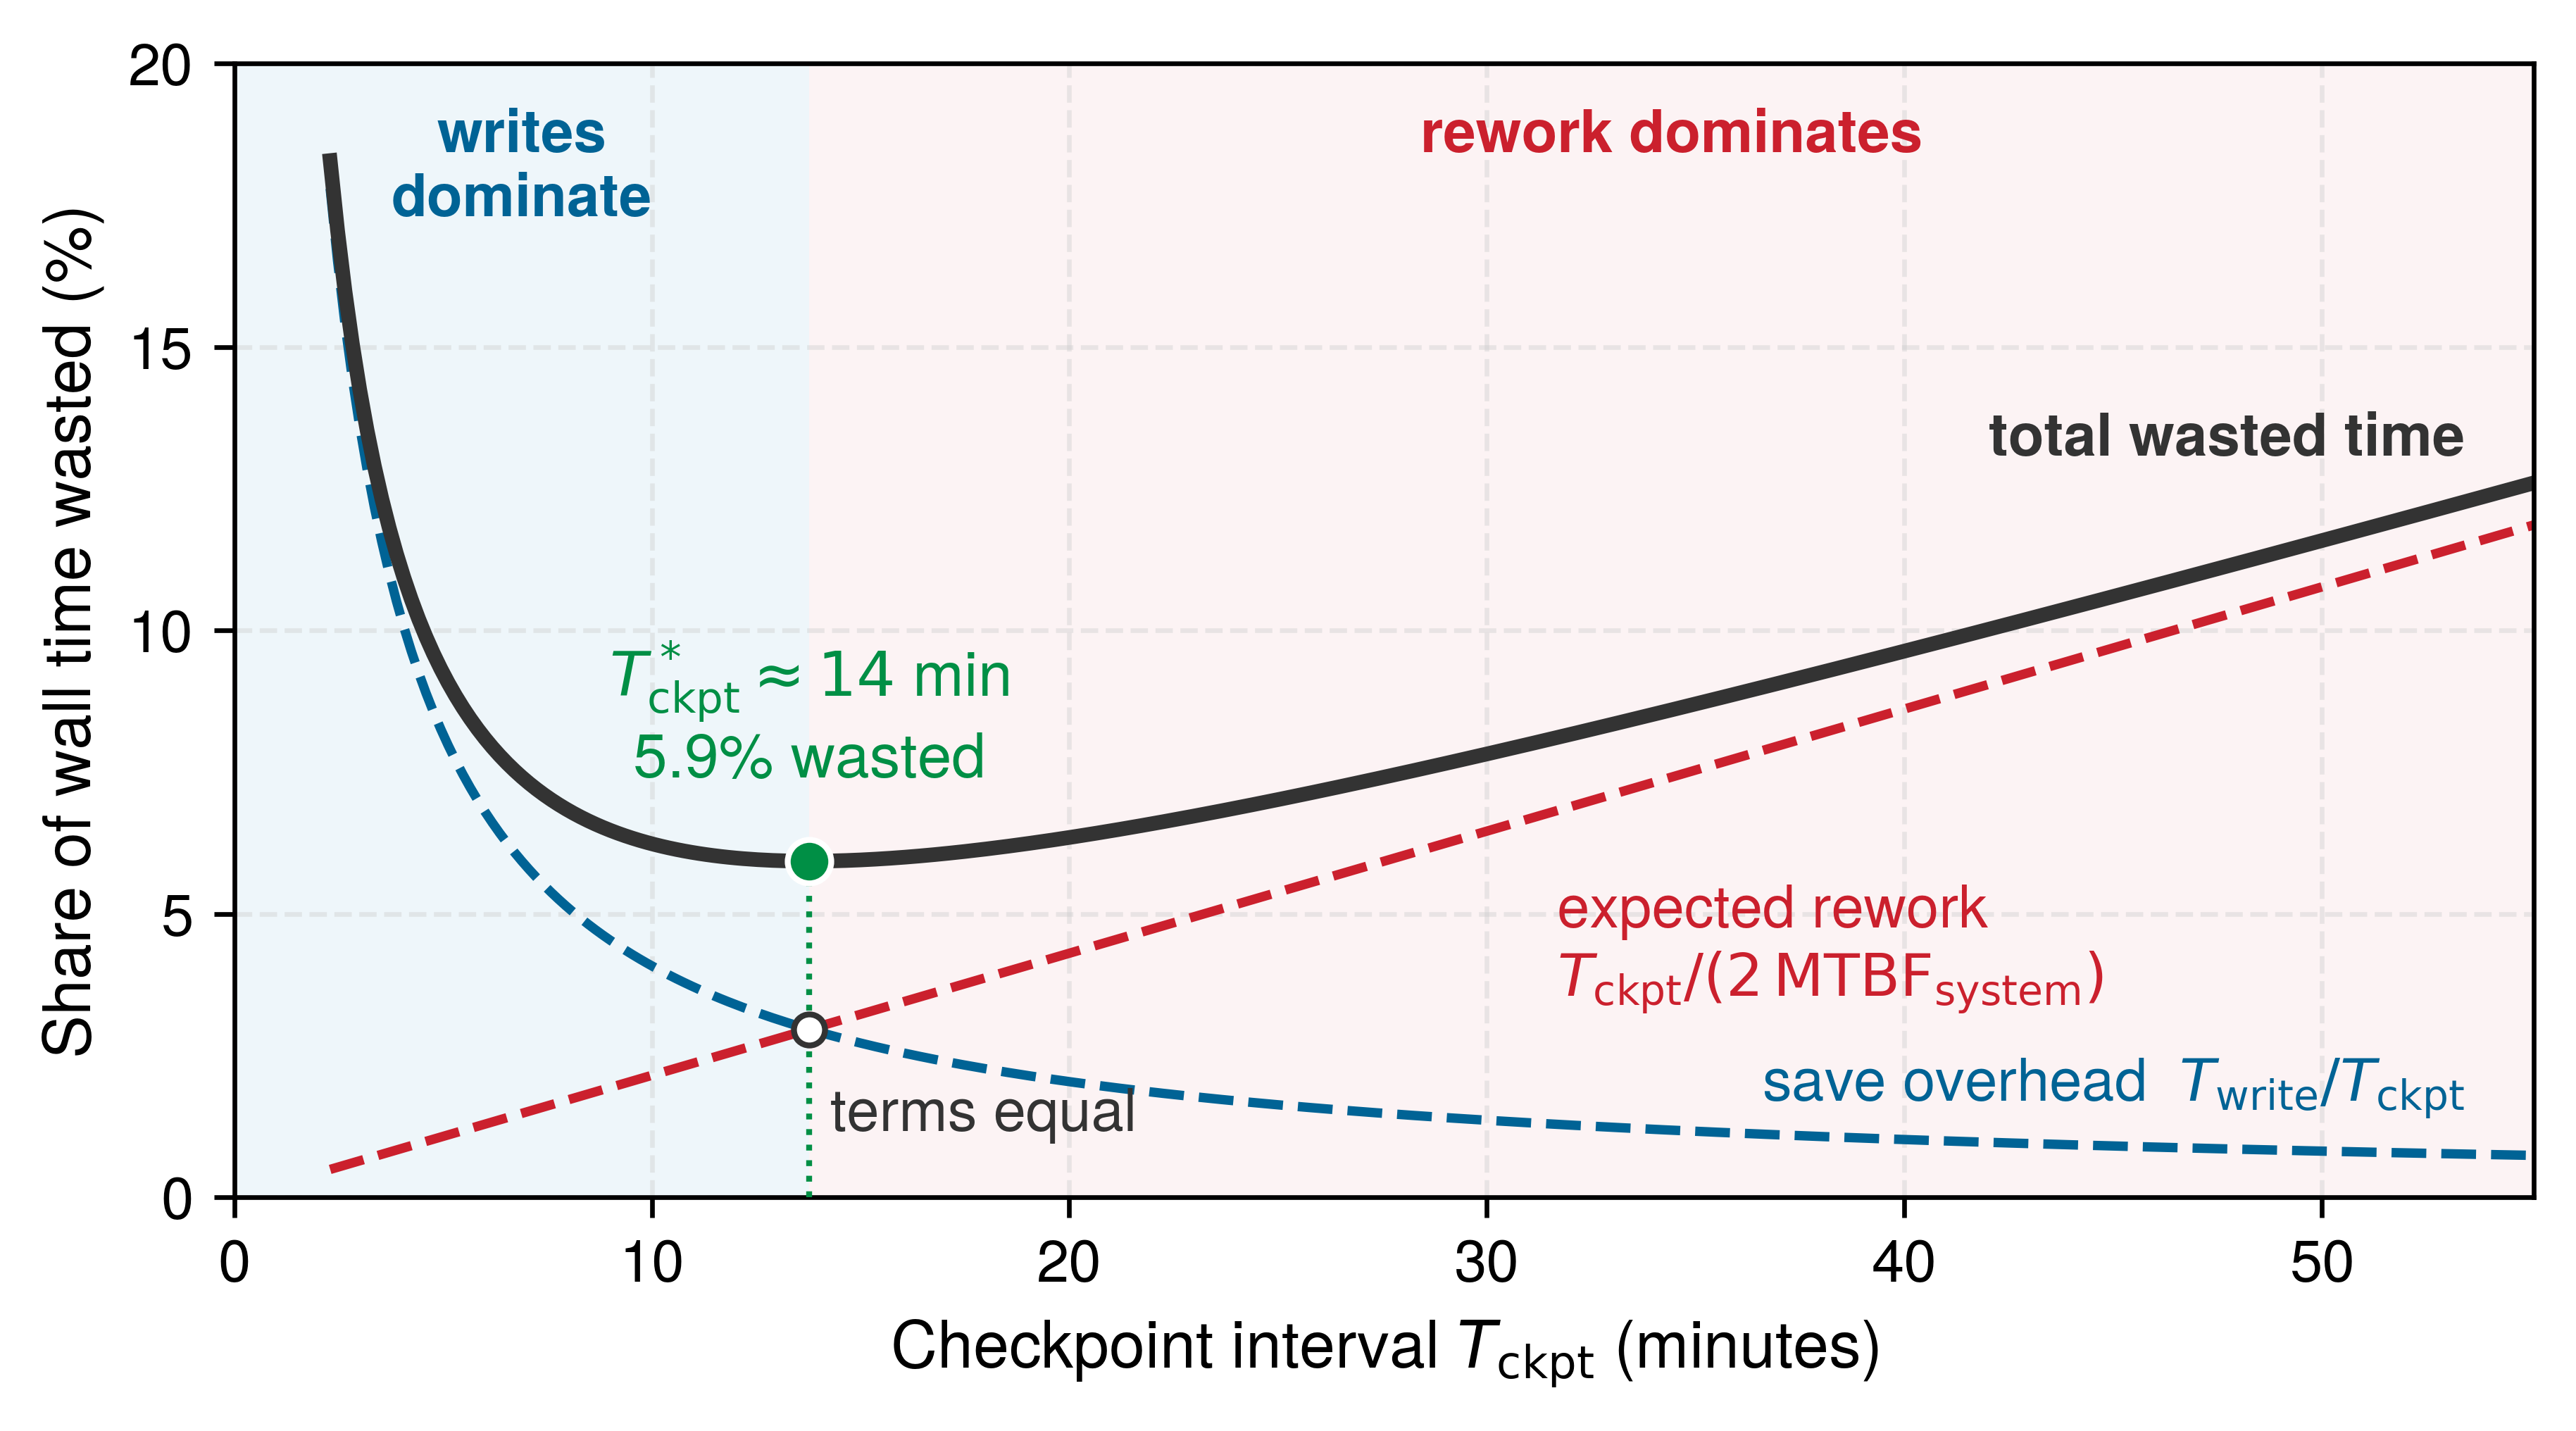
Systems Perspective 7.3: Young-Daly formula assumptions
The first-order Young-Daly formula provides valuable intuition but rests on assumptions that may not hold when write times are non-negligible relative to MTBF; the renewal model derived in Checkpoint Intervals Beyond the First-Order Approximation shows how finite checkpoint time changes the optimum. The assumptions are:
- Exponentially distributed failures: Assumes a constant failure rate. Real hardware follows the bathtub curve, with higher rates during burn-in and wear-out phases.
- Deterministic checkpoint time: Assumes \(\CheckpointWriteTime\) is constant. In practice, checkpoint time varies from save to save with storage contention, network congestion, and memory pressure.
- Recovery cost is independent of the chosen interval: A fixed per-failure recovery cost does not change the first-order minimizing interval. Recovery can take longer than checkpoint writing because it also includes job scheduling delays, topology reconstruction, and warmup; it still belongs in the total-waste budget.
- Aggregate interruption process: Independent constant-rate failure sources can contribute to one job-interruption rate. Shared power, cooling, or switch failures require a model of incident frequency and recovery cost; adding per-device rates alone misses those common causes.
- Infinite timeline: Optimizes for long training runs. Short runs, where total time is comparable to MTBF, require different analysis.
When assumptions are violated, the optimal interval may shift significantly, but restart overhead should not be treated as if it were paid at every checkpoint. In the first-order lost-time model, restart time adds a per-failure recovery term to total expected waste; it does not replace \(\CheckpointWriteTime\) inside equation 7 unless a recovery-aware Daly-style model is explicitly derived and calibrated.
Along an execution timeline, a training run alternates productive compute intervals (\(\CheckpointInterval\)) with synchronous save barriers (\(\CheckpointWriteTime\)), and a failure charges two distinct penalties (figure 12). Uncheckpointed progress is discarded as lost rework, and the restart latency (\(\FailureRecoveryTime\)) of job scheduling, checkpoint loading, and pipeline warmup follows before useful work resumes. Recovery latency therefore matters as much as write duration: because restart adds scheduling and warmup to reading the saved state back, total restart time can exceed the checkpoint write time, so it belongs in the total-waste and service-level objective (SLO) budgets as a per-failure term (perspective 7.3) rather than inside the per-checkpoint write term.
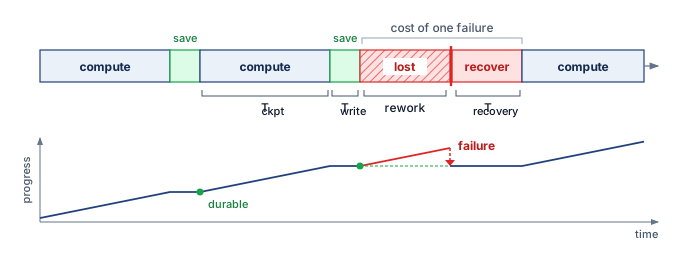
7.8.3 Checkpoint overhead analysis
The interval calculation chooses when the system preserves state; the write path decides what each save costs while training waits. Equation 9 generalizes the save-side term of equation 8 to include any pause beyond the write itself:
\[ \CheckpointOverheadFraction= \frac{\CheckpointWriteTime}{\CheckpointInterval} + \frac{\CheckpointExtraPauseTime}{\CheckpointInterval} \tag{9}\]
Here, \(\CheckpointOverheadFraction\) is the dimensionless fraction of time lost to checkpointing, \(\CheckpointWriteTime\) is checkpoint write time, \(\CheckpointInterval\) is the checkpoint interval, and \(\CheckpointExtraPauseTime\) is any training pause beyond the checkpoint write itself. This includes memory allocation, coordination, and serialization. Total first-order waste is then \(\CheckpointWasteFraction(\CheckpointInterval) \approx \CheckpointOverheadFraction+ \CheckpointInterval/(2 \cdot \SystemMtbf)\), so checkpoint overhead in this section means the save side alone, with expected rework counted separately. How large \(\CheckpointOverheadFraction\) becomes depends first on whether training waits for durable storage.
Synchronous vs. asynchronous checkpointing
Synchronous checkpointing resumes training only after every worker’s portion is written, while asynchronous checkpointing captures a snapshot in host memory or local staging and flushes it in the background; the write path behind both is developed in Synchronous and asynchronous checkpoint writes. For recovery, blocking alone does not establish consistency, so the protocol must ensure that every shard belongs to the same recoverable training state. Recovery can use an asynchronous generation only after all required shards reach the storage tier that survives the modeled failure and the coordinator publishes completion.
A synchronous save pauses every accelerator in the job for the full write, and Checkpoint Storage prices that exposed pause on a slow shared tier; asynchronous capture removes it from the critical path, which is why production systems stage checkpoints rather than block on the shared tier. Write time also varies widely across model types, because larger models require longer writes but also earn longer optimal intervals (table 6).
The Archetype A row in table 6 uses the same 14-byte-per-parameter resumable checkpoint (2.45 TB) as the rest of the chapter. Its interval calculation uses the GPU-only cluster MTBF rather than the shorter full-system MTBF of the worked cascade, so the square-root rule gives a longer interval than the Young-Daly notebook. The table keeps the GPU-only basis because its purpose is comparison across model types. Switching every row to the full-system MTBF would shorten each interval, and raise each overhead, by the same square-root factor, leaving the ranking across rows unchanged. The ResNet-50 and BERT-Large rows count only FP32 weights, so their write times and resulting intervals are lower bounds for a resumable checkpoint. Their intervals of seconds describe the balance for that smaller payload; selecting a recovery cadence requires including optimizer, schedule, and input-stream state. Small-state jobs rarely run on a cluster this large, and their actual storage bandwidth and complete recovery state determine whether saves every few minutes or every epoch have negligible overhead. The large-state rows show why interval selection becomes consequential when each save moves hundreds of gigabytes or terabytes.
| Model type | Checkpoint size | Write time (100 GB/s) | Optimal interval (5 h GPU-only MTBF) | Save overhead |
|---|---|---|---|---|
| Archetype A (GPT-4/Llama-3) | 2.45 TB | 24.5 s | 15.7 min | 2.6% |
| 20B dense transformer class | 240 GB | 2.4 s | 4.9 min | 0.8% |
| BERT-Large | 1.4 GB | 0.014 s | 22 s | 0.06% |
| Embedding-heavy recommender | 4 TB | 40 s | 20 min | 3.3% |
| ResNet-50 | 102.4 MB | 0.001 s | 6 s | 0.02% |
| Vision transformer class | 1.2 GB | 0.012 s | 21 s | 0.06% |
These per-model overheads assume the write path is uncontended. When thousands of workers save at the same step, their combined burst becomes the checkpoint storm that Checkpoint Storage defines and sizes; for recovery, the burst matters because a stalled write delays the generation that a failure would fall back on. Staging hides the write from training, yet a snapshot held only on local staging does not survive loss of its node, so where each copy lives decides which failures the saved state outlasts and how quickly it returns.
7.8.4 Checkpoint storage and recovery
Writing a checkpoint to node-local NVMe makes the save fast, but if the node itself fails, that local snapshot vanishes along with the hardware it was meant to recover. Writing only to a durable remote filesystem or object store survives the node failure, but pulling multi-terabyte state back across shared storage links slows every recovery. Recovery mechanisms therefore pair tiers from the storage hierarchy—local NVMe for fast staging and survivor reads, distributed filesystems for durability across node failures, and object storage for long-term retention—so that the saved state both outlasts the fault and reloads within the recovery budget.
↩︎ Tiered checkpoint storage designs and asynchronous write pipelines are established in Checkpoint Storage.
For fault tolerance, checkpoint placement determines which failures the saved state survives, while the restore path determines how quickly that surviving state becomes useful. On the 128-node Archetype A reference cluster, each node holds about 19.1 GB of the 2.45 TB checkpoint for the 175B running example. Reading that share from local NVMe at 5 GB/s takes about 3.8 s, with every node reading in parallel, while pulling the full checkpoint back through shared storage at 100 GB/s aggregate takes about 24.5 s. The local path is faster because it multiplies drive bandwidth by node count, but a sole copy on a lost node cannot restore that node’s shard. The replacement node must read its share from a copy outside the failed domain, such as a distributed filesystem or object store, whose recovery time is set by sustained aggregate reads, network capacity, and deserialization. A sound placement therefore keeps a fast local copy for the survivors and a durable remote copy for whatever the failure took away, and these rates must still be measured under the job’s own load.
7.8.5 Checkpoint coordination patterns
If workers in a sharded training job save their local shards at different steps without coordinating, rolling one failed worker back to its last save invalidates every peer that already consumed gradients or activations from its later steps, cascading rollbacks backward through the run in the classic domino effect (Elnozahy et al. 2002). Avoiding that cascade requires choosing how workers coordinate across two orthogonal dimensions: whether they synchronize to capture a consistent cut (coordinated versus uncoordinated checkpointing), and whether they funnel state through one writer or persist shards in parallel (centralized versus distributed checkpointing). Because distributed ML workers exchange state at every step, production training relies on coordinated checkpointing, in which workers synchronize at step boundaries or through an explicit two-phase commit protocol so that all saved shards belong to a single globally consistent recovery line. Once coordination guarantees consistency, the remaining architectural decision is how those shards reach persistent storage: whether workers funnel their state through a single coordinator or write their partitions directly in parallel.
Elnozahy, Elmootazbellah N., Lorenzo Alvisi, Yi-Min Wang, and David B. Johnson. 2002. “A Survey of Rollback-Recovery Protocols in Message-Passing Systems.” ACM Computing Surveys 34 (3): 375–408. https://doi.org/10.1145/568522.568525.
Centralized checkpointing
In centralized checkpointing, workers send their state to a coordinator process that assembles and writes the complete checkpoint. This approach simplifies checkpoint management and can produce self-contained checkpoint files, but all state crosses the coordinator’s network links, and coordinator failure interrupts the save. A streaming writer can avoid buffering the entire checkpoint, although it cannot remove the ingress bottleneck. That bottleneck is structural. The coordinator receives through one node’s network links, so its write time grows with total state volume, whereas independent writers each move only their own share of the state through their own links. The gap between the two patterns therefore widens in proportion to the number of writers. For the 175B running example, the 128 nodes of the reference cluster would funnel 2.45 TB through one node’s links instead of 19.1 GB through each. The pattern is viable while that one path meets the checkpoint budget; state volume and sustained bandwidth determine the limit more directly than a fixed worker count. Centralized checkpointing is therefore attractive when operational simplicity matters more than aggregate bandwidth, whereas distributed and sharded approaches become necessary once the checkpoint itself is a fleet-scale object.
Distributed checkpointing
Distributed checkpointing eliminates this coordinator funnel by having each worker persist its own shard directly. Figure 13 contrasts the dataflow topologies: the centralized pattern concentrates traffic at the coordinator’s ingress, while the distributed pattern writes in parallel to local NVMe and drains the shards to remote object storage in the background. With fixed per-worker shard sizes and sufficient independent staging bandwidth, adding workers need not lengthen the local write pause. Shared drain capacity and completion coordination can still limit scaling. A coordinator signals when to checkpoint and confirms completion, but state flows directly from workers to storage without aggregation.
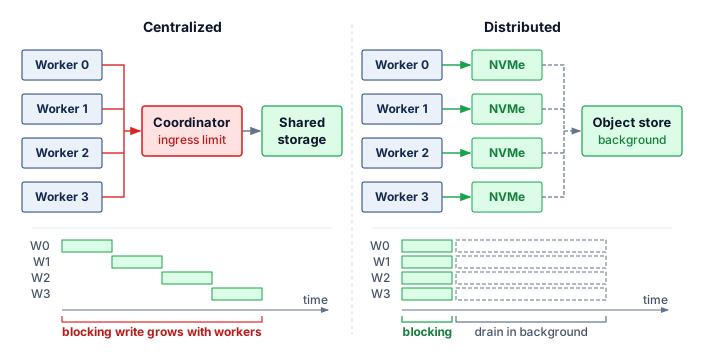
A synchronous version of the coordination protocol proceeds in six steps:
- Coordinator broadcasts checkpoint request with checkpoint ID
- Each worker reaches a consistent state (barrier synchronization)
- Each worker writes an immutable shard to a generation-specific staging prefix and records its byte length and cryptographic digest
- Each worker confirms durable write completion to the coordinator
- The coordinator writes an immutable manifest after all confirmations; the manifest names the training step, topology, model and optimizer formats, data-loader position, random state, and the length and digest of every shard, then publishes a commit marker or atomic pointer to that manifest
- Coordinator broadcasts checkpoint complete, training resumes
The idealized protocol assumes step 2 completes quickly. The barrier, however, waits for the slowest of thousands of arrivals, so a single slow worker can make it dominate the checkpoint pause even when the storage path has ample bandwidth. Measuring arrival skew separately from copying and writing reveals whether coordination or data movement limits the save.
The manifest, not the presence of a directory or a plausible set of shard names, defines a committed checkpoint generation. Restore accepts only a published manifest whose shards all match their recorded lengths and digests; staged shards without that final publication remain unreachable and can be garbage collected. This rule prevents a partially overwritten latest directory from masquerading as recoverable state and makes generation rollback explicit. PyTorch Distributed Checkpoint follows this ordering, with storage writers persisting each rank’s data before the coordinator’s finish() operation writes the metadata and marks the checkpoint successful, while the storage backend supplies the publication semantics (PyTorch Contributors 2026a). The set of per-worker states a manifest names is a cut, and the cut is consistent when all of those states could have existed together at one moment of a valid execution, so that no shard reflects an update another shard has not yet seen. That consistency cut determines whether the system can claim strict, bounded-asynchronous, or eventual consistency.
PyTorch Contributors. 2026a. Distributed Checkpoint: Torch.distributed.checkpoint.
Systems Perspective 7.4: Checkpoint consistency models
Strict synchronous: All workers checkpoint at exactly the same training step. Provides strongest consistency but highest overhead from barrier synchronization.
Bounded asynchronous: Workers may progress at different rates while the checkpoint manager tracks which snapshots can form a consistent recovery cut. Bounding step skew alone is insufficient, because the system must retain compatible shard versions or enough replay information to reconstruct that cut. Asynchronous flushing can also preserve a single synchronized snapshot while its writes complete in the background, avoiding training stalls without relaxing recovery consistency.
Eventual consistency: Workers save independently and recovery attempts to reconcile their versions. A usable design must retain enough compatible versions or replay information to reconstruct a valid state; arbitrary recent shards do not necessarily form a recoverable generation. Reduced coordination at save time therefore transfers work and storage requirements to recovery.
Steps 3 through 5 are two-phase commit,14 the classic distributed-systems protocol for making one decision atomic across many participants (Gray 1978), applied to a checkpoint. Steps 3 and 4 form its prepare phase, in which each worker stages its shard and reports success, and step 5 is its commit phase, in which the coordinator durably records the decision by publishing the manifest. The manifest publication rule inherits the protocol’s guarantee and its known weakness. If the coordinator crashes after workers prepare but before it records a decision, the system must not expose those shards as a valid checkpoint, and the prepared participants remain blocked until the original or a replacement coordinator recovers the durable decision. Uncommitted staged shards can be garbage collected only after recovery establishes that no commit decision exists. Atomic publication also does not by itself make the published shards consistent: synchronous gradient updates naturally create step boundaries where all workers have applied the same updates, whereas asynchronous training and pipeline parallelism require explicit coordination to define a consistent cut.
14 Two-phase commit (2PC): Formalized by Gray (1978), 2PC ensures all participants either commit or abort atomically. A timeout can trigger coordinator recovery, but it cannot by itself authorize unilateral rollback.
Gray, J. N. 1978. “Notes on Data Base Operating Systems.” In Operating Systems: An Advanced Course. Springer Berlin Heidelberg. https://doi.org/10.1007/3-540-08755-9_9.
Sharded checkpointing
Modern distributed training frameworks partition model state across workers using techniques like ZeRO and FSDP, which shard parameters, gradients, and optimizer state instead of replicating them on every data-parallel worker. In these configurations, no single worker holds complete model state. Each worker holds only its assigned parameter shard plus corresponding optimizer state.
↩︎ How ZeRO and FSDP partition training state across data-parallel workers is established in Memory-efficient data parallelism with ZeRO and FSDP.
15 Sharded checkpointing: Each worker saves only its local partition rather than gathering state to a single writer, parallelizing I/O across all nodes. The trade-off is that recovery requires every shard to be available and consistent, making the checkpoint protocol more complex. Losing one storage device invalidates the generation only if a required shard cannot be recovered from another copy or sufficient storage redundancy.
Rajbhandari, Samyam, Jeff Rasley, Olatunji Ruwase, and Yuxiong He. 2020. “ZeRO: Memory Optimizations Toward Training Trillion Parameter Models.” SC20: International Conference for High Performance Computing, Networking, Storage and Analysis, 1–16. https://doi.org/10.1109/sc41405.2020.00024.
Sharded checkpointing15 (Rajbhandari et al. 2020) uses this distribution. Each worker writes only its shard, which divides the per-worker write volume by the number of shards. Recovery loads shards and redistributes state to workers based on the recovery configuration.
This approach enables efficient checkpointing even for massive models. A 175B parameter model with a 2.45 TB checkpoint distributed across 1,024 workers requires each worker to write only 2.4 GB, achievable in seconds with local NVMe storage. When elastic scaling or hardware replacement changes the worker count between save and restore, shard redistribution must remap the saved partitions to the new worker configuration, which is why frameworks need flexible resharding support to recover across topology changes. Yet possessing a valid checkpoint is only half the recovery path: sharding distributes the write work and staging controls the shared I/O burst, but the system must still detect the failure, trigger restoration, and coordinate the distributed shards before training can resume, so the speed of detection and recovery ultimately governs the cost of the interruption.
Checkpoint 7.4: Reasoning about checkpoint overhead
Verify your understanding of how failure rate and checkpoint cost set the optimal checkpoint interval:
Self-Check: Question
A team checkpoints every 30 minutes with asynchronous flushing. It promises a recovery point objective (RPO) of 15 minutes and a recovery time objective (RTO) of 10 minutes, and reloading the checkpoint alone takes 12 minutes. Which assessment is correct?
- Both promises hold, because the Young-Daly interval already minimizes expected waste.
- The RPO holds because asynchronous flushing removes the write from the critical path, but the RTO fails.
- The RTO holds because detection and warmup overlap with checkpoint reload, but the RPO fails.
- Both promises fail, because a 30-minute interval cannot bound lost progress below 30 minutes without a more frequent durable log or replica, and a 12-minute reload alone exceeds the 10-minute RTO before detection, replacement, and warmup are counted.
A training cluster quadruples in size from 1,000 GPUs to 4,000 GPUs, reducing its system MTBF by a factor of 4. Assuming checkpoint write time \(T_{\text{write}}\) remains constant, calculate by what factor the Young-Daly optimal checkpoint interval \(\tau_{\text{opt}}\) changes.
How does sharded checkpointing (such as in ZeRO-3 or PyTorch FSDP) differ from centralized checkpointing in terms of I/O parallelism and recovery requirements?
- Sharded checkpointing requires every worker to broadcast its state to all peers before writing, doubling network communication overhead.
- Sharded checkpointing writes a single monolithic file from Rank 0, minimizing storage metadata operations.
- Each worker writes only its locally partitioned parameter and optimizer shard directly to storage in parallel, aggregating storage fabric bandwidth but requiring all shards to be present and consistent during recovery.
- Sharded checkpointing stores only model weights, discarding optimizer state to achieve sub-second write times.
Explain the memory composition breakdown of checkpoint files for large language models trained with mixed-precision AdamW, detailing why optimizer states dominate storage requirements.
Sequence the 6 steps of a standard distributed sharded checkpoint coordination protocol in chronological order:
- Coordinator confirms all writes and commits checkpoint metadata
- Each worker writes its local state shard directly to persistent storage
- Coordinator broadcasts checkpoint completion signal, allowing next barrier clearance
- Coordinator broadcasts checkpoint initiation request with a unique checkpoint ID
- Each worker reaches a consistent execution state via barrier synchronization
- Each worker reports shard write completion back to the coordinator
What is the primary advantage of adopting a bounded asynchronous checkpoint consistency model over a strict synchronous checkpoint model in a 10,000-GPU cluster?
- It can reduce barrier waiting by letting workers progress within a bounded step window while retaining compatible shard versions or replay information to construct a consistent recovery cut.
- It guarantees that all workers write their state at the exact same nanosecond without requiring any communication with a coordinator.
- It eliminates the need for persistent storage by maintaining checkpoints entirely in L2 cache memory.
- It ensures that lost computation after a hardware crash is always zero steps.
7.9 Failure Detection and Recovery
A GPU silently hangs, dropping its utilization to zero while its peer GPUs wait indefinitely at an AllReduce barrier. On the chapter’s 10,000-GPU cluster, every minute the system takes to notice this hung rank and reboot the node costs about $330 in idle compute. Checkpoints preserve state, but the recovery process itself determines how much compute a failure wastes. In the accounting of the Fleet Law (equation 1.3), that waiting belongs to the synchronization term \(\SynchronizationTime(\DeviceCount)\). Every surviving rank idles at the barrier until the group is whole again, so detection, restart, and reload add directly to step time averaged over the run, and the goodput accounting of Accounting boundaries charges the same time to runtime goodput.
Equation 10 decomposes recovery time into four primary components:
\[ \FailureRecoveryTime= \FailureDetectionTime+ \JobRestartTime+ \CheckpointLoadTime+ \RecoveryWarmupTime \tag{10}\]
where \(\FailureDetectionTime\) is the time between the physical hardware fault and system classification as a failure, \(\JobRestartTime\) is the latency required for the job scheduler to allocate resources and launch replacement processes, \(\CheckpointLoadTime\) is the I/O duration to read checkpoint state from distributed storage into GPU memory, and \(\RecoveryWarmupTime\) is the interval needed to refill data pipelines, compile just-in-time (JIT) kernels, and stabilize training throughput. Each component presents distinct optimization opportunities, and the dominant term varies by cluster configuration. Understanding this decomposition enables targeted investment in the bottleneck rather than uniform improvement across all components.
7.9.1 Failure detection mechanisms
Detection latency climbs from seconds (crash) to hours (silent corruption).
To the rest of the cluster, a dead rank and a rank busy flushing a multi-gigabyte checkpoint shard both look silent. Every failure detector must therefore balance two expensive mistakes: setting timeouts too short kills healthy workers during transient network or storage stalls, while setting them too long leaves thousands of peer GPUs idling at a collective barrier. Heartbeat monitoring is the first detection layer and usually sets the floor on \(\FailureDetectionTime\). Each GPU rank periodically signals liveness to a coordinator, and if no heartbeat arrives within the timeout period \(\HandoverTimeout\), the coordinator declares the worker failed.
For a heartbeat interval of \(\HeartbeatInterval\) seconds and network-delay standard deviation \(\NetworkDelayStandardDeviation\) in seconds, equation 11 defines the timeout heuristic:
\[ \HandoverTimeout = \HeartbeatInterval+ \TimeoutSafetyMultiplier\NetworkDelayStandardDeviation \tag{11}\]
Here, \(\TimeoutSafetyMultiplier\) is a dimensionless safety multiplier; values from three to five illustrate a tuning range rather than a guaranteed false positive rate. The heuristic treats the normal heartbeat delivery delay as small relative to the heartbeat interval. A deployment with substantial baseline delay or a heavy delay tail must account for those measurements as well as \(\NetworkDelayStandardDeviation\). Tuning \(\HandoverTimeout\) too tightly causes legitimate checkpoint writes or long collectives to trigger false failure declarations; tuning it too loosely extends the window during which other ranks wait for the missing contribution.
Collective communication timeouts provide a second detection layer. During synchronous training, a collective required by the next step remains an incomplete critical-path dependency if a required rank disappears. AllReduce needs every rank’s contribution before it can produce the reduced result; the progress and failure behavior of other collectives depends on the operation and runtime. Transport and process-group timeouts bound how long the job waits before declaring the operation failed and entering recovery. NCCL16 provides configurable transport and reliability, availability, and serviceability (RAS) timeout parameters for this purpose, while higher-level frameworks may impose process-group operation timeouts. These settings are often set conservatively to avoid crashing jobs during legitimate periods of slow communication, which unfortunately extends \(\FailureDetectionTime\).
16 NCCL timeout: NVIDIA’s collective communication library exposes transport and RAS timeout controls such as NCCL_IB_TIMEOUT and NCCL_RAS_TIMEOUT_FACTOR (NVIDIA 2026). Higher-level launch and distributed-training frameworks can add their own restart and operation-timeout behavior (PyTorch Contributors 2026c). Aggressive timeout settings accelerate failure detection but risk false positives during legitimate long collective operations on large models, forcing a trade-off between detection latency and training stability that has no universal optimum.
NVIDIA. 2026. NCCL User Guide.
PyTorch Contributors. 2026c. Torchrun (Elastic Launch). PyTorch documentation.
Container orchestration health checks provide a third layer. Kubernetes, the container orchestration system, offers liveness probes (verifying that a process still responds and makes progress) and readiness probes (verifying that a process is ready to handle requests). Slurm, the batch scheduler common on HPC-style training clusters, instead runs a periodic node health-check program that can drain a node whose GPUs, links, or file systems fail their tests. Both operate independently of the training framework, catching failures that application-level heartbeats might miss; a liveness probe that tests forward progress rather than mere process existence can catch a process that is alive but deadlocked.
Loss spike detection exposes an anomaly, not its cause. Figure 14 contrasts an idealized healthy loss trend with gradient explosion, a premature plateau, and NaN divergence. Real stochastic training need not decrease monotonically, so a transient rise alone does not establish failure, and nonfinite values need not crash the process. Silent hardware corruption can produce an abrupt loss or gradient-norm spike, but so can a bad batch, an optimizer instability, a data-ordering defect, or a distributed-state mismatch. Robust systems therefore pause before the suspect update commits, preserve the input and worker evidence, and replay the step on known-good hardware. The system drains hardware only after that evidence implicates the device; otherwise, it repairs the data, optimizer, or synchronization path that produced the same symptom.
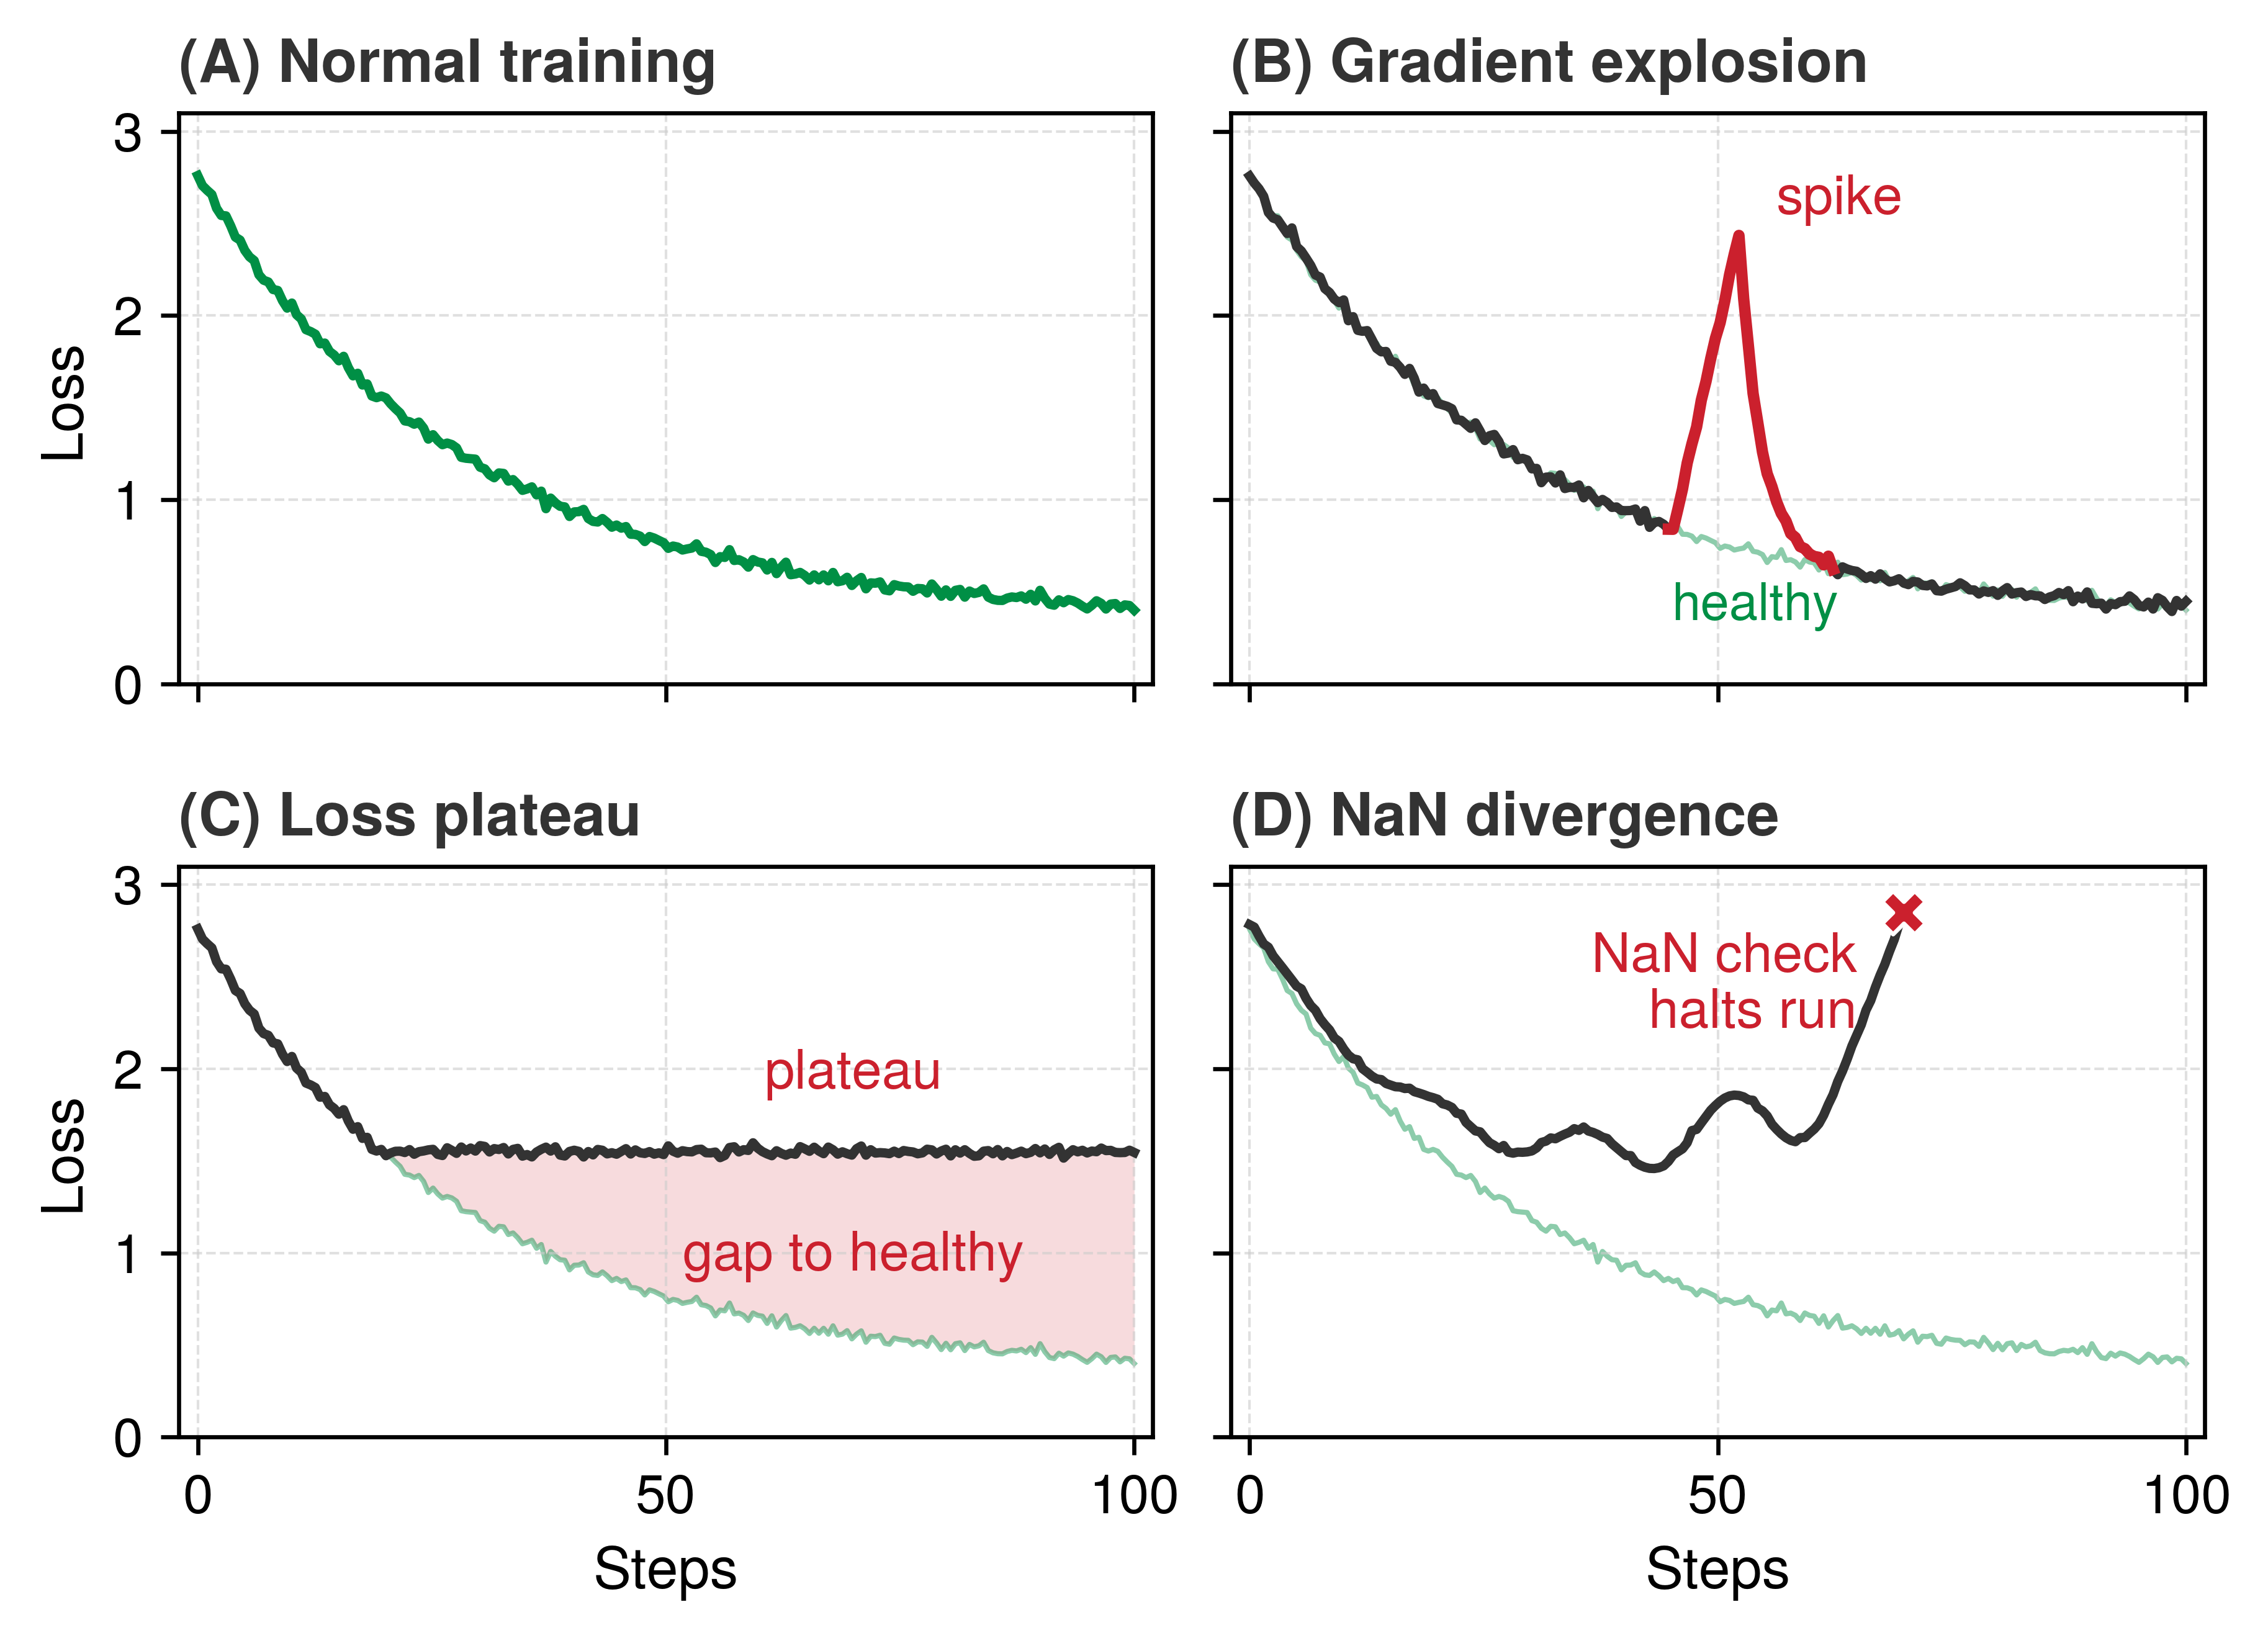
Table 7 pairs each signature, plus the silent hang that a loss curve cannot show, with a candidate cause and a first response. The pairing guides investigation without treating the curve as a unique diagnosis, and the operational question that follows is how long detection actually takes once these monitoring layers interact.
| Signature | Likely interpretation | Recovery response |
|---|---|---|
| Spike followed by recovery | Transient input or numerical anomaly; the curve alone does not identify the cause | Preserve the suspect batch and step evidence, then replay before deciding whether to continue. |
| Spike followed by plateau | Optimizer instability, corrupted state, or a persistent data-path defect | Pause, replay from a known-good checkpoint, and compare input, optimizer, and worker evidence. |
| Gradual divergence | Data drift, numerical instability, corrupted state, or worker desynchronization | Compare per-rank telemetry and evaluation evidence; isolate hardware only when replay implicates it. |
| Hang without an error | Collective deadlock or crashed worker blocking synchronization | Use timeout detection and restart or reconstruct the worker group. |
Systems Perspective 7.5: Realistic failure detection latencies
Failure detection includes more than the configured heartbeat timeout when the policy requires verification before recovery. The ranges in table 8 illustrate planning scenarios, not universal detection guarantees. Aggressive timeouts risk false positives (killing healthy-but-slow workers), while conservative timeouts delay real failure detection. A multi-stage policy can use an initial timeout to trigger investigation and a later threshold to trigger recovery. Its actual latency must be measured under the workload and failure conditions it is intended to handle.
| Failure type | Planning range | Why |
|---|---|---|
| Process crash | 5–30 seconds | Heartbeat timeout + verification retries |
| GPU hang | 30–120 seconds | Must distinguish from legitimately slow kernel |
| Network partition | 60–180 seconds | Must distinguish from temporary congestion |
| Silent data corruption | Minutes to hours | Requires statistical anomaly detection |
7.9.2 Recovery procedures
Once a failure is classified, a cold-restart recovery path executes a coordinated sequence to restore consistency. The warm-restart alternative developed next preserves surviving processes when their state can be trusted.
- Job termination: A
SIGTERMis broadcast to all surviving workers. This cold-restart path tears down the affected training group so that no survivor continues using the old membership or partially completed collective state. - Resource reclamation: The scheduler marks the failed node as “draining” to prevent immediate rescheduling and requests a replacement from the spare pool.
- Job restart: New containers are launched (from cache if available), and the training binary is re-initialized on all nodes.
- Checkpoint loading: Each worker reads the state assigned to it from the distributed filesystem. When membership or parallelism changes, recovery remaps the saved shards to the new partitions.
- State synchronization: Ranks handshake to establish a new communicator (for example,
ncclCommInitRank), and workers verify they are all at the same training step. - Training resumption: The data loader restores its recorded position and sampling state, and the training loop resumes from the checkpoint step. A batch index alone suffices only when it reconstructs the same logical input stream.
Automatic recovery systems perform these steps without human intervention. Modern training frameworks integrate with cluster managers to automate parts of the sequence. DeepSpeed documents save/load routines for model and ZeRO optimizer checkpoints, which provide the durable state needed after failure (DeepSpeed Developers 2026a). PyTorch’s torchrun elastic launch documents failure and membership-change behavior through its rendezvous mechanism,17 the coordinator-backed protocol by which surviving workers agree on membership and ranks after a restart (PyTorch Contributors 2026c, 2026b).
17 Rendezvous: From French “rendez-vous” (present yourselves), this coordination protocol lets restarted workers discover one another and establish a new group before training resumes. Recovery waits for the membership policy to be satisfied, so slow startup, delayed communication, and missing workers can extend this phase. Heterogeneity affects those delays but does not by itself imply a proportional latency law.
Recovery validation tests whether the restored job behaves consistently with its recorded state. Parameter shapes, dtypes, and shard identities must match the manifest. A short replay or validation workload then checks loss and gradient statistics under the expected numerical tolerance; different batches need not reproduce the last prefailure loss. Immediate divergence is evidence to investigate the checkpoint, data state, and execution configuration, not proof that the snapshot is corrupt. Falling back to an earlier validated generation is appropriate when the newest state cannot be trusted.
Recovery must also prevent the failed ownership epoch from returning. A coordinator grants each worker-group incarnation a monotonically increasing epoch (a membership counter, unrelated to a training epoch over the dataset) and associates membership with a renewable lease. Every state-changing write carries that epoch as a fencing token. Before replacement writes proceed, the recovery protocol advances the enforced epoch at each protected resource, which rejects writes carrying an older token (figure 15). The old worker then cannot publish a checkpoint or update job progress, even if it resumes after a long pause; rendezvous likewise admits only the current membership. A lease alone is insufficient because expiration changes the coordinator’s ownership decision, not the old worker’s ability to reach storage. Fencing enforces that decision at the resource boundary (Kleppmann 2016).
Kleppmann, Martin. 2016. Designing Data-Intensive Applications: The Big Ideas Behind Reliable, Scalable, and Maintainable Systems. O’Reilly Media.
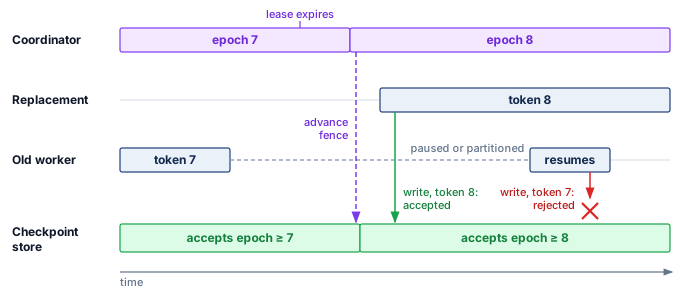
Retries complete the recovery contract. An operation may be retried automatically only when it is idempotent or carries a stable operation identifier that lets the receiver deduplicate repeated effects. Each attempt inherits the caller’s absolute deadline rather than receiving a fresh timeout, and the system caps attempts with a retry budget shared across the request or recovery tree. Exponential backoff and jitter spread attempts in time, but they do not prevent overload if every layer retries independently. The budget therefore belongs at one retry-owning layer; exhausted budget returns a failure or invokes degradation instead of amplifying the original incident (Beyer et al. 2016; Nygard 2007).
Beyer, Betsy, Chris Jones, Jennifer Petoff, and Niall Richard Murphy. 2016. Site Reliability Engineering: How Google Runs Production Systems. O’Reilly Media.
Nygard, Michael T. 2007. Release It!: Design and Deploy Production-Ready Software. Pragmatic Bookshelf.
Napkin Math 7.3: The recovery time budget
Problem: Consider a 175B parameter model training on 1,024 GPUs. The checkpoint size is approximately 2.45 TB (BF16 weights, FP32 master weights, and Adam moments at 14 bytes per parameter). Estimate the cost of a single failure event.
Setup: The recovery budget \(\FailureRecoveryTime\) has four terms.
- \(\FailureDetectionTime\): 60 s (conservative heartbeat timeout with verification retries).
- \(\JobRestartTime\): 3 min (scheduler queue time + container launch + Python import overhead + NCCL initialization).
- \(\CheckpointLoadTime\): 24.5 s (this is the aggregate-shared-storage read of the full 2.45 TB checkpoint at 100 GB/s aggregate; with sharded local-NVMe reads at 5 GB/s, one GPU’s 2.4 GB shard alone would load in under a second, but the GPUs of a node share its drive, so the node’s 19.1 GB share takes about 3.8 s, and only on nodes that survived with their local copy).
- \(\RecoveryWarmupTime\): 2 min (JIT kernel compilation, data pipeline buffer fill, TCP connection re-establishment).
Total: \(\FailureRecoveryTime= \FailureDetectionTime+ \JobRestartTime+ \CheckpointLoadTime+ \RecoveryWarmupTime\approx\) 6.4 min per failure event.
Impact: For this recovery path, \(\FailureRecoveryTime\) is the operational MTTR term in the steady-state availability relation (perspective 7.1). It is not the whole cost of a failure. Every failure also discards the work done since the last completed checkpoint, on average half the checkpoint interval (figure 12), and the Young-Daly waste of equation 8 already counts that rework, so the figures below price only the recovery term. Recovery time optimization matters more as clusters grow. The GPU-only baseline from table 1 compares the two sizes on a common basis and understates both failure counts. On that basis, a 1,024-GPU cluster has MTBF of 49 hours and experiences about 0.49 failures/day, losing about 3 minutes daily, a modest 0.2 percent overhead. However, a 10,000-GPU cluster has GPU-only MTBF of 5 hours and experiences about 4.8 failures/day, losing about 31 minutes daily (2.1 percent overhead), equivalent to wasting roughly 5,127 GPU-hours every day (the daily lost minutes multiplied across all 10,000 GPUs).
7.9.3 Warm restart vs. cold restart
The recovery procedure described in section 7.9.2 is a cold restart: every process in the affected job group exits, and the group reloads state from a valid checkpoint. This simplifies recovery by avoiding dependence on surviving in-memory state, but it can discard useful state. After one GPU fails in the 1,024-GPU reference job, every surviving worker may retain reusable values; an interrupted update or silent corruption, however, can make some of those values unsafe to keep.
A warm restart preserves the state of surviving workers. When a rank fails, surviving ranks detect the failure but do not exit. They enter a waiting state, preserving loaded model weights and optimizer states in GPU memory. The scheduler replaces only the failed node. The new node joins, loads its partition of the state from disk (or receives it via broadcast from a peer), and the communicator is rebuilt. The replacement and survivors must agree on the same committed training step before resuming. A shard restored from an older checkpoint cannot be combined with survivor shards that have advanced beyond it; the runtime must reconstruct the missing current state or roll the group back to a common recovery point. Training resumes only after that consistency check.
When the missing state can be reconstructed at the survivors’ current step, warm restart avoids a full-cluster reload and repeated warmup. For the 1,024 GPUs example, that fast path avoids rereading the full 2.45 TB checkpoint through shared storage, whose cold-path \(\CheckpointLoadTime\) is 24.5 s. The replacement still needs state transfer and initialization, and all ranks wait until it is ready. If consistency instead requires a rollback, the recovery budget must include the corresponding survivor-state restoration and lost work.
The trade-off is software complexity. Survivor-preserving warm restarts require specialized application and runtime support for dynamic membership changes without leaking CUDA memory, corrupting shared state, or deadlocking during communicator reconstruction. Common training frameworks restart the worker group or reload a checkpoint rather than preserve survivors (section 7.10.1.2). A deployment that implements a warm-restart fast path still needs cold restart as a safety net. The cold-restart range in table 9 brackets the 6.4 min budget computed above. The warm-restart range is a planning range for the fast path, which avoids the full-cluster reload and warmup; its actual duration depends on how quickly the replacement receives its state and the communicator is rebuilt.
| Aspect | Cold restart | Warm restart |
|---|---|---|
| Recovery time | 4–10 minutes (full reload) | 30–90 seconds (single node reload) |
| State guarantee | Clean: all state from checkpoint | Assumes surviving state is valid |
| Implementation | Simple: kill all, reload all | Complex: dynamic membership management |
| Failure during recovery | Retry cold restart | Fall back to cold restart |
| Best for | Correlated failures, SDC events | Single-node failures, GPU errors |
7.9.4 Recovery automation pipeline
At the scale of 10,000+ GPUs, failures occur multiple times per day, so human operators cannot intervene manually on each incident. Recovery must be an autonomous control loop managed by the cluster control plane. Published reports from large training fleets describe multi-stage automation that classifies failures and selects the minimum viable remediation (Dubey et al. 2024; Kokolis et al. 2025; Zu et al. 2024).
The pipeline operates in four ordered stages:
- Health monitoring daemon: Continuously scrapes GPU telemetry (ECC error counters, temperature, fan speed, NVLink status) alongside application metrics like training loss and step throughput, often from a sidecar container.
- Failure classifier: Determines whether a signal indicates a fatal error (for example, NVIDIA Xid error 48: double-bit ECC error), a transient stall (for example, temporary network congestion), or a performance degradation (for example, thermal throttling).
- Action selector: Chooses the cheapest response consistent with the affected state and communication group. A process hang on one rank usually requires restarting the whole communication group rather than one container, because every surviving rank still holds a communicator that includes the hung rank. A confirmed hardware fault requires draining the node and drawing a replacement from the spare pool, which is slower and consumes standby capacity. A network partition can justify a bounded wait that preserves in-memory state, but if the wait expires, replacement must fence the old ownership before accepting new writes.
- Validation stage: Runs a recorded “canary batch” or validation workload under the expected numerical tolerance. Unexpected loss or gradient behavior triggers investigation of restored state and execution configuration, with fallback to an earlier validated snapshot when the new state cannot be trusted.
This automation removes the human page-diagnose-repair cycle from the recovery path for the common failure types, which shortens mean time to recovery. The classification stage is critical. Treating every failure as a cold restart wastes compute on transient issues, while treating a hardware failure as transient allows corrupted computation to continue. The Llama 3 pretraining run shows what such a pipeline buys at fleet scale.
War Story 7.2: The training run that failed every few hours (2024)
Context: Meta reports training Llama 3 405B on 16,384 H100 GPUs during a 54-day snapshot of pretraining (Dubey et al. 2024).
Mechanism: The snapshot recorded 419 unexpected interruptions, about one every 3.1 hours, with the root causes shown in figure 2.
Impact: Meta nevertheless reported more than 90 percent effective training time, measured as useful training time divided by elapsed time. Significant manual intervention was required only three times.
Fix: Meta reduced job startup and checkpointing time and developed automated diagnosis and recovery tools. Communication traces helped locate stalled collectives and slow workers before restarting useful work.
Systems lesson: At fleet scale, reliability is a property of the recovery system rather than of the hardware. Effective training time stayed high because automation, not operators, handled nearly every interruption.
7.9.5 Stragglers versus fail-stop failures
Systems Perspective 7.6: Straggler or failure
A straggler, the slow rank of a synchronous step (Synchronization models), bounds the throughput of every peer that waits on it, so one node running 10 percent slow can cost thousands of nodes 10 percent of their capacity. Fault tolerance must decide what that slowness means. A straggler can still produce correct results, so slowness alone establishes neither incorrect values nor a failed process, and its cause is often system jitter from background OS processes, network congestion, or thermal throttling rather than bad hardware. The decision is between mitigation, which keeps the job running and removes the slowdown, and recovery, which treats the rank as failed and pays for a restart.
In synchronous training, a straggler sets the pace of the entire cluster, because AllReduce cannot complete until every rank has submitted its gradients. Under the simplified no-overlap straggler model, the step time becomes: \[ \StragglerStepTime(\DeviceCount) = \max(\FirstRankComputeTime, \SecondRankComputeTime, \dots, \LastRankComputeTime) + \CommunicationTime(\DeviceCount) \]
Many stragglers are gray failures, the silent degradations named in the failure taxonomy, seen from inside a synchronous job, and none of their common causes raises an explicit error. Thermal throttling reduces clock speed, degrading interconnect cables increase communication latency, OS background processes (memory scrubbing, log rotation) consume CPU cycles, and data loading from a congested network filesystem introduces variable I/O delays. A slow worker can continue meeting a liveness timeout while reducing training throughput, or become slow enough to trigger the same timeout as a failed worker. Progress measurements are therefore needed alongside liveness checks.
The challenge is distinguishing stragglers from failures. Stragglers should trigger mitigation (redistribute work, replace the slow node). Failures should trigger recovery (checkpoint-restart). Aggressive timeouts treat stragglers as failures, causing unnecessary job restarts that waste more compute than the straggler itself. Conservative timeouts waste compute waiting for stragglers that will never speed up. The two responses also land in different places in the goodput accounting of Accounting boundaries: a slow rank that stays in the job lowers program goodput, while replacing it spends runtime goodput on the restart, so the replacement decision weighs one loss against the other.
Straggler mitigation strategies change either the work assignment or the execution resources. Dynamic load balancing moves work away from slow workers while preserving the intended update, whereas bounded staleness allows delayed gradients under an algorithm that tolerates them; its convergence cost depends on the workload and delay bound. Backup workers replicate selected tasks and accept one result per logical contribution, trading extra GPU cycles for a shorter wait without double-counting gradients. At the infrastructure boundary, proactive replacement uses hardware telemetry, such as rising operating temperatures or growing correctable-ECC error counts, to identify suspect components and replace them when the expected benefit exceeds migration and recovery costs. A simple cost calculation shows why a severe straggler is often cheaper to replace than to tolerate.

One straggler stalls every healthy peer at the barrier.
Napkin Math 7.4: The cost of a straggler
Consider a 1,024-GPU cluster where a normal training iteration takes 1 second. A single GPU enters a thermally throttled state, clocking down to 50 percent speed, and now takes 2 seconds to complete its computation.
Because AllReduce cannot complete until every rank has submitted its gradients, the other 1,023 healthy GPUs sit idle waiting for the straggler.
Impact:
- Normal step time: 1 second
- Straggler step time: 2 seconds
- Effective cluster speed: 1 step/2s = 0.5 steps/sec
A single failing device (0.1 percent of the hardware) has reduced the throughput of the entire cluster by 50 percent. At $2/GPU-hour, this straggler wastes $1,024/hour in idle compute.
Systems insight: Replacement is worthwhile only when the expected time saved exceeds recovery and replay costs. If the slowdown is expected to persist for the next \(\SlowdownPersistenceUpdateCount\) useful updates, whose step times are \(\DegradedStepTime\) on the degraded allocation and \(\HealthyStepTime\) after replacement, the simplified break-even condition is \(\SlowdownPersistenceUpdateCount(\DegradedStepTime-\HealthyStepTime) > \JobRestartTime+ \LostWorkReplayTime\). The right side includes waiting for capacity and restoring state. A short-lived slowdown may clear before replacement pays off; false-positive detection and uncertain persistence also affect the decision. MTBF describes failure recurrence, not how long this slowdown will last.
Replacing a slow node while maintaining the original GPU count requires available capacity. An \(\DeviceCount+1\) redundancy model reserves a hot spare for the isolation and promotion stages of figure 10, reducing allocation delay. Promotion still requires compatible resources, valid state, and communication-group reconstruction; an idle device alone does not guarantee recovery within seconds. A cold spare adds startup work, while a job without a reserved spare depends on the scheduler finding capacity or on repair. The hot spare buys shorter waiting time with devices that sit idle while the fleet is healthy. Fixed-size checkpoint-restart recovery restores the original resource count. Elastic recovery relaxes that requirement by allowing the job to continue with fewer workers when the remaining allocation can support it.
Checkpoint 7.5: Tuning detection and recovery
Verify your understanding of how detection latency and recovery strategy trade against one another:
Self-Check: Question
A 10,000-GPU training job experiences a GPU failure. The cluster implements cold restart, where \(T_{\text{detect}} = 30\text{ s}\), \(T_{\text{restart}} = 3\text{ min}\), \(T_{\text{load}} = 36\text{ s}\), and \(T_{\text{warmup}} = 2\text{ min}\). If the cluster MTBF is 5 hours, what is the daily compute loss incurred solely from recovery time?
- Approximately 0.5 minutes daily, wasting 5 GPU-hours per day.
- Approximately 6.6 minutes daily, wasting 100 GPU-hours per day.
- Approximately 15 minutes daily, wasting 500 GPU-hours per day.
- Approximately 29.3 minutes daily, wasting roughly 4,880 GPU-hours per day across the fleet.
Compare a warm restart with a cold restart for a single-GPU failure in a 1,000-GPU cluster in terms of recovery latency, memory state guarantees, and software complexity.
In a compute-dominated 1,000-GPU synchronous job, one GPU remains at half speed, reducing useful cluster throughput by approximately half. What comparison determines whether replacing it is worth the interruption?
- Throughput drops by only 0.1% (1/1000th); the straggler should always be tolerated to avoid restart overhead.
- Compare the useful work lost during replacement, restart, and replay with the work recovered by removing the slowdown over its expected remaining duration.
- Cluster throughput remains 100% because asynchronous gradient buffering absorbs all rank jitter.
- Throughput drops by 100% because any slow rank immediately triggers an NCCL assertion crash.
Sequence the six sequential operational stages executed by the chapter’s stated cold-restart recovery path after classifying a hard worker failure:
- Resource Reclamation: Scheduler marks defective node as draining and requests spare node
- Job Termination: Broadcast termination signal to tear down invalidated communicator
- Checkpoint Loading: Workers read local partition state shards from distributed storage
- Training Resumption: Data loaders restore recorded position and sampling state, and training resumes
- Job Restart: Launch fresh container processes and re-initialize training runtime binary
- State Synchronization: Workers execute rendezvous and re-initialize NCCL communicators
In heartbeat failure detection (\(T_{\text{timeout}} = H + k\sigma_d\)), reducing the safety multiplier \(k\) to a very small value (e.g., \(k=1\)) is universally optimal because it minimizes detection latency \(T_{\text{detect}}\) without any operational downsides.
During pretraining of a foundation model, the training loss curve exhibits gradual divergence over 50 steps without any thrown exceptions or NaNs in the logs. Based on common ML failure signatures, which failure hypothesis and investigation path should be considered?
- Learning rate warm-up is too fast; double the learning rate and continue training.
- A disk full error occurred on the central coordinator; delete log files to resume execution.
- The tokenizer encountered an unknown character; restart training from Step 0.
- Silent data corruption or subtle distributed rank desynchronization may have occurred; investigate with independent replay, quarantine confirmed faulty hardware, and roll back to a known-good checkpoint prior to divergence.
7.10 Elastic Recovery
Suppose a 1,024-GPU training job loses an 8-GPU node to a hardware fault, but the cluster has no spare nodes available. A fixed-size recovery policy leaves the remaining 1,016 GPUs waiting until replacement capacity becomes available or the allocation is released. Elastic recovery allows the job to resize and continue with less compute, provided its state and parallel decomposition fit the smaller allocation.
Definition 7.2: Elastic training
Elastic training is the capability of a distributed training job to adjust its worker count across membership changes, potentially through a coordinated worker-group restart.
- Significance: It converts a permanent capacity loss into a temporary interruption followed by reduced throughput. A pure data-parallel 1,024-GPU job that loses 8 GPUs retains 99.2 percent of its device count and may resume if the remaining devices can hold the state. Tensor- and pipeline-parallel jobs additionally need a feasible partition and compatible group sizes; retained device count does not guarantee the same fraction of throughput. The recovery policy must either preserve the effective batch size through additional accumulation or validate the optimization changes caused by a smaller batch.
- Distinction: Unlike fixed-size checkpoint-restart recovery, which waits for replacement hardware to restore the original allocation, elastic recovery can restart or resume with a different worker count. The optimization loop may pause while membership, ranks, and state are re-established.
- Common pitfall: A frequent misconception is that elasticity is “automatic.” In reality, recovery requires coordinated adaptation: the training framework, the data loader, and the orchestrator must all synchronize their state to ensure that no data samples are lost or double-counted during the resize.
A small example shows the lifecycle in three phases (figure 16). Execution begins with a balanced four-node AllReduce ring at full throughput. When Node 3 drops out, the survivors pause at a rendezvous barrier and reload the last consistent checkpoint. The group then contracts into a three-node ring in which each worker takes a one-third larger data shard, resuming productive training at 75 percent throughput if the per-worker rate remains unchanged.
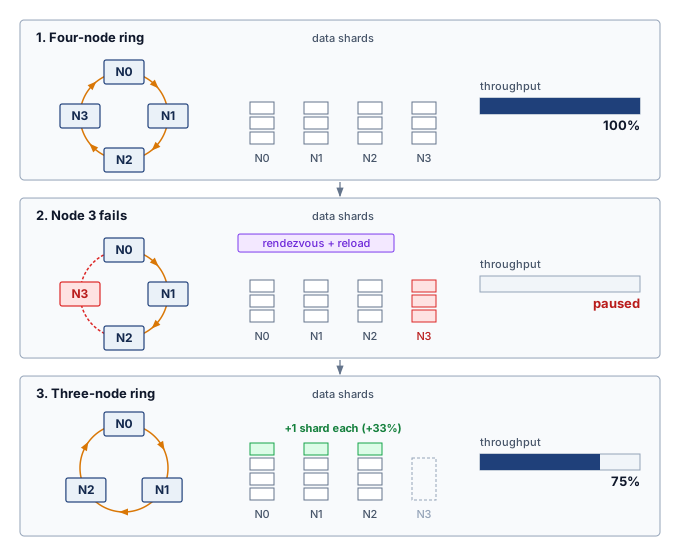
7.10.1 Recovery adaptation mechanisms
Shedding a lost node narrows the active ring instead of idling the whole allocation until replacement hardware arrives, so elastic recovery converts a job termination into a bounded capacity adjustment. The worker group may restart while the framework re-establishes membership, ranks, and state under the smaller resource allocation. When a failure reduces the worker count, the recovery path must adapt several training components before productive work resumes. Each adaptation addresses a specific consistency requirement that, if violated, would corrupt the model or waste computation.
Batch size adjustment comes first: with fewer surviving workers, either each worker must process more samples to preserve the global batch size, or the global batch size must shrink, which in turn may require recalibrating the learning rate to preserve convergence. Changing the global batch size changes the optimization regime as well as the amount of work per step. The linear and square-root learning-rate rules of Learning rate scaling rules are candidate policies for a resized job, with the worker-count ratio standing in for the batch ratio when per-worker microbatch size and accumulation count stay fixed (Goyal et al. 2017). For a shrink, the square-root rule reduces the learning rate less than linear scaling does; that arithmetic does not establish which policy is more stable, and either policy requires validation for the optimizer, schedule, and workload. Preserving the global batch instead can avoid introducing this change in optimization regime.
Goyal, Priya, Piotr Dollár, Ross Girshick, Pieter Noordhuis, Lukasz Wesolowski, Aapo Kyrola, Andrew Tulloch, Yangqing Jia, and Kaiming He. 2017. “Accurate, Large Minibatch SGD: Training ImageNet in 1 Hour.” arXiv Preprint arXiv:1706.02677 abs/1706.02677.
Gradient accumulation offers that alternative. Each surviving worker processes additional micro-batches before synchronization to maintain the original effective batch size. If worker count drops by half, doubling the accumulation steps preserves the number of examples per update and can retain the existing learning-rate schedule. Each worker then performs twice as much micro-batch computation per update, although communication and overlap determine the wall-time increase. Equal batch size does not imply bitwise-identical updates or identical behavior from operations that depend on micro-batch statistics.
Data loader redistribution must agree with the recovered training step and new membership. When workers are lost, the loader reassigns the remaining logical input stream so that the resize itself neither omits samples nor counts them twice in an update. Replaying work discarded by checkpoint rollback is expected; duplicating contributions within the resumed stream is a different error. The saved data position and sampling state distinguish those cases.
State resharding adds further complexity when using sharded model parallelism (ZeRO/FSDP), because the loss of a worker can remove the only live copy of its state shard. A surviving replica can supply that shard; otherwise recovery must reconstruct it from sufficient retained information or reload a complete checkpoint generation. Only then can the system redistribute valid state across the surviving workers. Changing shard ownership alone cannot recover missing values.
Spot instance preemption as a failure class
Hardware faults are not the only event that removes workers from a running job. Cloud providers often price preemptible (“spot”) instances below on-demand capacity, with the caveat that they can be reclaimed with little warning. Once workers vanish, recovery faces the same missing-state and membership problems as a hardware failure. An advance notice, when available, can allow a coordinated save or drain before departure and therefore changes the recovery opportunity.
Both fixed-size and elastic jobs can recover from preemption using checkpoints, but a fixed-size job must regain its required allocation before restarting. An elastic job can instead resume at reduced scale if enough capacity remains and the training invariants survive the resize. Recovery still pays for detection, state restoration, and group reconstruction; repeated reclamations can erase the apparent price advantage. At the reference fleet prices of $0.70/GPU-hour for spot capacity against $2/GPU-hour for on-demand capacity, the savings can outweigh the lost work and resizing delays; Spot instances and preemptible VMs develops the full spot-versus-on-demand cost model. Where spot capacity makes worker departure frequent, federated training makes it the default.
Lighthouse 7.2: Archetype C (Federated MobileNet): Dropout as the normal case
Archetype C (Federated MobileNet) makes worker departure an expected part of training. Its phone-class clients train while charging, idle, and connected, so a client that disappears mid-round is an ordinary event rather than a fault to repair. The coordinator therefore selects more clients than a round needs and closes the round at a deadline. The round tolerates departures as long as enough compatible updates arrive; otherwise the coordinator abandons it (McMahan et al. 2017; Bonawitz et al. 2019). Model-version checks prevent updates computed against a replaced model from entering the current aggregate, the federated counterpart of fencing a stale epoch, while aggregation weights account for the examples contributed under the chosen learning algorithm. Version checks and weighting do not remove participation bias. Recovery must preserve the coordinator state needed to continue that algorithm, including the model, round position, and any persistent optimizer or sampling state, rather than assuming weights alone suffice. Client scheduling develops the round design, including deadlines, participation requirements, and the bias that arises when some kinds of devices report less often than others.
Bonawitz, K., H. Eichner, W. Grieskamp, D. Huba, A. Ingerman, V. Ivanov, C. Kiddon, et al. 2019. “Towards Federated Learning at Scale: System Design.” Proceedings of Machine Learning and Systems 3.
McMahan, Brendan, Eider Moore, Daniel Ramage, Seth Hampson, and Blaise Agüera y Arcas. 2017. “Communication-Efficient Learning of Deep Networks from Decentralized Data.” International Conference on Artificial Intelligence and Statistics (AISTATS), Proceedings of machine learning research, vol. 54: 1273–82.
Framework support for elastic recovery
The framework question is which resize invariants it can enforce automatically: group membership, shard ownership, data coverage, and batch math. The recovery adaptation mechanisms (batch size adjustment, learning rate recalibration, data loader redistribution, state resharding) must be implemented by the training framework, and frameworks differ in how much of this recovery logic they automate after a failure. PyTorch Elastic (TorchElastic) uses agents to monitor workers and a rendezvous mechanism to establish group membership (PyTorch Contributors 2026c, 2026b): on a failure or membership change, it stops all surviving workers, forms a new worker group, and starts its workers with new RANK and WORLD_SIZE assignments, handling rank reassignment and communication-group reconstruction while leaving batch size, learning rate, and checkpoint semantics to user code. DeepSpeed (Rasley et al. 2020) provides ZeRO-based distributed training and checkpointing building blocks for large models (DeepSpeed Developers 2026a), where recovery reloads from the last durable checkpoint and Universal Checkpointing addresses portability across some changes in parallelism and topology (DeepSpeed Developers 2026b), though elastic behavior still depends on the surrounding launcher and resource manager.
PyTorch Contributors. 2026b. Torch Distributed Elastic Rendezvous. PyTorch documentation.
Rasley, Jeff, Samyam Rajbhandari, Olatunji Ruwase, and Yuxiong He. 2020. “DeepSpeed: System Optimizations Enable Training Deep Learning Models with over 100 Billion Parameters.” Proceedings of the 26th ACM SIGKDD International Conference on Knowledge Discovery & Data Mining, 3505–6. https://doi.org/10.1145/3394486.3406703.
DeepSpeed Developers. 2026a. DeepSpeed Model Checkpointing. DeepSpeed documentation.
DeepSpeed Developers. 2026b. DeepSpeed Universal Checkpointing with DeepSpeed: A Practical Guide. DeepSpeed tutorial.
Ray Project. 2026. Ray Train: Handling Failures and Node Preemption. Ray documentation.
Sergeev, Alexander, and Mike Del Balso. 2018. “Horovod: Fast and Easy Distributed Deep Learning in TensorFlow.” CoRR abs/1802.05799.
Horovod Developers. 2026. Elastic Horovod. Horovod documentation.
Ray Train, built on Ray’s actor model, provides a checkpoint-oriented recovery path that restarts a worker group after a failure or preemption and resumes from the latest available checkpoint while the training function remains responsible for saving and loading sufficient state (Ray Project 2026). Horovod Elastic similarly builds on Horovod’s data-parallel training system (Sergeev and Balso 2018) with an elastic state API for worker additions and removals (Horovod Developers 2026) that resets ranks and reconstructs communication while leaving convergence-sensitive choices such as learning-rate or batch-size policy to the training script. Across these four frameworks, restarting the worker group is largely automated, while state resharding remains manual, deployment-dependent, or tied to a checkpoint reload (table 10).
| Framework | Failure detection | Automatic recovery | State resharding | Cluster integration |
|---|---|---|---|---|
| PyTorch Elastic | Rendezvous timeout | Yes | Manual | Kubernetes |
| DeepSpeed | External | Checkpoint-based | Deployment-dependent | External schedulers |
| Ray Train | Actor supervision | Checkpoint retry path | Checkpoint reload | Ray Cluster |
| Horovod Elastic | Driver heartbeat | Yes | Manual | Slurm, Kubernetes |
7.10.2 Model-specific training fault tolerance
The checkpoint and recovery strategies developed in section 7.8 and section 7.9 require adaptation because workloads lose different kinds of state when they fail. Section 7.7.1 priced those differences as failure costs; here they become checkpoint contents. The design question is therefore not simply how often to checkpoint, but which state variable would make a restart mathematically or economically wrong. For recommendation workloads, incremental checkpointing, tiered checkpointing, and embedding versioning can reduce the cost of preserving fresh state. Incremental storage can still reconstruct an exact generation from a base and its required deltas; accepting stale or approximate state is a separate choice. For each workload, the state at risk determines what its checkpoint must contain (table 11).
| Workload | State at risk | Checkpoint implication |
|---|---|---|
| LLM training | Optimizer state, curriculum position, document position, long-context schedule | Preserve the FP32 optimizer state where precision matters, shard writes with ZeRO/FSDP, move serialization off the critical path, and include the data-schedule position so the optimization trajectory resumes correctly. |
| Recommendation | Embedding freshness, feature-store version | Preserve fresh state with incremental checkpointing, tiered checkpointing, and embedding versioning; accepting stale or approximate state requires a separate recovery contract. |
| Vision | Augmentation seeds, shuffling order, batch-normalization statistics, progressive-resizing schedule | Capture the stochastic and normalization state that controls the input stream; weights alone are not enough to reproduce the training trajectory. |
| Scientific ML | Simulator state, search frontier, explored configurations, validation seeds | Treat the model, simulator, search process, and random state as one consistency unit so recovery does not duplicate exploration or invalidate comparisons. |
The common pattern is that recovery correctness is broader than weight restoration. LLMs can reload weights but resume with the wrong curriculum position. Recommendation models that train continuously can reload dense parameters but serve stale embeddings, so a failure that loses recent updates carries a freshness cost as well as a replay cost, and the recovery budget must reflect the workload’s measured sensitivity to stale state.18 Vision models have smaller checkpoints, about 1.2 GB for the ViT-Large example, which permit more frequent saves on the same storage path, yet reproducing their input stream requires the augmentation configuration, random-number generator state, and data position rather than only the initial shuffling seed. Scientific models can reload a neural network while losing the simulator state that made the data meaningful, and an iterative search must also retain which configurations it has evaluated when those results choose its next candidates. In every case the checkpoint boundary must include whatever prior decisions affect future work, wherever that state resides; once the trained model is deployed to users, however, the operational calculus shifts from protecting weeks of batch computation to protecting milliseconds of real-time latency.
18 RecSys freshness: Freshness makes recovery delay part of the model-quality budget. Its importance depends on how quickly useful user and item signals change and how strongly predictions depend on them. Comparing quality at different state ages establishes the permitted staleness; that measured limit determines how much checkpoint and replication overhead is justified.
Self-Check: Question
When an 8-GPU node fails during a 1,024-GPU training run and no spare nodes are available, how does an elastic training framework enable the job to continue without idling the remaining 1,016 GPUs?
- It automatically pauses the run and waits indefinitely until physical hardware repair replaces the defective node.
- It shifts the missing 8 ranks of computation entirely to host CPU threads without changing the communication topology.
- It can rebuild the worker group and restore valid state on the survivors when memory and parallelism permit, preserving data and batch invariants; 99.2% retained device count does not guarantee the same fraction of throughput.
- It ignores the lost node and allows the remaining workers to continue training without synchronizing gradients.
When an elastic training job resizes from \(N_{\text{base}}\) to \(N_{\text{new}}\) workers, compare using gradient accumulation adjustment versus learning rate recalibration to preserve optimization dynamics.
How does elastic recovery transform the economics of training large foundation models on preemptible cloud ‘spot’ instances?
- It can resume at reduced scale after preemption when state and parallelism fit the survivors, reducing waiting for replacement capacity; net savings still depend on lost work, recovery cost, and preemption frequency.
- It forces cloud providers to guarantee \(100\%\) uptime for spot instances by running redundant dummy processes.
- It eliminates all network communication requirements, allowing spot instances to train completely independently without synchronizing weights.
- It converts spot instances into dedicated on-demand instances at zero additional billing charge.
For large recommendation systems with multi-terabyte embedding tables, checkpoint and recovery strategies must always prioritize strict full-state reproducibility over embedding freshness to avoid business revenue loss.
In PyTorch Elastic (TorchElastic), the coordinator-backed synchronization protocol by which surviving and restarted workers discover each other, establish communication, and agree on new rank and world size assignments is called ____.
7.11 Serving Fault Tolerance
When users ask a voice assistant to turn off the lights, they will not tolerate a five-minute pause while the inference server reloads from a checkpoint. Serving presents a different challenge, because users expect millisecond-level responsiveness even when backend GPUs crash. The C³ budget for fault tolerance shifts accordingly. Training pays for coordination in synchronization time so that a failure does not erase completed compute, while serving pays in standing redundant compute and in routing coordination so that a failure does not break a latency contract.
A serving replica is a runnable copy of the model that can accept requests; the routing layer chooses a replica, and a readiness check determines whether that replica can serve successfully. Replicas may share external state stores or keep request state in accelerator memory, so replacing compute does not necessarily replace the state a request needs. Serving fault tolerance asks how those mechanisms behave when replicas, GPUs, or state stores fail under live latency budgets. The focus here is narrower than a complete serving architecture: each mechanism is treated as a reliability boundary for real-time inference.
7.11.1 Stateless vs. stateful serving
The first serving decision is where request state lives, because that choice determines whether failover is a retry or a state-reconstruction problem. A stateless model worker retains no required per-session state between requests. It obtains the necessary context from the request or an external state store, so another ready worker can process the same request. A stateful application can therefore use stateless model workers, although its external store remains a reliability dependency.
The stateless pattern appears when the input itself carries all context: an image classifier processes one image, an object detector processes one frame, a single-turn text classifier processes one snippet, and an embedding service maps one input to one vector. Fault tolerance can then focus on replica health and request routing. Redundant replicas serve requests in parallel, load balancing sends traffic only to healthy replicas, health checks remove failed replicas from rotation, and automatic replacement starts a new replica when capacity falls. When a replica fails, in-flight requests to that replica can be retried elsewhere, because no quality-bearing session state has been lost.
Stateless serving offers the simpler architecture when the application permits it. However, many ML applications inherently require state across requests. Consider a chatbot: a single-turn question-answering system can operate statelessly, processing each question independently. A conversational assistant must preserve its history somewhere, but the model worker can still be stateless if each request carries the complete history or reads it from a durable external store. Worker-local state creates a stronger dependency when later requests rely on information available only at the selected replica.
Stateful serving appears when later work depends on retained session state. For a transformer, the key-value (KV) cache stores attention keys and values computed for earlier tokens so the worker can reuse them while generating subsequent tokens. This cache is derived state. If the authoritative token history and compatible model version remain available, a replacement can recompute it by processing that history again. Losing the history itself is a different failure because cache reconstruction no longer has its required input. Streaming speech recognition similarly maintains context from previous audio, recommendation sessions accumulate user context, and interactive editing maintains document state across edits. The fault-tolerance consequence is that failure loses quality-bearing state rather than serving capacity alone. KV cache loss requires reprocessing previous turns, session context loss forces users to repeat previous interactions, and accumulated user state loss degrades quality when context is unavailable. The mitigation choice follows the size, update rate, and quality value of that state: session affinity routes a session to the same replica, state checkpointing periodically saves session state, state replication maintains a standby copy, and graceful degradation keeps the service available at reduced quality if state cannot be recovered. Table 12 contrasts how that state boundary reshapes routing, failure impact, and recovery complexity, and whether the architecture is stateless or stateful, maintaining availability under live latency constraints requires deploying redundant capacity.
↪ How the KV cache grows with sequence length and concurrency until it fills accelerator memory is developed in The KV cache wall and memory capacity.
| Aspect | Stateless serving | Stateful serving |
|---|---|---|
| Request routing | Any replica | Session-affine replica |
| Failure impact | Retry on another replica | Potential state loss |
| Recovery complexity | Restart and load weights | Reload state + reconstruct context |
| Redundancy approach | Active-active replicas | Replicated state + standby |
| Work after detection | Route or retry to a ready worker | Recover required state, then route or retry |
7.11.2 Redundancy and replication
Redundancy buys availability only when replica placement and spare capacity match the failure domain being defended against. Multiple copies of serving capability let the system continue operating when individual replicas fail.
Availability calculations
Serving redundancy is the parallel composition of section 7.2.1 applied to interchangeable replicas, with availability in place of survival probability. For a single replica with availability \(\ReplicaAvailability\) (probability of being operational at any given time), equation 12 quantifies how multiple independent replicas achieve higher system availability:
\[ \RedundantServiceAvailability= 1 - (1 - \ReplicaAvailability)^\RedundantReplicaCount \tag{12}\]
where \(\RedundantReplicaCount\) is the number of replicas. For a service whose single replica is available 99 percent of the time, redundancy compounds as follows.
For a single replica, availability of 99 percent corresponds to 3.65 days of downtime per year. Adding independent replicas changes the tail of the failure distribution quickly: two replicas give 99.99 percent, or 52.6 minutes of downtime per year, and three replicas give 99.9999 percent, or 31.5 seconds. The arithmetic assumes independent failures and enough capacity on any surviving replica to meet the service target; shared power, shared networking, and shared software bugs reduce actual availability below these theoretical values.
Redundancy turns days of downtime into seconds.
Replication strategies
The availability equation says how much redundancy can help; the replication topology determines how that redundancy behaves under normal execution and sudden hardware loss. Two fundamental designs make opposite bets (figure 17). Active-active replication splits ingress traffic evenly across live replicas, one-third each for three, which keeps every device busy but requires spare headroom so the survivors can absorb a failed replica’s share. Active-passive replication sends all traffic to a designated primary and keeps a pre-warmed standby whose weights remain loaded in accelerator memory, which makes failover fast at the expense of a device that serves nothing while the primary is healthy.
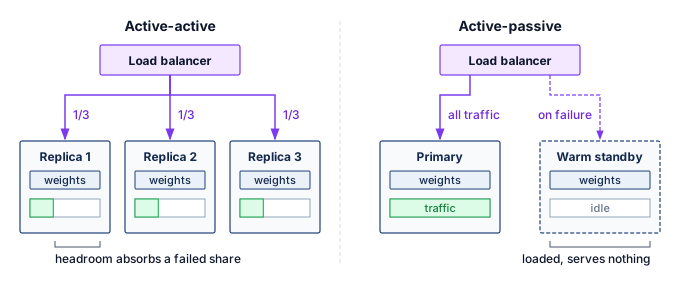
Geographic replication extends the same choice across regions. It protects against data-center or regional network failures, but requests routed to distant regions pay additional latency, and the active-active headroom problem reappears at regional scale. When a region fails, the surviving regions must absorb its traffic and, for stateful services, rebuild its sessions, so each region either carries spare capacity sized for the largest region it may absorb or accepts degraded latency during the failover. Traffic returns to a recovered region gradually, because its caches and warm replicas start empty and an abrupt shift back would overload it and trigger the same failover again. Multi-tier designs combine several replication policies at once: edge caches replicate for latency, regional serving clusters replicate for availability, and a global primary or coordination layer preserves consistency and freshness.
Replica placement and failure domains
Effective redundancy requires placing replicas in independent failure domains. Different machines tolerate individual machine failures; different racks tolerate rack-level failures from power or top-of-rack switch issues; different availability zones tolerate data-center-section failures; and different regions tolerate entire data-center failures. The independence level should match the availability requirement and cost constraint: regional replication is expensive because it duplicates compute and network capacity, but it is necessary when regional failure must not become user-visible downtime. Placement alone, however, only creates the possibility of recovery; the serving system still needs a control loop that notices the failure, removes the affected replica from traffic, and preserves enough state that the user-visible service continues with bounded degradation.
7.11.3 Failover mechanisms
When a replica fails, traffic must be redirected to healthy replicas, and the speed and reliability of that redirection determine how much of the failure users see. The mechanism decomposes into two questions: how the system decides that a replica can no longer serve, and what happens to stateful sessions already attached to it.
Health checking
Health checks decide when traffic should move. The liveness and readiness probes of section 7.9.1 apply to a serving replica, where readiness means that its weights are loaded, its accelerator is initialized, warmup has completed, and dependencies such as feature stores (the services that supply precomputed model input features) are reachable. Serving adds an inference check, which runs a known input through the model and compares the output with the expected result, catching the silent failure in which the process is healthy but its answers are wrong. The load balancer acts on these signals.
↪ What each probe must test on an accelerator replica, from process liveness to a fixed-prompt inference check, is developed in Health checking and failover.
The probe parameters set the failover budget. With a 5 s check interval, a 2 s timeout, and a failure threshold of 3 missed probes, a crashed replica leaves rotation 12–17 s after it fails, depending on where the crash falls between probes. Every request routed to it in that window fails or waits for a client retry. Shortening the interval or lowering the threshold speeds failover but raises the false-positive rate, marking healthy replicas unhealthy during transient stalls and removing capacity exactly when load is high. A success threshold of 2 clean probes applies the same caution in reverse, holding a recovered replica out of rotation until it has proved stable.
Session affinity and stateful failover
For stateful serving, session affinity routes all requests within a session to the same replica. Load balancers maintain session-to-replica mapping through sticky sessions implemented with cookies, headers, or IP hashing. Affinity preserves locality but supplies no replacement copy when that replica fails. Checkpointing saves session state periodically, replication copies it to a standby, and external systems such as Redis or Memcached move it outside the model worker. The external store still needs its own availability and durability contract. Accepting state loss is valid only when the service can reconstruct derived state from retained history or explicitly begin a reduced-context session. Which option fits a workload depends on state size, update frequency, and the quality impact of state loss, as table 13 summarizes across the four common approaches:
| Approach | Recovery latency | State guarantee | Operational complexity |
|---|---|---|---|
| State loss | Fast | None | Low |
| Checkpointing | Medium | Consistent snapshot; later updates may be lost | Medium |
| Synchronous replication | Fast | Strong | High |
| Distributed state | Fast | Configurable | Medium |
7.11.4 Model-specific serving fault tolerance
Model-specific serving differences follow from what state is expensive to lose and how quickly the user needs a response. The policy question is therefore a state-loss budget: which state can be rebuilt, which state must be replicated, and which state may be degraded temporarily without violating the product contract. Each of the three common serving regimes answers it differently, and that answer sets both its fault-tolerance policy and its degradation path (table 14).
| Serving workload | State expensive to lose | Fault-tolerance policy | Degradation path |
|---|---|---|---|
| LLM conversation | KV cache, conversation context, prefix state | Replicate or checkpoint high-value session state; regenerate only when the latency budget allows. | Rebuild from transcript, reuse cached prefixes, or ask for retry. |
| Recommendation | Fresh user features, item features, embeddings | Replicate feature stores, cache hot features, and monitor freshness as a reliability signal. | Serve stale or default features with measured quality loss. |
| Vision service | Preprocessing state, device health, edge input | Retry stateless requests on healthy replicas and fail closed on preprocessing or accelerator-health faults. | Use a smaller local model, defer prediction, or return low confidence. |
The KV cache19 can be substantial (gigabytes for long contexts across attention layers). Losing it requires recomputing attention state from the retained token history, which can take seconds to minutes; previously delivered text need not be generated again. During an in-flight response, recovery must also know which output tokens the client has already received so a retry does not silently duplicate or replace part of the response.
19 KV cache: Stores key and value projections for all previous tokens across all attention layers, with a per-token size derived in The KV cache wall and memory capacity. For a Llama-family 70B model at its 128K context in BF16, the KV cache is about 43 GB per conversation. Reconstruction can exceed serving latency service level agreements (SLAs) even when a replacement replica is already available.
A retried image loses nothing; a lost conversation loses 43 GB of KV cache.
LLM serving choices trade KV-cache recovery latency against memory and storage overhead. The simplest strategy is to accept regeneration cost by rebuilding KV cache from conversation history after failure, but this can turn a long conversation into a multi-second or multi-minute restart. KV-cache checkpointing saves live state periodically and bounds the amount of regeneration, while KV-cache replication keeps a standby copy for fast failover at the cost of extra memory. Prefix caching, also offered as prompt caching, reuses state for common system prompts and shared context. A compatible cached prefix can reduce reconstruction work if it survives the failure and remains accessible to the replacement worker. Cache reuse alone does not establish a failover guarantee or preserve the session-specific history.
Recommendation serving protects freshness rather than conversational continuity. Recommendations depend on user and item features from feature stores, so feature-store unavailability can either degrade ranking quality or block recommendations entirely. The serving decision is the staleness budget: replicated feature stores keep recent features available across zones, local caches cover hot features, fallback to stale features accepts measured quality loss, and default features let the service return a lower-quality result when lookup fails. Real-time features such as recent user actions make freshness monitoring part of fault tolerance, because a pipeline that keeps serving old features is available operationally but wrong semantically. Large embedding tables may also sit behind dedicated embedding services, which need their own replication and failover plan.
Vision serving is usually closer to the stateless end of the spectrum because each image or frame can be retried on another replica. That simplicity changes where the checks belong. Thermal throttling threatens latency, while uncorrected memory errors threaten numerical validity; health policy must distinguish those consequences. Preprocessing checks must also prevent invalid resize, crop, color conversion, or normalization from producing apparently valid predictions. At the edge, disconnection can require a validated smaller local model, delayed nonurgent work, or abstention when the available computation cannot meet the prediction contract.
When redundancy cannot preserve full service, the remaining choice depends on the application contract. A validated reduced-capability response can preserve useful availability; if no such response is acceptable, the system must reject or defer the work. Graceful degradation makes the permitted reduction explicit before failure occurs.
Self-Check: Question
A single inference serving replica provides an availability of \(99\%\) (\(A_{\text{single}} = 0.99\), corresponding to 3.65 days of downtime per year). What is the theoretical annual downtime when deploying 3 independent replicas in an active-active parallel configuration (\(A_{\text{system}} = 1 - (1 - A_{\text{single}})^3\)), and why is real-world availability typically lower?
- Annual downtime is 52.6 minutes; real-world availability is lower because load balancers introduce \(10\%\) packet loss.
- Annual downtime is 3.65 days; real-world availability is unchanged because adding replicas does not change individual failure rates.
- Annual downtime is 0 seconds; three replicas provide mathematically absolute fault tolerance under all operating conditions.
- Annual downtime drops to approximately 31.5 seconds (\(99.9999\%\) availability); real-world availability is lower because correlated failures (shared power, top-of-rack switches, DNS, software bugs) violate the independence assumption.
Explain why losing the key-value (KV) cache of an active 128K-token conversation during a GPU failure in stateful LLM serving severely degrades user latency, and describe how prefix caching mitigates this impact.
What is the primary operational trade-off between Active-Active and Active-Passive replication strategies in ML inference serving clusters?
- Active-Active replication requires \(100\%\) manual failover by human operators, whereas Active-Passive replication is fully automated.
- Active-Active distributes traffic across all live replicas to maximize resource utilization but requires reserve headroom to absorb traffic when a replica fails; Active-Passive maintains synchronized standby replicas that sit idle during normal operation, simplifying failover at higher resource cost.
- Active-Active replication can only be deployed on CPU clusters, whereas Active-Passive replication is exclusive to GPUs.
- Active-Active replication guarantees zero latency during network partitions, whereas Active-Passive replication triples inference compute requirements.
In stateless model serving (such as single-image classification), a crashed GPU replica requires complex distributed state synchronization and session rollback before a client’s request can be retried on another node.
After a serving replica suffers a GPU fault, what dependencies must hold before requests can safely use alternate replicas, and which recovery work can proceed concurrently?
Compare session affinity with external distributed state stores (such as Redis) for managing stateful conversational inference sessions in terms of failover speed and infrastructure complexity.
7.12 Graceful Degradation
During a major regional network outage, an e-commerce site suddenly loses access to its heavy, GPU-accelerated recommendation cluster. Rather than showing users empty pages or crashing, the site instantly switches to serving precomputed, generic popular items. The serving fault tolerance mechanisms developed in section 7.11 aim to maintain full service, but graceful degradation dictates what happens when those defenses are overwhelmed.
Definition 7.3: Graceful degradation
Graceful degradation is a fault tolerance strategy in which a system responds to resource exhaustion or component failure by deliberately reducing service quality (falling back to a smaller model, serving cached results, or returning partial outputs) rather than failing completely, maintaining measurable availability at reduced capability.
- Significance: Graceful degradation converts total outage risk into a controlled quality reduction. A recommendation system can fall back from a large ranker to a collaborative-filtering model on GPU failure, maintaining request availability with a quality penalty that must be measured for that workload. The engineering calculation includes both the requests served and the utility lost during fallback.
- Distinction: Unlike complete system failure (where the service returns errors to all requests), graceful degradation provides a managed transition through a predefined capability hierarchy in which each fallback level has known accuracy, latency, and resource characteristics that allow the system to continue satisfying SLOs at reduced quality.
- Common pitfall: A frequent misconception is that degradation is automatic in well-designed systems. Graceful degradation requires explicit preengineering: fallback models must be preloaded or precomputed, switchover logic must detect the failure condition and trigger the transition without human intervention, and each degradation level must have been validated to actually satisfy its reduced SLO before it is needed in production.
7.12.1 Degradation dimensions
A degradation plan must name which service property will be sacrificed before an incident begins. The main levers in table 15 form a pre-incident design checklist, not an outage-time brainstorming aid. Each sacrificed property needs a measured quality budget, an activation condition, and a recovery path before the failure occurs.
| Dimension | What the system sacrifices | Typical fallback |
|---|---|---|
| Quality | Model accuracy or ranking quality | Use a simpler model, such as a collaborative-filtering fallback for a multi-tower recommender. |
| Latency | Response speed | Batch more requests together to preserve throughput and model quality under high load. |
| Coverage | Result completeness | Return top-10 search results instead of top-100. |
| Freshness | Recency of computed results | Serve cached or stale candidates, such as hour-old news recommendations during an outage. |
| Feature completeness | Input richness | Use content features when user history or real-time context is unavailable. |
These dimensions are not interchangeable. A search product may sacrifice coverage by returning fewer results while keeping freshness intact; a recommender may sacrifice freshness by serving cached candidates while preserving latency; and an interactive assistant may sacrifice quality by using a smaller model while keeping the session alive. The correct fallback is therefore workload-specific. It follows the property whose temporary loss least harms the application and whose recovery path can be validated before the incident.
7.12.2 Graceful degradation strategies
The dimensions in table 15 become operational only when the service binds each sacrificed property to a specific fallback mechanism. The strategy ladder starts with model fallback when the primary inference path is too expensive or unavailable, then moves to feature fallback when input quality degrades, and finally to load shedding when demand exceeds capacity and the system must preserve the highest-value requests first.
Model fallback
Model fallback turns quality into an explicit availability lever by maintaining multiple model versions with different resource requirements. The primary model provides full capability at the highest resource cost, a secondary model reduces capability and resource demand, a tertiary model preserves minimal capability, and a static fallback serves precomputed defaults with no inference at all. When the primary path is unavailable or overloaded, the policy descends only as far as resource pressure requires, then returns upward after the primary path is healthy again.
An image classification cascade makes the trade-off concrete. The primary path might run a ViT-Large model with 307 million parameters and 88 percent ImageNet top-1 accuracy, fall back to EfficientNet-B4 with 19 million parameters and 83 percent accuracy under pressure, then fall back again to MobileNet-V3-Large with 5.4 million parameters and 75 percent accuracy when only minimal classification remains affordable. If even that path cannot meet the SLO, the service can return cached labels, a coarse category, or “classification unavailable” rather than blocking the request indefinitely. For that ladder to be real rather than aspirational, the production system must keep multiple models deployed, route requests to the appropriate level, monitor fallback frequency, and measure the quality impact of each level.
Recommendation and ranking systems use the same pattern when a complex deep learning model falls back to a top-n popularity list, a linear ranker, or a cached response during primary serving failures. Complex models often fight for the last mile of accuracy while simple heuristics provide the bulk of the utility, so the fallback path must be monitored as a first-class quality signal rather than treated as a silent failover. Otherwise the product appears healthy while quality is silently traded for availability.
Feature fallback
Feature fallback controls how much input quality the model may lose before the request must be blocked. When feature retrieval fails, validated population-level defaults or cached values can substitute for missing user or item features. A recommender might use genre-level item defaults for missing item attributes or the most recent cached value of a real-time signal. The model must have been trained or evaluated with those missing-feature semantics; an average embedding or a vector from another encoder is not automatically a compatible input. Approximate features are useful only when their representation and measured prediction quality satisfy the fallback contract.
The key design step is prioritizing features by their measured contribution to prediction quality. In a four-level policy, critical features block the request, important features use defaults, useful features use cached values, and optional features can be omitted (table 16). The table’s quality-loss ranges are example policy budgets, not transferable properties of those feature categories; deployment requires measurements showing that each permitted fallback meets its budget, and when feature degradation alone is insufficient to maintain system stability under extreme load, the serving infrastructure must begin actively dropping requests.
| Tier | Example features | Missing action | Quality impact |
|---|---|---|---|
| Critical | User ID, Item ID | Block request | Cannot serve |
| Important | User history, Item attributes | Use defaults | 5–10% quality loss |
| Useful | Real-time context | Use cached | 2–5% quality loss |
| Optional | Secondary signals | Omit | \(< 2\%\) quality loss |
Load shedding
Load shedding protects the system by sacrificing selected requests before overload spreads to every request. Random shedding is the simplest policy: drop a fraction of incoming requests and preserve enough capacity for the rest. Its weakness is that it treats all requests as equally valuable. Priority-based shedding turns quality-of-service degradation into an explicit policy by serving premium users before free users, revenue-generating requests before analytics requests, and interactive traffic before background batch work. The system is still degrading, but it is degrading according to a predeclared service contract rather than whichever queue happens to fill first.
Admission control applies the same idea at system entry points. It rejects requests that would exceed capacity rather than accepting work that will degrade every request already in the system. Circuit breakers extend the same protection to individual dependencies by failing fast when a model replica, feature store, or supporting service is unhealthy, so that one failing dependency cannot exhaust connection pools across the fleet; Circuit breakers and backpressure develops their states and the backpressure signals that accompany them.
Graceful degradation implementation
Implementation begins by turning the degradation ladder into a control loop. Tail-latency percentiles reveal delayed responses, dependency-specific error rates locate failed calls, resource utilization exposes pressure, and growing queues indicate a mismatch between arrivals and completions. These signals support entry and exit conditions for each degradation level: a trigger can justify load shedding before diagnosis is complete, even though the signal alone does not establish the underlying cause. Degradation triggers define conditions that activate degradation; three common triggers watch tail latency, error rate, and feature store health, and each one activates its own fallback mechanism (listing 1).
# Monitor tail latency for user-facing impact
if p99_latency > threshold:
    activate_model_fallback()  # Switch to faster, simpler model

# Track error rates to detect downstream failures
if error_rate > threshold:
    activate_circuit_breaker()  # Fail fast, prevent cascade

# Feature store slowdowns degrade recommendation quality
if feature_store_latency > threshold:
    activate_feature_fallback()  # Use cached/default features
Degradation should increase progressively as conditions worsen rather than switch at one cliff. The system can raise the fallback percentage gradually as load increases, then require sustained improvement before traffic returns to higher-capability paths. Hysteresis prevents oscillation between primary and fallback modes when the service hovers near a threshold.
7.12.3 Degradation monitoring and alerting
Because graceful degradation trades quality for availability, monitoring must make that trade visible rather than letting the system appear healthy while serving lower-fidelity results. The monitoring surface must expose how much service quality has been traded away. Table 17 turns that surface into an action map: fallback share reveals how often model quality was reduced, default-feature share reveals input-quality loss, drop rate reveals capacity protection, and the primary-vs-fallback quality gap reveals whether the degraded path remains acceptable. Its escalation thresholds illustrate one policy; the service’s permitted degradation duration and quality loss must determine the deployed thresholds.
| Signal | Quality trade exposed | Escalation rule | Postincident question |
|---|---|---|---|
| Fallback-model request share | Model capability reduced to preserve serving | Sustained activation beyond 5 minutes becomes a warning. | Did the fallback preserve enough user value? |
| Default-feature request share | Input richness reduced because dependencies lag | Severe degradation affecting over 50% of requests becomes critical. | Which feature dependency needs replication or caching? |
| Load-shed request rate | Coverage reduced to protect the service | Any growth after the circuit breaker opens triggers capacity investigation. | Was admission control early enough to prevent cascade? |
| Primary-vs-fallback quality gap | Product quality lost during the incident | Degradation beyond 1 hour escalates even when availability metrics look healthy. | Is the fallback path still a valid product experience? |
After the event, postincident analysis should identify the root cause, evaluate fallback effectiveness, measure user and business impact, and define improvements that prevent recurrence. Implementing these fallback mechanisms safely requires deep visibility into the system’s runtime state. When a complex recommendation pipeline begins degrading, operators must rapidly determine which microservice is failing, and that diagnosis depends on distributed debugging and observability.
Self-Check: Question
A serving system under overload must drop some requests. Why does priority-based load shedding generally serve the product better than random shedding?
- Random shedding drops more total requests than priority-based shedding at the same load.
- Priority-based shedding eliminates the need for admission control at the system entry point.
- Random shedding treats every request as equally valuable, while priority-based shedding degrades according to a predeclared contract, serving interactive and revenue-generating requests before background or analytics work.
- Priority-based shedding guarantees that no request misses its latency target during overload.
Explain the four-tier feature degradation strategy (Critical, Important, Useful, Optional) and describe how it maintains service availability when feature store dependencies degrade.
An image classification service deploys a model cascade: ViT-Large (307M params, primary, 88% acc), EfficientNet-B4 (19M params, secondary, 83% acc), and MobileNet-V3 (5.4M params, tertiary, 75% acc). How should the serving tier execute model fallback during severe traffic spikes or partial accelerator outages?
- It dynamically routes incoming requests to lighter secondary and tertiary models based on queue depth and p99 latency triggers with hysteresis, maintaining low latency and high availability at measured accuracy cost.
- It executes all three models simultaneously on every request and votes on the majority class.
- It drops all incoming traffic until additional ViT-Large GPU replicas finish provisioning.
- It converts the ViT-Large model into a text-only classifier to save memory.
Graceful degradation is an automatic emergent property of standard microservice architectures that requires no explicit pre-engineering or offline fallback validation.
The fault-tolerance strategy of selectively dropping lower-priority background requests during severe load spikes to protect latency SLAs for high-priority interactive requests is known as load ____.
7.13 Distributed Debugging and Observability
At 2:00 AM, latency on the flagship generative API spikes from 200 ms to 5 seconds, but CPU, memory, and network metrics all look normal. The latency breach can justify immediate mitigation under a predefined policy; choosing a targeted repair requires locating the stalled work across hundreds of microservices. Distributed debugging and observability provide the diagnostic capability required to locate these invisible bottlenecks.
7.13.1 Diagnostic challenges in distributed ML systems
Distributed ML debugging is hard because the evidence needed for recovery is split across timing, state, scale, and model behavior. Nondeterminism enters from multiple directions: network timing variations change execution order, thread scheduling differences alter race conditions, GPU kernel execution order varies across runs, and floating-point operation ordering changes numerical results. Consequently, a bug that manifests on one execution may not reproduce on subsequent runs, creating “Heisenbugs”20 that appear to vanish when observed.
20 Heisenbug: A pun on Heisenberg’s uncertainty principle, popularized in Gray (1986)’s analysis of why production systems fail. Instrumentation perturbs timing, so observing the bug changes it. In distributed ML training, inserting gradient logging alters collective timing and can mask the very race that caused the silent corruption.
Gray, Jim. 1986. “Why Do Computers Stop and What Can Be Done about It?” Proceedings of the 5th Symposium on Reliability in Distributed Software and Database Systems, 3–12.
Partial failures turn that nondeterminism into a recovery problem. A single machine can also suffer partial failures, but distribution adds independently progressing workers and communication paths: one component can stop while others continue, leaving peers uncertain whether it has failed or become unreachable. Scale then removes manual inspection as a viable debugging method. With thousands of components, automated tools must filter massive telemetry streams and identify the few signals that explain the incident. ML systems add model behavior to the same diagnostic problem because silent accuracy degradation produces wrong results without errors, numerical issues like NaN and infinity propagate through computation, data-dependent bugs manifest only for specific inputs, and learning causes expected behavior changes that can resemble bugs.
7.13.2 Observability pillars
Observability supports both immediate mitigation and investigation of the cause. Suppose a recommendation service suddenly violates its latency SLO while the model replicas still report healthy GPU utilization. Metrics establish the timing and scope of the symptom, traces show which service span consumes the request budget, and logs record events inside that service. Figure 18 connects these streams to operational decisions. A single signal can justify an action, such as shedding load when a queue exceeds its budget. Joining request and trace context with model versions, deployment tags, and time windows strengthens the diagnosis when several causes could explain the same symptom. Correlated evidence narrows those possibilities; it does not by itself prove the physical or software cause.
↪ How metrics, logs, and traces become a fleet-wide observability architecture that routes evidence across many models and owners is developed in Observability architecture.
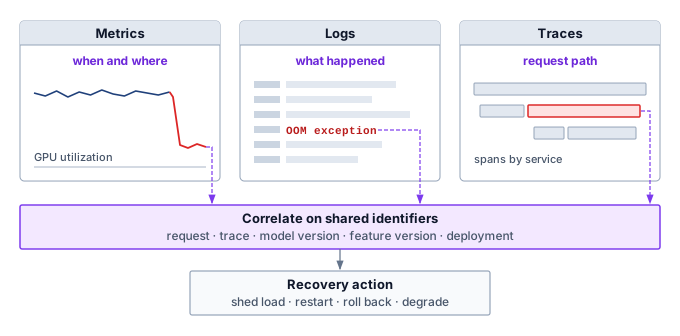
Metrics are the first evidence because they compress fleet behavior into time series that can trigger action. A metric stream becomes fault-tolerance infrastructure only when an alert maps to a recovery decision. High p99 latency may trigger load shedding, a falling cache hit rate may trigger fallback features, and a sudden prediction-distribution shift may block a rollout before it corrupts user-facing decisions.
Logs provide the event context that a metric intentionally discards. Structured logging uses formats such as JavaScript Object Notation (JSON) with consistent fields, so incident tooling can search by service, request, model version, GPU, feature store, or trace identifier. A GPU memory allocation failure logged this way records both the local failure context and the trace identifiers needed to connect the event to distributed metrics and spans (listing 2).
{
  "timestamp": "2024-01-15T10:23:45.123Z",
  "level": "ERROR",
  "service": "inference-server",
  "trace_id": "abc123",
  "span_id": "def456",
  "message": "GPU memory allocation failed",
  "gpu_id": 3,
  "requested_bytes": 4294967296,
  "available_bytes": 2147483648
}
For fault tolerance, the important logging property is consistent correlation rather than the particular backend. Log levels should map incidents to escalation consistently across components, but the recovery system depends more on whether operators can query events by the same request, trace, model version, feature version, and deployment identifiers that appear in metrics and spans. Log aggregation is therefore useful because it preserves the join between local failure context and fleet-wide symptoms.
Traces show where latency or failure propagated across distributed components. A trace is the end-to-end journey of a request, a span is one operation within that journey, and context propagation carries the trace identity across service boundaries. A trace through an ML inference pipeline illustrates how these spans compose:
Trace: user-request-12345
|-- Span: api-gateway (5 ms)
|   `-- Span: auth-service (2 ms)
|-- Span: feature-service (15 ms)
|   |-- Span: user-feature-lookup (8 ms)
|   `-- Span: item-feature-lookup (12 ms)
|-- Span: inference-service (45 ms)
|   |-- Span: preprocessing (3 ms)
|   |-- Span: model-inference (40 ms)
|   `-- Span: postprocessing (2 ms)
`-- Span: response-formatting (1 ms)
Total: 66 ms
Standard distributed tracing APIs such as OpenTelemetry carry this context across services, and a tracing backend stores and visualizes the traces. The durable requirement is not the particular backend but enough preserved context to answer whether the fault lives in request routing, feature retrieval, model execution, postprocessing, or a dependency outside the model service.
7.13.3 ML-specific debugging
Operational signals alone are not enough when a process stays healthy while its tensors, inputs, or per-rank execution times drift outside the model’s contract. ML systems therefore add specialized debugging across three surfaces: numerical health inside the computation, semantic validity across the data pipeline, and straggler attribution across distributed stages.
Numerical debugging
Numerical debugging targets failures where tensors remain valid objects but contain invalid values. NaN detection21 exposes values that can propagate through later arithmetic without a process crash. A minimal diagnostic check only flags the invalid output (listing 3), so the caller must act on the result and block its publication.
21 NaN propagation: Many IEEE 754 arithmetic operations propagate a NaN operand, so an invalid gradient can contaminate dependent updates without stopping the process. The affected scope depends on the computation’s data dependencies. Zero divided by zero and the logarithm of a negative real value produce NaNs; division of a nonzero finite value by zero or floating-point overflow can instead produce infinity, which may cause a later invalid operation. Checking only for a process crash therefore misses numerical failures.
# Check tensor for NaN values
# (propagate from any corrupted computation)
if torch.isnan(output).any():
    log.error("NaN detected in output", request_id=request_id)
    # Caller must retain a replayable input reference and block or replace this output
During training, per-step gradient statistics expose numerical faults before they corrupt the entire run: tracking the global gradient norm catches sudden explosion or vanishing, histogramming the gradient distribution flags outlier spikes, and logging layer-wise gradient norms isolates which block in the network first destabilized. Mixed-precision training22 can introduce related numerical issues when narrow dynamic range interacts with unstable updates. A dynamic loss scaler reduces its scale after detecting nonfinite gradients, indicating overflow or another invalid operation rather than proving underflow. Gradient magnitudes, skipped updates, and comparison with a higher-precision replay help distinguish range problems from other causes; ordinary FP16 rounding differences are not themselves faults.
22 Mixed-precision numerical issues: FP16’s exponent range is far narrower than FP32’s or BF16’s, which is why mixed-precision training scales the loss before backpropagation and dynamic scaling skips nonfinite updates. The formats and the mixed-precision recipe are recapped in Numeric Precision and Training Memory.
Data debugging and validation
Data bugs surface as valid-looking but wrong inputs, so debugging must verify semantic correctness at each pipeline boundary in addition to numerical validity. Validation checks expected format, shape, value ranges, required fields, and encoding before data reaches the model, catching malformed examples while the failure is still local to the input path. Once the input passes those static checks, the system needs evidence about behavior over time: distribution monitors track feature drift, null-rate changes, and outliers as they emerge, while transformation instrumentation logs intermediate shapes and statistics so teams can compare each stage against known-good data. Together, these signals separate a corrupted input path from a numerical failure inside the model.
↪ The validation gates and response policies that run these data checks continuously across a production fleet are developed in Data quality operations.
Straggler detection and analysis
Perspective 7.6 treated a straggler as a slow training rank that holds up a synchronous step. The same idea extends to serving once “peer” means any component on a request’s path, so straggler diagnosis there asks which replica or service stage is slow enough to become a failure-equivalent bottleneck. A slow serving replica delays requests routed to it and can trigger retries under load; its effect on the service’s tail percentile depends on its traffic share and the routing policy. A request that waits for several required parallel branches is instead bounded by the last required completion. Operation-level timing instrumentation measures time for each operation, enabling latency attribution across pipeline stages. Wrapping each operation in a context manager that emits per-span timing metrics makes performance directly comparable across replicas (listing 4).
# Wrap operations in timing context managers for latency attribution
with timer("feature_lookup"):
    features = feature_store.lookup(
        ids
    )  # Often the latency bottleneck
with timer("model_inference"):
    predictions = model(features)  # Host submission time for asynchronous GPU work
For asynchronous GPU execution, the host span above measures submission time, not completed device work; GPU elapsed time comes from device events recorded around the relevant stream and read only after they complete. Like-for-like component timing is then compared across replicas with percentile analysis: p50 shows typical performance, while p99 shows tail latency, and comparing p99 across replicas identifies workers whose slow path has become a fleet-wide bottleneck. The diagnosis must then separate the causes that share this slow-worker symptom, which include the gray-failure causes of section 7.9.5 and data skew, in which some inputs are simply slower to process.
7.13.4 Serving failure patterns
Serving failures require a symptom-to-action mapping under much tighter latency constraints than the training-loss signatures of section 7.9.1. Common serving symptoms differ both in what each one reveals and in what the serving system must do first (table 18). Cascade failures are hardest to diagnose because the root cause is obscured by the symptoms it generates, so the example that follows traces how metrics, logs, and traces work together to isolate a cascade’s origin; whether detectors and recovery paths will hold under fire is a separate question that requires causing failures on purpose.
| Symptom | Likely interpretation | Immediate response |
|---|---|---|
| Latency spikes | Resource contention, garbage collection, cold caches, or model reloads | Check placement and capacity; repeated spikes usually mean the problem is no longer transient. |
| Rising error rates | Dependency failure, data-format change, or model bug | Investigate immediately because errors compound across dependent services. |
| Silent quality degradation | Model drift, feature degradation, or data-pipeline fault | Use quality monitoring beyond standard operational metrics. |
| Cascade failure | Timeout exhaustion, resource depletion, or error propagation from one failing component | Trip circuit breakers and preserve isolation boundaries before the failure spreads. |
Example 7.1: Diagnosing a cascade failure
Scenario: A recommendation system experiences sudden latency spikes.
Diagnosis: The three observability pillars narrow the failure path. Metrics reveal the symptom: p99 latency jumped from 45 ms to 800 ms at 14:32, with error rate increasing from 0.1 percent to 15 percent. Traces locate the delay in the feature-service span, which consumes 700 ms instead of the normal 12 ms, while model inference remains at 40 ms. Logs show repeated connection timeouts to the user embedding cache at 14:31, followed by requests bypassing the cache and reaching the embedding database directly. That evidence identifies cache unavailability and increased downstream demand; it does not yet distinguish a failed cache process from a network or resource problem.
Systems lesson: Cache unavailability can transfer enough demand to overwhelm the embedding database. A circuit breaker and a validated default-embedding path can limit that cascade while diagnosis continues. The fallback must also respect the quality budget and avoid sending the rejected demand to another saturated dependency.
Self-Check: Question
Explain why Heisenbugs are particularly pervasive and challenging to diagnose in distributed collective communication (e.g., NCCL AllReduce) libraries.
In a production ML recommendation service, p99 latency suddenly jumps from 45 ms to 800 ms with a 15% error rate. How do the three pillars of observability (Metrics, Traces, Logs) work together to diagnose the root cause?
- Metrics reveal that GPU utilization is 100%; Traces show that all requests are identical; Logs show that user passwords were typed incorrectly.
- Metrics reveal the exact timing and scope of the latency spike; distributed Traces isolate the feature-service span consuming 700 ms (instead of normal 12 ms); structured Logs reveal repeated connection timeouts to the embedding cache followed by a database miss storm.
- Traces generate automatic pull requests to fix the bug; Metrics execute the rollback; Logs alert the end users.
- The three pillars cannot be correlated because each uses completely incompatible timestamp formats.
Explain the numerical mechanism of NaN propagation during backward gradient computation in FP16 mixed-precision training, and describe how loss scaling prevents gradient underflow.
In distributed tracing systems utilizing OpenTelemetry, capturing execution time across microservices is sufficient for incident triage without recording structured trace and span correlation identifiers in service logs.
7.14 Fault Injection Tools and Frameworks
An injected failure is useful evidence only when it resembles the production failure the system must survive. A multi-node training cluster that claims to tolerate network partitions should have that connection severed in a staging environment so engineers can observe what the orchestration layer does. Fault injection is the engineering discipline of deliberately perturbing a system to empirically verify that robustness mechanisms work before production traffic discovers the gap. Fault-injection tools for tensors and accelerators cover bit flips, corrupted tensor values, and accelerator-oriented failures (Chen et al. 2020; Tsai et al. 2021; Gräfe et al. 2023), while network partitions, latency injection, dependency termination, and API-response faults belong to chaos and distributed-systems testing practice (Basiri et al. 2016).
Chen, Zitao, Niranjhana Narayanan, Bo Fang, Guanpeng Li, Karthik Pattabiraman, and Nathan DeBardeleben. 2020. “TensorFI: A Flexible Fault Injection Framework for TensorFlow Applications.” 2020 IEEE 31st International Symposium on Software Reliability Engineering (ISSRE), 426–35. https://doi.org/10.1109/issre5003.2020.00047.
Tsai, Timothy, Siva Kumar Sastry Hari, Michael Sullivan, Oreste Villa, and Stephen W. Keckler. 2021. “NVBitFI: Dynamic Fault Injection for GPUs.” 2021 51st Annual IEEE/IFIP International Conference on Dependable Systems and Networks (DSN), 284–91. https://doi.org/10.1109/dsn48987.2021.00041.
Gräfe, Ralf, Qutub Syed Sha, Florian Geissler, and Michael Paulitsch. 2023. “Large-Scale Application of Fault Injection into PyTorch Models -an Extension to PyTorchFI for Validation Efficiency.” 2023 53rd Annual IEEE/IFIP International Conference on Dependable Systems and Networks - Supplemental Volume (DSN-s), 56–62. https://doi.org/10.1109/dsn-s58398.2023.00025.
Sangchoolie, Behrooz, Karthik Pattabiraman, and Johan Karlsson. 2017. “One Bit Is (Not) Enough: An Empirical Study of the Impact of Single and Multiple Bit-Flip Errors.” 2017 47th Annual IEEE/IFIP International Conference on Dependable Systems and Networks (DSN), 97–108. https://doi.org/10.1109/dsn.2017.30.
Mohanram, K., and N. A. Touba. 2003. “Partial Error Masking to Reduce Soft Error Failure Rate in Logic Circuits.” Proceedings. 18th IEEE International Symposium on Defect and Fault Tolerance in VLSI Systems, 433–40. https://doi.org/10.1109/dftvs.2003.1250141.
Ko, Y. 2021. “Characterizing System-Level Masking Effects Against Soft Errors.” Electronics 10 (18): 2286. https://doi.org/10.3390/electronics10182286.
Velazco, Raoul, Gilles Foucard, and Paul Peronnard. 2010. “Combining Results of Accelerated Radiation Tests and Fault Injections to Predict the Error Rate of an Application Implemented in SRAM-Based FPGAs.” IEEE Transactions on Nuclear Science 57 (6): 3500–3505. https://doi.org/10.1109/tns.2010.2087355.
Mahmoud, A., N. Aggarwal, A. Nobbe, J. R. S. Vicarte, S. V. Adve, C. W. Fletcher, I. Frosio, and S. K. S. Hari. 2020. “PyTorchFI: A Runtime Perturbation Tool for DNNs.” 2020 50th Annual IEEE/IFIP International Conference on Dependable Systems and Networks Workshops (DSN-w), 25–31. https://doi.org/10.1109/dsn-w50199.2020.00014.
He, Yi, Prasanna Balaprakash, and Yanjing Li. 2020. “FIdelity: Efficient Resilience Analysis Framework for Deep Learning Accelerators.” 2020 53rd Annual IEEE/ACM International Symposium on Microarchitecture (MICRO), 270–81. https://doi.org/10.1109/micro50266.2020.00033.
An injection experiment is evidence only at the level where it injects. Its fault model names the originating disturbance, such as a transient single-bit upset or a permanent multi-bit defect, and its error model names the corrupted state that results, so results for transient single-bit faults do not establish resilience to permanent multi-bit defects (Sangchoolie et al. 2017). The injection level also decides which masking the experiment includes. Hardware absorbs many physical disturbances before software sees them, in unused units, overwritten values, and dead instructions (Mohanram and Touba 2003; Ko 2021). Hardware-based injection through field-programmable gate array (FPGA) emulation or particle-beam exposure (Velazco et al. 2010) passes through that masking, while software tools such as PyTorchFI (Mahmoud et al. 2020) perturb weights, activations, and gradients directly. They cover many model states quickly, but by skipping the masking they can overstate how often a physical fault corrupts the model. Frameworks such as Fidelity (He et al. 2020) narrow that abstraction gap by mapping hardware faults to the software-visible errors they produce. A tensor mutation still tests how the software responds to a corrupted value; on its own, it does not estimate production vulnerability.
For fleet recovery, the most valuable experiments inject faults at the level where recovery decisions are made. Killing a rank in the middle of a collective or delaying its heartbeat past the timeout exercises the detection layers of section 7.9.1, partitioning a node from the rendezvous service exercises the membership and fencing rules of section 7.9.2, and corrupting one checkpoint shard exercises the manifest check of section 7.8.5.2; each tests one row of table 4. Running these experiments continuously in staging, and in controlled form in production, keeps rarely executed recovery code from decaying between real incidents (Basiri et al. 2016). A recovery path is trustworthy only for the fault model it has been exercised against, which is why the case studies that follow report both the failures production fleets met and the machinery that absorbed them.
Self-Check: Question
Why might a software-based fault injection framework (such as PyTorchFI) overestimate a neural network’s vulnerability to radiation-induced soft errors when compared against physical beam testing on real silicon?
- Software-based tools only inject faults into 8-bit integer quantized models, whereas physical radiation only affects 64-bit floating point registers.
- Physical radiation only damages power delivery networks and never alters logic gate states in operational GPUs.
- Software injection tools can only simulate permanent stuck-at faults and cannot model transient bit flips.
- Software injection mutates high-level tensor variables directly, completely bypassing microarchitectural and circuit-level masking (such as ECC correction, speculative instruction discarding, and dead registers) that absorb soft errors in hardware.
Explain why killing a rank mid-collective, partitioning a node from the rendezvous service, and corrupting one checkpoint shard are more valuable fleet-recovery experiments than tensor bit flips alone.
Software-based fault injection frameworks are universally preferred over FPGA-based injection for production resilience certification because software tools capture register-level gate timing violations and physical alpha-particle strikes with higher fidelity.
Explain how fault-injection frameworks such as Fidelity bridge the abstraction gap between low-level hardware faults and high-level software models.
7.15 Case Studies
Published production systems make the chapter’s scale lesson concrete, with failure detection, state preservation, and observability reappearing as checkpoint overhead, topology reconfiguration, chaos testing, and elastic recovery. Public operational reports from Meta, Google, and Netflix reveal how organizations navigate these trade-offs when operating at fleet scale. The operational numbers are reported magnitudes that reveal the design pressure, not universal constants. Meta’s Open Pre-trained Transformer (OPT-175B) training run on a 992-GPU cluster provides the first example, a run that had to absorb dozens of hardware failures without aborting.
7.15.1 Large-scale LLM training at Meta
The training of the Open Pre-trained Transformer (OPT-175B) at Meta provides a documented study of failure during a large deep-learning job (Zhang et al. 2022). Over two months on 992 NVIDIA A100 GPUs, the team reported at least 35 manual restarts and estimated 70 or more automatic restarts due to hardware failures (ECC memory errors, NCCL and InfiniBand network faults, lost GPUs), alongside the cycling of more than 100 hosts (Zhang et al. 2022; Meta AI Research 2022). Numerical instability created a separate recovery problem. These counts establish repeated interruption, but cycling hosts and restarting jobs are different events; their totals do not directly measure one common MTBF. The recovery design had to preserve progress while distinguishing failed execution resources from suspect optimization state.
During the OPT run, the team monitored progress through train-log freshness checks. The public logbook records a 15-minute modified-file threshold, later relaxed to one hour, as part of restart monitoring (Meta AI Research 2022). For a hang that raised no error, this threshold contributed to \(\FailureDetectionTime\); polling and response delays could extend the wait before restart. The logbook illustrates the trade-off of equation 11 in operational form, since relaxing the threshold reduced sensitivity to delayed logs while allowing longer idle windows.
Recovery procedures also had to account for loss spikes associated with numerical instability. Unlike a fail-stop event, this symptom made recent model state suspect without identifying a failed device. The team combined rollback to an earlier checkpoint with a lower learning rate to recover from divergence (Meta AI Research 2022). The paper separately reports approximately 147 TFLOP/s per A100 (about 47 percent of dense FP16 peak) (Zhang et al. 2022); that execution-rate metric alone does not establish end-to-end useful throughput after interruptions and replay. The enduring lesson is the distinction between recovery paths. A failed device calls for replacement and restoration of valid state, while numerical divergence can require an older checkpoint and a changed optimization policy. Retaining checkpoint history makes that second path possible.
Meta AI Research. 2022. OPT-175B Training Logbook. Companion repository to the OPT-175B model release.
Zhang, Susan, Stephen Roller, Naman Goyal, Mikel Artetxe, Moya Chen, Shuohui Chen, Christopher Dewan, et al. 2022. OPT: Open Pre-Trained Transformer Language Models.
7.15.2 Google TPU pod resilience
Google’s TPUv4 supercomputer combines configurable topology with recovery software. A pod contains 4,096 chips organized as 64 cubes of 64 chips, each arranged in a \(4{\times}4{\times}4\) 3D mesh (Zu et al. 2024). Losing one chip removes \(1/4096\)th of pod capacity, but can interrupt an entire job that requires that participant. The recovery unit therefore exceeds the failed device.
War story 7.1 traced the recovery mechanism, in which the OCS fabric assembles healthy cubes into job-sized slices, reallocating spare cubes after machine outages and routing around unavailable links for supported OCS outage patterns. The published study adds the software that runs that loop, components including libtpunet and healthd for topology setup and health monitoring, together with the operating statistics that show how often it runs: 99.98 percent system availability, with hardware outages affecting approximately 1 percent of training jobs (Zu et al. 2024), and daily failure rates of 0.08 percent of TPU machines, 0.005 percent of ICI cables, and 0.04 percent of OCS units. Small daily fractions still add up across thousands of components, so the control plane absorbs a steady stream of reconfiguration events rather than an occasional emergency. The architectural lesson is to match each failure boundary to a feasible replacement or routing mechanism.
7.15.3 Netflix chaos engineering for serving dependencies
While training resilience focuses on long-running batch jobs, Netflix’s published work on Chaos Engineering (Basiri et al. 2016) provides the serving-side contrast, and it is the production origin of the injection discipline that section 7.14 applied to training. The premise is simple but operationally demanding. Because production systems have many interacting dependencies, teams should validate steady-state behavior by deliberately injecting failures instead of waiting for real incidents to discover whether fallbacks work.
Basiri, A., N. Behnam, R. de Rooij, L. Hochstein, L. Kosewski, J. Reynolds, and C. Rosenthal. 2016. “Chaos Engineering.” IEEE Software 33 (3): 35–41. https://doi.org/10.1109/ms.2016.60.
For ML serving, the same discipline applies to feature stores, model-serving dependencies, caches, and fallback paths. A model endpoint can be healthy while a feature service is slow, stale, or unavailable; if the system lacks a tested fallback, a local dependency problem can become user-visible latency or degraded recommendations. Chaos tests make those assumptions executable by injecting latency, terminating dependencies, or forcing fallback paths in controlled conditions.
The recovery procedure for these injected faults centers on fallback hierarchies. If the primary deep learning model fails or times out, the serving system can switch to a lighter model, cached response, or simple popularity-based default. The systems lesson is that resilience in ML serving is not a static property but a continuous practice of active verification. A fallback path that is never exercised is documentation, not fault tolerance.
Across these production case studies, three architectural patterns recur. First, detection speed belongs in the recovery budget. Meta’s log-freshness threshold and Google’s health monitors determine when recovery can begin, while Netflix’s chaos experiments test detection and fallback for selected dependency failures. Checkpoint age and replication lag separately govern recoverable state. Second, the atomic unit of failure shapes the architecture. Google combines cube replacement with fault-tolerant routing, the OPT run restarted from durable checkpoints and kept their history for numerical rollback, and Netflix validates service-dependency fallbacks. Third, fault tolerance is a spectrum rather than a switch. Exact state recovery trades normal-operation overhead against lost work and recovery time; graceful degradation additionally trades service capability against continued availability. Those distinct trade-offs help identify the misconceptions that follow.
Self-Check: Question
Why does Google’s TPUv4 recovery design combine OCS-based replacement of unhealthy cubes with fault-tolerant routing for supported link-outage patterns?
- Because TPU chips have zero local memory and cannot execute software routing algorithms.
- Because optical circuit switches are cheaper than standard copper Ethernet cables for intra-rack links.
- A machine outage can remove a required job participant, requiring a healthy replacement cube; a link outage can instead require a supported alternate communication path. The response must preserve the job’s communication topology.
- Because OCS switches completely eliminate the need for checkpointing during multi-month training jobs.
During the training of Meta’s OPT-175B model on 992 A100 GPUs, describe how the team addressed both physical hardware failures and mathematical loss spikes.
What fundamental principle of ML serving resilience is demonstrated by Netflix’s chaos engineering practice?
- Resilience is an active practice of continuous verification: intentionally injecting latency, terminating feature caches, and simulating dependency outages under controlled conditions to empirically verify that fallback hierarchies function before real outages occur.
- Fault tolerance code should only be executed during unplanned production disasters to minimize server load.
- Machine learning models should never rely on external feature stores or databases.
- Chaos testing is only applicable to CPU-based web servers and cannot be used in GPU inference clusters.
Google’s TPUv4 study reports daily failure rates of 0.08 percent of TPU machines, 0.005 percent of ICI cables, and 0.04 percent of OCS units. Explain why such small daily fractions still require an automated reconfiguration control plane rather than manual repair.
7.16 Fallacies and Pitfalls
An infrastructure team might spend weeks hardening their storage layer against disk failures, only to have their entire training run destroyed by a subtle software bug in their PyTorch distributed backend. Fault tolerance for distributed ML systems involves counterintuitive mathematics and subtle trade-offs where conventional data center wisdom often fails; recognizing the fallacies and pitfalls below prevents engineers from optimizing for the wrong failure modes before the chapter closes with a synthesis of its core quantitative rules.
Fallacy: Hardware failures are the main concern.
This intuition comes from traditional systems where disk failures, power outages, and network partitions dominate, whereas in ML systems hardware failures are only one part of a broader incident mix. Long-lived, stateful ML jobs expose failure paths that hardware redundancy cannot cover: a malformed checkpoint path can make recovery impossible, a mismatched collective library can hang all ranks, an undersized shared-memory limit can crash data loaders, and a stale feature schema can silently corrupt training. Their relative frequency depends on the deployment, but even an infrequent software or configuration fault can destroy the same multi-day job that hardware redundancy was meant to protect. Investing heavily in hardware redundancy while neglecting software robustness (input validation, gradual rollouts, configuration management) leaves many important failure modes unaddressed, which is why the most reliable ML systems treat software bugs as inevitable and design defensively.
Pitfall: Setting checkpoint interval by intuition.
Organizations commonly set checkpoint intervals based on “feels right”: “every hour seems reasonable” or “every 1,000 steps.” The Young-Daly formula reveals these intuitions are often wrong. For the 1,000-GPU cluster of table 1, whose GPU-only MTBF is 50 hours, with a checkpoint write time of 5 minutes:
\[T^\ast_{\text{ckpt}} = \sqrt{2 \times 5 \times 3000} = \sqrt{30000} \approx 173 \text{ minutes}\]
The intuitive “every hour” checkpoints nearly three times more often than the expected-waste optimum. It reduces potential lost work, but the added write overhead outweighs that benefit under this model. A tighter RPO can still justify the shorter interval. The same hourly policy was too infrequent in the Young-Daly notebook, and both verdicts follow from one rule. The optimum scales as \(\sqrt{\CheckpointWriteTime \cdot \SystemMtbf}\), so an hour is too long when a 24.5 s write meets a full-system MTBF of 3.87 hours, yet too short when a 5-minute write meets a GPU-only MTBF of 50 hours. If checkpoint time increases to 15 minutes (larger model, slower storage), the optimal interval stretches to 300 minutes, further still from the “every 15 minutes” that some teams adopt to “stay safe.” The decision must balance expected waste with the recovery contract rather than treat either interval as universally correct.
Fallacy: Component MTTF values predict individual failure timing.
Engineers read a GPU MTTF of 50,000 hours and plan around a five-year replacement cadence per device. MTTF is a population mean, not a lifetime assigned to each component. A GPU with MTTF 50,000 hours might fail at 200 hours or last 100,000 hours. Under the chapter’s independent constant-rate model, a fleet of 10,000 GPUs has an aggregate rate of approximately \(10{,}000/50{,}000 = 0.2\) failures per hour, or roughly one failure every 5 hours. This planning model helps size recovery capacity and spare pools. It does not make device-health monitoring pointless: temperature, error history, and recurring anomalies provide condition-specific evidence that the population mean alone lacks.
Pitfall: Using MTBF calculations as if failures were independent.
The reliability equation \(\SystemMtbf = \ComponentMttf/\RequiredComponentCount\) assumes component failures are statistically independent, while production failures correlate through the shared power, switches, software, and cooling of section 7.3.4.
Correlated failures change two quantities that the simple MTBF equation hides: incident frequency and blast radius. A cluster with 1,000 independent GPUs each with 50,000-hour MTTF has a first-GPU-failure MTBF of 50 hours. If a shared power, cooling, or software hazard adds an incident rate 10 times larger than that independent first-failure rate, the effective incident MTBF drops to about 5 hours. Separately, a correlated incident may take out 10 GPUs at once, increasing recovery cost even if the independent GPU failure rate itself has not changed. Reliability engineering must identify and mitigate correlation through diversity: different power feeds, different network paths, different software versions in canary deployments.
Fallacy: Every failure should be handled as a full restart.
Engineers often treat all failures as “node crashed, restart from checkpoint,” but different failure modes require different responses. Transient stalls such as network congestion can permit a bounded wait or safe retry when state and the communication group remain valid; a brief fault can still require recovery if it corrupts state or leaves the group unusable. Permanent device loss requires replacement or a feasible resize, together with restoration of the missing state. Silent corruption requires a trusted recovery point, which may precede the latest checkpoint and therefore motivates checkpoint history retention. Persistent resource exhaustion (OOM, memory fragmentation) needs reconfiguration before restart; otherwise the job can crash again immediately. As section 7.3 details, misdiagnosing failure type wastes compute. Restarting for a harmless stall discards useful work, while continuing from corrupted state can contaminate later updates.
Pitfall: Assuming checkpoints are consistent without validating state.
Modern frameworks checkpoint transparently, creating the illusion of automatic consistency. In practice, distributed checkpoints require cross-node coordination that can fail subtly across multiple dimensions. Rank desynchronization occurs when workers record different training steps, such as rank 0 snapshotting iteration 1000 while rank 1 captures iteration 1001. Similarly, transient storage failures can cause partial writes that leave behind truncated shards, sharded optimizer state lag leaves optimizer states misaligned with model weights when captured asynchronously, and in-flight gradients from incomplete AllReduce operations can produce ambiguous reduction boundaries. Production systems must therefore implement checkpoint validation: verify all shards exist, verify iteration numbers match, and verify optimizer state matches model state, because organizations that discover corrupted checkpoints during recovery from a failure have no recourse except restarting from a potentially much earlier checkpoint.
Fallacy: Overhead budgets are fixed fractions of training time.
Reference tables that show “pipeline bubble: 10 percent, checkpoint overhead: 5 percent, failure recovery: 3 percent” are easy to read as physical laws and pass through as line items in capacity plans. They are engineering targets, not constants. Pipeline bubble overhead depends on the number of microbatches and the interleaved schedule, as its bubble fraction shows (Pipeline parallelism); elastic recovery can reduce waiting for replacement capacity while still restarting workers and restoring state; checkpoint overhead is a function of model size, storage bandwidth, and whether checkpointing is synchronous or asynchronous. Treating these numbers as fixed percentages leads to passive acceptance of avoidable inefficiency, because each one is set by a design choice.
Pitfall: Using elastic training as a substitute for checkpointing.
Elastic training adjusts parallelism degree when workers fail, but resizing still requires a consistent recovery state. Reducing the active worker count requires redistributing model shards, optimizer states, and data assignments, often through checkpoint reload. Below some minimum viable size, training becomes infeasible because the model no longer fits or the batch policy cannot be maintained; the job must wait for sufficient capacity before restoring. If a failure was caused by a software bug triggered by specific data, the bug persists in remaining workers. Elastic training is complementary to checkpointing, not a replacement. Resizing alone does not justify a lower checkpoint frequency, because the recovery contract, failure rate, and checkpoint cost still determine that choice.
Fallacy: Silent data corruption is negligible because hardware has ECC.
GPUs and memory systems include extensive error correction (ECC, CRC, parity), creating the intuition that silent data corruption is negligible. Large-scale CPU SDC and memory-error studies show that silent corruptions and memory faults still occur at fleet scale and can escape ordinary error reporting (Dixit et al. 2021; Sridharan et al. 2015). ECC and link CRCs remain necessary layers, but they protect stored and transmitted bits rather than arithmetic, so they are not an end-to-end correctness proof for a training run. A 10,000-GPU cluster executes enough arithmetic that even rare per-device corruption becomes an operating condition, which is why it needs the check-and-verify defenses of section 7.5 in addition to hardware protection.
Dixit, H. D., S. Pendharkar, M. Beadon, C. Mason, T. Chakravarthy, B. Muthiah, and S. Sankar. 2021. Silent Data Corruptions at Scale. arXiv preprint arXiv:2102.11245.
Sridharan, V., N. DeBardeleben, S. Blanchard, K. B. Ferreira, J. Stearley, J. Shalf, and S. Gurumurthi. 2015. “Memory Errors in Modern Systems: The Good, the Bad, and the Ugly.” ACM SIGPLAN Notices 50 (4): 297–310. https://doi.org/10.1145/2775054.2694348.
Pitfall: Adding GPUs without accounting for communication and recovery overhead.
Capacity plans typically account for Amdahl’s Law and AllReduce overhead but treat reliability as a fixed background condition. At extreme scale, each additional GPU increases the aggregate failure rate, which inflates the expected recovery and replay time per job. There exists a cluster size beyond which the time lost to failures and recovery exceeds the time saved by additional parallelism, and wall-clock training time increases rather than decreasing with \(\AcceleratorCount\). This is the reliability version of diminishing returns, and it applies on top of the Amdahl ceiling, so the two effects must be modeled together. Whole-run useful goodput must count only retained progress and include recovery time in the denominator, and its reliability penalty generally grows with \(\AcceleratorCount\) under the independent-failure model. The three goodput factors composes that runtime loss with the scheduling and program losses without counting any of them twice.
Self-Check: Question
An engineering team operates a 1,000-GPU training cluster with a system MTBF of 50 hours (\(3{,}000\text{ minutes}\)) and a checkpoint write time of 5 minutes. The team intuitively chooses to checkpoint ‘every 15 minutes to stay safe.’ According to the Young-Daly formula, what is the mathematically optimal interval, and what is the consequence of the team’s intuitive choice?
- Optimal interval is 15 minutes; the intuitive choice is mathematically perfect.
- The first-order optimum is approximately 173 minutes (~2.9 hours); writing every 15 minutes adds more checkpoint overhead than it saves in expected rework under this model.
- Optimal interval is 50 hours; checkpointing every 15 minutes causes disk sectors to wear out in days.
- Optimal interval is 1 minute; checkpointing every 15 minutes risks losing 100% of the training dataset.
Explain what a GPU-only independent-failure estimate, \(\mathrm{MTBF}_{\mathrm{system}}=\mathrm{MTBF}_{\mathrm{component}}/N\), omits about shared failure domains and their recovery consequences.
Why does adding more GPUs (\(N\)) to a distributed training job eventually encounter a ‘reliability ceiling’ where total wall-clock training time increases rather than decreases?
- Because GPUs consume more electrical power than data center transformers can supply.
- Because floating-point numbers lose precision when divided across more than 1,000 workers.
- Because the Python interpreter cannot spawn more than 512 concurrent threads.
- Because aggregate cluster failure rate scales linearly (\(N\lambda\)), shrinking system MTBF until the cumulative time lost to failure detection, job restarts, checkpoint loading, and rework exceeds the marginal compute speedup of additional parallelism.
Because modern accelerator hardware incorporates hardware ECC on High Bandwidth Memory and CRC on interconnects, application-level gradient checksums and loss validation checks are redundant and unnecessary in 10,000-GPU clusters.
7.17 Summary
Fault tolerance turns the statistical expectation of hardware failure into a manageable operational routine. Individual component reliability compounds across thousands of devices, driving system-level MTBF from years down to hours. At fleet scale, systems must bound lost work and recovery delay through recovery that is automatic, fast, and minimally disruptive to training or serving.
In training, progress is only as safe as the last state the fleet can prove it can restore. Checkpointing bounds lost work, and the Young-Daly interval (equation 7) prices that bound against write cost, shrinking only with the square root of a falling MTBF. RPO and RTO turn the expected-value optimum into a service contract. A manifest published last defines which generation exists, and fencing at the resource boundary decides who may still write to it. The retries that recovery triggers stay safe only when each operation is idempotent, inherits its caller’s deadline, and draws on one shared retry budget, so the response cannot amplify the incident. Elastic recovery then trades capacity for continuity, valid only while the data, batch-size, and optimizer invariants survive the resize.
Serving inverts the budget. Training can spend minutes restoring state that satisfies its optimization contract; an interactive request has milliseconds, so serving buys availability with ready replicas and decides in advance which state it will rebuild, replicate, or abandon. The KV cache is the clearest case, derived state that can be reconstructed from retained history only when the latency budget allows. When neither redundancy nor reconstruction fits that budget, graceful degradation keeps the service useful by sacrificing a named property that was validated before the incident.
Recovery depends on evidence about both the failure and the state being restored. A loss spike can originate in hardware, data, numerical behavior, or synchronization. Suspect state can justify a pause or rollback while investigation continues; attributing the cause to a device requires corroborating telemetry, replay, or integrity evidence. Restore drills and fault injection then test whether the selected response actually preserves valid state and meets its recovery budget. Passing those tests establishes evidence for the exercised fault model, rather than a guarantee against every failure.
Key Takeaways: Failure is normal operation
- Scale makes failure routine: A 10,000-GPU cluster encounters hardware failures every few hours under the chapter’s component-rate assumptions; software must treat failure as a normal state.
- Liveness is not correctness: A gray failure keeps answering heartbeats while every peer waits on it, and silent data corruption passes ECC while feeding wrong gradients into a correct AllReduce, so detection needs progress measurements and check-and-verify evidence beside liveness checks.
- Recovery is a contract: RPO bounds lost progress, RTO bounds recovery delay, MTTR combines with MTBF to determine steady-state availability, a manifest identifies committed state, and fencing prevents an expired worker epoch from writing after replacement.
- Checkpoint cadence balances two costs: Under the first-order assumptions, \(\OptimalCheckpointInterval = \sqrt{2 \cdot \CheckpointWriteTime \cdot \SystemMtbf}\) balances checkpoint write overhead against expected rework; for the 175B running example on a 10,000-GPU cluster it lands near 13.8 min. The selected interval must also meet limits on lost progress; recovery delay needs its own budget.
- Elasticity enables persistence: Designing training jobs to be “elastic” (rebuilding communication groups and rebalancing data shards as traced in figure 16) can reduce waiting for replacement capacity. The runtime must preserve valid state and data coverage, and either preserve batch size or validate the changed optimization policy. Checkpoint cadence still determines how much work must be replayed.
- Serving recovery follows the state budget: Preserve authoritative history, then choose reconstruction, checkpointing, or replication for derived state according to the latency contract (table 13). A ready replacement provides useful service only when it can also recover the context the request needs.
- Degradation is a designed mode: When recovery cannot finish inside the latency budget, a fallback validated in advance (a smaller model, cached results, default features, or shed low-priority load) keeps the service useful, provided monitoring exposes how much quality was traded away.
Fault tolerance makes the cost of coordination a deliberate part of the execution budget. Case 3 on coordination overhead works a complete coordination-bound diagnosis, attributing a large run’s lost wall time to checkpoints, failures, pipeline bubbles, and scheduling. In the Fleet Law (equation 1.3), checkpoint pauses, detection timeouts, and restarts all land in the synchronization term \(\SynchronizationTime(\DeviceCount)\), and in goodput accounting they are runtime losses. The chapter’s mechanisms spend Coordination (\(\OperationalTaxonomyDimension_3\)) so that a failure does not erase completed Compute, and asynchronous checkpointing and warm restart earn their complexity by moving part of that synchronization cost into \(\OverlappedTime\) or shrinking it outright. The useful comparison is between time spent preserving and validating state during normal operation and time lost reconstructing trustworthy execution after a failure. A cheaper recovery mechanism is valuable only when it still meets the workload’s limits on lost progress, response delay, and degraded quality.
What’s Next: From resilience to resource management
Keeping the fleet running despite inevitable hardware failures requires three layers: checkpointing preserves progress, elasticity absorbs node losses, and redundancy protects stateful serving sessions. Each layer also assumed a decision made elsewhere: a spare pool deep enough to replace a drained node, a hot spare held idle, spot capacity that may vanish, and replicas placed across independent failure domains. Those are allocation decisions, made while many jobs compete for the same fleet, from month-long training runs to hour-long experiments. A fault-tolerant cluster therefore still needs orchestration to decide which jobs run where, when to preempt, and how to share capacity fairly among them.
7.18 Self-Check Answers
Self-Check: Answer
A production cluster operates 10,000 GPUs, where each individual GPU exhibits an independent MTTF of 50,000 hours and an availability of 99.99%. What is the resulting GPU-only cluster MTBF, and what is the probability that all 10,000 GPUs are simultaneously operational at any random instant?
- Cluster MTBF is 50 hours; simultaneous cluster availability is approximately 90.5%.
- Cluster MTBF is 500 hours; simultaneous cluster availability is approximately 99.0%.
- Cluster MTBF is 5.0 hours; simultaneous cluster availability is approximately 36.8%.
- Cluster MTBF is 0.5 hours; simultaneous cluster availability is approximately 1.0%.
Answer: The correct answer is C. The cluster MTBF scales inversely with component count: \(\text{MTBF}_{\text{cluster}} = \text{MTBF}_{\text{component}} / N = 50{,}000 / 10{,}000 = 5.0\) hours. The simultaneous availability follows the product of individual reliabilities: \(R_{\text{cluster}} = (0.9999)^{10{,}000} \approx e^{-1} \approx 0.368\) (36.8%). The 50-hour option incorrectly divides 50,000 by 1,000 instead of 10,000 and overestimates availability. The 500-hour and 0.5-hour options miscalculate the linear \(1/N\) scaling by one or two orders of magnitude.
Learning Objective: Calculate the system-level MTBF and availability scaling for large accelerator clusters.
Using an illustrative unprotected-memory soft-error rate of 250 FIT/Mbit and 80 GiB of HBM per device, explain why a 1,024-GPU training cluster needs ECC protection.
Answer: Using the chapter’s 80 GiB device capacity gives about \(7.04\times10^8\) Mbit across 1,024 GPUs. Multiplying by 250 FIT/Mbit yields about \(1.76\times10^{11}\) FIT. Since 1 FIT is one event per billion hours, this is about 176 raw memory errors per hour, approximately one every 20 seconds. ECC corrects covered error patterns before they become application-visible; the residual job-interrupting and silent-corruption rates depend on the protection scheme, not the raw rate alone.
Learning Objective: Analyze why high-density memory subsystems dominate the soft-error failure budget in distributed ML clusters.
Self-Check: Answer
- **Sequence the following failure domains in ascending order of their physical containment hierarchy and typical blast radius (from smallest number of affected GPUs to largest):
- Top-of-rack (ToR) switch failure isolating 32–64 GPUs
- Single GPU hardware lockup affecting 1 GPU
- Multi-rack Power Distribution Unit (PDU) failure affecting 100–500 GPUs
- Node-level power loss (a fault that exhausts a node’s redundant PSUs) affecting 8 GPUs
- Regional power grid disruption affecting all GPUs in a data center**
Answer: The correct sequence is (2) -> (4) -> (1) -> (3) -> (5). - (2) Single GPU hardware lockup: Affects 1 GPU. - (4) Node-level power loss (redundant PSUs exhausted): Affects 8 GPUs. - (1) Top-of-rack (ToR) switch failure: Affects 32–64 GPUs. - (3) Multi-rack Power Distribution Unit (PDU) failure: Affects 100–500 GPUs. - (5) Regional power grid disruption: Affects all GPUs across the data center region.
Learning Objective: Classify infrastructure failure domains by hierarchical containment and blast radius.
During a distributed AllReduce operation, a single GPU rank experiences a silent bit flip in an exponent calculation. The rank does not crash, passes network timeouts, and contributes an anomalously large gradient to the collective average. How is this failure categorized, and what is its primary danger to the training run?
- Byzantine failure; it silently poisons model weights and gradients while bypassing standard process-liveness and timeout detection.
- Fail-stop failure; it immediately halts the AllReduce collective and triggers an automated container restart.
- Transient network failure; it is automatically corrected by underlying InfiniBand packet retransmission protocols.
- Benign gray failure; it is absorbed by stochastic gradient descent with zero impact on final convergence.
Answer: The correct answer is A. This is a Byzantine failure because the defective component continues participating in collective communication while transmitting mathematically corrupted data, silently poisoning global model parameters without triggering fail-stop crash handlers. Categorizing this as a fail-stop failure is incorrect because fail-stop components cease operation and are caught by timeout mechanisms. Categorizing this as a transient packet loss error confuses network transport retries with silent arithmetic corruption. Categorizing this as a benign gray failure that self-corrects through stochastic gradient descent is incorrect because exponent bit flips can scale gradients by orders of magnitude, causing divergence or NaN collapse.
Learning Objective: Compare Byzantine failures and silent data corruption against fail-stop failures in synchronous distributed training.
Self-Check: Answer
A cluster node passes cold-boot diagnostics and memory tests during morning maintenance, but repeatedly produces incorrect matrix multiplication results under sustained thermal load during large-batch backward passes. What type of fault does this represent, and what is the appropriate operational response?
- Transient fault; retry the exact batch on the same node since the fault will disappear automatically.
- Intermittent fault; collect runtime telemetry under load, quarantine the node, and replace or repair it rather than returning it directly to production.
- Permanent stuck-at-0 fault; immediately discard all training checkpoints because the device cannot execute any instructions.
- Software race condition; upgrade the host OS kernel and increase the AllReduce heartbeat timeout threshold.
Answer: The correct answer is B. The recurring load-dependent signature is consistent with an intermittent fault and warrants quarantine and tests under the conditions that exposed it. Passing a cold-boot test does not clear that risk. Thermal correlation alone does not exclude software or runtime defects; replay and telemetry must corroborate hardware attribution before repair or replacement. Retrying without validation risks recurring corruption.
Learning Objective: Classify hardware faults by their temporal signature and determine appropriate mitigation strategies.
Compare the impact of a single-bit flip in the sign bit versus a single-bit flip in the exponent bits of an IEEE 754 floating-point weight or gradient tensor during neural network training.
Answer: A sign-bit flip reverses the value, potentially changing the direction of an update. An exponent-bit flip can change its scale by orders of magnitude or create a nonfinite value, so it can be more damaging than a low mantissa-bit error. The effect depends on the original bit pattern, operation, and error masking; not every exponent error immediately causes divergence.
Learning Objective: Analyze the vulnerability of floating-point numerical representations to single-bit hardware upsets.
A node that stays alive and keeps answering heartbeats but runs slowly or erratically, so that timeouts never fire, is said to suffer a ____ failure.
Answer: The correct answer is gray (a gray failure). Because the node never stops responding, fail-stop detection through heartbeats and timeouts cannot catch it; the fleet must detect it through straggler analysis and performance evidence instead.
Learning Objective: Identify failure modes that evade timeout-based detection and require performance-based evidence.
How does a permanent stuck-at fault in a specialized accelerator’s Tensor Core multiply-accumulate unit manifest differently during training compared to a traditional processor crash?
- It causes an immediate kernel execution timeout that terminates the local process group within milliseconds.
- It corrupts operating system page tables, forcing an immediate kernel panic and node reboot.
- It triggers a PCIe bus reset that automatically redirects subsequent GEMM operations to host CPU memory.
- It can produce repeatable incorrect values in computations using the defective datapath while the process remains alive.
Answer: The correct answer is D. A stuck-at datapath defect can repeatedly corrupt affected computations without raising a process exception. The visible effect depends on which instructions, values and lanes use the faulty circuit, and whether later operations mask the error. It need not affect every matrix multiplication or always cause divergence. The other choices incorrectly require a crash, bus reset or automatic CPU fallback.
Learning Objective: Compare the manifestation of permanent datapath faults in specialized accelerator matrix units against scalar processor faults.
Because electronic components exhibit a constant failure rate during their useful life phase under the exponential reliability model, cluster operators should assign newly delivered accelerator nodes directly to multi-week foundation model pretraining runs without prior burn-in testing.
Answer: False. Newly manufactured hardware can exhibit elevated early-life failure rates from manufacturing defects, marginal packaging, and assembly flaws. Operators screen new or repaired nodes under qualified stress procedures before assigning expensive long jobs. Temperature, voltage, duration, and acceptance criteria depend on the component and procedure; a generic burn-in duration is not an operating specification or a guarantee of later reliability.
Learning Objective: Evaluate the operational risks of bypassing burn-in screening for newly deployed accelerator hardware.
Self-Check: Answer
In a 100,000-GPU training cluster where each device has an illustrative SDC probability of \(10^{-6}\) per GPU-hour, what is the expected SDC exposure and failure cadence during continuous AllReduce training with 2-second step times?
- The cluster experiences roughly 55.6 GPU-hours of exposure per 2-second step, resulting in an expected SDC event approximately every 18,000 steps (every ~10 hours).
- The cluster experiences an SDC event on every single step because 100,000 GPUs exceed the reliability threshold.
- The cluster experiences an SDC event once every 1,000 days because \(10^{-6}\) is negligible for 2-second steps.
- The cluster experiences an SDC event exactly every 50,000 hours regardless of cluster size.
Answer: The correct answer is A. For a 2-second step (\(2/3600 = 1/1800\) hours), 100,000 GPUs accumulate \(100{,}000 / 1800 \approx 55.56\) GPU-hours of exposure per step. With an individual rate of \(10^{-6}\) per GPU-hour, the probability of at least one SDC per step is \(1 - (1 - 10^{-6})^{55.56} \approx 5.56 \times 10^{-5}\). The expected number of steps between SDC events is \(1 / (5.56 \times 10^{-5}) \approx 18{,}000\) steps, which equals \(18{,}000 \times 2 / 3600 = 10\) hours. The single-step claim exaggerates probability by orders of magnitude. The 1,000-day and 50,000-hour options ignore the \(100{,}000\times\) fleet accumulation factor.
Learning Objective: Calculate how silent data corruption risk compounds across fleet-scale collective communication operations.
Explain what gradient checksums and redundant computation can each detect during AllReduce, and why checksums alone cannot establish the arithmetic correctness of every worker contribution.
Answer: Checksums can detect changed bytes in transport or storage, and digests of supposedly identical reduced buffers can expose disagreement. A worker can compute an incorrect gradient and then checksum those incorrect bytes successfully. Detecting that arithmetic fault requires independent recomputation, replay, invariants, or statistical evidence. Those checks can block suspect updates within their coverage; they are not a universal guarantee against arbitrary faulty workers.
Learning Objective: Design check-and-verify mechanisms to detect silent data corruption during distributed collective reductions.
Safety-critical embedded systems use dual or triple modular redundancy to detect or mask hardware faults. Explain why the same approach does not transfer to a 10,000-GPU training fleet, and describe how fleets spend redundancy instead.
Answer: Dual and triple modular redundancy run every computation two or three times, paying 100 or 200 percent hardware overhead so that a single wrong output is caught or outvoted within one control deadline. That price is reasonable for a small vehicle computer where one wrong output is dangerous. For fleet training it would double or triple the cost of the most expensive computation the organization runs, to guard against corruption events that arrive far less often than once per step and that rollback to a clean checkpoint can repair. Fleets therefore spend redundancy selectively: screening removes defective devices, cheap statistical checks run continuously, hot spares absorb drained nodes, and full recomputation is reserved for suspected corruption.
Learning Objective: Evaluate why full modular redundancy is uneconomic for fleet training and how selective redundancy replaces it.
A component that remains active but sends arbitrary, corrupted, or conflicting data requires ____ fault tolerance reasoning rather than only fail-stop detection.
Answer: Byzantine. Such faults require explicit assumptions about faulty participants and independent validation; ordinary byte-integrity checks alone cannot prove that a local gradient was computed correctly.
Learning Objective: Apply Byzantine fault tolerance principles to protect parameter updates against silent data corruption.
Self-Check: Answer
Why are GPU memory leaks in 70B+ parameter distributed training pipelines particularly destructive and difficult to diagnose compared to standard CPU memory leaks?
- GPU memory is dynamically swapped to NVMe disk automatically, causing unpredictable I/O thrashing rather than out-of-memory errors.
- GPU allocators immediately throw segmentation faults upon the first unreleased tensor, preventing any batch execution.
- Accelerator memory is scarce (40–80 GB per device) and shared across weights, optimizer state, and activations; a small leak per batch gradually builds over hundreds of steps until triggering an un-checkpointed OOM crash mid-run.
- GPU memory leaks only occur when using mixed-precision BF16 formats and disappear entirely when switching to FP32 weights.
Answer: The correct answer is C. Model, gradient, optimizer, and activation state can leave little accelerator-memory headroom. Retaining a graph or tensor every step gradually consumes that headroom until allocation fails, potentially far from the leak’s origin. Changing precision affects capacity but does not fix the leak; ordinary device allocations do not automatically spill to disk.
Learning Objective: Analyze the accumulation mechanics and failure risks of accelerator memory leaks in distributed training.
Contrast a pipeline deadlock with a data race condition in distributed parallel training in terms of their system symptoms and impact on model convergence.
Answer: A deadlock prevents progress because stages wait on cyclic dependencies; utilization may be low or misleadingly high if communication kernels spin. A data race allows unsynchronized accesses to mutable state, producing timing-dependent results or corrupted updates while execution continues. Neither fault has a universal utilization percentage, so diagnosis requires progress counters, dependency traces, and correctness checks.
Learning Objective: Compare synchronization failure modes across distributed parallel training paradigms.
Justify why a silent data preprocessing defect (such as unintended prompt truncation or incorrect token masking) presents a much higher compute and financial risk than a syntax error that crashes on the first batch.
Answer: A syntax error usually stops execution early and gives direct feedback, limiting wasted work. A silent preprocessing defect can preserve valid shapes while changing the objective, allowing expensive training to continue before evaluation exposes the problem. The loss depends on when the defect is detected, which state or data it affected, and whether valid checkpoints permit recovery; it need not invalidate the entire run.
Learning Objective: Justify why silent software transformations in data pipelines present higher business and compute risk than fail-stop software errors.
**A preprocessing change silently truncates prompts and discards the system prompt. Sequence the reliability gates in the order that should catch the defect, from earliest and cheapest to the final proof that recovery works:
- A fault-injection test showing that the resulting alert blocks publication or rolls back to a known-good state
- A boundary unit test asserting that tokenizer limits, system prompts, and masks survive preprocessing
- An integration replay that follows one recorded batch through loading, sharding, collation, and model input construction**
Answer: The correct sequence is (2) -> (3) -> (1). - (2) The boundary unit test catches the tokenizer defect before any distributed execution. - (3) Integration replay confirms that batch shapes and metadata survive the full input path. - (1) Fault injection demonstrates that, if corruption does slip through, the detector fires and recovery satisfies its objectives before corrupted state commits.
Learning Objective: Design a layered software validation pipeline in which each gate exercises a specific invariant and authorizes a specific decision.
Self-Check: Answer
The expected cost of a training run is modeled as base compute, plus expected failures times the cost per failure, plus the cost of fault-tolerance mechanisms. Under this model, when does one more unit of fault-tolerance investment lower the total expected cost?
- Whenever it reduces the expected number of failures, regardless of what it costs.
- Whenever the cluster is large enough to fail several times per day.
- While the reduction in expected failure cost it buys exceeds its own marginal cost.
- Whenever total fault-tolerance spending stays below the base compute cost of the run.
Answer: The correct answer is C. The investment criterion compares the marginal cost of protection with the marginal reduction in expected failure cost; additional protection pays while the second exceeds the first. Reducing failures at any price ignores that protection itself adds cost, and a large, frequently failing cluster usually satisfies the criterion but does not define it. Comparing protection with base compute is not the test, because base compute is held fixed.
Learning Objective: Apply the marginal investment criterion to decide whether an added fault-tolerance mechanism lowers expected run cost.
A 175B-parameter language model trains on 10,000 GPUs at about $2 per GPU-hour, and a ViT-Large model trains for two days on a much smaller allocation. Both checkpoint once a day. Why can one failure cost the language model run roughly $0.5M of compute but the vision run only tens of thousands of dollars?
- Each GPU in the language model run fails more often, so every failure destroys more work.
- Lost progress is priced by what the allocation costs per hour and how much state must be recovered, so up to a day of rework on a 10,000-GPU allocation costs about $0.5M while a smaller allocation loses far less per day.
- Vision checkpoints are larger than language model checkpoints, which shortens vision recovery.
- Vision runs carry no state beyond their weights, so they can resume from any data position at no cost.
Answer: The correct answer is B. At 10,000 GPUs and about $2 per GPU-hour, a day of lost progress costs about $0.5M before schedule delay, while a smaller vision allocation burns far less per hour. The per-device failure rate is the same physics in both runs, so the gap comes from what each hour of the allocation costs. The checkpoint-size claim is reversed, since the 175B checkpoint is terabytes against a single-digit-gigabyte vision checkpoint, and vision runs still carry augmentation and data-order state.
Learning Objective: Explain why the cost of a single failure varies by orders of magnitude across workloads.
On the 10,000-GPU cluster, about 6.2 failures per day each stall every GPU during recovery, at about $2 per GPU-hour. An idle eight-GPU hot-spare node costs about $384 per day. Estimate how much recovery time the spare must save per failure to pay for itself, and state the condition attached to that estimate.
Answer: Shaving one minute from each recovery is worth about 6.2 failures times 10,000 GPUs times $2 per hour divided by 60, or roughly $2,100 per day, so each second saved per failure is worth about $34 per day and the spare breaks even near 11 seconds saved per failure. The estimate holds only if the spare is refilled before the next failure arrives, about 3.9 hours later, and if the time saved is real recovery time while the fleet waits. At fleet scale, idle capacity that shortens recovery is cheap relative to the GPU-time it protects.
Learning Objective: Calculate the break-even recovery-time saving for a hot-spare node and identify the assumption it depends on.
True or False: A hot-spare node that pays for itself beside a 10,000-GPU training cluster is also a sound investment beside an eight-GPU job, because the node and its daily cost are identical.
Answer: False. The spare’s benefit scales with how often failures occur and how many GPUs wait during each recovery. An eight-GPU job fails rarely and idles few GPUs per recovery, so the spare would sit idle far longer than it could save. Scale reverses the verdict on the same hardware.
Learning Objective: Evaluate how cluster scale changes the return on the same fault-tolerance investment.
Self-Check: Answer
A team checkpoints every 30 minutes with asynchronous flushing. It promises a recovery point objective (RPO) of 15 minutes and a recovery time objective (RTO) of 10 minutes, and reloading the checkpoint alone takes 12 minutes. Which assessment is correct?
- Both promises hold, because the Young-Daly interval already minimizes expected waste.
- The RPO holds because asynchronous flushing removes the write from the critical path, but the RTO fails.
- The RTO holds because detection and warmup overlap with checkpoint reload, but the RPO fails.
- Both promises fail, because a 30-minute interval cannot bound lost progress below 30 minutes without a more frequent durable log or replica, and a 12-minute reload alone exceeds the 10-minute RTO before detection, replacement, and warmup are counted.
Answer: The correct answer is D. Lost progress can reach a full interval, and asynchronous flushing can leave the last durable generation older still, so a 15-minute RPO needs a more frequent durable log or replica. Recovery time covers detection, replacement, restore, and warmup, so a 12-minute reload alone breaks a 10-minute RTO. The Young-Daly interval minimizes expected waste but does not certify these service constraints, and asynchronous flushing shortens the training pause without making the newest checkpoint durable sooner.
Learning Objective: Evaluate whether a checkpoint policy satisfies stated recovery point and recovery time objectives.
A training cluster quadruples in size from 1,000 GPUs to 4,000 GPUs, reducing its system MTBF by a factor of 4. Assuming checkpoint write time \(T_{\text{write}}\) remains constant, calculate by what factor the Young-Daly optimal checkpoint interval \(\tau_{\text{opt}}\) changes.
Answer: Under the Young-Daly formula \(\tau_{\text{opt}} = \sqrt{2 \cdot T_{\text{write}} \cdot \text{MTBF}_{\text{system}}}\), the optimal interval scales with the square root of MTBF. When MTBF decreases by a factor of 4 (\(\text{MTBF}' = \text{MTBF}/4\)), the new optimal interval becomes \(\tau_{\text{opt}}' = \sqrt{2 \cdot T_{\text{write}} \cdot (\text{MTBF}/4)} = \frac{1}{2}\tau_{\text{opt}}\). The optimal interval halves (becomes \(2\times\) more frequent), not \(4\times\), due to the square-root relationship.
Learning Objective: Calculate the mathematical scaling of the Young-Daly optimal checkpoint interval as cluster size increases.
How does sharded checkpointing (such as in ZeRO-3 or PyTorch FSDP) differ from centralized checkpointing in terms of I/O parallelism and recovery requirements?
- Sharded checkpointing requires every worker to broadcast its state to all peers before writing, doubling network communication overhead.
- Sharded checkpointing writes a single monolithic file from Rank 0, minimizing storage metadata operations.
- Each worker writes only its locally partitioned parameter and optimizer shard directly to storage in parallel, aggregating storage fabric bandwidth but requiring all shards to be present and consistent during recovery.
- Sharded checkpointing stores only model weights, discarding optimizer state to achieve sub-second write times.
Answer: The correct answer is C. Under ZeRO-3/FSDP sharded checkpointing, each worker saves only its local partition of weights and optimizer states (e.g., \(\approx 10\) GB per worker instead of 10 TB total), parallelizing write bandwidth across the cluster. The trade-off is recovery complexity: all worker shards must be present, and changing the worker count upon restart requires remapping and resharding state. Broadcasting state to all peers describes redundant replication. Writing a monolithic file from Rank 0 describes centralized checkpointing. Discarding optimizer state would prevent deterministic optimizer resumption.
Learning Objective: Compare sharded checkpointing with centralized checkpointing in terms of I/O parallelism and recovery complexity.
Explain the memory composition breakdown of checkpoint files for large language models trained with mixed-precision AdamW, detailing why optimizer states dominate storage requirements.
Answer: In the chapter’s reference mixed-precision AdamW format, BF16/FP16 weights occupy 2 bytes per parameter, separate FP32 master weights occupy 4 bytes, and the two FP32 moment tensors occupy 8 bytes. Optimizer-side state therefore accounts for 12 of 14 bytes per parameter, about 86 percent, or 840 GB of a 980 GB checkpoint for a 70B model before metadata. Implementations with different state formats require their own payload calculation.
Learning Objective: Analyze the composition of checkpoint storage payloads across model weights and optimizer states.
**Sequence the 6 steps of a standard distributed sharded checkpoint coordination protocol in chronological order:
- Coordinator confirms all writes and commits checkpoint metadata
- Each worker writes its local state shard directly to persistent storage
- Coordinator broadcasts checkpoint completion signal, allowing next barrier clearance
- Coordinator broadcasts checkpoint initiation request with a unique checkpoint ID
- Each worker reaches a consistent execution state via barrier synchronization
- Each worker reports shard write completion back to the coordinator**
Answer: The correct sequence is (4) -> (5) -> (2) -> (6) -> (1) -> (3). - (4) Coordinator broadcasts checkpoint initiation request with checkpoint ID. - (5) Workers reach consistent step boundary via barrier synchronization. - (2) Workers write their respective state shards in parallel. - (6) Workers report write completion to the coordinator. - (1) Coordinator commits metadata once all shards are verified. - (3) Coordinator broadcasts completion signal so normal training resumes.
Learning Objective: Design the operational phases of a distributed sharded checkpoint protocol.
What is the primary advantage of adopting a bounded asynchronous checkpoint consistency model over a strict synchronous checkpoint model in a 10,000-GPU cluster?
- It can reduce barrier waiting by letting workers progress within a bounded step window while retaining compatible shard versions or replay information to construct a consistent recovery cut.
- It guarantees that all workers write their state at the exact same nanosecond without requiring any communication with a coordinator.
- It eliminates the need for persistent storage by maintaining checkpoints entirely in L2 cache memory.
- It ensures that lost computation after a hardware crash is always zero steps.
Answer: The correct answer is A. A bounded-asynchronous protocol can reduce barrier waiting, but bounded step skew alone does not make saved shards mutually consistent. The manager must retain compatible versions or sufficient replay information to reconstruct a valid cut before publishing a recoverable generation. This differs from asynchronous flushing of one synchronized snapshot, which overlaps I/O without relaxing recovery consistency. The other choices do not provide a valid persistent recovery protocol.
Learning Objective: Evaluate consistency models and two-phase commit protocols for distributed checkpointing.
Self-Check: Answer
A 10,000-GPU training job experiences a GPU failure. The cluster implements cold restart, where \(T_{\text{detect}} = 30\text{ s}\), \(T_{\text{restart}} = 3\text{ min}\), \(T_{\text{load}} = 36\text{ s}\), and \(T_{\text{warmup}} = 2\text{ min}\). If the cluster MTBF is 5 hours, what is the daily compute loss incurred solely from recovery time?
- Approximately 0.5 minutes daily, wasting 5 GPU-hours per day.
- Approximately 6.6 minutes daily, wasting 100 GPU-hours per day.
- Approximately 15 minutes daily, wasting 500 GPU-hours per day.
- Approximately 29.3 minutes daily, wasting roughly 4,880 GPU-hours per day across the fleet.
Answer: The correct answer is D. Recovery takes \(30+180+36+120=366\) seconds, or 6.1 minutes. At \(24/5=4.8\) failures per day, the first-order lost time is \(4.8\times6.1=29.28\) minutes per day. Across 10,000 GPUs this is \(10{,}000\times29.28/60=4{,}880\) GPU-hours, about 2.03 percent of daily capacity. The other choices fail to combine failure frequency, recovery duration, and fleet size.
Learning Objective: Calculate the total recovery time budget and compound daily compute loss across large accelerator clusters.
Compare a warm restart with a cold restart for a single-GPU failure in a 1,000-GPU cluster in terms of recovery latency, memory state guarantees, and software complexity.
Answer: A cold restart stops the worker group and restores a valid checkpoint, trading a full reload and warmup for simpler state handling. A warm restart keeps surviving processes, but a replacement must reconstruct state at the survivors’ committed step or the group must roll back to a common recovery point; combining an older shard with advanced survivor state is unsafe. The chapter’s 4–10-minute cold and 30–90-second warm ranges are planning examples, not guarantees. Warm recovery additionally requires runtime support for membership changes and communicator reconstruction, with cold restart as a safety net.
Learning Objective: Compare warm and cold restart mechanisms for distributed training failure recovery.
In a compute-dominated 1,000-GPU synchronous job, one GPU remains at half speed, reducing useful cluster throughput by approximately half. What comparison determines whether replacing it is worth the interruption?
- Throughput drops by only 0.1% (1/1000th); the straggler should always be tolerated to avoid restart overhead.
- Compare the useful work lost during replacement, restart, and replay with the work recovered by removing the slowdown over its expected remaining duration.
- Cluster throughput remains 100% because asynchronous gradient buffering absorbs all rank jitter.
- Throughput drops by 100% because any slow rank immediately triggers an NCCL assertion crash.
Answer: The correct answer is B. If the slowdown is expected to persist for \(K\) useful updates, replacement pays off when \(K(t_{\mathrm{slow}}-t_{\mathrm{healthy}})>T_{\mathrm{restart}}+T_{\mathrm{replay}}\). The restart budget includes waiting for replacement capacity and restoring state. A transient may clear before this threshold; cluster MTBF does not determine the remaining slowdown horizon.
Learning Objective: Evaluate the economic and throughput break-even criteria for proactively replacing stragglers.
**Sequence the six sequential operational stages executed by the chapter’s stated cold-restart recovery path after classifying a hard worker failure:
- Resource Reclamation: Scheduler marks defective node as draining and requests spare node
- Job Termination: Broadcast termination signal to tear down invalidated communicator
- Checkpoint Loading: Workers read local partition state shards from distributed storage
- Training Resumption: Data loaders restore recorded position and sampling state, and training resumes
- Job Restart: Launch fresh container processes and re-initialize training runtime binary
- State Synchronization: Workers execute rendezvous and re-initialize NCCL communicators**
Answer: The correct sequence is (2) -> (1) -> (5) -> (3) -> (6) -> (4). - (2) Job Termination: Tear down dead communicator across surviving workers. - (1) Resource Reclamation: Isolate and drain failed node; provision replacement. - (5) Job Restart: Launch replacement container and re-initialize execution runtime. - (3) Checkpoint Loading: Workers load durable parameter and optimizer shards. - (6) State Synchronization: Reconstruct NCCL communicators and verify step parity. - (4) Training Resumption: Restore the recorded input-stream position and sampling state, then resume training.
Learning Objective: Design the end-to-end operational stages of an automated failure recovery pipeline.
In heartbeat failure detection (\(T_{\text{timeout}} = H + k\sigma_d\)), reducing the safety multiplier \(k\) to a very small value (e.g., \(k=1\)) is universally optimal because it minimizes detection latency \(T_{\text{detect}}\) without any operational downsides.
Answer: False. A smaller multiplier shortens the waiting threshold but can increase false failure declarations when healthy workers are delayed. The resulting recovery can discard useful work. Whether those costs exceed faster detection benefits depends on measured delay tails, failure rates and recovery costs; there is no universally optimal multiplier.
Learning Objective: Analyze the trade-off between detection latency and false positive failure declarations in heartbeat monitoring.
During pretraining of a foundation model, the training loss curve exhibits gradual divergence over 50 steps without any thrown exceptions or NaNs in the logs. Based on common ML failure signatures, which failure hypothesis and investigation path should be considered?
- Learning rate warm-up is too fast; double the learning rate and continue training.
- A disk full error occurred on the central coordinator; delete log files to resume execution.
- The tokenizer encountered an unknown character; restart training from Step 0.
- Silent data corruption or subtle distributed rank desynchronization may have occurred; investigate with independent replay, quarantine confirmed faulty hardware, and roll back to a known-good checkpoint prior to divergence.
Answer: The correct answer is D. Silent corruption or rank desynchronization is a plausible failure class and warrants independent checks and replay. Gradual loss divergence alone does not diagnose faulty hardware: data defects and numerical instability can look similar. Isolate the cause before draining a node, and restore a validated earlier checkpoint when state is corrupted. Increasing the learning rate without diagnosis can worsen the incident.
Learning Objective: Analyze root causes from training loss curve signatures and select appropriate recovery responses.
Self-Check: Answer
When an 8-GPU node fails during a 1,024-GPU training run and no spare nodes are available, how does an elastic training framework enable the job to continue without idling the remaining 1,016 GPUs?
- It automatically pauses the run and waits indefinitely until physical hardware repair replaces the defective node.
- It shifts the missing 8 ranks of computation entirely to host CPU threads without changing the communication topology.
- It can rebuild the worker group and restore valid state on the survivors when memory and parallelism permit, preserving data and batch invariants; 99.2% retained device count does not guarantee the same fraction of throughput.
- It ignores the lost node and allows the remaining workers to continue training without synchronizing gradients.
Answer: The correct answer is C. Elastic recovery can resume at a changed worker count when the remaining allocation supports the model state and parallel decomposition. The runtime must recover missing shards, establish membership, and preserve the logical input stream; training code must preserve batch size or validate the changed optimization policy. A worker-group restart may still be required, and retained device count alone does not determine throughput. Fixed-size recovery instead waits to regain its required allocation. Ignoring the lost participant does not repair its collective or state dependencies.
Learning Objective: Explain how elastic training transforms hard capacity loss into temporary throughput degradation.
When an elastic training job resizes from \(N_{\text{base}}\) to \(N_{\text{new}}\) workers, compare using gradient accumulation adjustment versus learning rate recalibration to preserve optimization dynamics.
Answer: Increasing gradient accumulation can preserve examples per update when workers are lost; halving worker count requires doubling accumulation if the microbatch is unchanged. It does not guarantee identical updates because reduction order and microbatch-dependent statistics can change, and communication and overlap determine wall time. If the global batch changes, linear or square-root learning-rate scaling offers candidate policies that must be validated for the optimizer, schedule, and workload; neither guarantees convergence stability.
Learning Objective: Design mathematical adaptation rules for learning rate and gradient accumulation during worker group resizing.
How does elastic recovery transform the economics of training large foundation models on preemptible cloud ‘spot’ instances?
- It can resume at reduced scale after preemption when state and parallelism fit the survivors, reducing waiting for replacement capacity; net savings still depend on lost work, recovery cost, and preemption frequency.
- It forces cloud providers to guarantee \(100\%\) uptime for spot instances by running redundant dummy processes.
- It eliminates all network communication requirements, allowing spot instances to train completely independently without synchronizing weights.
- It converts spot instances into dedicated on-demand instances at zero additional billing charge.
Answer: The correct answer is A. Fixed-size jobs can checkpoint and restart after reacquiring their required allocation; elasticity can reduce that waiting by resuming with fewer workers when memory, state, and parallelism constraints permit. Both paths pay for lost work, restoration, and group reconstruction. A discounted device-hour price therefore does not establish lower cost per retained training result: frequent preemption or expensive recovery can erase the apparent savings. The other choices invent guarantees or remove necessary synchronization.
Learning Objective: Evaluate the economic and architectural requirements of running distributed ML workloads on preemptible cloud instances.
For large recommendation systems with multi-terabyte embedding tables, checkpoint and recovery strategies must always prioritize strict full-state reproducibility over embedding freshness to avoid business revenue loss.
Answer: False. Recovery must satisfy both the workload’s state-validity contract and its measured tolerance for stale embeddings. Incremental checkpoints can reconstruct an exact generation from a base and required deltas, while tiered placement can shorten restoration. Neither technique inherently trades consistency for freshness; accepting approximate or stale state requires a separate validated recovery contract.
Learning Objective: Compare recovery state invariants between dense foundation models and embedding-heavy recommendation architectures.
In PyTorch Elastic (TorchElastic), the coordinator-backed synchronization protocol by which surviving and restarted workers discover each other, establish communication, and agree on new rank and world size assignments is called ____.
Answer: The correct answer is rendezvous (or the rendezvous mechanism). The rendezvous protocol provides consensus on cluster membership before initializing the new communication group.
Learning Objective: Explain the role of the rendezvous protocol in elastic worker group management.
Self-Check: Answer
A single inference serving replica provides an availability of \(99\%\) (\(A_{\text{single}} = 0.99\), corresponding to 3.65 days of downtime per year). What is the theoretical annual downtime when deploying 3 independent replicas in an active-active parallel configuration (\(A_{\text{system}} = 1 - (1 - A_{\text{single}})^3\)), and why is real-world availability typically lower?
- Annual downtime is 52.6 minutes; real-world availability is lower because load balancers introduce \(10\%\) packet loss.
- Annual downtime is 3.65 days; real-world availability is unchanged because adding replicas does not change individual failure rates.
- Annual downtime is 0 seconds; three replicas provide mathematically absolute fault tolerance under all operating conditions.
- Annual downtime drops to approximately 31.5 seconds (\(99.9999\%\) availability); real-world availability is lower because correlated failures (shared power, top-of-rack switches, DNS, software bugs) violate the independence assumption.
Answer: The correct answer is D. The formula for \(k=3\) independent replicas yields \(A_{\text{system}} = 1 - (1 - 0.99)^3 = 1 - (0.01)^3 = 1 - 10^{-6} = 0.999999\) (\(99.9999\%\) availability, or \(365 \times 24 \times 3600 \times 10^{-6} \approx 31.5\) seconds downtime/year). In practice, shared failure domains (such as common top-of-rack switches, power feeds, shared feature stores, or buggy model code deployed across all replicas) introduce correlation that prevents achieving six-nines availability. Two independent 99-percent replicas yield about 52.6 minutes of annual downtime, whereas three yield about 31.5 seconds. The 3.65-day option ignores redundancy entirely. Absolute zero downtime is physically impossible. This idealized formula also assumes reliable routing and enough ready capacity on the surviving replicas to serve demand; independence alone does not establish request-level availability.
Learning Objective: Calculate redundant replica availability and identify factors that violate component independence.
Explain why losing the key-value (KV) cache of an active 128K-token conversation during a GPU failure in stateful LLM serving severely degrades user latency, and describe how prefix caching mitigates this impact.
Answer: The replacement replica must reconstruct any lost per-session KV state before continuing generation, adding prefill latency. A surviving replica with a matching cached prefix can avoid recomputing that prefix, but the uncached conversation suffix still needs processing. Prefix caching helps only when reusable state remains available; it does not automatically replicate every session cache or eliminate failover latency.
Learning Objective: Analyze the latency and state preservation challenges of transformer KV caches in stateful inference serving.
What is the primary operational trade-off between Active-Active and Active-Passive replication strategies in ML inference serving clusters?
- Active-Active replication requires \(100\%\) manual failover by human operators, whereas Active-Passive replication is fully automated.
- Active-Active distributes traffic across all live replicas to maximize resource utilization but requires reserve headroom to absorb traffic when a replica fails; Active-Passive maintains synchronized standby replicas that sit idle during normal operation, simplifying failover at higher resource cost.
- Active-Active replication can only be deployed on CPU clusters, whereas Active-Passive replication is exclusive to GPUs.
- Active-Active replication guarantees zero latency during network partitions, whereas Active-Passive replication triples inference compute requirements.
Answer: The correct answer is B. In Active-Active serving, all replicas actively process incoming requests, maximizing infrastructure efficiency, but the cluster must operate below peak capacity (with headroom) so surviving replicas are not overwhelmed when one fails. In Active-Passive serving, dedicated standby replicas remain idle while tracking state or heartbeats, ensuring clean failover capacity at the cost of paying for idle hardware. The other choices mischaracterize automation, hardware support, and network partition physics.
Learning Objective: Compare active-active and active-passive replication strategies for model inference workloads.
In stateless model serving (such as single-image classification), a crashed GPU replica requires complex distributed state synchronization and session rollback before a client’s request can be retried on another node.
Answer: False. A stateless request supplies the input needed by another compatible, ready replica, so no session-state restoration is required. A retry still needs surviving capacity, safe operation semantics, the original deadline and a bounded retry budget. Routing or detection delays can remain; statelessness does not guarantee immediate successful completion.
Learning Objective: Compare request failover mechanisms between stateless and stateful model serving systems.
After a serving replica suffers a GPU fault, what dependencies must hold before requests can safely use alternate replicas, and which recovery work can proceed concurrently?
Answer: Health evidence must remove the failed replica from routing. Alternate replicas must be ready and have capacity; stateful requests also need their required context restored or reconstructed. Retried work must be safe, remain within its original deadline and retry budget, and pass admission control. Provisioning a replacement can proceed concurrently with rerouting to existing ready replicas. Detection, routing propagation and state recovery can add delay; failover is not necessarily seamless.
Learning Objective: Analyze the automated health detection and traffic rerouting stages during inference replica failover.
Compare session affinity with external distributed state stores (such as Redis) for managing stateful conversational inference sessions in terms of failover speed and infrastructure complexity.
Answer: Session affinity keeps a conversation on the replica holding its KV cache, avoiding remote state access but exposing that session to cache loss when the replica fails. An external store can preserve conversation context so another replica can recover it. Unless KV state was also preserved, the replacement still recomputes the cache. The trade-off includes state-transfer latency and another storage dependency.
Learning Objective: Compare session affinity against distributed state stores for stateful inference fault tolerance.
Self-Check: Answer
A serving system under overload must drop some requests. Why does priority-based load shedding generally serve the product better than random shedding?
- Random shedding drops more total requests than priority-based shedding at the same load.
- Priority-based shedding eliminates the need for admission control at the system entry point.
- Random shedding treats every request as equally valuable, while priority-based shedding degrades according to a predeclared contract, serving interactive and revenue-generating requests before background or analytics work.
- Priority-based shedding guarantees that no request misses its latency target during overload.
Answer: The correct answer is C. Both policies preserve capacity by dropping a fraction of demand, so neither inherently drops fewer requests. Random shedding ignores request value, whereas priority-based shedding turns degradation into an explicit policy that protects the most valuable traffic first. Admission control is still needed to reject work at entry, and no shedding policy guarantees every surviving request meets its target.
Learning Objective: Compare load-shedding policies by how they allocate unavoidable service loss across request classes.
Explain the four-tier feature degradation strategy (Critical, Important, Useful, Optional) and describe how it maintains service availability when feature store dependencies degrade.
Answer: The example policy blocks requests missing Critical features, substitutes validated defaults for Important features, uses cached values for Useful features, and omits Optional features. Its 5–10%, 2–5%, and less-than-2% quality-loss ranges are illustrative policy budgets, not inherent effects of those categories. Defaults and cached representations must be compatible with the model, and measured fallback quality must satisfy the chosen budget before deployment.
Learning Objective: Design tiered feature degradation policies to maintain inference service availability during feature store outages.
An image classification service deploys a model cascade: ViT-Large (307M params, primary, 88% acc), EfficientNet-B4 (19M params, secondary, 83% acc), and MobileNet-V3 (5.4M params, tertiary, 75% acc). How should the serving tier execute model fallback during severe traffic spikes or partial accelerator outages?
- It dynamically routes incoming requests to lighter secondary and tertiary models based on queue depth and p99 latency triggers with hysteresis, maintaining low latency and high availability at measured accuracy cost.
- It executes all three models simultaneously on every request and votes on the majority class.
- It drops all incoming traffic until additional ViT-Large GPU replicas finish provisioning.
- It converts the ViT-Large model into a text-only classifier to save memory.
Answer: The correct answer is A. Model fallback ladders dynamically shift traffic to lighter, lower-compute models when queue depths or tail latency violate SLAs, preserving response availability while sacrificing a bounded percentage of accuracy. Hysteresis ensures the system does not oscillate rapidly between tiers. Executing all three adds their unequal compute costs rather than reducing load. Dropping traffic violates availability goals. Converting vision models to text-only is nonsensical.
Learning Objective: Evaluate multi-tier model fallback cascades for graceful quality-latency trade-offs.
Graceful degradation is an automatic emergent property of standard microservice architectures that requires no explicit pre-engineering or offline fallback validation.
Answer: False. Graceful degradation requires extensive pre-engineering: fallback models must be pre-deployed or precomputed, default feature stores populated, degradation triggers (latency, error rate) instrumented, fallback accuracy validated against reduced SLOs, and hysteresis policies implemented to prevent oscillation.
Learning Objective: Justify the requirement for proactive architectural design and validation in graceful degradation systems.
The fault-tolerance strategy of selectively dropping lower-priority background requests during severe load spikes to protect latency SLAs for high-priority interactive requests is known as load ____.
Answer: The correct answer is shedding (or load shedding / priority load shedding). Load shedding protects system stability by proactively dropping a portion of demand before saturation causes cascading timeouts.
Learning Objective: Explain load shedding strategies used to protect serving availability under extreme resource saturation.
Self-Check: Answer
Explain why Heisenbugs are particularly pervasive and challenging to diagnose in distributed collective communication (e.g., NCCL AllReduce) libraries.
Answer: Heisenbugs occur when the act of observing or instrumenting a software system alters its timing and masks the underlying defect. In distributed collective communication, inserting detailed logging, tracing hooks, or debug barriers alters packet transmission timing and synchronization barriers across ranks, inadvertently resolving the precise race condition, thread interleaving, or network jitter that triggered the deadlock or corruption in production.
Learning Objective: Analyze the diagnostic challenges posed by Heisenbugs and timing perturbations in distributed collective libraries.
In a production ML recommendation service, p99 latency suddenly jumps from 45 ms to 800 ms with a 15% error rate. How do the three pillars of observability (Metrics, Traces, Logs) work together to diagnose the root cause?
- Metrics reveal that GPU utilization is 100%; Traces show that all requests are identical; Logs show that user passwords were typed incorrectly.
- Metrics reveal the exact timing and scope of the latency spike; distributed Traces isolate the feature-service span consuming 700 ms (instead of normal 12 ms); structured Logs reveal repeated connection timeouts to the embedding cache followed by a database miss storm.
- Traces generate automatic pull requests to fix the bug; Metrics execute the rollback; Logs alert the end users.
- The three pillars cannot be correlated because each uses completely incompatible timestamp formats.
Answer: The correct answer is B. Metrics identify the symptom’s timing and scope; traces locate the excessive delay in the feature-service span; logs connect cache timeouts with increased direct database requests. Together they narrow the failure path and support containment through a circuit breaker and validated fallback. They do not yet distinguish a failed cache process from a network or resource problem, so targeted repair requires corroborating evidence. The other choices misstate the functions of observability or deny the shared identifiers that allow correlation.
Learning Objective: Analyze metrics, distributed traces, and structured logs to diagnose cascade failures in ML pipelines.
Explain the numerical mechanism of NaN propagation during backward gradient computation in FP16 mixed-precision training, and describe how loss scaling prevents gradient underflow.
Answer: Invalid operations such as zero divided by zero can produce NaN, which propagates through most arithmetic into gradients and optimizer state. Overflow can first produce infinity and later cause NaN through an invalid combination. Loss scaling raises small FP16 gradients above the underflow range, then unscales them before the update. Dynamic scaling must also detect nonfinite gradients and skip invalid updates; scaling alone does not cure arbitrary NaNs.
Learning Objective: Analyze numerical debugging techniques and loss scaling mechanisms in mixed-precision training.
In distributed tracing systems utilizing OpenTelemetry, capturing execution time across microservices is sufficient for incident triage without recording structured trace and span correlation identifiers in service logs.
Answer: False as a general sufficiency claim. Trace timing helps locate delayed spans, while trace and span identifiers in structured logs link those spans to local events and exceptions. Other evidence may still support initial triage without that linkage, but missing correlation makes exact request-level diagnosis harder.
Learning Objective: Evaluate the role of trace and span context propagation in distributed log correlation.
Self-Check: Answer
Why might a software-based fault injection framework (such as PyTorchFI) overestimate a neural network’s vulnerability to radiation-induced soft errors when compared against physical beam testing on real silicon?
- Software-based tools only inject faults into 8-bit integer quantized models, whereas physical radiation only affects 64-bit floating point registers.
- Physical radiation only damages power delivery networks and never alters logic gate states in operational GPUs.
- Software injection tools can only simulate permanent stuck-at faults and cannot model transient bit flips.
- Software injection mutates high-level tensor variables directly, completely bypassing microarchitectural and circuit-level masking (such as ECC correction, speculative instruction discarding, and dead registers) that absorb soft errors in hardware.
Answer: The correct answer is D. In physical hardware, many single-event upsets are masked by circuit-level defenses (ECC, parity checks) or microarchitectural factors (errors on unused registers, speculative instructions that get squashed, or overwritten memory addresses before reads occur). Software-level fault injection bypasses these hardware filtering stages and directly perturbs active software tensors, leading to higher observed failure rates than physical beam experiments. The other options misstate data types, radiation physics, and the capabilities of software tools.
Learning Objective: Evaluate the abstraction gap between software-based fault injection and physical hardware fault mechanisms.
Explain why killing a rank mid-collective, partitioning a node from the rendezvous service, and corrupting one checkpoint shard are more valuable fleet-recovery experiments than tensor bit flips alone.
Answer: Each experiment exercises a recovery decision rather than only a corrupted value. Killing a rank or delaying its heartbeat tests whether detection timeouts fire and the worker group is rebuilt; partitioning a node from rendezvous tests whether membership and fencing stop the old owner from writing; corrupting a shard tests whether restore rejects a generation whose manifest digests do not match. A tensor bit flip tests how software responds to a wrong value, but it does not show that the detector fires before the protected commit or that recovery stays within its lost-work and recovery-time bounds.
Learning Objective: Design fault-injection experiments that exercise recovery decisions at the level where they are made.
Software-based fault injection frameworks are universally preferred over FPGA-based injection for production resilience certification because software tools capture register-level gate timing violations and physical alpha-particle strikes with higher fidelity.
Answer: False. Software injection trades physical fidelity for scale and controllable experiments. FPGA-based injection can expose lower-level state in the implemented design, while beam testing probes the actual device under physical radiation. Neither an FPGA implementation nor a tensor-level simulation automatically reproduces every timing, packaging, or fault-propagation behavior of production silicon.
Learning Objective: Compare the fidelity and scalability trade-offs between hardware-based and software-based fault injection methodologies.
Explain how fault-injection frameworks such as Fidelity bridge the abstraction gap between low-level hardware faults and high-level software models.
Answer: Such frameworks model how lower-level faults in registers, memory and numerical units become software-visible errors, then use that mapping to guide scalable software injection. The mapping narrows the abstraction gap; its fidelity depends on the modeled hardware, fault distribution and calibration. It does not automatically establish coverage of every production fault.
Learning Objective: Analyze how bridging frameworks map microarchitectural hardware faults to software-level tensor perturbations.
Self-Check: Answer
Why does Google’s TPUv4 recovery design combine OCS-based replacement of unhealthy cubes with fault-tolerant routing for supported link-outage patterns?
- Because TPU chips have zero local memory and cannot execute software routing algorithms.
- Because optical circuit switches are cheaper than standard copper Ethernet cables for intra-rack links.
- A machine outage can remove a required job participant, requiring a healthy replacement cube; a link outage can instead require a supported alternate communication path. The response must preserve the job’s communication topology.
- Because OCS switches completely eliminate the need for checkpointing during multi-month training jobs.
Answer: The correct answer is C. OCS allows the recovery system to assemble job-sized slices from healthy spare cubes after machine outages. Fault-tolerant routing handles supported OCS outage patterns when alternate paths remain available. Replacing a participant and repairing a communication path are distinct responses; neither follows from the failed-device count alone. The other choices misrepresent memory architecture or economics, or incorrectly eliminate checkpointing.
Learning Objective: Analyze how optical circuit switching enables topology-preserving fault tolerance in tightly coupled accelerator pods.
During the training of Meta’s OPT-175B model on 992 A100 GPUs, describe how the team addressed both physical hardware failures and mathematical loss spikes.
Answer: For physical hardware failures (at least 35 manual and an estimated 70+ automatic restarts over two months from ECC memory errors, network issues, and lost GPUs), the team relied on restart from the latest checkpoint, with train-log freshness monitoring (a 15-minute threshold, later relaxed to one hour) contributing to detection delay; polling and response could extend the idle window. For mathematical loss spikes (numerical divergence and gradient overflow), the team rolled back to an earlier clean checkpoint and resumed with a reduced learning rate (ultimately roughly two-thirds of GPT-3’s rate). The two remedies differ, which is why the run had to retain checkpoint history rather than only its newest snapshot.
Learning Objective: Compare physical hardware fault recovery and algorithmic numerical divergence recovery in large-scale LLM training.
What fundamental principle of ML serving resilience is demonstrated by Netflix’s chaos engineering practice?
- Resilience is an active practice of continuous verification: intentionally injecting latency, terminating feature caches, and simulating dependency outages under controlled conditions to empirically verify that fallback hierarchies function before real outages occur.
- Fault tolerance code should only be executed during unplanned production disasters to minimize server load.
- Machine learning models should never rely on external feature stores or databases.
- Chaos testing is only applicable to CPU-based web servers and cannot be used in GPU inference clusters.
Answer: The correct answer is A. Netflix’s chaos engineering principles establish that fault tolerance mechanisms (such as model fallbacks, circuit breakers, and feature defaults) rot if left unexercised. Regularly injecting synthetic faults in production and staging verifies that fallback paths actually satisfy latency and availability SLOs when real dependencies fail. The other options contradict chaos engineering principles or assert false restrictions on ML systems.
Learning Objective: Evaluate the role of chaos engineering and active failure injection in validating ML serving fallback paths.
Google’s TPUv4 study reports daily failure rates of 0.08 percent of TPU machines, 0.005 percent of ICI cables, and 0.04 percent of OCS units. Explain why such small daily fractions still require an automated reconfiguration control plane rather than manual repair.
Answer: Small daily fractions multiply across thousands of machines, cables, and switches, so the pod meets a steady stream of failures rather than an occasional emergency. Each failure can interrupt a job that needs its slice’s full communication topology, so the response must assemble a healthy slice from spare cubes or route around a failed link quickly and repeatedly. Health monitoring and topology software that run this loop automatically keep availability high; a manual repair process would leave jobs waiting for every routine event.
Learning Objective: Analyze how fleet-scale failure statistics justify automated topology reconfiguration.
Self-Check: Answer
An engineering team operates a 1,000-GPU training cluster with a system MTBF of 50 hours (\(3{,}000\text{ minutes}\)) and a checkpoint write time of 5 minutes. The team intuitively chooses to checkpoint ‘every 15 minutes to stay safe.’ According to the Young-Daly formula, what is the mathematically optimal interval, and what is the consequence of the team’s intuitive choice?
- Optimal interval is 15 minutes; the intuitive choice is mathematically perfect.
- The first-order optimum is approximately 173 minutes (~2.9 hours); writing every 15 minutes adds more checkpoint overhead than it saves in expected rework under this model.
- Optimal interval is 50 hours; checkpointing every 15 minutes causes disk sectors to wear out in days.
- Optimal interval is 1 minute; checkpointing every 15 minutes risks losing 100% of the training dataset.
Answer: The correct answer is B. Applying the Young-Daly formula: \(\tau_{\text{opt}} = \sqrt{2 \cdot T_{\text{write}} \cdot \text{MTBF}_{\text{system}}} = \sqrt{2 \times 5 \times 3000} = \sqrt{30{,}000} \approx 173.2\text{ minutes}\) (approx. 2.9 hours). Setting an interval of 15 minutes deviates by more than an order of magnitude, spending massive cluster time on unnecessary storage writes. The 15-minute, 50-hour, and 1-minute options misapply the square-root law or make exaggerated failure claims. A stricter recovery point objective can justify a shorter interval even when it increases expected waste.
Learning Objective: Calculate Young-Daly optimal intervals to demonstrate why intuition-based checkpoint scheduling causes excessive I/O overhead.
Explain what a GPU-only independent-failure estimate, \(\mathrm{MTBF}_{\mathrm{system}}=\mathrm{MTBF}_{\mathrm{component}}/N\), omits about shared failure domains and their recovery consequences.
Answer: The independent-component formula omits separate shared failure modes such as power or switch outages, and it says nothing about their blast radius. Add those fault domains and their recovery consequences explicitly. Correlation alone does not necessarily increase the count of distinct incidents for fixed marginal component rates; a shared outage can group many component failures into one large event.
Learning Objective: Justify why independent component reliability models fail to capture the risk and blast radius of correlated infrastructure failures.
Why does adding more GPUs (\(N\)) to a distributed training job eventually encounter a ‘reliability ceiling’ where total wall-clock training time increases rather than decreases?
- Because GPUs consume more electrical power than data center transformers can supply.
- Because floating-point numbers lose precision when divided across more than 1,000 workers.
- Because the Python interpreter cannot spawn more than 512 concurrent threads.
- Because aggregate cluster failure rate scales linearly (\(N\lambda\)), shrinking system MTBF until the cumulative time lost to failure detection, job restarts, checkpoint loading, and rework exceeds the marginal compute speedup of additional parallelism.
Answer: The correct answer is D. Under independent failures, adding workers increases the aggregate failure rate. Recovery and replay can eventually cost more than the marginal compute speedup, and this reliability ceiling applies on top of the Amdahl ceiling. Whole-run useful goodput must count only retained progress and include recovery time in the denominator, so its reliability penalty grows with the number of workers.
Learning Objective: Evaluate the reliability ceiling where aggregate cluster failure overhead outpaces parallel compute scaling.
Because modern accelerator hardware incorporates hardware ECC on High Bandwidth Memory and CRC on interconnects, application-level gradient checksums and loss validation checks are redundant and unnecessary in 10,000-GPU clusters.
Answer: False. ECC and CRC protect the error patterns covered by their implementations within storage and transport boundaries. They do not validate arbitrary arithmetic or software transformations. Checksums test byte integrity or agreement, while replay, independent computation, invariants and statistical checks provide different evidence about computed results. Coverage must match the declared fault model; no single check establishes end-to-end correctness.
Learning Objective: Evaluate the limitations of hardware ECC and justify the necessity of end-to-end software verification against silent data corruption.